cellular/molecular fgf-1triggerspannexin ... · cellular/molecular...
TRANSCRIPT
Cellular/Molecular
FGF-1 Triggers Pannexin-1 Hemichannel Opening in SpinalAstrocytes of Rodents and Promotes InflammatoryResponses in Acute Spinal Cord Slices
Juan Mauricio Garre,1,2 Guang Yang,1 X Feliksas F. Bukauskas,2,3 and Michael V. L. Bennett2
1Department of Anesthesiology, Perioperative Care and Pain Medicine, New York University School of Medicine, New York, New York 10016, 2Dominick P.Purpura, Department of Neuroscience, Albert Einstein College of Medicine, Bronx, New York 10461, and 3Institute of Cardiology, Lithuanian University ofHealth Sciences, Kaunas LT-50161, Lithuania
We show here that the growth factor FGF-1 is proinflammatory in the spinal cord and explore the inflammatory mechanisms. FGF-1applied to rat spinal astrocytes in culture initiates calcium signaling and induces secretion of ATP that within minutes increases mem-brane permeability to ethidium (Etd �) and Ca 2� by activating P2X7 receptors (P2X7Rs) that open pannexin hemichannels (Px1 HCs) thatrelease further ATP; by 7 h treatment, connexin 43 hemichannels (Cx43 HCs) are also opened. In acute mouse spinal cord slices ex vivo,we found that FGF-1 treatment for 1 h increases the percentage of GFAP-positive astrocytes that show enhanced Px1 HC-mediated Etd �
uptake. This response to FGF-1 was not observed in astrocytes in slices of cerebral cortex. FGF-1-induced dye uptake by astrocytes isprevented by BAPTA-AM or a phospholipase C (PLC) inhibitor. Furthermore, in spinal cord slices, P2X7R antagonists (BBG and A740003)and Px1 HC blockers (10Panx1 and carbenoxolone) prevent the increase in Etd � uptake by astrocytes, whereas Gap19, a selective Cx43 HCblocker, has no effect on dye uptake at this time. Microglia are not required for the increase in Etd � uptake by astrocytes induced byFGF-1, although they are activated by FGF-1 treatment. The morphological signs of microglia activation are inhibited by P2X7R antago-nists and 10Panx1 and are associated with elevated levels of proinflammatory cytokines in cord slices treated with FGF-1. The FGF-1initiated cascade may play an important role in spinal cord inflammation in vivo.
Key words: astrocyte; fibroblast growth factor; glia; inflammation; microglia; spinal cord
IntroductionFibroblast growth factor-1 (FGF-1) and FGF receptors are widelyexpressed in the CNS (Reuss and von Bohlen und Halbach,
2003). In cerebral cortex, FGF signaling maintains astrocytes inan unreactive state and reduces activation after a stab wound(Kang et al., 2014). In contrast, FGF-2, which also acts on FGFreceptors, is associated with inflammatory changes in spinal cordand neuropathic pain (Ji et al., 2013). Furthermore, FGF-1 can
Received Nov. 20, 2015; revised March 12, 2016; accepted March 16, 2016.Author contributions: J.M.G., G.Y., F.F.B., and M.V.L.B. designed research; J.M.G. performed research; J.M.G.,
G.Y., F.F.B., and M.V.L.B. analyzed data; J.M.G., G.Y., F.F.B., and M.V.L.B. wrote the paper.This work was supported by National Institutes of Health Grants NS45287 and NS55363 to M.V.L.B. and
NS072238 to F.F.B., National Institutes of Health Grants GM107469 and AG048410 to G.Y., and Research Council ofLithuania MIP-76/2015 to F.F.B. We thank Dr. Angela Bukauskiene, Fabrizio Pontarelli, and Dr. Helmuth Sanchez(Department of Neuroscience, Albert Einstein College of Medicine, Bronx, New York) for technical assistance with thecell cultures; and members of Maarten Reith’s laboratory (Department of Psychiatry, New York University, New York)and Dr. Esperanza Recio-Pinto and Dr. Alexandra Sideris in Thomas Blanck’s laboratory (Department of Anesthesi-ology, Perioperative Care and Pain Medicine, New York University, New York) for assistance in the preparation ofspinal cord slices.
The authors declare no competing financial interests.Correspondence should be addressed to either of the following: Dr. Juan Mauricio Garre, Department of Anes-
thesiology, Perioperative Care and Pain Medicine, New York University School of Medicine, 450 East 29th Street,Lab-843F, New York, NY 10016, E-mail: [email protected] or [email protected]; or Dr. Michael V.L.Bennett, Dominick P. Purpura, Department of Neuroscience, Albert Einstein College of Medicine, 1300 Morris ParkAve., Room 718, Bronx, NY 10461. E-mail: [email protected].
DOI:10.1523/JNEUROSCI.4195-15.2016Copyright © 2016 the authors 0270-6474/16/364785-17$15.00/0
Significance Statement
We find that FGF-1 elevates [Ca 2�]i in spinal astrocytes, which causes vesicular release of ATP and activation of P2X7Rs to triggeropening of Px1 HCs, which release further ATP. This regenerative response occurs in astrocyte cultures and in acute spinal cordslices. In the latter, FGF-1 application promotes the activation of microglia and increases the production of proinflammatorycytokines through mechanisms depending on P2X7 receptors and Px1 HCs. This proinflammatory microenvironment may favorrecruitment of leukocytes into the spinal cord and impacts negatively on neuronal structure and function in vivo. Any step in theseprocesses provides a potential therapeutic target for treatment of secondary damage in various spinal cord pathologies.
The Journal of Neuroscience, April 27, 2016 • 36(17):4785– 4801 • 4785
activate spinal cord astrocytes in culture and increase the produc-tion of neurotoxic factors (Cassina et al., 2005). Also, FGF-1 en-hances cytokine production in human cortical astrocytes andmicroglia primed with interferon � (IFN�) or lipopolysaccharide(LPS) � IFN� (Lee et al., 2011). Whether FGF-1 is proinflamma-tory in spinal cord by activating astrocytes or microglia isunknown.
Astrocytes show regenerative responses that involve increasedcytoplasmic free calcium, [Ca 2�]i (Cornell-Bell et al., 1990; Ne-dergaard, 1994; Hassinger et al., 1996; Guthrie et al., 1999). Risesin [Ca 2�]i can be initiated by external ligands, such as ATP, thatopen Ca 2�-permeable channels in the surface membrane and byCa 2�-evoked and IP3R-mediated Ca 2� release from intracellularstores. Gap junctions allow IP3 to diffuse between contactingastrocytes, thereby propagating calcium waves by an intracellularpath (Charles et al., 1991; Venance et al., 1997). Both of thesemechanisms can contribute to propagation of calcium waves inastrocytes (Scemes and Giaume, 2006). There is accumulatingevidence that diverse compartmentalized Ca 2� signals in astro-cytes underlie different physiological and pathological processesin vitro and in vivo (Khakh and Sofroniew, 2015).
Connexin-based gap junction (GJ) channels are formed bytwo hemichannels (HCs), one contributed by each apposed cell.HCs in surface membrane, but not docked with an HC in anapposed membrane, may open, particularly in media containinga low concentration of divalent cations (Contreras et al., 2002). Invertebrates, endogenous pannexins also form HCs but have notbeen shown to form gap junctions, although exogenous pannex-ins appear do so in Xenopus oocytes, HeLa cells, and two other celllines (Bruzzone et al., 2003, 2005; Lai et al., 2007; Sahu et al.,2014). Opening of Cx43 HCs can increase [Ca 2�]i in astrocytesby allowing calcium influx (Bennett et al., 2003) or by allowingrelease of ATP (Kang et al., 2008), which activates purinergicreceptors that in turn open pannexin 1 (Px1) HCs (Locovei et al.,2006) that permit further Ca 2� entry and ATP efflux. Spinalastrocytes can form HCs of Cx43 or Px1. Cultured spinal astro-cytes treated with FGF-1 release ATP from vesicles, which acti-vates P2X7Rs that open Px1 HCs within 2 h and Cx43 HCs within7 h (Garre et al., 2010). Furthermore, FGFRs activate phospho-lipase C� (PLC�), which hydrolyzes PIP2 to form IP3 that en-hances release of Ca 2� from ER (Reuss and von Bohlen undHalbach, 2003; Bunney et al., 2012). Thus, PLC� is a potentiallink between activation of FGF receptors in surface membraneand mobilization of Ca 2� from intracellular stores, a processleading to vesicular ATP release, activation of P2X7Rs, opening ofPx1 HCs, and self-sustaining ATP release. FGF-1-induced releaseof ATP from spinal astrocytes may stimulate microglia becausethese cells continuously monitor extracellular space for rise inATP levels and CNS damage (Davalos et al., 2005).
We report here that, in cultured spinal astrocytes, FGF-1 ap-plication rapidly increases permeability to Etd� through activa-tion of P2X7Rs and Px1 HCs, processes that depend on PLCactivation and rise in [Ca 2�]i. FGF-1 also activates P2X7Rs andPx1 HCs of astrocytes in acute slices of spinal cord, but not ofcortex. In spinal cord slices depleted of microglia, FGF-1 stillactivates P2X7Rs and opens Px1 HCs of astrocytes, suggestingdirect FGF-1 action. These responses of spinal astrocytes toFGF-1 in spinal cord sustain ATP release and favor a proinflam-matory environment that promotes microglial activation and in-crease in cytokine production. The cascade described here in vitromay play an important role in spinal cord inflammation andneurodegeneration in vivo.
Materials and MethodsAnimals. Rat pups (postnatal day 1) or anesthetized 1-month-old mice ofeither sex were decapitated before the removal of spinal cord and cerebralcortex for culture or slice preparation. Experimental procedures per-formed in cell cultures were approved by the Institutional Animal Careand Use Committee of the Albert Einstein College of Medicine (protocol#20110809) and for adult mouse tissue collection were approved by theInstitutional Animal Care and Use Committee of the New York Univer-sity School of Medicine (protocol #140807-01).
Materials. Culture medium and serum were from Gibco BRL. FGF-1and all other reagents were from Sigma unless otherwise specified.
Cell cultures. Astrocytes from spinal cords of 1-d-old rat pups (P1)were prepared and cultured as described by Cassina et al. (2005). Briefly,rat spinal cords were removed from P1 pups, and tissue was dissociatedby treating it for 25 min with 0.001% tripsin-0.0002% EDTA solution inPBS (stock: 0.25% trypsin and 0.1% EDTA, Invitrogen) and subsequentmechanical dissociation in maintenance medium composed of DMEMsupplemented with 10% FBS, penicillin (100 IU/ml), and streptomycin(100 �g/ml). For mouse spinal cords, trypsin was not added and tissuewas dissociated mechanically in maintenance medium. Cells were plated(at 2.0 � 10 4 cells/cm 2) on 12 mm glass coverslips or on 60 mm plasticculture dishes and kept in DMEM supplemented with 10% FBS, penicil-lin (100 IU/ml), and streptomycin (100 �g/ml). Cultures were grown at37°C in a humidified atmosphere of 5% CO2. Astrocyte cultures in con-fluent monolayers were �98% pure as determined by their GFAP immu-noreactivity, and there were no cells positive for Cd11b, a marker for cellsof myeloid lineage used to stain microglial cells in the CNS.
HeLa cells stably expressing either Cx43-CFP or Px1-YFP were seededtogether with HeLa parental cells 2 d before experiments. Mixed cultureswere treated with 10Panx1 (100 �M) or Gap19 (100 �M) for 0.5–1 h. Bothblockers were also maintained during Etd � uptake recordings.
Drugs and solutions. Solution compositions (in mM) are as follows:Tyrode’s, NaCl (140), KCl (4), CaCl2 (1.8), MgCl2 (1), glucose (5), Napyruvate (2), HEPES (5), pH 7.4; Hanks, NaCl (137), KCl (5), CaCl2(1.8), MgCl2 (0.95), KH2PO4 (0.4), MgSO4 (0.4), NaHCO3 (4),NaH2PO4 (0.3), glucose (5), pH 7.4. Artificial CSF (ACSF) used for slices(in mM) as follows: NaCl (119), KCl (2.5), D-glucose (11), NaH2PO4 (1),CaCl2 (2.5), MgCl2 (1.3), NaHCO3 (26). Hanks solution and ACSF werebubbled with O2 (95%), CO2 (5%).
The ethidium bromide (EtdBr) used for dye uptake experiments wasprepared from a 1 mM stock solution and applied to cells at 1–10 �M.Heptanol (0.4 –1 mM), carbenoxolone (200 �M), Brillant Blue G (BBG;1–100 �M), and Reactive Blue 2 (RB2; 1–100 �M) were applied to the cellsor slices. The competitive antagonist of P2X7 receptors, A740003 (SantaCruz Biotechnology), was dissolved in DMSO and diluted to the finalconcentration of 1–100 �M. Apyrase (APY; Sigma) from potato was dis-solved in PBS or ACSF at 2 U/ml and diluted to the final concentration of2 mU/ml. The PLC blocker, U73122 (Sigma), was dissolved in DMSO asa 1 mM stock solution. The same procedure was used for preparing astock solution of U73343. For experiments in spinal cord slices, we alsoused the selective blockers of Px1 HC and Cx43 HCs, 10Panx1 and Gap19(Tocris Bioscience) peptides, respectively. These blockers or their scram-bled sequences were dissolved in ACSF at 1 mM stock solution and di-luted to a final concentration of 100 �M.
Cell treatments with FGF-1. Because heparin sulfate proteoglycans sta-bilize the interaction of FGFs with FGFRs, FGF-1 (Sigma) was preparedas a 10 �g/ml stock solution in PBS and then diluted 10� in 5000 IU/mlheparin (Brown et al., 1995). FGF-1 stock solutions were freshly prepared�1 h before each experiment. For treatments �1 h, confluent astrocytecultures were washed 3 times in Tyrode’s solution containing 5 �M Etd �
and control vehicle (heparin 50 IU/ml). Then, cells were imaged for 5min to measure the basal Etd � uptake rate. Thereafter, FGF-1 (10 ng/ml)and heparin (50 IU/ml) were applied in Tyrode’s solution. For FGF-1treatments �1 h, the maintenance medium was replaced by DMEMcontaining 1% horse serum. Under these conditions, cells were incu-bated with FGF-1 for different time periods at 37°C in a humidifiedatmosphere of 5% CO2. Heparin alone had no effect on dye uptake(evaluated as fluorescence intensity in arbitrary units [AU]) of astrocytes
4786 • J. Neurosci., April 27, 2016 • 36(17):4785– 4801 Garre et al. • FGF-1, Pannexin-1, and Inflammation in Spinal Cord
maintained under basal conditions (i.e., incubated in Tyrode’s solutionor DMEM with 1% FBS; p � 0.05).
Ethidium permeability assays. Ethidium uptake was measured by fluo-rescence of Etd � when it bound to double-stranded oligonucleotides incells cultured under control conditions and after treatment with FGF-1.For time course measurements of Etd � uptake, control and treated cul-tures were washed with Tyrode’s solution containing 5 �M EtdBr at roomtemperature for 3–5 min, a time interval that was long enough for the rateof Etd � fluorescence increase to reach a steady state. Then, the cells weremounted on the stage of a fluorescence microscope for time lapse imag-ing (Olympus BMX51). Images were captured by a digital camera (Orca-ER, Hamamatsu) controlled by imaging software (Imaging Suite, version5.5, PerkinElmer) every 1 min (exposure time � 0.7 s; excitation andemission wavelengths were 528 nm 598 nm, respectively). The fluores-cence intensity was defined as F � Fbackground. The mean slope of therelationship (F � Fbackground) over a given time interval (�F/�T; Fback-
ground remained constant over the time of recording) represents the rateof Etd � uptake in control and in FGF-1-treated astrocytes. The rates ofBzATP and FGF-1-induced uptake in single cells were correlated with thebasal rates in those same cells (see Fig. 4 I, J ), and the rates of inducedEtd � uptake were normalized to the basal rates. For treatments �1 h, notall cells in a given preparation responded; and when evaluating the pop-ulation response, we considered a cell to respond if the rate of uptake rateincreased by �30% of the basal rate for that cell. For FGF treatments �1h, the fluorescence intensity was averaged for the same 8 –10 cells in eachimage and plotted in arbitrary units versus time. Microscope and camerasettings remained the same in any series of measurements in which com-parisons were made. To illustrate the rates of Etd � uptake in controlversus FGF-1-treated cells, plots of fluorescence intensity versus time insingle cells were set at the same fluorescence, 1 AU, at T � 0 s. Allpreparations were exposed to Etd � for the same length of time beforeuptake measurement. Over the time course of our experiments (�40min), we observed no saturation of Etd � uptake. We found no differencein fluorescence intensity over time when images were acquired at 6 srather than 1 min intervals, indicating that there was no significantbleaching.
Small interfering RNA against Px1 (siRNA Px1). Astrocyte cultureswere treated with 0.2 �M of siRNA Px1 targeting rat Px1 mRNA. We used2 sequences of Stealth siRNA duplex oligoribonucleotides from Invitro-gen: AUG AGC UUG CAC UGG AAG CUA UCG G and/or GAG CUCAAA UCG UAC AAG UGU CUU A. For control, we used the Invitrogennontargeting siRNA, siRNA(�). For transfection, confluent cultures(90%) were treated overnight with siRNA Px1 mixed with 10 �l/mlLipofectamine reagent (Invitrogen). Transfection reagents were re-moved and cells incubated for 4 – 6 h in DMEM medium (2% FBS)before treatment with FGF-1.
Calcium imaging. For calcium imaging, astrocytes were seeded in Mat-Tek dishes 2–3 d before use. Cells were loaded for 30 – 40 min at 37°Cwith 5 �M fura-2 AM in Tyrode’s solution, washed, and incubated atroom temperature for 5 min before the recordings. The dishes weremounted on the stage of a microscope (Olympus-IX70) equipped withthe UltraView imaging system. Fluorescence images were acquired every10 or 20 s, and [Ca 2�]i was evaluated as the ratio of light (520 nm)emitted at two excitation wavelengths (340 and 380 nm). In each exper-iment, 10 –15 cells were imaged and background subtracted. Oscilla-tions have been described in astrocytes in culture as well as in slices(Tashiro et al., 2002; Morita et al., 2003), but with faster onset and offsetthan our 0.05– 0.1 Hz sampling frequency. We performed a few experi-ments acquiring images at 0.5–1 Hz. Oscillations with a period of 100 sand rise and fall time of 10 –20 s appeared in cultured spinal astrocytes ata very low incidence (�10%) and were not affected by FGF-1 (data notshown). [Ca 2�]i was measured before and after FGF-1 or ATP treat-ments. Calcium elevations after treatment with FGF-1 and ATP weremeasured both at the initial peak, defined as the maximum 340/380fura-2 fluorescence ratio after the treatment, and usually reached with 3min of FGF-1 treatment and less after ATP treatment, and at the plateauor steady-state phase, in which [Ca 2�]i has a nearly constant value thatpersists while ATP or FGF-1 is in the bath. The plateau phase was mea-sured after 10 or 15 min treatment, which is more than twice the � of the
exponential decay from the peak value. Fura-2 is useful between 10 nM
and 1 �M, but we did not calibrate the 340/380 fluorescence ratios(Scemes et al., 2000). We recorded baseline ratio values from 0.05 to 0.2with mean of 0.15 0.03. In quantification of the calcium responses toFGF-1 and ATP, we normalized the value of each response to its ownpretreatment baseline (see Figs. 1, 2).
Acute spinal cord and brain slices. One- to two-month-old mice inwhich one copy of chemokine receptor CX3CR1 gene was replaced by agene encoding EGFP (https://www.jax.org/strain/008451) (Jung et al.,2000) were used to prepare acute spinal cord and cortical slices. In thesemice, EGFP is expressed in microglia but not in other glial cells or inneurons (Jung et al., 2000). Other mice used to examine the role ofmicroglia are explained below.
To prepare acute slices, mice were anesthetized using intraperitonealinjection of ketamine (100 mg/kg)/xylazine (15 mg/kg) and perfusedthrough the left ventricle with iced-cold ACSF saturated with 95%O2/5% CO2. After perfusion, animals were decapitated and cerebral cor-tex or spinal cord was rapidly dissected. Spinal cords were embedded in4% low melting point agarose before sectioning. Cortical coronal sec-tions and spinal cross sections were made in ice-cold ACSF (95% O2/5%CO2) with a Leica vibratome (VT 1000 S). Slices were allowed to recoverfor 1 h at 35°C in saturated 95% O2/5% CO2 ACSF. Slices were stirredwith 4 ml of an ASCF solution containing 10 ng/ml FGF-1 and heparin(50 IU/ml) or heparin alone, and every 15 min washed with fresh ACSFsolution of the same composition for 1 h. In different experiments,U73122 (4 �M), BAPTA-AM (1 �M), 10Panx1 or scrambled peptide (100�M, Tocris Bioscience, batch 5B or 5A, respectively), Gap19 (100 �M,Tocris Bioscience, batch 1A), BBG (0.1–100 �M), A740003 (0.1–100 �M),and RB2 (0.1–100 �M) were added to the ACSF solution containingFGF-1 and heparin or heparin alone. Blockers were applied in ASCF 10min before FGF-1 and heparin or heparin alone were added. After appli-cation for 1 h of FGF-1 and heparin or heparin alone without or withblockers, Etd � uptake was measured over 10 min by adding 5 �M EtdBrin saturated 95% O2/5% CO2. To remove unbound Etd �, slices wererinsed 3 times with PBS before fixing them for 2 h at room temperature orovernight at 4°C with 4% PFA in PBS. Etd � labeling was stable to fixationand permeabilization for 1 week, and comparisons were made betweenslices treated in the same ways with and without FGF-1 1–2 d after label-ing with EtdBr.
For immunostaining of GFAP, Etd �-labeled slices were first perme-abilized in Triton X-100 (1% in PBS) for 3 h and blocked with a solutioncontaining 5% donkey serum, 0.5% BSA, and 0.1% Triton X-100 in PBSfor 0.5 h. Slices were incubated for 1 h with chicken anti-GFAP (Milli-pore, lot #2571241) and then incubated 1 h with goat anti-chicken con-jugated Alexa-647 (Abcam). To confirm that CX3CR1 cells express amicroglia marker, slices prepared from CX3CR1 EGFP mice were stainedwith rabbit anti-Iba1 (Wako) and anti-rabbit conjugated Alexa-647(eBioscience). Slices were mounted in Mowiol 4 – 88. Images were takenwith a Zeiss 710 confocal microscope equipped with 20� or 40� (oil-immersion) objectives and appropriate filters.
F was measured at the soma for single cells expressing CX3CR1 orGFAP. Cells were identified in the 3D images generated through z-axisprojection (z-stack). For individual slices, Etd � fluorescence was cali-brated in an 8-bit scale, ranging from Fbackground � 0 to Fmax � 255 AU.Fbackground was measured in blood vessel areas; Fmax was taken at thebrightest region in the projection. We constructed distribution histo-grams of the Etd � uptake in astrocytes (75 30 AU, mean SD, n � 300cells) and quantified the fraction of astrocytes with Etd � fluorescence�105 AU (mean SD). We refer to this population of cells as high Etd �
astrocytes. The frequency of astrocytes showing low to medium uptake(�105 AU) and high Etd � uptake (�105 AU) in FGF-1-treated andcontrol slices was significantly different ( p � 0.0001, � 2 test, 1 dF). Toquantify the maximal capacity of Etd � accumulation by the cell, weincubated slices overnight with EtdBr after tissue was fixed in 4% PFAand permeabilized (1% Triton X-100). Mean Etd � fluorescence mea-sured from different types of cell in the slices was 170 30 AU (mean SD, n � 300 cells, 3 slices).
To quantify the morphological signs of microglial activation afterFGF-1 treatment, the total area of CX3CR1 � cells in the z-projection was
Garre et al. • FGF-1, Pannexin-1, and Inflammation in Spinal Cord J. Neurosci., April 27, 2016 • 36(17):4785– 4801 • 4787
calculated in a binary image (in a 300 �m slice, with z � 0 starting 30 �mbelow the slice surface and extending 70 �m deeper) using ImageJ soft-ware. The binary image was set at a threshold of 1.2� Fbackground, whichwas determined in a region without cells (e.g., inside of a blood vessel).The area occupied by the microglia images was expressed as a percentageof the total area examined.
Microglia depletion experiments. CX3CR1 CreER/CreER mice were kindlyprovided to us by Dr. Wenbiao Gan (New York University) and crossedwith mice harboring the Rosa26 iDTR/iDTR alleles (R26 iDTR/iDTR; https://www.jax.org/strain/007900; The Jackson Laboratory) (Buch et al., 2005).In Rosa26 iDTR/iDTR mice, the open reading frame for the diphtheriatoxin receptor (DTR) and an upstream lox-P flanked stop cassette se-quence are inserted in the Rosa26 locus, which is ubiquitously expressedin mouse tissues. Heterozygous F1 mice with genotype CX3CR1 CreER/�,R26 iDTR/� were used for experiments. To activate Cre-mediated recom-bination of DTR specifically in microglia, CX3CR1 CreER/�: R26 iDTR/�
adult mice were given 0.35 mg of tamoxifen/g/d for 3 d. To inducemicroglia depletion, DTRs were activated by intraperitoneal administra-tion of 1 �g of diphtheria toxin (DT)/d for 3 d, 20 –30 d after tamoxifentreatment (Parkhurst et al., 2013). CX3CR1 CreER/� mice without theR26 iDTR/� allele were also treated with tamoxifen and DT as explainedabove and used as controls. Depletion of microglia was confirmed byimmunostaining for Iba1.
ELISA. Mice were deeply anesthetized and perfused with 25 ml ofCa 2�/Mg 2�-free ice-cold ACSF to remove remaining blood. Spinal cordslices were prepared and maintained in ASCF as described above for aperiod not longer than 2 h. Ten to 15 slices per experimental condition(0.5–1 mg of tissue protein) were harvested and disrupted by sonica-tion in NP-40 lysis buffer (50 mM Tris, pH 7.4, 150 mM NaCl, 1% NP-40,0.1% Triton X-100, and 0.1% SDS). The homogenized material was cen-trifuged at 20,000 � g for 15 min, and the cleared supernatant was col-lected for analysis. Total protein levels in CNS homogenates weredetermined by BCA assay (Pierce). IL-1�, IL-6, and TNF� protein levelswere measured using the Mouse Platinum ELISA kit (eBioscience). Sam-ples were processed according to the manufacturer’s instructions.
Statistics. Data are presented as mean SE; n values are the number ofindependent experiments, culture dishes, or slices from at least 3 animals,or number of animals used. Depending on the procedure, means for10 –15 cells were determined for each experiment in cultures, and 50 –100 cells for each experiment in slices. Means for each group were com-pared using the nonparametric Mann–Whitney U test. A � 2 test was alsoused for data shown in Figure 6 as indicated. Differences were consideredsignificant at p � 0.05. Statistics were calculated using Graph Pad Prism6 (2014) software. Figures were prepared using excel, Sigma Plot 2010,and Adobe Illustrator CC.
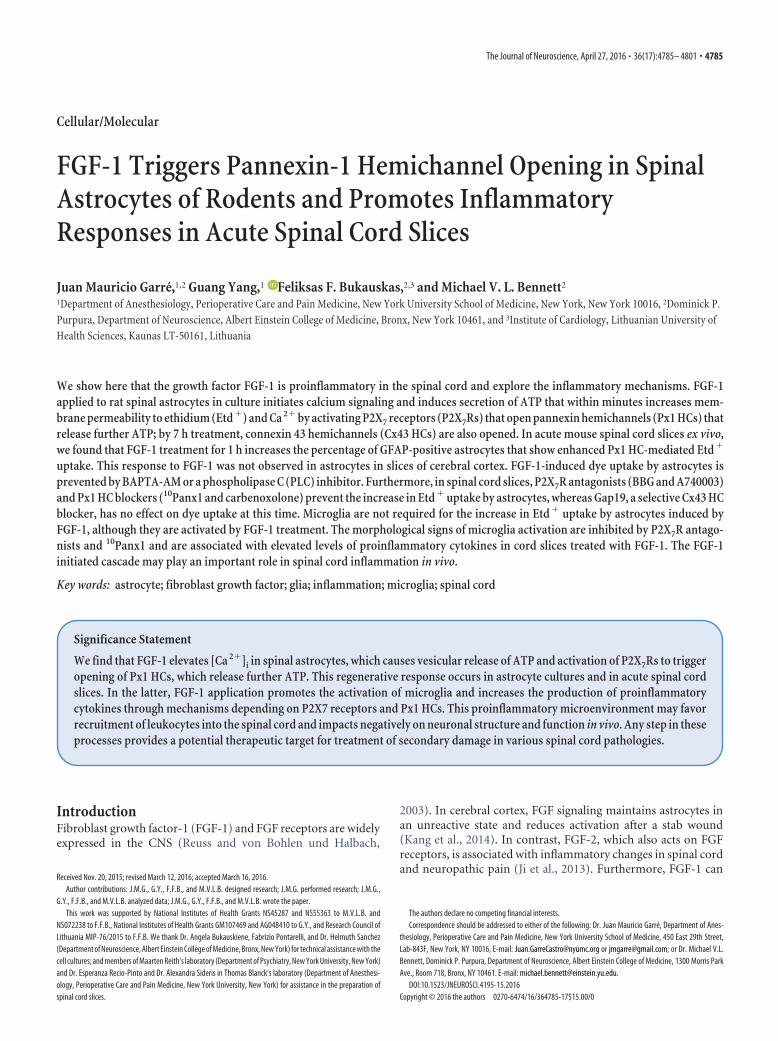
ResultsFGF-1 increases intracellular calcium concentration incultured spinal astrocytesApplication of FGF-1 with heparin increased [Ca 2�]i in spinalastrocytes in culture (single representative cells in Fig. 1A–D,
10 –15 cells in each of 4 cultures for each experiment in Fig. 1E).The initial increase in [Ca 2�]i, measured as the ratio of 340 nm/380 nm emission (R, normalized to the basal level), reached amaximum value at 2.13 0.15 times basal in �5 min (p � 0.001,n � 4; Fig. 1A,E). Over the next 5 min, [Ca 2�]i decayed to aplateau phase of 1.40 0.05 times basal (p � 0.05 vs basal, n �4). The response to FGF-1 was not uniform across the culturedcells; [Ca 2�]i was elevated transiently in 80 17% of the cells anddecayed to a plateau in 40.0 9.0% of responding cells; in theother responding cells, [Ca 2�]i decayed to the baseline. In Figure1E, plotted plateau values were from the responding cells. Thecultures in these experiments were at low density. Thus, at leastthe early rises in [Ca 2�]i were not a result of Ca 2� spread betweencells via gap junctions. Also, FGF-1 reduces coupling betweenastrocytes (Garre et al., 2010). After 7 h FGF-1 treatment, record-ing for 5 min after washout of FGF-1 showed that [Ca 2�]i wasstill elevated (see Fig. 5D), suggesting that the early plateau (�1 hFGF-1 treatment) can persist for relatively long times in culturesof spinal astrocytes.
In the presence of APY (2 mU/ml), the peak of FGF-1-inducedincrease in [Ca 2�]i was 1.85 0.11 times basal (p � 0.05 vsFGF-1 alone, n � 4), and the plateau level [Ca 2�]i was not sig-nificantly different from basal (p � 0.05, n � 4) but was differentfrom the plateau phase induced by FGF-1 alone (p � 0.05 vsFGF-1). These data suggest that FGF-1-induced secretion of ATPcontributes to the plateau phase by an autocrine/paracrine actionof ATP (Fig. 1B,E). Pretreatment of astrocytes with 200 �M car-benoxolone (CBX) or knockdown of Px1 expression with siRNA(siRNA Px1; Fig. 1C–E) did not significantly affect the initialCa 2� transient; however, these treatments abolished (CBX) orreduced (siRNA Px1) the plateau (R normalized to basal; aftertreatment with FGF-1 in the presence of CBX, peak: 1.66 0.10times basal, p � 0.05 vs FGF-1 alone; plateau: 1.01 0.07 timesbasal, p � 0.05 vs basal; for siRNA Px1, peak: 1.61 0.10 timesbasal, p � 0.05 vs FGF-1 alone; plateau: 1.15 0.03 times basal,p � 0.05 vs basal, n � 4). These data indicate that astrocytesrespond to FGF-1 by increasing [Ca 2�]i and releasing ATP. Weshow below that ATP activates purinergic receptors that thenopen Px1 HCs and mediate the plateau phase of [Ca 2�]i increasein response to FGF-1.
To further characterize how ATP release affects calcium sig-naling in response to FGF-1, we treated spinal astrocytes withexogenous ATP. The rise of the [Ca 2�]i increase in response todrug application was faster for ATP (1 mM) than for FGF-1, butthe peak values of R (normalized to basal) were similar for thedurations tested, 1–10 min (R1 min � 1.52 0.02, p � 0.05 vs
Figure 1. FGF-1 increases basal [Ca 2�]i in spinal astrocytes. Bars above the recordings represent application of 10 ng/ml FGF-1. [Ca 2�]i was measured as the ratio of 340/380 nm fura-2 emissionnormalized to basal. A, FGF-1 induced a fast (minutes) rise in [Ca 2�]i, which decayed to a plateau. B, Ten minute pretreatment with 2 mU/ml APY and continued application of APY with FGF-1abolished the plateau phase but only moderately reduced the peak. C, The same result was obtained with 200 �M CBX using the same protocol. D, Transfection of astrocytes for 24 h with siRNA Px1also abolished the plateau phase and reduced the peak. E, Quantitation of [Ca 2�]i responses to FGF-1 application as in A–D. n � 4. *p � 0.05 versus basal. **p � 0.01 versus basal. #p � 0.05plateaus FGF-1 � blocker versus FGF-1 alone.
4788 • J. Neurosci., April 27, 2016 • 36(17):4785– 4801 Garre et al. • FGF-1, Pannexin-1, and Inflammation in Spinal Cord
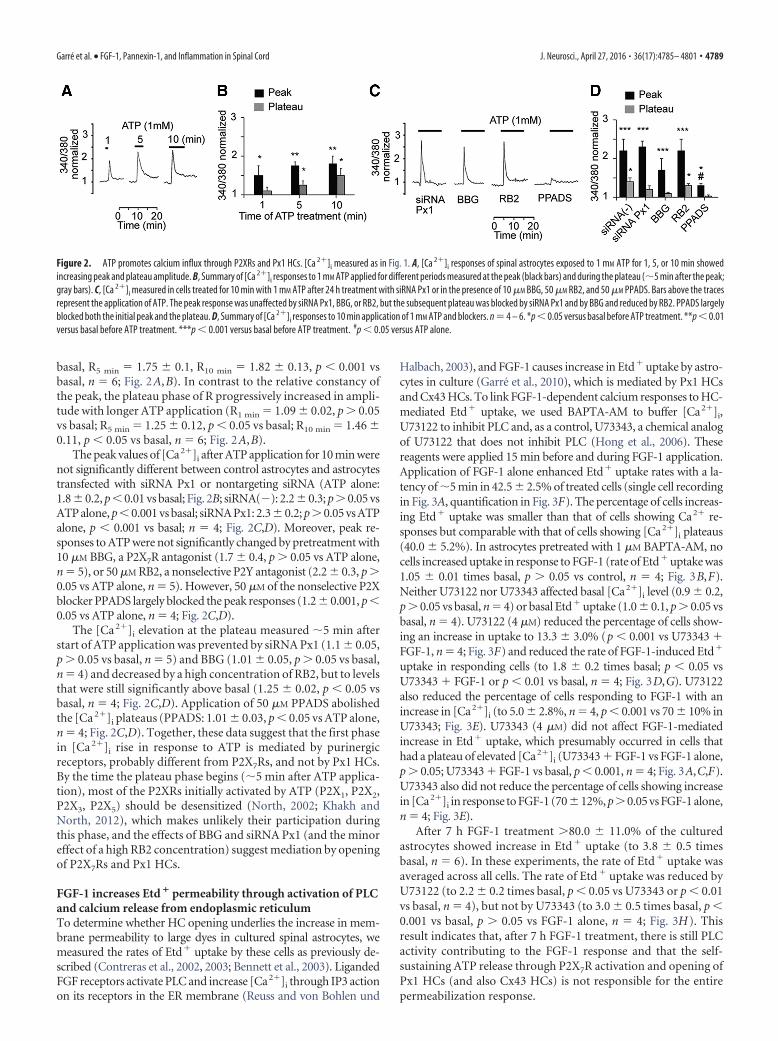
basal, R5 min � 1.75 0.1, R10 min � 1.82 0.13, p � 0.001 vsbasal, n � 6; Fig. 2A,B). In contrast to the relative constancy ofthe peak, the plateau phase of R progressively increased in ampli-tude with longer ATP application (R1 min � 1.09 0.02, p � 0.05vs basal; R5 min � 1.25 0.12, p � 0.05 vs basal; R10 min � 1.46 0.11, p � 0.05 vs basal, n � 6; Fig. 2A,B).
The peak values of [Ca2�]i after ATP application for 10 min werenot significantly different between control astrocytes and astrocytestransfected with siRNA Px1 or nontargeting siRNA (ATP alone:1.8 0.2, p � 0.01 vs basal; Fig. 2B; siRNA(�): 2.2 0.3; p � 0.05 vsATP alone, p � 0.001 vs basal; siRNA Px1: 2.3 0.2; p � 0.05 vs ATPalone, p � 0.001 vs basal; n � 4; Fig. 2C,D). Moreover, peak re-sponses to ATP were not significantly changed by pretreatment with10 �M BBG, a P2X7R antagonist (1.7 0.4, p � 0.05 vs ATP alone,n � 5), or 50 �M RB2, a nonselective P2Y antagonist (2.2 0.3, p �0.05 vs ATP alone, n � 5). However, 50 �M of the nonselective P2Xblocker PPADS largely blocked the peak responses (1.2 0.001, p �0.05 vs ATP alone, n � 4; Fig. 2C,D).
The [Ca 2�]i elevation at the plateau measured 5 min afterstart of ATP application was prevented by siRNA Px1 (1.1 0.05,p � 0.05 vs basal, n � 5) and BBG (1.01 0.05, p � 0.05 vs basal,n � 4) and decreased by a high concentration of RB2, but to levelsthat were still significantly above basal (1.25 0.02, p � 0.05 vsbasal, n � 4; Fig. 2C,D). Application of 50 �M PPADS abolishedthe [Ca 2�]i plateaus (PPADS: 1.01 0.03, p � 0.05 vs ATP alone,n � 4; Fig. 2C,D). Together, these data suggest that the first phasein [Ca 2�]i rise in response to ATP is mediated by purinergicreceptors, probably different from P2X7Rs, and not by Px1 HCs.By the time the plateau phase begins (5 min after ATP applica-tion), most of the P2XRs initially activated by ATP (P2X1, P2X2,P2X3, P2X5) should be desensitized (North, 2002; Khakh andNorth, 2012), which makes unlikely their participation duringthis phase, and the effects of BBG and siRNA Px1 (and the minoreffect of a high RB2 concentration) suggest mediation by openingof P2X7Rs and Px1 HCs.
FGF-1 increases Etd � permeability through activation of PLCand calcium release from endoplasmic reticulumTo determine whether HC opening underlies the increase in mem-brane permeability to large dyes in cultured spinal astrocytes, wemeasured the rates of Etd� uptake by these cells as previously de-scribed (Contreras et al., 2002, 2003; Bennett et al., 2003). LigandedFGF receptors activate PLC and increase [Ca2�]i through IP3 actionon its receptors in the ER membrane (Reuss and von Bohlen und
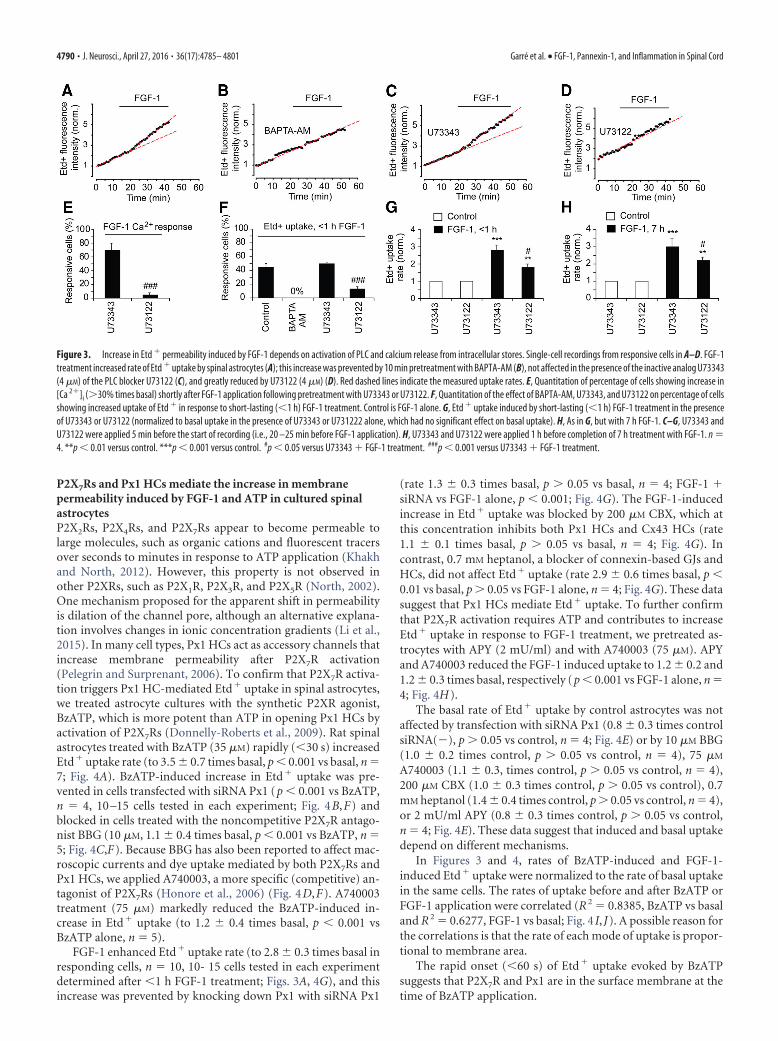
Halbach, 2003), and FGF-1 causes increase in Etd� uptake by astro-cytes in culture (Garre et al., 2010), which is mediated by Px1 HCsand Cx43 HCs. To link FGF-1-dependent calcium responses to HC-mediated Etd� uptake, we used BAPTA-AM to buffer [Ca2�]i,U73122 to inhibit PLC and, as a control, U73343, a chemical analogof U73122 that does not inhibit PLC (Hong et al., 2006). Thesereagents were applied 15 min before and during FGF-1 application.Application of FGF-1 alone enhanced Etd� uptake rates with a la-tency of 5 min in 42.5 2.5% of treated cells (single cell recordingin Fig. 3A, quantification in Fig. 3F). The percentage of cells increas-ing Etd� uptake was smaller than that of cells showing Ca2� re-sponses but comparable with that of cells showing [Ca2�]i plateaus(40.0 5.2%). In astrocytes pretreated with 1 �M BAPTA-AM, nocells increased uptake in response to FGF-1 (rate of Etd� uptake was1.05 0.01 times basal, p � 0.05 vs control, n � 4; Fig. 3B,F).Neither U73122 nor U73343 affected basal [Ca2�]i level (0.9 0.2,p � 0.05 vs basal, n � 4) or basal Etd� uptake (1.0 0.1, p � 0.05 vsbasal, n � 4). U73122 (4 �M) reduced the percentage of cells show-ing an increase in uptake to 13.3 3.0% (p � 0.001 vs U73343 �FGF-1, n � 4; Fig. 3F) and reduced the rate of FGF-1-induced Etd�
uptake in responding cells (to 1.8 0.2 times basal; p � 0.05 vsU73343 � FGF-1 or p � 0.01 vs basal, n � 4; Fig. 3D,G). U73122also reduced the percentage of cells responding to FGF-1 with anincrease in [Ca2�]i (to 5.0 2.8%, n � 4, p � 0.001 vs 70 10% inU73343; Fig. 3E). U73343 (4 �M) did not affect FGF-1-mediatedincrease in Etd� uptake, which presumably occurred in cells thathad a plateau of elevated [Ca2�]i (U73343 � FGF-1 vs FGF-1 alone,p � 0.05; U73343 � FGF-1 vs basal, p � 0.001, n � 4; Fig. 3A,C,F).U73343 also did not reduce the percentage of cells showing increasein [Ca2�]i in response to FGF-1 (7012%, p�0.05 vs FGF-1 alone,n � 4; Fig. 3E).
After 7 h FGF-1 treatment �80.0 11.0% of the culturedastrocytes showed increase in Etd� uptake (to 3.8 0.5 timesbasal, n � 6). In these experiments, the rate of Etd� uptake wasaveraged across all cells. The rate of Etd� uptake was reduced byU73122 (to 2.2 0.2 times basal, p � 0.05 vs U73343 or p � 0.01vs basal, n � 4), but not by U73343 (to 3.0 0.5 times basal, p �0.001 vs basal, p � 0.05 vs FGF-1 alone, n � 4; Fig. 3H). Thisresult indicates that, after 7 h FGF-1 treatment, there is still PLCactivity contributing to the FGF-1 response and that the self-sustaining ATP release through P2X7R activation and opening ofPx1 HCs (and also Cx43 HCs) is not responsible for the entirepermeabilization response.
Figure 2. ATP promotes calcium influx through P2XRs and Px1 HCs. [Ca 2�]i measured as in Fig. 1. A, [Ca 2�]i responses of spinal astrocytes exposed to 1 mM ATP for 1, 5, or 10 min showedincreasing peak and plateau amplitude. B, Summary of [Ca 2�]i responses to 1 mM ATP applied for different periods measured at the peak (black bars) and during the plateau (5 min after the peak;gray bars). C, [Ca 2�]i measured in cells treated for 10 min with 1 mM ATP after 24 h treatment with siRNA Px1 or in the presence of 10 �M BBG, 50 �M RB2, and 50 �M PPADS. Bars above the tracesrepresent the application of ATP. The peak response was unaffected by siRNA Px1, BBG, or RB2, but the subsequent plateau was blocked by siRNA Px1 and by BBG and reduced by RB2. PPADS largelyblocked both the initial peak and the plateau. D, Summary of [Ca 2�]i responses to 10 min application of 1 mM ATP and blockers. n � 4 – 6. *p � 0.05 versus basal before ATP treatment. **p � 0.01versus basal before ATP treatment. ***p � 0.001 versus basal before ATP treatment. #p � 0.05 versus ATP alone.
Garre et al. • FGF-1, Pannexin-1, and Inflammation in Spinal Cord J. Neurosci., April 27, 2016 • 36(17):4785– 4801 • 4789
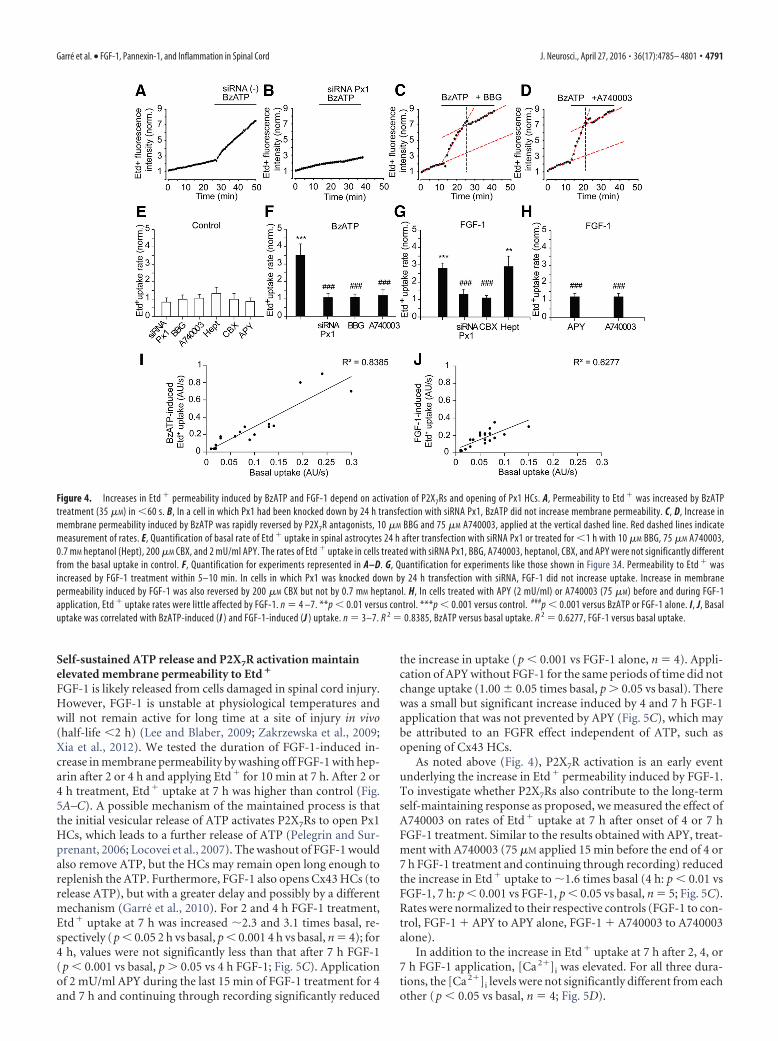
P2X7Rs and Px1 HCs mediate the increase in membranepermeability induced by FGF-1 and ATP in cultured spinalastrocytesP2X2Rs, P2X4Rs, and P2X7Rs appear to become permeable tolarge molecules, such as organic cations and fluorescent tracersover seconds to minutes in response to ATP application (Khakhand North, 2012). However, this property is not observed inother P2XRs, such as P2X1R, P2X3R, and P2X5R (North, 2002).One mechanism proposed for the apparent shift in permeabilityis dilation of the channel pore, although an alternative explana-tion involves changes in ionic concentration gradients (Li et al.,2015). In many cell types, Px1 HCs act as accessory channels thatincrease membrane permeability after P2X7R activation(Pelegrin and Surprenant, 2006). To confirm that P2X7R activa-tion triggers Px1 HC-mediated Etd� uptake in spinal astrocytes,we treated astrocyte cultures with the synthetic P2XR agonist,BzATP, which is more potent than ATP in opening Px1 HCs byactivation of P2X7Rs (Donnelly-Roberts et al., 2009). Rat spinalastrocytes treated with BzATP (35 �M) rapidly (�30 s) increasedEtd� uptake rate (to 3.5 0.7 times basal, p � 0.001 vs basal, n �7; Fig. 4A). BzATP-induced increase in Etd� uptake was pre-vented in cells transfected with siRNA Px1 (p � 0.001 vs BzATP,n � 4, 10 –15 cells tested in each experiment; Fig. 4B,F) andblocked in cells treated with the noncompetitive P2X7R antago-nist BBG (10 �M, 1.1 0.4 times basal, p � 0.001 vs BzATP, n �5; Fig. 4C,F). Because BBG has also been reported to affect mac-roscopic currents and dye uptake mediated by both P2X7Rs andPx1 HCs, we applied A740003, a more specific (competitive) an-tagonist of P2X7Rs (Honore et al., 2006) (Fig. 4D,F). A740003treatment (75 �M) markedly reduced the BzATP-induced in-crease in Etd� uptake (to 1.2 0.4 times basal, p � 0.001 vsBzATP alone, n � 5).
FGF-1 enhanced Etd� uptake rate (to 2.8 0.3 times basal inresponding cells, n � 10, 10- 15 cells tested in each experimentdetermined after �1 h FGF-1 treatment; Figs. 3A, 4G), and thisincrease was prevented by knocking down Px1 with siRNA Px1
(rate 1.3 0.3 times basal, p � 0.05 vs basal, n � 4; FGF-1 �siRNA vs FGF-1 alone, p � 0.001; Fig. 4G). The FGF-1-inducedincrease in Etd� uptake was blocked by 200 �M CBX, which atthis concentration inhibits both Px1 HCs and Cx43 HCs (rate1.1 0.1 times basal, p � 0.05 vs basal, n � 4; Fig. 4G). Incontrast, 0.7 mM heptanol, a blocker of connexin-based GJs andHCs, did not affect Etd� uptake (rate 2.9 0.6 times basal, p �0.01 vs basal, p � 0.05 vs FGF-1 alone, n � 4; Fig. 4G). These datasuggest that Px1 HCs mediate Etd� uptake. To further confirmthat P2X7R activation requires ATP and contributes to increaseEtd� uptake in response to FGF-1 treatment, we pretreated as-trocytes with APY (2 mU/ml) and with A740003 (75 �M). APYand A740003 reduced the FGF-1 induced uptake to 1.2 0.2 and1.2 0.3 times basal, respectively (p � 0.001 vs FGF-1 alone, n �4; Fig. 4H).
The basal rate of Etd� uptake by control astrocytes was notaffected by transfection with siRNA Px1 (0.8 0.3 times controlsiRNA(�), p � 0.05 vs control, n � 4; Fig. 4E) or by 10 �M BBG(1.0 0.2 times control, p � 0.05 vs control, n � 4), 75 �M
A740003 (1.1 0.3, times control, p � 0.05 vs control, n � 4),200 �M CBX (1.0 0.3 times control, p � 0.05 vs control), 0.7mM heptanol (1.4 0.4 times control, p � 0.05 vs control, n � 4),or 2 mU/ml APY (0.8 0.3 times control, p � 0.05 vs control,n � 4; Fig. 4E). These data suggest that induced and basal uptakedepend on different mechanisms.
In Figures 3 and 4, rates of BzATP-induced and FGF-1-induced Etd� uptake were normalized to the rate of basal uptakein the same cells. The rates of uptake before and after BzATP orFGF-1 application were correlated (R 2 � 0.8385, BzATP vs basaland R 2 � 0.6277, FGF-1 vs basal; Fig. 4 I, J). A possible reason forthe correlations is that the rate of each mode of uptake is propor-tional to membrane area.
The rapid onset (�60 s) of Etd� uptake evoked by BzATPsuggests that P2X7R and Px1 are in the surface membrane at thetime of BzATP application.
Figure 3. Increase in Etd � permeability induced by FGF-1 depends on activation of PLC and calcium release from intracellular stores. Single-cell recordings from responsive cells in A–D. FGF-1treatment increased rate of Etd � uptake by spinal astrocytes (A); this increase was prevented by 10 min pretreatment with BAPTA-AM (B), not affected in the presence of the inactive analog U73343(4 �M) of the PLC blocker U73122 (C), and greatly reduced by U73122 (4 �M) (D). Red dashed lines indicate the measured uptake rates. E, Quantitation of percentage of cells showing increase in[Ca 2�]i (�30% times basal) shortly after FGF-1 application following pretreatment with U73343 or U73122. F, Quantitation of the effect of BAPTA-AM, U73343, and U73122 on percentage of cellsshowing increased uptake of Etd � in response to short-lasting (�1 h) FGF-1 treatment. Control is FGF-1 alone. G, Etd � uptake induced by short-lasting (�1 h) FGF-1 treatment in the presenceof U73343 or U73122 (normalized to basal uptake in the presence of U73343 or U731222 alone, which had no significant effect on basal uptake). H, As in G, but with 7 h FGF-1. C–G, U73343 andU73122 were applied 5 min before the start of recording (i.e., 20 –25 min before FGF-1 application). H, U73343 and U73122 were applied 1 h before completion of 7 h treatment with FGF-1. n �4. **p � 0.01 versus control. ***p � 0.001 versus control. #p � 0.05 versus U73343 � FGF-1 treatment. ###p � 0.001 versus U73343 � FGF-1 treatment.
4790 • J. Neurosci., April 27, 2016 • 36(17):4785– 4801 Garre et al. • FGF-1, Pannexin-1, and Inflammation in Spinal Cord
Self-sustained ATP release and P2X7R activation maintainelevated membrane permeability to Etd �
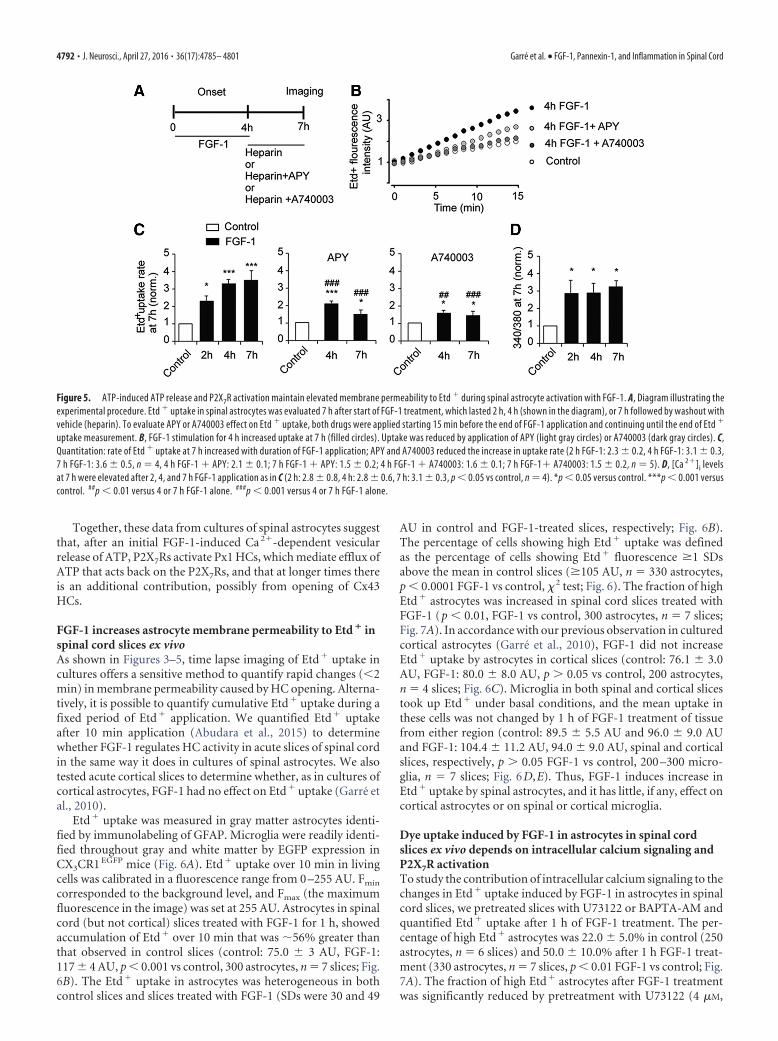
FGF-1 is likely released from cells damaged in spinal cord injury.However, FGF-1 is unstable at physiological temperatures andwill not remain active for long time at a site of injury in vivo(half-life �2 h) (Lee and Blaber, 2009; Zakrzewska et al., 2009;Xia et al., 2012). We tested the duration of FGF-1-induced in-crease in membrane permeability by washing off FGF-1 with hep-arin after 2 or 4 h and applying Etd� for 10 min at 7 h. After 2 or4 h treatment, Etd� uptake at 7 h was higher than control (Fig.5A–C). A possible mechanism of the maintained process is thatthe initial vesicular release of ATP activates P2X7Rs to open Px1HCs, which leads to a further release of ATP (Pelegrin and Sur-prenant, 2006; Locovei et al., 2007). The washout of FGF-1 wouldalso remove ATP, but the HCs may remain open long enough toreplenish the ATP. Furthermore, FGF-1 also opens Cx43 HCs (torelease ATP), but with a greater delay and possibly by a differentmechanism (Garre et al., 2010). For 2 and 4 h FGF-1 treatment,Etd� uptake at 7 h was increased 2.3 and 3.1 times basal, re-spectively (p � 0.05 2 h vs basal, p � 0.001 4 h vs basal, n � 4); for4 h, values were not significantly less than that after 7 h FGF-1(p � 0.001 vs basal, p � 0.05 vs 4 h FGF-1; Fig. 5C). Applicationof 2 mU/ml APY during the last 15 min of FGF-1 treatment for 4and 7 h and continuing through recording significantly reduced
the increase in uptake (p � 0.001 vs FGF-1 alone, n � 4). Appli-cation of APY without FGF-1 for the same periods of time did notchange uptake (1.00 0.05 times basal, p � 0.05 vs basal). Therewas a small but significant increase induced by 4 and 7 h FGF-1application that was not prevented by APY (Fig. 5C), which maybe attributed to an FGFR effect independent of ATP, such asopening of Cx43 HCs.
As noted above (Fig. 4), P2X7R activation is an early eventunderlying the increase in Etd� permeability induced by FGF-1.To investigate whether P2X7Rs also contribute to the long-termself-maintaining response as proposed, we measured the effect ofA740003 on rates of Etd� uptake at 7 h after onset of 4 or 7 hFGF-1 treatment. Similar to the results obtained with APY, treat-ment with A740003 (75 �M applied 15 min before the end of 4 or7 h FGF-1 treatment and continuing through recording) reducedthe increase in Etd� uptake to 1.6 times basal (4 h: p � 0.01 vsFGF-1, 7 h: p � 0.001 vs FGF-1, p � 0.05 vs basal, n � 5; Fig. 5C).Rates were normalized to their respective controls (FGF-1 to con-trol, FGF-1 � APY to APY alone, FGF-1 � A740003 to A740003alone).
In addition to the increase in Etd� uptake at 7 h after 2, 4, or7 h FGF-1 application, [Ca 2�]i was elevated. For all three dura-tions, the [Ca 2�]i levels were not significantly different from eachother (p � 0.05 vs basal, n � 4; Fig. 5D).
Figure 4. Increases in Etd � permeability induced by BzATP and FGF-1 depend on activation of P2X7Rs and opening of Px1 HCs. A, Permeability to Etd � was increased by BzATPtreatment (35 �M) in �60 s. B, In a cell in which Px1 had been knocked down by 24 h transfection with siRNA Px1, BzATP did not increase membrane permeability. C, D, Increase inmembrane permeability induced by BzATP was rapidly reversed by P2X7R antagonists, 10 �M BBG and 75 �M A740003, applied at the vertical dashed line. Red dashed lines indicatemeasurement of rates. E, Quantification of basal rate of Etd � uptake in spinal astrocytes 24 h after transfection with siRNA Px1 or treated for �1 h with 10 �M BBG, 75 �M A740003,0.7 mM heptanol (Hept), 200 �M CBX, and 2 mU/ml APY. The rates of Etd � uptake in cells treated with siRNA Px1, BBG, A740003, heptanol, CBX, and APY were not significantly differentfrom the basal uptake in control. F, Quantification for experiments represented in A–D. G, Quantification for experiments like those shown in Figure 3A. Permeability to Etd � wasincreased by FGF-1 treatment within 5–10 min. In cells in which Px1 was knocked down by 24 h transfection with siRNA, FGF-1 did not increase uptake. Increase in membranepermeability induced by FGF-1 was also reversed by 200 �M CBX but not by 0.7 mM heptanol. H, In cells treated with APY (2 mU/ml) or A740003 (75 �M) before and during FGF-1application, Etd � uptake rates were little affected by FGF-1. n � 4 –7. **p � 0.01 versus control. ***p � 0.001 versus control. ###p � 0.001 versus BzATP or FGF-1 alone. I, J, Basaluptake was correlated with BzATP-induced (I ) and FGF-1-induced (J ) uptake. n � 3–7. R 2 � 0.8385, BzATP versus basal uptake. R 2 � 0.6277, FGF-1 versus basal uptake.
Garre et al. • FGF-1, Pannexin-1, and Inflammation in Spinal Cord J. Neurosci., April 27, 2016 • 36(17):4785– 4801 • 4791
Together, these data from cultures of spinal astrocytes suggestthat, after an initial FGF-1-induced Ca 2�-dependent vesicularrelease of ATP, P2X7Rs activate Px1 HCs, which mediate efflux ofATP that acts back on the P2X7Rs, and that at longer times thereis an additional contribution, possibly from opening of Cx43HCs.
FGF-1 increases astrocyte membrane permeability to Etd � inspinal cord slices ex vivoAs shown in Figures 3–5, time lapse imaging of Etd� uptake incultures offers a sensitive method to quantify rapid changes (�2min) in membrane permeability caused by HC opening. Alterna-tively, it is possible to quantify cumulative Etd� uptake during afixed period of Etd� application. We quantified Etd� uptakeafter 10 min application (Abudara et al., 2015) to determinewhether FGF-1 regulates HC activity in acute slices of spinal cordin the same way it does in cultures of spinal astrocytes. We alsotested acute cortical slices to determine whether, as in cultures ofcortical astrocytes, FGF-1 had no effect on Etd� uptake (Garre etal., 2010).
Etd� uptake was measured in gray matter astrocytes identi-fied by immunolabeling of GFAP. Microglia were readily identi-fied throughout gray and white matter by EGFP expression inCX3CR1 EGFP mice (Fig. 6A). Etd� uptake over 10 min in livingcells was calibrated in a fluorescence range from 0 –255 AU. Fmin
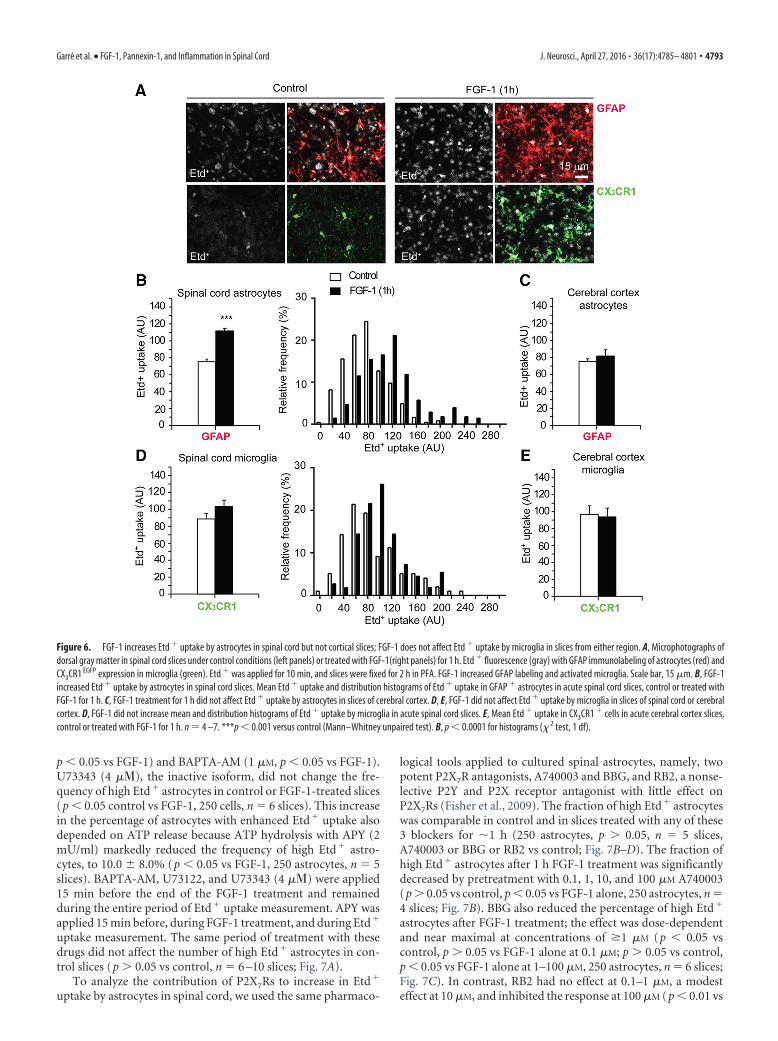
corresponded to the background level, and Fmax (the maximumfluorescence in the image) was set at 255 AU. Astrocytes in spinalcord (but not cortical) slices treated with FGF-1 for 1 h, showedaccumulation of Etd� over 10 min that was 56% greater thanthat observed in control slices (control: 75.0 3 AU, FGF-1:117 4 AU, p � 0.001 vs control, 300 astrocytes, n � 7 slices; Fig.6B). The Etd� uptake in astrocytes was heterogeneous in bothcontrol slices and slices treated with FGF-1 (SDs were 30 and 49
AU in control and FGF-1-treated slices, respectively; Fig. 6B).The percentage of cells showing high Etd� uptake was definedas the percentage of cells showing Etd� fluorescence �1 SDsabove the mean in control slices (�105 AU, n � 330 astrocytes,p � 0.0001 FGF-1 vs control, � 2 test; Fig. 6). The fraction of highEtd� astrocytes was increased in spinal cord slices treated withFGF-1 (p � 0.01, FGF-1 vs control, 300 astrocytes, n � 7 slices;Fig. 7A). In accordance with our previous observation in culturedcortical astrocytes (Garre et al., 2010), FGF-1 did not increaseEtd� uptake by astrocytes in cortical slices (control: 76.1 3.0AU, FGF-1: 80.0 8.0 AU, p � 0.05 vs control, 200 astrocytes,n � 4 slices; Fig. 6C). Microglia in both spinal and cortical slicestook up Etd� under basal conditions, and the mean uptake inthese cells was not changed by 1 h of FGF-1 treatment of tissuefrom either region (control: 89.5 5.5 AU and 96.0 9.0 AUand FGF-1: 104.4 11.2 AU, 94.0 9.0 AU, spinal and corticalslices, respectively, p � 0.05 FGF-1 vs control, 200 –300 micro-glia, n � 7 slices; Fig. 6D,E). Thus, FGF-1 induces increase inEtd� uptake by spinal astrocytes, and it has little, if any, effect oncortical astrocytes or on spinal or cortical microglia.
Dye uptake induced by FGF-1 in astrocytes in spinal cordslices ex vivo depends on intracellular calcium signaling andP2X7R activationTo study the contribution of intracellular calcium signaling to thechanges in Etd� uptake induced by FGF-1 in astrocytes in spinalcord slices, we pretreated slices with U73122 or BAPTA-AM andquantified Etd� uptake after 1 h of FGF-1 treatment. The per-centage of high Etd� astrocytes was 22.0 5.0% in control (250astrocytes, n � 6 slices) and 50.0 10.0% after 1 h FGF-1 treat-ment (330 astrocytes, n � 7 slices, p � 0.01 FGF-1 vs control; Fig.7A). The fraction of high Etd� astrocytes after FGF-1 treatmentwas significantly reduced by pretreatment with U73122 (4 �M,
Figure 5. ATP-induced ATP release and P2X7R activation maintain elevated membrane permeability to Etd � during spinal astrocyte activation with FGF-1. A, Diagram illustrating theexperimental procedure. Etd � uptake in spinal astrocytes was evaluated 7 h after start of FGF-1 treatment, which lasted 2 h, 4 h (shown in the diagram), or 7 h followed by washout withvehicle (heparin). To evaluate APY or A740003 effect on Etd � uptake, both drugs were applied starting 15 min before the end of FGF-1 application and continuing until the end of Etd �
uptake measurement. B, FGF-1 stimulation for 4 h increased uptake at 7 h (filled circles). Uptake was reduced by application of APY (light gray circles) or A740003 (dark gray circles). C,Quantitation: rate of Etd � uptake at 7 h increased with duration of FGF-1 application; APY and A740003 reduced the increase in uptake rate (2 h FGF-1: 2.3 0.2, 4 h FGF-1: 3.1 0.3,7 h FGF-1: 3.6 0.5, n � 4, 4 h FGF-1 � APY: 2.1 0.1; 7 h FGF-1 � APY: 1.5 0.2; 4 h FGF-1 � A740003: 1.6 0.1; 7 h FGF-1� A740003: 1.5 0.2, n � 5). D, [Ca 2�]i levelsat 7 h were elevated after 2, 4, and 7 h FGF-1 application as in C (2 h: 2.8 0.8, 4 h: 2.8 0.6, 7 h: 3.1 0.3, p � 0.05 vs control, n � 4). *p � 0.05 versus control. ***p � 0.001 versuscontrol. ##p � 0.01 versus 4 or 7 h FGF-1 alone. ###p � 0.001 versus 4 or 7 h FGF-1 alone.
4792 • J. Neurosci., April 27, 2016 • 36(17):4785– 4801 Garre et al. • FGF-1, Pannexin-1, and Inflammation in Spinal Cord
p � 0.05 vs FGF-1) and BAPTA-AM (1 �M, p � 0.05 vs FGF-1).U73343 (4 ��), the inactive isoform, did not change the fre-quency of high Etd� astrocytes in control or FGF-1-treated slices(p � 0.05 control vs FGF-1, 250 cells, n � 6 slices). This increasein the percentage of astrocytes with enhanced Etd� uptake alsodepended on ATP release because ATP hydrolysis with APY (2mU/ml) markedly reduced the frequency of high Etd� astro-cytes, to 10.0 8.0% (p � 0.05 vs FGF-1, 250 astrocytes, n � 5slices). BAPTA-AM, U73122, and U73343 (4 ��) were applied15 min before the end of the FGF-1 treatment and remainedduring the entire period of Etd� uptake measurement. APY wasapplied 15 min before, during FGF-1 treatment, and during Etd�
uptake measurement. The same period of treatment with thesedrugs did not affect the number of high Etd� astrocytes in con-trol slices (p � 0.05 vs control, n � 6 –10 slices; Fig. 7A).
To analyze the contribution of P2X7Rs to increase in Etd�
uptake by astrocytes in spinal cord, we used the same pharmaco-
logical tools applied to cultured spinal astrocytes, namely, twopotent P2X7R antagonists, A740003 and BBG, and RB2, a nonse-lective P2Y and P2X receptor antagonist with little effect onP2X7Rs (Fisher et al., 2009). The fraction of high Etd� astrocyteswas comparable in control and in slices treated with any of these3 blockers for 1 h (250 astrocytes, p � 0.05, n � 5 slices,A740003 or BBG or RB2 vs control; Fig. 7B–D). The fraction ofhigh Etd� astrocytes after 1 h FGF-1 treatment was significantlydecreased by pretreatment with 0.1, 1, 10, and 100 �M A740003(p � 0.05 vs control, p � 0.05 vs FGF-1 alone, 250 astrocytes, n �4 slices; Fig. 7B). BBG also reduced the percentage of high Etd�
astrocytes after FGF-1 treatment; the effect was dose-dependentand near maximal at concentrations of �1 �M (p � 0.05 vscontrol, p � 0.05 vs FGF-1 alone at 0.1 �M; p � 0.05 vs control,p � 0.05 vs FGF-1 alone at 1–100 �M, 250 astrocytes, n � 6 slices;Fig. 7C). In contrast, RB2 had no effect at 0.1–1 �M, a modesteffect at 10 �M, and inhibited the response at 100 �M (p � 0.01 vs
Figure 6. FGF-1 increases Etd � uptake by astrocytes in spinal cord but not cortical slices; FGF-1 does not affect Etd � uptake by microglia in slices from either region. A, Microphotographs ofdorsal gray matter in spinal cord slices under control conditions (left panels) or treated with FGF-1(right panels) for 1 h. Etd � fluorescence (gray) with GFAP immunolabeling of astrocytes (red) andCX3CR1 EGFP expression in microglia (green). Etd � was applied for 10 min, and slices were fixed for 2 h in PFA. FGF-1 increased GFAP labeling and activated microglia. Scale bar, 15 �m. B, FGF-1increased Etd � uptake by astrocytes in spinal cord slices. Mean Etd � uptake and distribution histograms of Etd � uptake in GFAP � astrocytes in acute spinal cord slices, control or treated withFGF-1 for 1 h. C, FGF-1 treatment for 1 h did not affect Etd � uptake by astrocytes in slices of cerebral cortex. D, E, FGF-1 did not affect Etd � uptake by microglia in slices of spinal cord or cerebralcortex. D, FGF-1 did not increase mean and distribution histograms of Etd � uptake by microglia in acute spinal cord slices. E, Mean Etd � uptake in CX3CR1 � cells in acute cerebral cortex slices,control or treated with FGF-1 for 1 h. n � 4 –7. ***p � 0.001 versus control (Mann–Whitney unpaired test). B, p � 0.0001 for histograms (� 2 test, 1 df).
Garre et al. • FGF-1, Pannexin-1, and Inflammation in Spinal Cord J. Neurosci., April 27, 2016 • 36(17):4785– 4801 • 4793

Figure 7. FGF-1-induced Etd � uptake in astrocytes in spinal cord slices depends on PLC, intracellular calcium signaling, ATP release, and P2X7R activation. A, Percentage of high Etd � cells incontrol or after 1 h FGF-1 (control: 22.05.0%; 1 h FGF-1: 50.010.0%, n�7). Percentage of high Etd � astrocytes was not changed by treatment of control and FGF-1-treated slices with U73343(1 �M). In contrast, U73122 (1 �M), BAPTA-AM (4 �M), and APY (2 mU/ml) blocked FGF-1-induced uptake, although they did not affect percentage of high Etd � cells in control conditions (controland FGF-1, respectively: U73343: 19.0 4.0%, 40.5 9.0%; U73122: 16.0 8.3%, 16.0 8.0%, BAPTA-AM: 12.0 8.0%, 10.0 8.0%; APY: 12.0 7.0%, 9.7 6.0%, control and FGF-1,respectively, n � 6). B, The percentage of high Etd � astrocytes was not changed in control or by FGF-1 in slices treated with 0.1, 1, 10, and 100 �M of A740003 (Control0.1–100 �M: 9.8 2.5%,9.0 2.3%, 5.0 4.0%, 5.0 2.0%; FGF-10.1–100 �M: 6.0 5.0%, 10.0 2.3%, 5.1 4.0%, 3.0 2.0%, n � 4, B). C, Treatment with BBG at 0.1 to 100 �M did not affect control uptake andblocked FGF-1 induced uptake at 1–100 �M (Control0.1–100 �M: 10.5 8.5%, 14.0 6.0%, 9.0 6.0%, 9.0 5.5%; FGF-10.1–100 �M: 38.0 10.0%, 16.0 7.2%, 10.1 6.0%, 8.0 5.0%,n � 6, C). D, At the same concentrations as for BBG, RB2 did not affect control uptake and significantly reduced uptake at 10 and 100 �M (Control0.1–100 �M: 12.0 9.0%, 10.0 8.5%, 11.0 8.5%, 10.3 8.0%; FGF-10.1–100 �M: 50.8 11.0%, 38.0 11.0%, 29.8 6.0%, 10.0 8.0%). The blockers and apyrase were applied 10 –15 min before vehicle or FGF-1 treatment, and leftuntil EtdBr incubation was terminated (1.25 h total period of treatment). n � 5–7. *p � 0.05 versus control. **p � 0.05 versus control. #p � 0.05 versus FGF-1.
Figure 8. FGF-1-induced Etd � uptake in astrocytes in spinal cord slices is mediated by Px1 HCs. A, The increase in the percentage of high Etd � astrocytes in spinal cord slices treated with FGF-1for 1 h was prevented by treatment with 100 �M
10Panx1 or 200 �M CBX but not affected by treatment with scrambled 10Panx1 or 100 �M Gap19 (scrambled 10Panx1: 20.0 9.0%, scrambled10Panx1 � FGF-1: 50.0 5.5%; 10Panx1: 25.5 6.5%; 10Panx1 � FGF-1: 19.5 4.0%; CBX: 26 2.5%, FGF-1� CBX: 21.5 6.5%; Gap19: 24.7 5.0%, FGF-1 � Gap19: 58.2 6.9%, n �6 or 7 slices each condition). **p � 0.01 versus control. Blockers were applied 10 –15 min before vehicle or FGF-1 treatment and left until Etd � incubation was terminated (1.25 h total period oftreatment). B–G, Specificity of inhibition by 10Panx1 of Px1 HCs and by Gap 19 of Cx43 HCs. Time lapse imaging in mixed cultures of parental cells (open circles) and HeLa cells expressing Cx43-CFP(filled circles) and HeLa cells expressing Px1-YFP (green circles). B, E, HeLa Cx43-CFP and HeLa Px1-YFP cells take up Etd � more rapidly than parental cells. C, F, Pretreatment with 100 �M
10Panx1reduced Etd � uptake rate in HeLa Px1-YFP cells but not in Cx43-CFP cells. D, G, Pretreatment with 100 �M Gap19 reduced Etd � uptake rate in HeLa Cx43-CFP cells but not in Px1-YFP cells. Blockerswere applied 30 – 60 min before experiments and left during the Etd � uptake measurement (similar to A, 0.75–1 h total period of treatment). n � 5. ***p � 0.001 versus parental. #p � 0.05versus HeLa Cx43-CFP or HeLa Px1-YFP. ##p � 0.01 versus HeLa Cx43-CFP or HeLa Px1-YFP.
4794 • J. Neurosci., April 27, 2016 • 36(17):4785– 4801 Garre et al. • FGF-1, Pannexin-1, and Inflammation in Spinal Cord
control, p � 0.05 vs FGF-1 alone at 0.1 �M; p � 0.05 vs control,p � 0.05 vs FGF-1 alone at 1 �M; p � 0.05 vs control at 10 �M, p �0.05 vs control at 100 �M; p � 0.05 vs FGF-1 at 10 –100 �M, 250astrocytes, n � 6 slices; Fig. 7D). All reagents were applied 15 minbefore FGF-1 treatment and maintained until completion ofEtd� uptake measurement. The reduction in the percentage ofhigh Etd� astrocytes after FGF-1 treatment by A740003 andBBG, and by RB2 only at high concentrations, indicates thatP2X7Rs contributes to this response. A minor contribution fromother types of purinergic receptor cannot be completely ruled outfrom our study.
FGF-1-induced Etd � uptake in astrocytes in acute spinal cordslices is mediated by Px1 HC openingWe used selective pharmacological tools to identify HC type inspinal cord slices. The increase in Etd� uptake by astrocytes inspinal cord slices treated with FGF-1 for 1 h was blocked by 100�M
10Panx1, a synthetic peptide that selectively blocks Px1 HCs(p � 0.05, 10Panx1 � FGF-1 vs 10Panx1, n � 6 slices; Fig. 8A)(Pelegrin and Surprenant, 2006). A scrambled version of 10Panx1did not affect the uptake in control slices and did not block theincrease after 1 h FGF-1 treatment (p � 0.01, scrambled � FGF-1vs scrambled, 200 astrocytes, n � 6; Fig. 8A). To further demon-strate that Px1 HC opening mediates FGF-1-induced Etd� up-take in astrocytes, we treated spinal cord slices with 200 �M CBX,a GJ blocker that at this concentration inhibits both Px HCs andCx HCs. In cells treated with CBX, there was no significant dif-ference in the frequency of high Etd� astrocytes between controlslices and slices treated with FGF-1 for 1 h (p � 0.05, FGF-1 �CBX vs CBX alone, 250 astrocytes, n � 6; Fig. 8A).
Because, in cultured spinal astrocytes, 7 h but not 2 h FGF-1treatment induces opening of Cx43 HCs, we expected that Cx43HCs would not contribute to increased membrane permeabilityafter the 1 h FGF-1 treatment when applied to spinal cord slices exvivo. In agreement the selective Cx43 HC blocker, Gap19 (100�M) (Abudara et al., 2014) did not alter the frequency of highEtd� astrocytes after 1 h FGF-1 treatment (p � 0.01, FGF-1 �
Gap19 vs Gap19 alone, p � 0.05, FGF-1 � Gap19 vs FGF-1 alone,300 astrocytes, n � 7; Fig. 8A).
We confirmed the specificity of 10Panx1 and Gap19 block ofPx1 and Cx HCs, respectively, by applying these blockers tomixed cultures of parental (untransfected) HeLa cells, HeLa cellsexpressing Px1-YFP, and HeLa cells expressing Cx43-CFP (Fig.8B–G). The rate of Etd� uptake by HeLa Cx43-CFP cells was2.0 0.3 times that by parental cells (p � 0.001 vs parental, n �5), similar to Etd� uptake rate by HeLa cells expressing Cx43-EGFP (Contreras et al., 2003). The rate of Etd� uptake by HeLaPx1-YFP cells was 1.8 0.2 times that by parental cells (p � 0.001vs parental, n � 5; Fig. 8B,E). 10Panx1 (100 �M) reduced the rateof Etd� uptake by HeLa Px1-YFP cells (to 1.1 0.3 times paren-tal, p � 0.01 vs HeLa Px1-YFP without 10Panx1, p � 0.05 vsparental, n � 5) and did not affect the rate of Etd� uptake byHeLa Cx43-CFP cells (2.0 0.3 times control, p � 0.05 vs HeLaCx43-CFP without 10Panx1, n � 5; Fig. 8C,F). In contrast, Gap19(100 �M) reduced the rates of Etd� uptake in HeLa Cx43-CFPcells (to 1.3 0.2 times control, p � 0.05 vs HeLa Cx43-CFPwithout Gap19, p � 0.05 vs parental) and had no significant effecton Px1-YFP cells (1.8 0.3 times control, p � 0.05 vs HeLaPx1-YFP, n � 5; Fig. 8D,G). In these experiments, we treatedHeLa cells with blockers for 0.5–1 h before Etd� was applied tothe bath, and continued the blockers during 10 min uptake re-cording.
These data suggest that the increase in percentage of highEtd� astrocytes in acute spinal cord slices after 1 h FGF-1 treat-ment is mainly mediated by Px1 HCs.
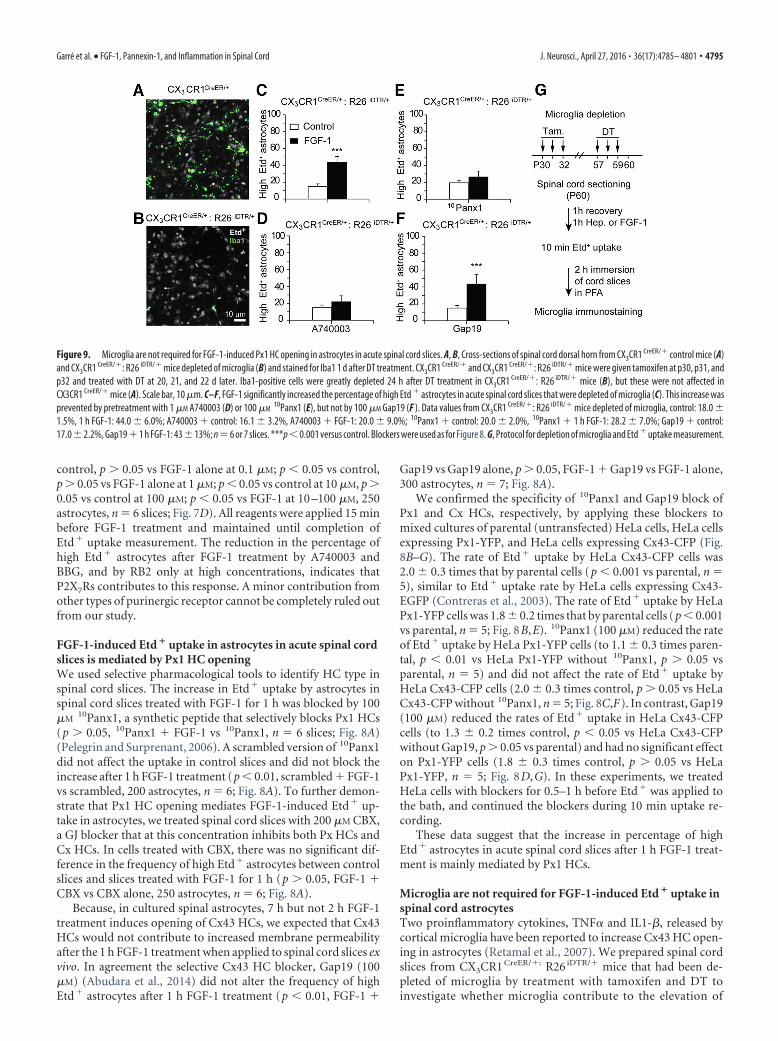
Microglia are not required for FGF-1-induced Etd � uptake inspinal cord astrocytesTwo proinflammatory cytokines, TNF� and IL1-�, released bycortical microglia have been reported to increase Cx43 HC open-ing in astrocytes (Retamal et al., 2007). We prepared spinal cordslices from CX3CR1 CreER/�: R26 iDTR/� mice that had been de-pleted of microglia by treatment with tamoxifen and DT toinvestigate whether microglia contribute to the elevation of
Figure 9. Microglia are not required for FGF-1-induced Px1 HC opening in astrocytes in acute spinal cord slices. A, B, Cross-sections of spinal cord dorsal horn from CX3CR1 CreER/� control mice (A)and CX3CR1 CreER/�: R26 iDTR/� mice depleted of microglia (B) and stained for Iba1 1 d after DT treatment. CX3CR1 CreER/� and CX3CR1 CreER/�: R26 iDTR/� mice were given tamoxifen at p30, p31, andp32 and treated with DT at 20, 21, and 22 d later. Iba1-positive cells were greatly depleted 24 h after DT treatment in CX3CR1 CreER/�: R26 iDTR/� mice (B), but these were not affected inCX3CR1 CreER/� mice (A). Scale bar, 10 �m. C–F, FGF-1 significantly increased the percentage of high Etd � astrocytes in acute spinal cord slices that were depleted of microglia (C). This increase wasprevented by pretreatment with 1 �M A740003 (D) or 100 �M
10Panx1 (E), but not by 100 �M Gap19 (F ). Data values from CX3CR1 CreER/�: R26 iDTR/� mice depleted of microglia, control: 18.0 1.5%, 1 h FGF-1: 44.0 6.0%; A740003 � control: 16.1 3.2%, A740003 � FGF-1: 20.0 9.0%; 10Panx1 � control: 20.0 2.0%, 10Panx1 � 1 h FGF-1: 28.2 7.0%; Gap19 � control:17.02.2%, Gap19�1 h FGF-1: 4313%; n�6 or 7 slices. ***p�0.001 versus control. Blockers were used as for Figure 8. G, Protocol for depletion of microglia and Etd � uptake measurement.
Garre et al. • FGF-1, Pannexin-1, and Inflammation in Spinal Cord J. Neurosci., April 27, 2016 • 36(17):4785– 4801 • 4795
Etd� uptake by astrocytes induced by 1 h FGF-1 treatment.Nondepleted slices were prepared from CX3CR1 CreER/� micetreated with tamoxifen and DT and used as controls (Fig. 9A,B;see Materials and Methods) (Parkhurst et al., 2013). In spinalcord slices depleted of microglia (Fig. 9G), the percentages of highEtd� astrocytes in control or after 1 h FGF-1 treatment werenot significantly different from those in control mice withintact microglia (p � 0.05, CX3CR1 CreER/�: R26 iDTR/� vsCX3CR1 CreER/�) or treated with FGF-1 (p � 0.05,CX3CR1 CreER/�: R26 iDTR/� � FGF-1 vs CX3CR1 CreER/� �FGF-1, 250 astrocytes, n � 6 slices; Fig. 9C; for uptake in nonde-pleted slices, see Fig. 7A). In spinal cord slices depleted of micro-glia and treated with A740003 (1 �M), FGF-1 did not increase thepercentage of astrocytes with enhanced Etd� uptake (p � 0.05,CX3CR1 CreER/�: R26 iDTR/� � FGF-1 vs CX3CR1 CreER/�:R26 iDTR/�, 250 astrocytes, n � 7; Fig. 9D). As expected, the per-centage of high Etd� astrocytes after FGF-1 treatment was notincreased in slices pretreated with 100 �M
10Panx1 (p � 0.05,CX3CR1 CreER/�:R26 iDTR/� � FGF-1 vs CX3CR1 CreER/�:R26 iDTR/�, 200 astrocytes, n � 6; Fig. 9E). Conversely, pretreat-
ment of these slices with 100 �M Gap19 did not affect basal up-take, and the increase in high Etd� astrocytes induced by FGF-1treatment (p � 0.05, CX3CR1 CreER/� � FGF-1 vs CX3CR1 CreER/
�:R26 iDTR/� � FGF-1; Fig. 9F). These data indicate that, in theabsence of microglia, P2X7Rs and Px1 HCs expressed in astro-cytes mediate FGF-1-induced increase in high Etd� astrocytes inacute spinal cord slices.
FGF-1 promotes inflammatory responses in acute spinalcord slicesTo investigate whether activation of astrocyte P2X7Rs and Px1HCs subsequently induces microglial responses, we examinedmicroglia in these slices for morphological changes (Fig. 10). Invivo studies in cerebral cortex reveal that microglia quickly re-spond to microinjuries by directing fine processes toward the siteof injury through mechanisms that may involve ATP releasethrough hemichannels in surrounding astrocytes and/or ATP re-lease from damaged cells (Davalos et al., 2005). Furthermore, inacute cortical slices treated with glutamate, microglia rapidly in-crease the number of processes during early phases of activation
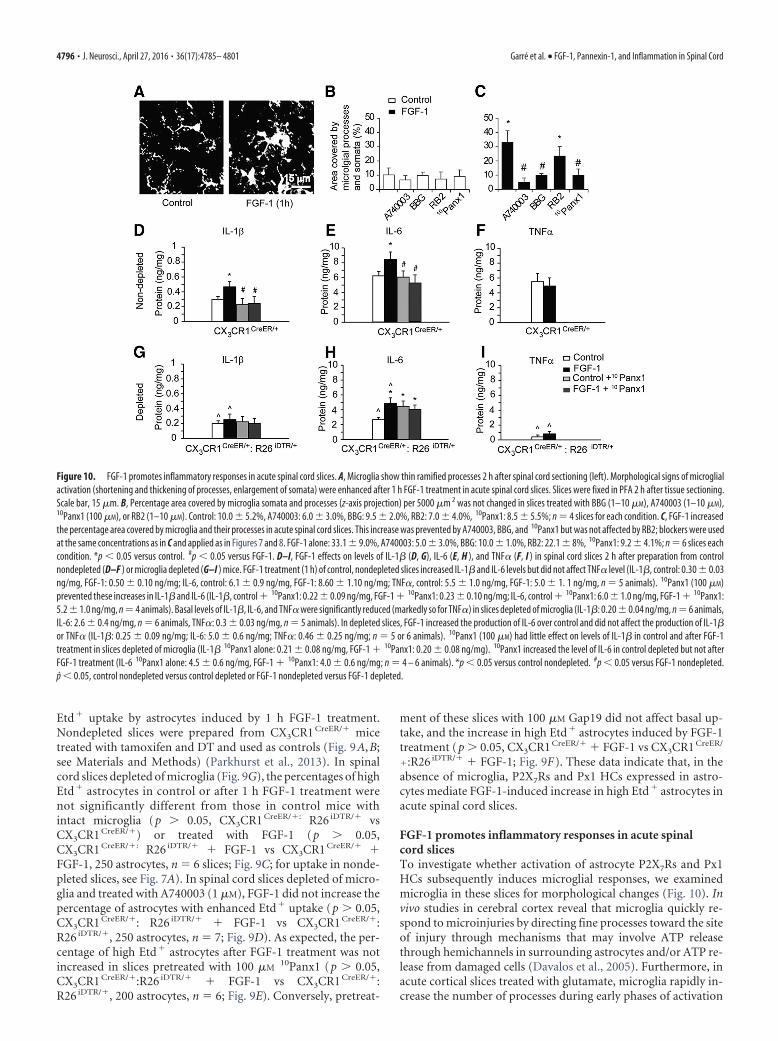
Figure 10. FGF-1 promotes inflammatory responses in acute spinal cord slices. A, Microglia show thin ramified processes 2 h after spinal cord sectioning (left). Morphological signs of microglialactivation (shortening and thickening of processes, enlargement of somata) were enhanced after 1 h FGF-1 treatment in acute spinal cord slices. Slices were fixed in PFA 2 h after tissue sectioning.Scale bar, 15 �m. B, Percentage area covered by microglia somata and processes (z-axis projection) per 5000 �m 2 was not changed in slices treated with BBG (1–10 �M), A740003 (1–10 �M),10Panx1 (100 �M), or RB2 (1–10 �M). Control: 10.0 5.2%, A740003: 6.0 3.0%, BBG: 9.5 2.0%, RB2: 7.0 4.0%, 10Panx1: 8.5 5.5%; n � 4 slices for each condition. C, FGF-1 increasedthe percentage area covered by microglia and their processes in acute spinal cord slices. This increase was prevented by A740003, BBG, and 10Panx1 but was not affected by RB2; blockers were usedat the same concentrations as in C and applied as in Figures 7 and 8. FGF-1 alone: 33.1 9.0%, A740003: 5.0 3.0%, BBG: 10.0 1.0%, RB2: 22.1 8%, 10Panx1: 9.2 4.1%; n � 6 slices eachcondition. *p � 0.05 versus control. #p � 0.05 versus FGF-1. D–I, FGF-1 effects on levels of IL-1� (D, G), IL-6 (E, H ), and TNF� (F, I ) in spinal cord slices 2 h after preparation from controlnondepleted (D–F ) or microglia depleted (G–I ) mice. FGF-1 treatment (1 h) of control, nondepleted slices increased IL-1� and IL-6 levels but did not affect TNF� level (IL-1�, control: 0.30 0.03ng/mg, FGF-1: 0.50 0.10 ng/mg; IL-6, control: 6.1 0.9 ng/mg, FGF-1: 8.60 1.10 ng/mg; TNF�, control: 5.5 1.0 ng/mg, FGF-1: 5.0 1. 1 ng/mg, n � 5 animals). 10Panx1 (100 �M)prevented these increases in IL-1� and IL-6 (IL-1�, control � 10Panx1: 0.22 0.09 ng/mg, FGF-1 � 10Panx1: 0.23 0.10 ng/mg; IL-6, control � 10Panx1: 6.0 1.0 ng/mg, FGF-1 � 10Panx1:5.2 1.0 ng/mg, n � 4 animals). Basal levels of IL-1�, IL-6, and TNF� were significantly reduced (markedly so for TNF�) in slices depleted of microglia (IL-1�: 0.20 0.04 ng/mg, n � 6 animals,IL-6: 2.6 0.4 ng/mg, n � 6 animals, TNF�: 0.3 0.03 ng/mg, n � 5 animals). In depleted slices, FGF-1 increased the production of IL-6 over control and did not affect the production of IL-1�or TNF� (IL-1�: 0.25 0.09 ng/mg; IL-6: 5.0 0.6 ng/mg; TNF�: 0.46 0.25 ng/mg; n � 5 or 6 animals). 10Panx1 (100 �M) had little effect on levels of IL-1� in control and after FGF-1treatment in slices depleted of microglia (IL-1� 10Panx1 alone: 0.21 0.08 ng/mg, FGF-1 � 10Panx1: 0.20 0.08 ng/mg). 10Panx1 increased the level of IL-6 in control depleted but not afterFGF-1 treatment (IL-6 10Panx1 alone: 4.5 0.6 ng/mg, FGF-1 � 10Panx1: 4.0 0.6 ng/mg; n � 4 – 6 animals). *p � 0.05 versus control nondepleted. #p � 0.05 versus FGF-1 nondepleted.p � 0.05, control nondepleted versus control depleted or FGF-1 nondepleted versus FGF-1 depleted.
4796 • J. Neurosci., April 27, 2016 • 36(17):4785– 4801 Garre et al. • FGF-1, Pannexin-1, and Inflammation in Spinal Cord

(Eyo et al., 2015). At the time we detected increased Px1 HCopening in astrocytes after FGF-1 treatment, microglial processesbecame thicker (Fig. 10A). The relative area covered by microglialprocesses in the z-axis projection increased from 10.0 5.2% inthe control condition to 33.1 9.0% after 1 h FGF-1 treatment(p � 0.01 vs control, n � 6; Fig. 10B,C). FGF-1 treatment did notincrease microglial area in slices treated with 1–10 �M A740003(5.0 0.3%, n � 6, p � 0.05 vs FGF-1) or 1–10 �M BBG (10.0 0.1%, n � 6, p � 0.05 vs FGF-1) or 100 �M
10Panx1 (9.2 4.1,n � 6, p � 0.05 vs FGF-1). FGF-1 induced increase in microglialarea was not significantly reduced by 1–10 �M RB2 (22.1 0.8,n � 6, p � 0.05 vs FGF-1). The area of microglia in control sliceswas not significantly different from that in slices treated with theblockers alone (n � 4, p � 0.05 vs control; for numerical values,see Fig. 10 legend). These data indicate that P2X7R activation andPx1 HC opening mediate FGF-1-induced morphological activa-tion of microglia (Px1 expression in microglia is unlikely to me-diate these morphological responses because FGF-1 did notincrease Etd� uptake in these cells; Fig. 6A).
To investigate whether FGF-1 is proinflammatory in spinalcord slices, we measured protein levels of proinflammatorycytokines, IL-1�, IL-6, and TNF�, by using ELISA in controlor after treating spinal cord slices with FGF-1 for 1 h (Fig.10D–I ). IL-1� and IL-6 protein levels were significantly in-creased after 1 h FGF-1 treatment ( p � 0.05 vs control, n � 5animals), whereas TNF� levels were not significantly changedcompared with control slices ( p � 0.05 FGF-1 vs control, n �5 animals). Elevation of IL-1� and IL-6 levels was preventedby pretreatment of slices with 100 �M
10Panx1 ( p � 0.05control � 10Panx1 vs FGF-1 � 10Panx, or p � 0.05 FGF-1alone vs FGF-1 � 10Panx, n � 4 animals for IL-1� and IL-6,respectively; Fig. 10D–F ). 10Panx1 was applied as in Figure 8Aand had no effect on control uptake.
In spinal cord slices depleted of microglia, the basal levels ofIL-1�, IL-6, and TNF� were significantly lower than in nonde-
pleted cords (p � 0.05 vs control nonde-pleted for IL-1�, IL-6, and TNF�, n � 6animals; Fig. 10D–I), indicating that, afteracute tissue sectioning, microglia contrib-ute to the basal production of proinflam-matory cytokines. The decrease was muchgreater for TNF� than for IL-1� and IL-6.Consistent with the contribution of mi-croglia in FGF-1-induced proinflamma-tory responses, FGF-1 treatment of slicesdepleted of microglia did not change lev-els of IL-1� (p � 0.05 vs control depleted,n � 6 animals; Fig. 10G). However, levelsof IL-6 were significantly increased byFGF-1 treatment (p � 0.05 vs control de-pleted, n � 6 animals; Fig. 10H). Thegreatly reduced TNF� levels in the de-pleted mice were not affected by FGF-1treatment (p � 0.05 vs control nonde-pleted, n � 5 animals; Fig. 10I).
Spinal cord slices depleted of microgliaand treated with 10Panx1 (100 �M)showed similar levels of IL-1� in controland after FGF-1 treatment (p � 0.0510Panx1 alone vs FGF-1 � 10Panx1, n � 6animals). 10Panx1 application to slices de-pleted of microglia increased the level ofIL-6 (p � 0.05, control depleted vs
10Panx1 alone or 10Panx1 � FGF-1), and these 10Panx1-treatedslices showed similar levels of IL-6 in control and after FGF-1treatment (p � 0.05, 10Panx1 alone vs FGF-1 � 10Panx1, n � 6animals). These data indicate that microglia contribute to ele-vated IL-1� production after FGF-1 treatment (Fig. 10G–I),whereas FGF-1 increases IL-6 production in the absence of mi-croglia, presumably by elevating astrocyte IL-6 production (Fig.10E,H).
Together, the data presented in this section suggest that FGF-1is proinflammatory in ex vivo spinal cord slices by a process thatinvolves Px1 HC opening in astrocytes.
DiscussionIn this study, we report that FGF-1 mediates rapid opening of Px1HCs in spinal astrocytes in both culture and acute spinal slices.This process depends on intracellular calcium signaling, ATP re-lease, P2X7R activation and opening of Px1 HCs, and contributesto an inflammatory response in spinal cord slices.
Our data show that FGF-1 causes an increase in [Ca 2�]i that isblocked by a PLC inhibitor, suggesting that it is initiated by IP3
generation and Ca 2� release from the ER (Figs. 1, 3E, 11). Theearly rise in [Ca 2�]i presumably mediates vesicular release ofATP, as the permeabilization induced by FGF-1 is blocked bybotulinum toxin A (Garre et al., 2010) and by hydrolyzing extra-cellular ATP (Fig. 4H). The released ATP activates P2X7Rs, whichcan be blocked by BBG and A740003 (two P2X7R antagonists).Activation of P2X7Rs opens Px1 HCs that further enhance ATPrelease and mediate the subsequent plateau phase of elevated[Ca 2�]i, which is associated with increased Etd� uptake. Thecontribution of Px1 to the plateau phase of [Ca 2�]i is indicatedby the absence of this phase in cells transfected with siRNA Px1(Figs. 1D,E, 2C,D).
In spinal astrocytes treated with ATP, P2X7Rs and Px1 HCsalso contribute to increase [Ca 2�]i during the plateau phase(Fig. 2) (North, 2002; Sperlagh and Illes, 2014).
Figure 11. Schematic of early events by which FGF-1 activates proinflammatory responses in astrocytes and microglia. 1, FGF-1released by damaged cells activates astrocyte FGFRs that increase PLC-mediated IP3 signaling and promotes the release of Ca 2�
from the ER. 2, Rise in [Ca 2�]i induces vesicular secretion of ATP. 3, Secreted ATP activates P2X7Rs in astrocytes that open Px1 HCsand promote additional release of ATP. IL-6 is presumably secreted from activated astrocytes. 4, ATP released from astrocytesactivates microglia to secrete IL-1�.
Garre et al. • FGF-1, Pannexin-1, and Inflammation in Spinal Cord J. Neurosci., April 27, 2016 • 36(17):4785– 4801 • 4797

Px1 HC-mediated Etd � uptake and rise in [Ca 2�]i afterFGF-1 treatment were reduced by the PLC blocker U73122(Fig. 3 D, G,H ), indicating that PLC activation links FGFR sig-naling and [Ca 2�]i-dependent permeabilization. Accordingly,FGF-1 induced opening of Px1 HCs was also prevented byBAPTA-AM (Fig. 3 B, F ).
A distinctive property of P2X7Rs is the increase in membranepermeability to large organic molecules and dyes within secondsafter ATP binds to the receptor (North, 2002; Khakh and North,2012). P2X7Rs can over seconds allow larger molecules, such asEtd�, to permeate, which was interpreted as a consequence ofpore dilation by some workers (Yan et al., 2008; Browne et al.,2013). However, others have failed to see P2X7R pore dilation atthe single-channel level (Riedel et al., 2007). An alternative mech-anism to pore dilation was proposed to explain the observedchanges in reversal potential in P2X2Rs, namely, change in ionconcentrations (Li et al., 2015). In our experiments, Etd� uptakeinduced by FGF-1 or BzATP was blocked by siRNA knockdownof Px1 in cultured astrocytes, and FGF-1-induced Etd� uptake incord slices (see below) was blocked by 10Panx1; these data pro-vide strong evidence that Px1 HCs mediate Etd� uptake in spinalastrocytes after P2X7R activation.
As FGF-1 action progresses, a nonvesicular mechanism con-tributes to ATP release (Garre et al., 2010), and changes in[Ca 2�]i are maintained. These processes may continue during2–7 h of FGF-1 treatment (Fig. 5). Opening of both Px1 HCs
(Locovei et al., 2007) and subsequently Cx43 HCs (Kang et al.,2008) would tend to sustain ATP release and Ca 2�.
In acute spinal cord slices, a more physiological preparationthan astrocyte cultures, we found a population of astrocytes ex-hibiting enhanced Etd� uptake after 1 h FGF-1 treatment (Fig.6). The primary cause of the enhanced uptake was the opening ofPx1 HCs, as indicated by block by 10Panx1 but not by Gap19, aselective blocker of Cx43 HCs (Abudara et al., 2014). FGF-1-mediated opening of Px1 HCs in cord slices depends on pathwayssimilar to those described in spinal astrocyte cultures (i.e., intra-cellular calcium signaling), ATP release, and activation ofP2X7Rs. Calcium dependence was confirmed in experimentswith the [Ca�2]i chelator BAPTA-AM or with a PLC inhibitor(Fig. 7A). P2X7Rs are broadly expressed in the normal spinalcord, particularly in microglia and astrocytes (Cotrina and Ned-ergaard, 2009). Expression of P2X7Rs in adult neurons in situ ismore controversial (Oliveira et al., 2011; Yang et al., 2015). TheFGF-1-induced increase in high Etd� astrocytes in ex vivo cordswas reduced at potencies that were much greater for A740003 andBBG than for RB2, suggesting that, among P2XRs, P2X7R is aprimary contributor to the Etd� uptake. Furthermore, FGF-1-induced Etd� uptake was also sensitive to A740003 and 10Panx1in spinal cord slices depleted of microglia, indicating that thisuptake is mediated by P2X7Rs and Px1 HCs expressed by astro-cytes and not microglia. Additional studies will be required todetermine whether ATP release from spinal neurons activates
Figure 12. Possible mechanism whereby astrocyte responses to FGF-1 promote the transition from acute to chronic phases of spinal cord inflammation. 1, After3 h of the initial FGF-1 challenge(see Fig. 11), both Px1 HCs and Cx43 HCs in reactive astrocytes are open, and the self-sustained ATP release is established. 2, ATP stimulation maintains production of IL-1� by microglia and IL-6 byprobably both astrocytes and microglia. 3, IL-1� has detrimental effects on neuronal structure and function. IL-1� may also promote opening of Cx43 HCs in astrocytes and contribute to sustainedATP release. IL-6 may have a dual role in spinal cord inflammation, preventing glutamate-mediated neurotoxicity, or being detrimental if its expression is uncontrolled. 4, Chronically, IL-1� causesvasogenic edema and breakdown of the blood-spinal cord barrier and favors recruitment into the spinal cord of bone marrow-derived immune cells (such as neutrophils, monocytes, and T cells). Atthe site of injury, released ATP and extracellular accumulation of glutamate may directly act as neurotoxic factors. Furthermore, a distinct population of astrocytes (scar-forming astrocytes),microglia/macrophages, and recruited immune cells promote and elevate the production of inflammatory mediators that regulate the expansion of tissue damage and further contribute to neuronaldysfunction. In summary, FGF-1-induced ATP release mediated by both Px1 and Cx43 HCs may play an important role regulating these inflammatory responses after spinal cord injury.
4798 • J. Neurosci., April 27, 2016 • 36(17):4785– 4801 Garre et al. • FGF-1, Pannexin-1, and Inflammation in Spinal Cord

P2X7R- and Px1 HC-mediated ATP release from astrocytes dur-ing inflammation, although this process may be more relevantunder physiological conditions. In contrast, cortical astrocytesdid not increase Etd� uptake in response to FGF-1, suggestingthat the effect of FGF-1 may be specific to the spinal cord andrelevant in spinal cord inflammation.
Microglia play an important role in regulating innate immuneresponses in CNS (Prinz and Priller, 2014). LPS-induced inflam-matory responses of microglia cause Cx43 HC opening in astro-cytes in acute hippocampal slices, and the effect of LPS is blockedby minocycline (Abudara et al., 2015). FGF-1-induced Px1 HCopening in spinal astrocytes does not require microglia (Fig. 7C),and further studies will determine whether proinflammatory cy-tokines released by microglia contribute to the delayed Cx43 HCopening. For instance, Px1 HC-mediated ATP release increasesthe production of IL-1� by microglia (Fig. 10) that hours later(3 h in slices, 24 h in cultures) opens Cx43 HCs in astrocytes(Retamal et al., 2007; Orellana et al., 2011; Abudara et al., 2015)that would sustain ATP release (Figs. 11, 12).
At least partial activation of microglia and astrocytes resultsfrom slice preparation (Brockhaus et al., 1996; Takano et al.,2014). Nevertheless, FGF-1 caused an increase in the area (of az-axis projection) of microglia, a morphological criterion of ac-tivation (Fig. 10) (Yang et al., 2013; Eyo et al., 2015). This re-sponse was prevented by blocking Px1 HC-mediated ATP releasewith P2X7R antagonists and 10Panx1. FGF-1-induced Px1 HCopening in astrocytes led to increased production of IL-1� andIL-6 that were reduced by treatment of slices with 10Panx1. Fur-thermore, FGF-1 increased the production of IL-6 (but not IL-1�) in absence of microglia (Fig. 10).
There is evidence that IL-1� can be detrimental to the CNS. Incultured hippocampal neurons, IL-1� enhances NMDA-mediated neurotoxicity (Viviani et al., 2003) and in vivo it hasbeen shown to be the primary mediator of vasogenic edema inischemic injury (Basu et al., 2005). Furthermore, IL-1� impairsneuronal signaling in vitro by suppressing BDNF-dependent syn-aptic plasticity (Tong et al., 2012) and, in vivo, may decreaseformation of new dendritic spines induced by microglia-derivedBDNF (Parkhurst et al., 2013). In contrast to IL-1�, IL-6 mayhave a dual role in CNS, preventing tissue damage and protectingdifferent populations of neurons against excitotoxicity, or beingdetrimental if chronically upregulated (Spooren et al., 2011).
Furthermore, extracellular accumulation of ATP and gluta-mate have been shown to act directly on neurons and decreasesurvival in vitro (Freitas-Andrade and Naus, 2015).
We expect that both Px1 HCs and Cx43 HCs expressed inastrocytes contribute to the FGF-1-induced responses in vivo,although the time course might differ from that in cultures oracute slices. Previous studies have shown that A740003 reducestactile sensation during neuropathic chronic pain (Donnelly-Roberts et al., 2009). Furthermore, P2X7Rs contribute to the earlyinflammatory phase of the response to traumatic injury of thespinal cord (Wang et al., 2004). As shown here, activation of thesereceptors by ATP leads to opening of Px1 HCs and release offurther ATP (e.g., Locovei et al., 2007; Suadicani et al., 2012).Moreover, ATP released through Px1 HCs can act as a “find mesignal” that recruits phagocytes to apoptotic cells (Chekeni et al.,2010). Interestingly, Px1 KO mice exhibit delayed onset of clini-cal signs of EAE, although in this case a putative compensatoryupregulation of P2X7Rs is observed later in the disease (Lutz et al.,2013). Moreover, ATP release shortly after traumatic injury of thespinal cord is decreased in mice with conditional KO of Cx43 inastroctyes (Huang et al., 2012). However, it is not clear whether
Cx43 acts as HCs, GJ channels, or both in promoting ATP release,or whether Px1 expression is downregulated in these mice. ATPmay directly activate microglia (Davalos et al., 2005; Kim andDustin, 2006) or favor monocyte recruitment into the brain byinducing the release of chemo-attractant chemokines from astro-cytes (Sofroniew, 2015) through P2X7-dependent pathways(Tewari et al., 2015). Furthermore, ATP released through Px1HCs in endothelial cells during vascular inflammation regulatesthe recruitment of leukocytes into inflamed tissues (Lohman etal., 2015).
In conclusion, FGF-1 initiates a regenerative process of ATPrelease, initially through calcium-dependent mechanisms andsubsequently mediated by P2X7Rs and Px1 HCs. As we showedearlier, Cx43 HCs can contribute later in the inflammatory pro-cess (Fig. 12). Responses of spinal astrocytes to FGF-1 can con-tribute to an inflammatory milieu that increases microglialresponses and favors the recruitment of peripheral immune cellsand impacts negatively on neuronal structure and function.
ReferencesAbudara V, Bechberger J, Freitas-Andrade M, De Bock M, Wang N, Bultynck
G, Naus CC, Leybaert L, Giaume C (2014) The connexin43 mimeticpeptide Gap19 inhibits hemichannels without altering gap junctionalcommunication in astrocytes. Front Cell Neurosci 8:306. CrossRefMedline
Abudara V, Roux L, Dallerac G, Matias I, Dulong J, Mothet JP, Rouach N,Giaume C (2015) Activated microglia impairs neuroglial interaction byopening Cx43 hemichannels in hippocampal astrocytes. Glia 63:795– 811.CrossRef Medline
Basu A, Lazovic J, Krady JK, Mauger DT, Rothstein RP, Smith MB, LevisonSW (2005) Interleukin-1 and the interleukin-1 type 1 receptor are essen-tial for the progressive neurodegeneration that ensues subsequent to amild hypoxic/ischemic injury. J Cereb Blood Flow Metab 25:17–29.CrossRef Medline
Bennett MV, Contreras JE, Bukauskas FF, Saez JC (2003) New roles forastrocytes: gap junction hemichannels have something to communicate.Trends Neurosci 26:610 – 617. CrossRef Medline
Brockhaus J, Moller T, Kettenmann H (1996) Phagocytozing ameboid mi-croglial cells studied in a mouse corpus callosum slice preparation. Glia16:81–90. CrossRef Medline
Brown KJ, Hendry IA, Parish CR (1995) Acidic and basic fibroblast growthfactor bind with differing affinity to the same heparin sulfate proteoglycanon BALB/c 3T3 cells: implications for potentiation of growth factor actionby heparin. J Cell Biochem 58:6 –14. CrossRef Medline
Browne LE, Compan V, Bragg L, North RA (2013) P2X7 receptor channelsallow direct permeation of nanometer-sized dyes. J Neurosci 33:3557–3566. CrossRef Medline
Bruzzone R, Hormuzdi SG, Barbe MT, Herb A, Monyer H (2003) Pannex-ins, a family of gap junction proteins expressed in brain Proc Natl Acad SciU S A 100:13644 –13649.
Bruzzone R, Barbe MT, Jakob NJ, Monyer H (2005) Pharmacological prop-erties of homomeric and heteromeric pannexin hemichannels expressedin Xenopus oocytes. J Neurochem 92:1033–1043. CrossRef Medline
Buch T, Heppner FL, Tertilt C, Heinen TJ, Kremer M, Wunderlich FT, Jung S,Waisman A (2005) A Cre-inducible diphtheria toxin receptor mediatescell lineage ablation after toxin administration. Nat Methods 2:419 – 426.CrossRef Medline
Bunney TD, Esposito D, Mas-Droux C, Lamber E, Baxendale RW, Martins M,Cole A, Svergun D, Driscoll PC, Katan M (2012) Structural and func-tional integration of the PLC� interaction domains critical for regulatorymechanisms and signaling deregulation. Structure 20:2062–2075.CrossRef Medline
Cassina P, Pehar M, Vargas MR, Castellanos R, Barbeito AG, Estevez AG,Thompson JA, Beckman JS, Barbeito L (2005) Astrocyte activation byfibroblast growth factor-1 and motor neuron apoptosis: implications foramyotrophic lateral sclerosis. J Neurochem 93:38 – 46. CrossRef Medline
Charles AC, Merrill JE, Dirksen ER, Sanderson MJ (1991) Intercellular sig-naling in glial cells: calcium waves and oscillations in response to mechan-ical stimulation and glutamate. Neuron 6:983–992. CrossRef Medline
Chekeni FB, Elliott MR, Sandilos JK, Walk SF, Kinchen JM, Lazarowski ER,
Garre et al. • FGF-1, Pannexin-1, and Inflammation in Spinal Cord J. Neurosci., April 27, 2016 • 36(17):4785– 4801 • 4799
Armstrong AJ, Penuela S, Laird DW, Salvesen GS, Isakson BE, Bayliss DA,Ravichandran KS (2010) Pannexin 1 channels mediate ‘find-me’ signalrelease and membrane permeability during apoptosis. Nature 467:863– 867. CrossRef Medline
Contreras JE, Sanchez HA, Eugenin EA, Speidel D, Theis M, Willecke K,Bukauskas FF, Bennett MV, Saez JC (2002) Metabolic inhibition in-duces opening of unapposed connexin 43 gap junction hemichannels andreduces gap junctional communication in cortical astrocytes in culture.Proc Natl Acad Sci U S A 99:495–500. CrossRef Medline
Contreras JE, Saez JC, Bukauskas FF, Bennett MV (2003) Gating and regu-lation of connexin 43 (Cx43) hemichannels. Proc Natl Acad Sci U S A100:11388 –11393. CrossRef Medline
Cornell-Bell AH, Finkbeiner SM, Cooper MS, Smith SJ (1990) Glutamateinduces calcium waves in cultured astrocytes: long-range glial signaling.Science 247:470 – 473. CrossRef Medline
Cotrina ML, Nedergaard M (2009) Physiological and pathological func-tions of P2X7 receptor in the spinal cord. Purinergic Signal 5:223–232.CrossRef Medline
Davalos D, Grutzendler J, Yang G, Kim JV, Zuo Y, Jung S, Littman DR, DustinML, Gan WB (2005) ATP mediates rapid microglial response to localbrain injury in vivo. Nat Neurosci 8:752–758. CrossRef Medline
Donnelly-Roberts DL, Namovic MT, Han P, Jarvis MF (2009) MammalianP2X7 receptor pharmacology: comparison of recombinant mouse, ratand human P2X7 receptors Br J Pharmacol 157:1203–1214. CrossRefMedline
Eyo UB, Gu N, De S, Dong H, Richardson JR, Wu LJ (2015) Modulation ofmicroglial process convergence toward neuronal dendrites by extracellu-lar calcium. J Neurosci 35:2417–2422. CrossRef Medline
Fischer W, Norenberg W, Franke H, Schaefer M, Illes P (2009) Increase ofintracellular Ca 2� by P2Y but not P2X receptors in cultured corticalmultipolar neurons of the rat. J Comp Neurol 516:343–359. CrossRefMedline
Freitas-Andrade M, Naus CC (2015) Astrocytes in neuroprotection andneurodegeneration: the role of connexin43 and pannexin1. Neurosci-ence. Advance online publication. Retrieved Apr. 23, 2015. doi: 10.1016/j.neuroscience.2015.04.035. CrossRef Medline
Garre JM, Retamal MA, Cassina P, Barbeito L, Bukauskas FF, Saez JC, BennettMV, Abudara V (2010) FGF-1 induces ATP release from spinal astro-cytes in culture and opens pannexin and connexin hemichannels. ProcNatl Acad Sci U S A 107:22659 –22664. CrossRef Medline
Guthrie PB, Knappenberger J, Segal M, Bennett MV, Charles AC, Kater SB(1999) ATP released from astrocytes mediates glial calcium waves. J Neu-rosci 19:520 –528. Medline
Hassinger TD, Guthrie PB, Atkinson PB, Bennett MV, Kater SB (1996) Anextracellular signaling component in propagation of astrocytic calciumwaves. Proc Natl Acad Sci U S A 93:13268 –13273. CrossRef Medline
Hong JH, Moon SJ, Byun HM, Kim MS, Jo H, Bae YS, Lee SI, Bootman MD,Roderick HL, Shin DM, Seo JT (2006) Critical role of phospholipase Cgamma1 in the generation of H2O2-evoked [Ca 2�]i oscillations in cul-tured rat cortical astrocytes. J Biol Chem 281:13057–13067. CrossRefMedline
Honore P, Donnelly-Roberts D, Namovic MT, Hsieh G, Zhu CZ, Mikusa JP,Hernandez G, Zhong C, Gauvin DM, Chandran P, Harris R, Medrano AP,Carroll W, Marsh K, Sullivan JP, Faltynek CR, Jarvis MF (2006)A-740003 [N-(1-{[(cyanoimino)(5-quinolinylamino) methyl]amino}-2,2-dimethylpropyl)-2-(3,4-dimethoxyphenyl)acetamide], a novel andselective P2X7 receptor antagonist, dose-dependently reduces neuro-pathic pain in the rat. J Pharmacol Exp Ther 319:1376 –1385. CrossRefMedline
Huang C, Han X, Li X, Lam E, Peng W, Lou N, Torres A, Yang M, Garre JM,Tian GF, Bennett MV, Nedergaard M, Takano T (2012) Critical role ofconnexin 43 in secondary expansion of traumatic spinal cord injury.J Neurosci 32:3333–3338. CrossRef Medline
Ji RR, Berta T, Nedergaard M (2013) Glia and pain: is chronic pain a gliopa-thy? Pain 154 [Suppl]:S10 –S28.
Jung S, Aliberti J, Graemmel P, Sunshine MJ, Kreutzberg GW, Sher A, Litt-man DR (2000) Analysis of fractalkine receptor CX(3)CR1 function bytargeted deletion and green fluorescent protein reporter gene insertion.Mol Cell Biol 20:4106 – 4114. CrossRef Medline
Kang J, Kang N, Lovatt D, Torres A, Zhao Z, Lin J, Nedergaard M (2008)Connexin 43 hemichannels are permeable to ATP. J Neurosci 28:4702–4711. CrossRef Medline
Kang W, Balordi F, Su N, Chen L, Fishell G, Hebert JM (2014) Astrocyteactivation is suppressed in both normal and injured brain by FGF signal-ing. Proc Natl Acad Sci U S A 111:2987–2995. CrossRef Medline
Khakh BS, North RA (2012) Neuromodulation by extracellular ATP andP2X receptors in the CNS. Neuron 76:51– 69. CrossRef Medline
Khakh BS, Sofroniew MV (2015) Diversity of astrocyte functions and phe-notypes in neural circuits. Nat Neurosci 18:942–952. CrossRef Medline
Kim JV, Dustin ML (2006) Innate response to focal necrotic injury insidethe blood– brain barrier. J Immunol 177:5269 –5277. CrossRef Medline
Lai CP, Bechberger JF, Thompson RJ, MacVicar BA, Bruzzone R, Naus CC(2007) Tumor-suppressive effects of pannexin 1 in C6 glioma cells. Can-cer Res 67:1545–1554. CrossRef Medline
Lee J, Blaber M (2009) The interaction between thermodynamic stabilityand buried free cysteines in regulating the functional half-life of fibroblastgrowth factor-1. J Mol Biol 393:113–127. CrossRef Medline
Lee M, Kang Y, Suk K, Schwab C, Yu S, McGeer PL (2011) Acidic fibroblastgrowth factor (FGF) potentiates glial-mediated neurotoxicity by activat-ing FGFR2 IIIb protein. J Biol Chem 286:41230 – 41245. CrossRefMedline
Li M, Toombes GE, Silberberg SD, Swartz KJ (2015) Physical basis of appar-ent pore dilation of ATP-activated P2X receptor channels. Nat Neurosci18:1577–1583. CrossRef Medline
Locovei S, Bao L, Dahl G (2006) Pannexin 1 in erythrocytes: function with-out a gap. Proc Natl Acad Sci U S A 103:7655–7659. CrossRef Medline
Locovei S, Scemes E, Qiu F, Spray DC, Dahl G (2007) Pannexin1 is part ofthe pore forming unit of the P2X(7) receptor death complex. FEBS Lett581:483– 488. CrossRef Medline
Lohman AW, Leskov IL, Butcher JT, Johnstone SR, Stokes TA, Begandt D,DeLalio LJ, Best AK, Penuela S, Leitinger N, Ravichandran KS, Stokes KY,Isakson BE (2015) Pannexin 1 channels regulate leukocyte emigrationthrough the venous endothelium during acute inflammation. Nat Com-mun 6:7965. CrossRef Medline
Lutz SE, Gonzalez-Fernandez E, Ventura JC, Perez-Samartín A, Tarassishin L,Negoro H, Patel NK, Suadicani SO, Lee SC, Matute C, Scemes E (2013)Contribution of pannexin1 to experimental autoimmune encephalomy-elitis. PLoS One 8:e66657. CrossRef Medline
Morita M, Higuchi C, Moto T, Kozuka N, Susuki J, Itofusa R, Yamashita J,Kudo Y (2003) Dual regulation of calcium oscillation in astrocytes bygrowth factors and pro-inflammatory cytokines via the mitogen-activated protein kinase cascade. J Neurosci 23:10944 –10952. Medline
Nedergaard M (1994) Direct signaling from astrocytes to neurons in cul-tures of mammalian brain cells. Science 263:1768 –1771. CrossRefMedline
North RA (2002) Molecular physiology of P2X receptors. Physiol Rev 82:1013–1067. CrossRef Medline
Oliveira JF, Riedel T, Leichsenring A, Heine C, Franke H, Krugel U, Noren-berg W, Illes P (2011) Rodent cortical astroglia express in situ functionalP2X7 receptors sensing pathologically high ATP concentrations. CerebCortex 21:806 – 820. CrossRef Medline
Orellana JA, Shoji KF, Abudara V, Ezan P, Amigou E, Saez PJ, Jiang JX, NausCC, Saez JC, Giaume C (2011) Amyloid �-induced death in neuronsinvolves glial and neuronal hemichannels. J Neurosci 31:4962– 4977.CrossRef Medline
Parkhurst CN, Yang G, Ninan I, Savas JN, Yates JR 3rd, Lafaille JJ, HempsteadBL, Littman DR, Gan WB (2013) Microglia promote learning-dependent synapse formation through brain-derived neurotrophic fac-tor. Cell 155:1596 –1609. CrossRef Medline
Pelegrin P, Surprenant A (2006) Pannexin-1 mediates large pore formationand interleukin-1beta release by the ATP-gated P2X7 receptor. EMBOJ 25:5071–5082. CrossRef Medline
Prinz M, Priller J (2014) Microglia and brain macrophages in the molecularage: from origin to neuropsychiatric disease. Nat Rev Neurosci 15:300 –312. CrossRef Medline
Retamal MA, Froger N, Palacios-Prado N, Ezan P, Saez PJ, Saez JC, Giaume C(2007) Cx43 hemichannels and gap junction channels in astrocytes areregulated oppositely by proinflammatory cytokines released from acti-vated microglia. J Neurosci 27:13781–13792. CrossRef Medline
Reuss B, von Bohlen und Halbach O (2003) Fibroblast growth factors andtheir receptors in the central nervous system. Cell Tissue Res 313:139 –157. CrossRef Medline
RiedelT,SchmalzingG,MarkwardtF (2007) Influenceofextracellularmonovalent
4800 • J. Neurosci., April 27, 2016 • 36(17):4785– 4801 Garre et al. • FGF-1, Pannexin-1, and Inflammation in Spinal Cord

cations on pore and gating properties of P2X7 receptor-operated single-channelcurrents. Biophys J 93:846–858. CrossRef Medline
Sahu G, Sukumaran S, Bera AK (2014) Pannexins form gap junctions withelectrophysiological and pharmacological properties distinct from con-nexins. Sci Rep 4:4955. CrossRef Medline
Scemes E, Giaume C (2006) Astrocyte calcium waves: what they are andwhat they do. Glia 54:716 –725. CrossRef Medline
Scemes E, Suadicani SO, Spray DC (2000) Intercellular communication inspinal cord astrocytes: fine tuning between gap junctions and P2 nucleo-tide receptors in calcium wave propagation. J Neurosci 20:1435–1445.Medline
Sofroniew MV (2015) Astrocyte barriers to neurotoxic inflammation. NatRev Neurosci 16:249 –263. CrossRef Medline
Sperlagh B, Illes P (2014) P2X7 receptor: an emerging target in central ner-vous system diseases. Trends Pharmacol Sci 35:537–547. CrossRefMedline
Spooren A, Kolmus K, Laureys G, Clinckers R, De Keyser J, Haegeman G,Gerlo S (2011) Interleukin-6, a mental cytokine. Brain Res Rev 67:157–183. CrossRef Medline
Suadicani SO, Iglesias R, Wang J, Dahl G, Spray DC, Scemes E (2012) ATPsignaling is deficient in cultured pannexin1-null mouse astrocytes. Glia60:1106 –1116. CrossRef Medline
Takano T, He W, Han X, Wang F, Xu Q, Wang X, Oberheim Bush NA, CruzN, Dienel GA, Nedergaard M (2014) Rapid manifestation of reactiveastrogliosis in acute hippocampal brain slices. Glia 62:78 –95. CrossRefMedline
Tashiro A, Goldberg J, Yuste R (2002) Calcium oscillations in neocorticalastrocytes under epileptiform conditions. J Neurobiol 50:45–55. CrossRefMedline
Tewari M, Monika, Varghse RK, Menon M, Seth P (2015) Astrocytes medi-ate HIV-1 Tat-induced neuronal damage via ligand-gated ion channelP2X7R. J Neurochem 132:464 – 476. CrossRef Medline
Tong L, Prieto GA, Kramar EA, Smith ED, Cribbs DH, Lynch G, Cotman CW
(2012) Brain-derived neurotrophic factor-dependent synaptic plasticityis suppressed by interleukin-1� via p38 mitogen-activated protein kinase.J Neurosci 32:17714 –17724. CrossRef Medline
Venance L, Stella N, Glowinski J, Giaume C (1997) Mechanism involved ininitiation and propagation of receptor-induced intercellular calcium sig-naling in cultured rat astrocytes. J Neurosci 17:1981–1992. Medline
Viviani B, Bartesaghi S, Gardoni F, Vezzani A, Behrens MM, Bartfai T,Binaglia M, Corsini E, Di Luca M, Galli CL, Marinovich M (2003)Interleukin-1� enhances NMDA receptor-mediated intracellular calciumincrease through activation of the Src family of kinases. J Neurosci 23:8692– 8700. Medline
Wang X, Arcuino G, Takano T, Lin J, Peng WG, Wan P, Li P, Xu Q, Liu QS,Goldman SA, Nedergaard M (2004) P2X7 receptor inhibition improvesrecovery after spinal cord injury. Nat Med 10:821– 827. CrossRef Medline
Xia X, Babcock JP, Blaber SI, Harper KM, Blaber M (2012) Pharmacokineticproperties of 2nd-generation fibroblast growth factor-1 mutants for ther-apeutic application PLoS One 7:e48210. CrossRef
Yan Z, Li S, Liang Z, Tomic M, Stojilkovic SS (2008) The P2X7 receptorchannel pore dilates under physiological ion conditions. J Gen Physiol132:563–573. CrossRef Medline
Yang G, Parkhurst CN, Hayes S, Gan WB (2013) Peripheral elevation ofTNF-� leads to early synaptic abnormalities in the mouse somatosensorycortex in experimental autoimmune encephalomyelitis. Proc Natl AcadSci U S A 110:10306 –10311. CrossRef Medline
Yang Y, Li H, Li TT, Luo H, Gu XY, Lu N, Ji RR, Zhang YQ (2015) Delayedactivation of spinal microglia contributes to the maintenance of bonecancer pain in female Wistar rats via P2X7 receptor and IL-18. J Neurosci35:7950 –7963. CrossRef Medline
Zakrzewska M, Wiedlocha A, Szlachcic A, Krowarsch D, Otlewski J, Olsnes S(2009) Increased protein stability of FGF-1 can compensate for its re-duced affinity for heparin. J Biol Chem 284:25388 –25403. CrossRefMedline
Garre et al. • FGF-1, Pannexin-1, and Inflammation in Spinal Cord J. Neurosci., April 27, 2016 • 36(17):4785– 4801 • 4801