cellular/molecular intensityinvariantdynamicsandodor
TRANSCRIPT

Cellular/Molecular
Intensity Invariant Dynamics and Odor-Specific Latencies inOlfactory Receptor Neuron Response
Carlotta Martelli,1 John R. Carlson,1 and Thierry Emonet1,2
Departments of 1Molecular, Cellular, and Developmental Biology and 2Physics, Yale University, New Haven, Connecticut 06520-8103
Odors elicit spatiotemporal patterns of activity in the brain. Spatial patterns arise from the specificity of the interaction between odorantsand odorant receptors expressed in different olfactory receptor neurons (ORNs), but the origin of temporal patterns of activity and theirrole in odor coding remain unclear. We investigate how physiological aspects of ORN response and physical aspects of odor stimuli giverise to diverse responses in Drosophila ORNs. We show that odor stimuli have intrinsic dynamics that depend on odor type and stronglyaffect ORN response. Using linear–nonlinear modeling to remove the contribution of the stimulus dynamics from the ORN dynamics, westudy the physiological properties of the response to different odorants and concentrations. For several odorants and receptor types, theORN response dynamics normalized by the peak response are independent of stimulus intensity for a large portion of the dynamic rangeof the neuron. Adaptation to a background odor changes the gain and dynamic range of the response but does not affect normalizedresponse dynamics. Stimulating ORNs with various odorants reveals significant odor-dependent delays in the ORN response functions.However, these differences can be dominated by differences in stimulus dynamics. In one case the response of one ORN to two odorantsis predicted solely from measurements of the odor signals. Within a large portion of their dynamic range, ORNs can capture informationabout stimulus dynamics independently from intensity while introducing odor-dependent delays. How insects might use odor-specificstimulus dynamics and ORN dynamics in discrimination and navigation tasks remains an open question.
IntroductionInsects and vertebrates olfactory receptor neurons (ORNs) proj-ect to segregated regions of the brain called glomeruli, in whichthey make synaptic connections with second-order neurons ac-cording to the odorant receptor they express (Su et al., 2009).Most odorants elicit distinct patterns of activity in the populationof ORNs and in the glomeruli, suggesting that odors are encodedin spatial combinatorial maps (Malnic et al., 1999; Duchamp-Viret et al., 2000; Hallem and Carlson, 2006).
In locusts, flies, and moths, odor-evoked firing patterns areorganized not only in space but also in time (Stopfer et al., 2003;Daly et al., 2004; Lei et al., 2004; Wilson et al., 2004). Fruit flieswith only one functional class of ORNs can discriminate betweenodors (DasGupta and Waddell, 2008). These and other studies invertebrates (Mozell, 1964b; Friedrich and Laurent, 2001; Spors etal., 2006; Schaefer and Margrie, 2007; Junek et al., 2010; Smear etal., 2011) suggested that information about odor stimuli might be
encoded in temporal patterns in addition to spatial patterns ofneural activity. In the locust, independent information aboutidentity and intensity of odor stimuli can be extracted from theanalysis of spatiotemporal patterns of activity of projection neu-rons (PNs; the neural targets of ORN) (Stopfer et al., 2003), evenin the presence of temporally structured stimuli (Brown et al.,2005). Temporally diverse PN responses likely originate fromtemporally diverse ORN responses (Raman et al., 2010), raisingthe question of what determines the dynamics of the ORNresponses.
In Drosophila, the diversity of ORN response dynamics hasbeen attributed to the kinetics of interaction between odorantsand receptors (Hallem and Carlson, 2006; Nagel and Wilson,2011). However, characterization of the ORN response dynamicshas been complicated by their dependency on odor concentra-tion (Hallem and Carlson, 2006). Moreover, with few exceptions(Nagel and Wilson, 2011), previous studies have assumed thatstimulus dynamics are independent of odor identity, but recentresults show that response dynamics to a mixture of excitatoryand inhibitory odorants might be affected by the odor-specificdynamics of the stimulus itself (Su et al., 2011) and depend onodor-dependent physico-chemical processes (Andersson et al.,2012). Hence, odor-receptor identity, odorant concentration,and odor-specific stimulus dynamics may all contribute to ORNresponse dynamics.
We combined single-sensillum recordings from the fly anten-nae and maxillary palps with direct measurements of the time-dependent concentration of the odor. To separate physiologicalaspects of ORN response from physical aspect of the odor-dependent stimulus dynamics, we used linear–nonlinear (LN)
Received Jan. 30, 2012; revised Feb. 12, 2013; accepted Feb. 22, 2013.Author contributions: C.M. and T.E. designed research; C.M. performed research; C.M. and T.E. analyzed data;
C.M., J.R.C., and T.E. wrote the paper.This work was supported by research awards from the Whitehall Foundation and the Raymond and Beverley
Sackler Institute for Biological, Physical, and Engineering Sciences (T.E.) and National Institutes of Health grants(J.C.). We thank D. Mathew for help with electrophysiology, P. van Tassel, C. Crews, J. Gustafson, and E. Paulson fordiscussions about odorant surface interactions and chemistry, C. Su for the w;UAS–rpr;Or22a–GAL4 line, S. Gorur-Shandilya for help with data analysis, T. Mora and members of the Emonet and Carlson laboratories for discussion, R.Alexander, A. Bernacchia, D. Clark, K. Nagel, K. Dave, and R. Wilson for critical reading of this manuscript.
The authors declare no competing financial interests.Correspondence should be addressed to Thierry Emonet, Yale University, 219 Prospect Street, PO Box 208103,
New Haven, CT 06520-8103. E-mail: [email protected]:10.1523/JNEUROSCI.0426-12.2013
Copyright © 2013 the authors 0270-6474/13/336285-13$15.00/0
The Journal of Neuroscience, April 10, 2013 • 33(15):6285– 6297 • 6285

modeling. We found that, for a large portion of the ORN dynamicrange, response dynamics tend to be phasic and independent ofstimulus and background intensities. Near the bottom of the dy-namic range, ORN response dynamics tend to be more tonic buttransition to phasic as odor concentration is increased. Saturatingstimuli tend to elicit prolonged responses. Removal of stimulusdynamics from ORN response revealed that different odorantsinduce different response delays (up to 18 ms in our dataset) andonly marginally affect the shape of the response function.
Materials and MethodsFly stocks. Recordings from the ORNs ab3A, ab2A, ab7A, and pb1A wereperformed on adult female Canton-S flies 5 d after eclosion. To facilitatesorting of ab3B spikes, we killed the ab3A neuron by expressing UAS–reaper (w; UAS–rpr; Or22a–GAL4 ) (Su et al., 2011); recordings wereperformed on adult females flies 7 d after eclosion.
Electrophysiology. Single sensillum recordings were performed as de-scribed previously (de Bruyne et al., 2001). Electrical signal was amplifiedusing an Iso-DAM amplifier (World Precision Instruments), bandpassfiltered (300 Hz to 2kHz), digitized at 10 kHz (NI-USB6221 digital ac-quisition board), and acquired in LabView. Spikes were sorted using acustom MATLAB routine.
Odor delivery. All odor dilutions were prepared in paraffin oil (volu-metric ratio). (1) For single puffs (see Figs. 1, 3, 5), as described previ-ously (de Bruyne et al., 2001), 50 �l of odor dilution was placed in a paperfilter contained in a Pasteur pipette; a three-way solenoid valve redirectedan airstream (3 ml/s) through the pipette that was manually placed into ahole on the side of the main delivery tube in which a clean airstream (30ml/s) was continuously running (see Fig. 1a). This setup allows the de-livery of multiple concentrations of odor on the same neuron. When thephotoionization detector (PID) was not used, the main airstream washumidified by passing it through a bottle containing distilled water. (2)For random stimulation (see Figs. 7-9), 20 ml of odor dilution wereplaced in a bottle (100 ml). A small three-way solenoid valve (The LeeCompany) was placed in a hole on the side of the main delivery tube andwas used to redirect the odor airstream from the exhaust to the deliverytube. Before starting recordings, the odor bottle was placed in the setupfor 10 –15 min to let the odor gas-phase reach equilibrium. We used amagnetic stirrer to facilitate equilibration of the liquid-phase prepara-tion. A new solenoid valve was used for each odor. (3) For adaptation toa background (see Fig. 4), a constant background was delivered throughthe bottle into the main airstream, and puffs of increasing concentrationwere delivered through the Pasteur pipette as described above. Note thatodor dilutions prepared in the Pasteur pipette do not result in the samegas-phase concentration as odor dilution prepared in the bottle. Formethyl butyrate, the secondary airstream was 3 ml/s, and different back-ground intensities were obtained with different dilutions of odor in par-affin oil (10 �4, 3 � 10 �4, 10 �3). For ethyl acetate, we used two dilutions(10 �2, 10 �3), but we observed a slow drift in the background intensitydue to the slow depletion of odor concentration in the bottle. The drift isnot significant within a trial but becomes significant when comparingdifferent trials. Therefore, for the data analysis of Figure 4, we groupedthe available trials based on PID measurements of the background stim-ulus. For ethyl butyrate, we used a fixed dilution (10 �5) and changed thesecondary flow rate to obtain different background intensities (0.5 and1.2 ml/s). A lower flow rate allows maintaining a stable background forlonger time. We checked that the specific method used to change thebackground intensity does not affect the results. (4) “Natural” stimuliused for Figure 2 were generated as depicted in Figure 2, a and b.
PID measurements. A fast-response mini-PID (200a; Aurora Scien-tific) was used to measure gas-phase concentration of the odor stimuli(Vetter et al., 2006; Schuckel et al., 2008). Linearity of the PID responsewas tested using a tracer gas (propylene). Timescales plotted in Figures 1and 2 were obtained by fitting Aon, off e�t/�on, off � Aon, off
1 e�t/�on, off1
to therising and decaying phase of the PID traces. The first exponential cap-tures the amplitude and the speed of the response to a change in stimulus,and the corresponding parameters have been plotted in Figures 1 and 2.
The second exponential has a much smaller amplitude (A 1 �� A) and aslower timescale (� 1 �� �).
Data analyses. Data analysis was performed in MATLAB. Unless oth-erwise specified, peristimulus time histograms (PSTH) were calculated asthe average firing rate across n trials in 10 ms bins smoothed by a 50 mssquared window (n � 10 –12 trials). PID measurements were averaged inthe same way (n � 4 –12 trials). For normalized responses, basal activity(mean activity in 1 s before stimulus) was subtracted before dividing bypeak response. In Figure 3e, for each odor–receptor combination, weconsidered all the trials (n � 10 –12) and three dilutions within thedynamic range. We defined rid(t) as the normalized time-dependentresponse of neuron i to concentration d and calculated the variancebetween different trials averaged over all the dilutions as Ptrial ����(rid(t) � �rid(t)�i)
2�i�t�d and the variance between different dilutions av-eraged over all trials as Pdil � ���(rid(t) � �rid(t)�d) 2�d�t�i. In Figure 6, ab3Afiring rate was normalized, and the first 3 s after the stimulus onset wereconsidered for the analysis. Each time bin corresponds to a dimension,and the time-dependent firing rate for each odor represents a point in ann-dimensional space (n � 301 time bins). Principal component analysis(PCA) was used to visualize the distribution of firing traces in the tem-poral space and was performed using the MATLAB routine “princomp. ”Dendrograms were built from pairwise Euclidean distances between thenormalized traces using the MATLAB routine “dendrogram.”
LN model. An LN model assumes that the neuron response can bedecomposed into a linear filter k(t) and a static nonlinear function Nsuch that the response rLN(t) to a time-dependent stimulus s(t) isrLN�t� � N���
t s�t�k�t � t�dt� (Dayan and Abbott, 2001). We ex-tracted linear filters from data by performing a linear regression to min-imize the squared error between predicted rlin�t� � ��
t s�t�k�t� t�dt and measured response r(t). A random stimulus was generatedby opening and closing the valve placed on the delivery tube according toa pseudorandom sequence of zeros (closed) and ones (open) (Geffen etal., 2009; Nagel and Wilson, 2011). The state of the valve was updated attime intervals of length �. We considered values of � between 30 and 100ms. The full sequence was L � 30 – 60 s long depending on the dataset.The resulting stimulus had a flat power spectrum up to a cutoff frequencyimposed by the minimum length of the on and off intervals, �. Becausethe input stimulus has relatively low power at high frequencies, estima-tion of the filter is very sensitive to high-frequency noise. Filters wereregularized using elasticnet method (Zou and Hastie, 2005) that allowsboth L1 and L2 constraints to the linear regression: K � argminK (��R ��K�� 2 � �2 ��K�� 2 � �1 ��K��1), where K is the linear filter, R is the neuronresponse, � is the matrix of the time-shifted stimulus, and �1 and �2 areregularization parameters. We used the same set of parameters for all thedatasets that we compare. Linear filters were normalized by their maxi-mum value (normalization by the variance gave similar results but mademore difficult visualization of the change in the nonlinear function inFig. 7f ). The nonlinear function N was estimated by plotting the mea-sured firing rate against the predicted linear response and fitting the datawith a Hill function, r � 1/(1 � (H/rlin)n), where H is the half maximum.For filter estimation, the PSTH was calculated on 3 ms time bins andsmoothed with a 30 ms squared window. The accuracy of the filter pre-diction was calculated as the ratio between the residual of the fit and thenoise in the response (Geffen et al., 2009), NR � �PR/PN where PN ���(ri(t) � r(t)) 2�i)t, PR � �(r(t) � fLN(t)) 2�t, and r(t) � �ri(t)�i. A value ofNR smaller than one indicates a model prediction that is more accuratethan the variability in the data. We used two-thirds of the length of therecording to estimate the filter and the remaining one-third to test theprediction.
ResultsLaboratory odor stimuli exhibit a large diversityof odor-specific temporal dynamicsIn a previous study, we showed that stimulus dynamics can de-pend on odor identity (Su et al., 2011). We wondered how diverseare the dynamics of odor stimuli delivered in the laboratory for alarger set of monomolecular odors. We selected 27 compoundsfrom the panel used previously (Hallem and Carlson, 2006) that
6286 • J. Neurosci., April 10, 2013 • 33(15):6285– 6297 Martelli et al. • Dynamical Properties of Olfactory Receptor Neurons

contains odorants from different chemical classes that are rele-vant to the ecology of the fruit fly. Odor dilutions were preparedin a Pasteur pipette, and the time-dependent concentration ofodorant reaching the fly position was measured with a PID (Fig.1a and Materials and Methods). The timescales of the rise anddecay phases of the PID traces are broadly distributed (Fig. 1b,c)between 30 ms and 1 s. Rise and decay phases are correlated butnot identical. Stimulus dynamics is fairly independent of concen-tration for “fast” odors, but we measured differences up to hun-dreds of milliseconds for different concentrations of “slow” odors(Fig. 1d).
These observations suggest the presence of nonlinearity in thedelivery system, likely associated with interactions between odormolecules and the surfaces of the delivery system. In the absenceof any interaction, we would expect the system to be linear withthe concentration of odor, and the on and off timescales to besimilar (except for a 10% difference due to the different flow ratesduring the rising and decaying phases of the puff) and indepen-dent of concentration. In contrast, when interactions with sur-faces become significant, this linear scaling breaks down; the ratesof adsorption and desorption of odorant to surfaces depend onthe relative coverage of the surface by odor molecules, which itselfis a nonlinear function of the gas-phase concentration [e.g., ahyperbolic function in the simple case of a Langmuir adsorptionisotherm (Langmuir, 1932), but more complex isotherms are also
possible (Rabe et al., 2011)]. Hence, in this case, we expect thestimulus dynamics to depend on the odor concentration in thegas phase (Fig. 1d).
The concentration of odor in gas phase depends on the con-centration in liquid phase and scales linearly with vapor pressurethrough the Raoult’s law (Teixeira et al., 2009). Accordingly,stimulus dynamics also depends on the vapor pressure of theodorant (Fig. 1e). In particular, all odors with long rising time(�100 ms) had low vapor pressure (�1 mmHg). We noticed thatthe three outliers (in orange) are all acyclic monoterpenes, sug-gesting that other properties of the odorants (e.g., binding affinityto the tube surface) likely contribute to the time dependency ofthe odor signal as well.
Although the temporal dynamics of the stimulus reaching thefly is likely determined by the particular delivery method used(Vetter et al., 2006; Andersson et al., 2012), we found consistentdifferences between slow and fast odors when using differentvariations of our delivery system (Su et al., 2011). To make suchcomparisons easier throughout the text, we use “cold” blue colorsto plot PID measurements of “slow” odorants and “warm” redcolors for “fast” odorant.
What about more natural conditions? We considered two sit-uations likely to occur in nature. First, we investigated stimulusdynamics in the absence of strong wind, mimicking what mighthappen in the head space of a flower, for example, when an insectis at close range. We placed 50 �l of odor dilution on a paper filterand recorded the gas-phase concentration of the head space 1.5cm above it (Fig. 2a). In this situation, odor dynamics is governedby evaporation from the liquid source, transport by convectionand advection by small flow due to the PID suction. We observeda continuum of dynamics ranging from fast depletion for ethylacetate to slow increase for diethyl succinate (Fig. 2a). In this case,the dependency of the stimulus dynamics on vapor pressurelikely reflects the linear relationship between evaporation rate(defined as minus the rate of change of the odor concentration inliquid phase) and vapor pressure, which has been experimentallyobserved (van Wesenbeeck et al., 2008), as well as deviations dueto interactions between the paraffin oil and the odorant mole-cules in the liquid phase (Teixeira et al., 2009).
Next we asked whether differences between slow and fastodors would still be noticeable if the odor was transported down-stream from the source by wind but still in the vicinity of surfaces.We blew a continuous airstream onto a paper filter containing 50�l of odorant dilution and measured the odor concentrations 3cm downstream from the odor source (Fig. 2b). To determinewhether an ORN can detect these differences, we recorded theresponse of ab3A simultaneously with the stimulus concentra-tion (Fig. 2b). Although the stimulus signal depends on the posi-tion of the detector and the particular configuration of theexperiment, we found consistent differences in stimulus dynam-ics between a fast and a slow odorant. The overall trend of thestimulus concentration seems to reflect the evaporation dynam-ics shown in Figure 2a (fast depletion for methyl butyrate andslow increase for diethyl succinate). To quantify the statistics ofthe fluctuations around the evaporation trend, we calculated theautocorrelation function of the fluctuations around the mean forthe last 70 s of the traces. The decay time in the autocorrelationfunction of the PID signal was longer for the slow odorant diethylsuccinate than for the fast odorant methyl butyrate. Importantly,the autocorrelation functions for the ab3A responses show simi-lar differences (Fig. 2c). This result suggests that the physico-chemical properties of odorant molecules can affect the temporalstatistics of odor signals that reach the sensory system and that
Figure 1. Common odors exhibit a broad range of dynamics. a, Odor stimuli were generateddriving an airstream through a Pasteur pipette containing odor dilution (see Materials andMethods). PID measurements were performed at the normal locus of the fly, 1.5 cm down-stream from the exit of the delivery tube. b, Mean PID signal measured for 27 odors and nor-malized by peak response (n � 3– 6). c, Rising and decay timescales �on(off) were estimated byfitting a double-exponential function to the PID signal (see Materials and Methods). Rising anddecay timescales are correlated but not identical (r �0.84, p �10 �7). d, Dependence of risingtimescale on odor concentration. Connected dots represent different concentrations of thesame odor and are plotted as a function of peak PID signal. Different odors are colored as in b andc. Inset, Normalized PID signal for linalool (dilutions, 3 � 10 �3, 10 �2, 3 � 10 �2, 10 �1). e,Vapor pressure is anticorrelated with the rising timescale �on (r � �0.45, p � 0.018). Theodors include the following: 1, 2,3-butanedione; 2, 2-methylphenol; 3, 4-methylphenol; 4,6-methyl-5-hepten-2-on; 5, �-terpineol; 6, benzaldehyde; 7, ethyl acetate; 8, linalool; 9,methyl acetate; 10, methyl butyrate; 11, methyl hexanoate; 12, �-hexalactone; 13, 3-meth-ylthio-1-propanol; 14, geraniol; 15, -citronellol; 16, 1-hexanol; 17, 1-octanol; 18, E2-hex-enol; 19, ethyl octanoate; 20, diethyl succinate; 21, butyric acid; 22, pentanoic acid; 23,hexanoic acid; 24, isobutyric acid; 25, nerol; 26, isobutyl acetate; 27, 1-octen-3-ol.
Martelli et al. • Dynamical Properties of Olfactory Receptor Neurons J. Neurosci., April 10, 2013 • 33(15):6285– 6297 • 6287
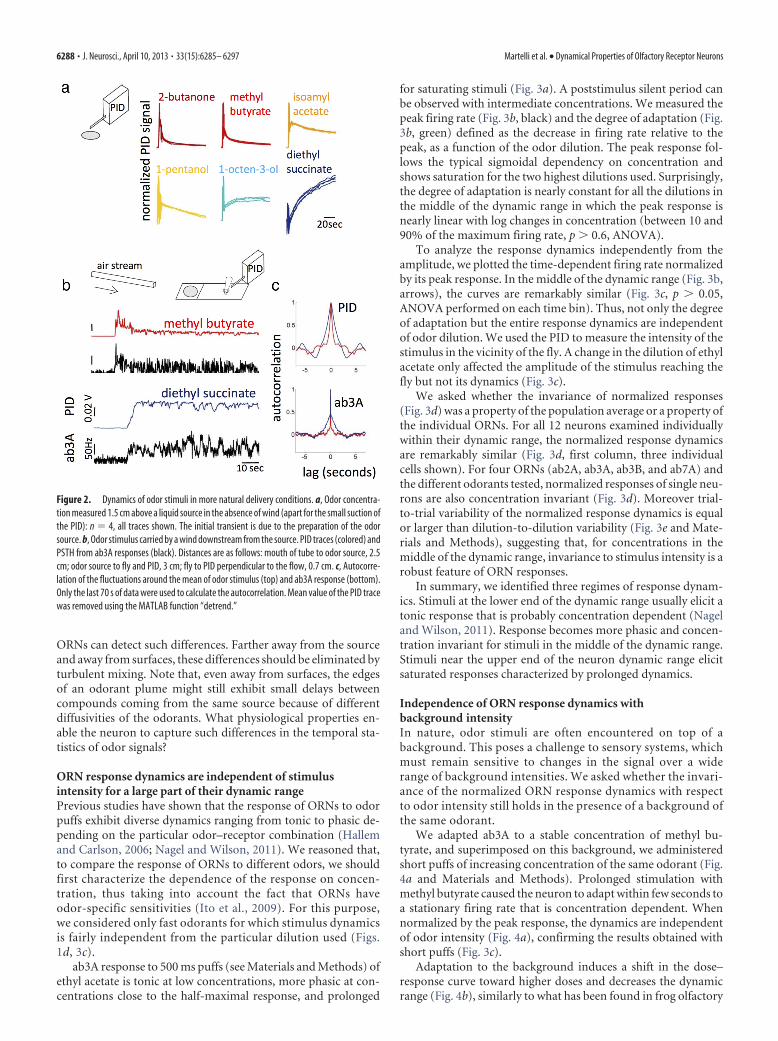
ORNs can detect such differences. Farther away from the sourceand away from surfaces, these differences should be eliminated byturbulent mixing. Note that, even away from surfaces, the edgesof an odorant plume might still exhibit small delays betweencompounds coming from the same source because of differentdiffusivities of the odorants. What physiological properties en-able the neuron to capture such differences in the temporal sta-tistics of odor signals?
ORN response dynamics are independent of stimulusintensity for a large part of their dynamic rangePrevious studies have shown that the response of ORNs to odorpuffs exhibit diverse dynamics ranging from tonic to phasic de-pending on the particular odor–receptor combination (Hallemand Carlson, 2006; Nagel and Wilson, 2011). We reasoned that,to compare the response of ORNs to different odors, we shouldfirst characterize the dependence of the response on concen-tration, thus taking into account the fact that ORNs haveodor-specific sensitivities (Ito et al., 2009). For this purpose,we considered only fast odorants for which stimulus dynamicsis fairly independent from the particular dilution used (Figs.1d, 3c).
ab3A response to 500 ms puffs (see Materials and Methods) ofethyl acetate is tonic at low concentrations, more phasic at con-centrations close to the half-maximal response, and prolonged
for saturating stimuli (Fig. 3a). A poststimulus silent period canbe observed with intermediate concentrations. We measured thepeak firing rate (Fig. 3b, black) and the degree of adaptation (Fig.3b, green) defined as the decrease in firing rate relative to thepeak, as a function of the odor dilution. The peak response fol-lows the typical sigmoidal dependency on concentration andshows saturation for the two highest dilutions used. Surprisingly,the degree of adaptation is nearly constant for all the dilutions inthe middle of the dynamic range in which the peak response isnearly linear with log changes in concentration (between 10 and90% of the maximum firing rate, p � 0.6, ANOVA).
To analyze the response dynamics independently from theamplitude, we plotted the time-dependent firing rate normalizedby its peak response. In the middle of the dynamic range (Fig. 3b,arrows), the curves are remarkably similar (Fig. 3c, p � 0.05,ANOVA performed on each time bin). Thus, not only the degreeof adaptation but the entire response dynamics are independentof odor dilution. We used the PID to measure the intensity of thestimulus in the vicinity of the fly. A change in the dilution of ethylacetate only affected the amplitude of the stimulus reaching thefly but not its dynamics (Fig. 3c).
We asked whether the invariance of normalized responses(Fig. 3d) was a property of the population average or a property ofthe individual ORNs. For all 12 neurons examined individuallywithin their dynamic range, the normalized response dynamicsare remarkably similar (Fig. 3d, first column, three individualcells shown). For four ORNs (ab2A, ab3A, ab3B, and ab7A) andthe different odorants tested, normalized responses of single neu-rons are also concentration invariant (Fig. 3d). Moreover trial-to-trial variability of the normalized response dynamics is equalor larger than dilution-to-dilution variability (Fig. 3e and Mate-rials and Methods), suggesting that, for concentrations in themiddle of the dynamic range, invariance to stimulus intensity is arobust feature of ORN responses.
In summary, we identified three regimes of response dynam-ics. Stimuli at the lower end of the dynamic range usually elicit atonic response that is probably concentration dependent (Nageland Wilson, 2011). Response becomes more phasic and concen-tration invariant for stimuli in the middle of the dynamic range.Stimuli near the upper end of the neuron dynamic range elicitsaturated responses characterized by prolonged dynamics.
Independence of ORN response dynamics withbackground intensityIn nature, odor stimuli are often encountered on top of abackground. This poses a challenge to sensory systems, whichmust remain sensitive to changes in the signal over a widerange of background intensities. We asked whether the invari-ance of the normalized ORN response dynamics with respectto odor intensity still holds in the presence of a background ofthe same odorant.
We adapted ab3A to a stable concentration of methyl bu-tyrate, and superimposed on this background, we administeredshort puffs of increasing concentration of the same odorant (Fig.4a and Materials and Methods). Prolonged stimulation withmethyl butyrate caused the neuron to adapt within few seconds toa stationary firing rate that is concentration dependent. Whennormalized by the peak response, the dynamics are independentof odor intensity (Fig. 4a), confirming the results obtained withshort puffs (Fig. 3c).
Adaptation to the background induces a shift in the dose–response curve toward higher doses and decreases the dynamicrange (Fig. 4b), similarly to what has been found in frog olfactory
Figure 2. Dynamics of odor stimuli in more natural delivery conditions. a, Odor concentra-tion measured 1.5 cm above a liquid source in the absence of wind (apart for the small suction ofthe PID): n � 4, all traces shown. The initial transient is due to the preparation of the odorsource. b, Odor stimulus carried by a wind downstream from the source. PID traces (colored) andPSTH from ab3A responses (black). Distances are as follows: mouth of tube to odor source, 2.5cm; odor source to fly and PID, 3 cm; fly to PID perpendicular to the flow, 0.7 cm. c, Autocorre-lation of the fluctuations around the mean of odor stimulus (top) and ab3A response (bottom).Only the last 70 s of data were used to calculate the autocorrelation. Mean value of the PID tracewas removed using the MATLAB function “detrend.”
6288 • J. Neurosci., April 10, 2013 • 33(15):6285– 6297 Martelli et al. • Dynamical Properties of Olfactory Receptor Neurons

cells (Reisert and Matthews, 1999). Remarkably, in the middle ofthe dynamic range of the different adapted states (Fig. 4b, ar-rows), ab3A responds to odor puffs with firing dynamics that arevery similar across background intensities when normalized bypeak amplitude (Fig. 4c). Apart from one time point (Fig. 4c,black point bottom left), the differences between the curves arenot significant (p � 0.05; Fig. 4c, bottom, tested on 30 ms timebins). For ethyl acetate and ethyl butyrate, there was no signifi-cant difference (p � 0.05) between the curves for all the timepoints (Fig. 4, second and third columns).
Thus, adaptation capabilities of ab3A are responsible for gen-erating response dynamics that are independent of stimulus in-tensity, even in the presence of background stimuli. These resultssuggest that the dynamics of odor stimuli may be encoded in theORN response independently of stimulus intensity.
Odor-dependent stimulus dynamics strongly affect ORNresponse dynamicsWe showed in Figure 1 that the odor stimulus reaching the flyexhibited different temporal profiles depending on the odorused. We therefore asked to what extent ORN dynamics dependon stimulus dynamics in addition to the different physiologicalprocesses that can affect the response.
We measured the responses of ab3A, ab3B, and ab7A to fiveodorants ranging from fast to slow (Fig. 5). For fast odorants(methyl butyrate and propyl acetate in red), the stimulus mea-
sured at the fly closely follows the openingand closing of the valve, whereas ORNs(ab3A, ab7A, and ab3B) show a phasic re-sponse with a degree of adaptation 0.5(as defined above). In contrast, for slowodorants, PID signals and neuron re-sponses do not follow the opening andclosing of the valve as well. ORN re-sponses to slow odorants tend to be moretonic (lower degree of adaptation) and ex-hibit prolonged dynamics that reflects thelong decay of the odor after the closing ofthe valve (ab3A and ab3B responses to1-octen-3-ol and diethyl succinate).
Although for fast odors a change in di-lution only affects the amplitude of thestimulus (Figs. 1d, 3c, 5, top), for slowerodors a change in dilution can affect boththe amplitude and the dynamics of thestimulus (Figs. 1d, 5, bottom). Thus, un-like for fast odors (Figs. 3, 5 top), theORNs responses to puffs of slow odorantsshould not be expected to rescale with liq-uid dilution because the signal arriving onthe fly does not rescale (see ab3A and ab3Bresponses to 1-octen-3-ol and diethyl suc-cinate; Fig. 5, bottom). However, we ex-pect the ORN response to rescale withthe intensity of the odorant reaching thefly for both slow and fast odors as con-sidered below (see Fig. 10). For veryslow odorants, the dependency of stim-ulus dynamics on odor dilution cancause concentration-dependent delaysin the neuron response to odor puffs(diethyl succinate; Fig. 5a), possibly re-lated to the time needed for the odor
concentration to reach the neuron detection threshold.Although these examples indicate that odor-dependent stim-
ulus dynamics does affect ORN response dynamics, Figure 5 alsoshows that physiological processes alone can introduce differ-ences in the ORN dynamics as reported previously (Nagel andWilson, 2011): for example, the responses of ab3A and ab3B to1-octen-3-ol are different, with ab3B response being more tonic.
To quantify to what extent stimulus dynamics might affectORN response dynamics, we asked how easy it would be to dis-criminate between odorants on the basis of the time-dependentactivity of ab3A only. Following the same approach that was usedin previous studies (Stopfer et al., 2003; Raman et al., 2010), weperformed PCA and hierarchical clustering on ab3A responses tothe four odorants used in Figure 5a. Because of the similarity ofab3A response to different concentrations of the same odorant,responses to the same odor fall very close to each other in the PCAplot (Fig. 6a). Responses to different concentrations of diethylsuccinate are relatively more distant from each other than forother odorants, probably because of the stronger concentrationdependency of the stimulus dynamics. Responses to all the con-centrations of the same odor cluster together, and different odortypes rank according to their characteristic “speed” (Fig. 6a andMaterials and Methods). In contrast, ab3A responses to fourodors with more similar dynamics do not cluster accordingly toodor type (Fig. 6b).
Figure 3. Intensity invariant ORN response dynamics. a, Raster and PSTH of ab3A response to 500 ms puffs (gray) of increasingconcentrations of ethyl acetate (dilutions prepared in paraffin oil as labeled). Dark gray, Standard error on 12 ORNs from 4 flies. b,Black, Peak response of ab3A as a function of ethyl acetate dilutions. Green, Degree of adaptation measured as the peak responseminus the adapted response (measured 500 ms after stimulus onset) divided by the peak response. c, PSTHs and PID signalsnormalized by peak response collapse onto single curves for the odor concentrations arrowed in b. d, Normalized PSTH of singleneuron responses are independent of stimulus intensity. Three neurons showed for each odor–receptor combination (2ac, ethylacetate; 2hept, 2-heptanone; 1but, methyl butyrate; pac, propyl acetate). In each plot, different curves represent the response todifferent concentrations of the same odorant. e, Variability of normalized responses (see Materials and Methods) calculated acrossdilutions is smaller or equal than the variability across trials (repetition of the experiment were performed on 12 ORNs of the sametype recorded from 3 to 4 animals). Circles correspond to the same odor–receptor combinations as in d, blue triangles correspondto ab3A response to methyl butyrate, methyl acetate, and 1-pentanol, and red triangles correspond to ab2A response to methylacetate and ethyl acetate.
Martelli et al. • Dynamical Properties of Olfactory Receptor Neurons J. Neurosci., April 10, 2013 • 33(15):6285– 6297 • 6289

Using an LN model to extract ab3Aresponse functionThe data shown so far indicate that theobserved ORN response dynamics is theresult of the convolution of the odor-dependent stimulus dynamics and theORN response function. To separate thistwo contributions, we estimated LN mod-els (Dayan and Abbott, 2001; Kim et al.,2011; Nagel and Wilson, 2011) for the de-livery system and for ab3A responses.
An LN model consist of a linear filterk(t) and a static nonlinear transformationN (see Materials and Methods). We ap-proximated a white-noise stimulus byrandomly opening and closing a three-way solenoid valve to redirect an odorstream into the delivery tube (Fig. 7a, toptrace). The valve state (On–Off) was up-dated every � � 30 ms (see Materials andMethods). In the following, we refer to �as the “stimulus correlation time ” (thetime for the autocorrelation function todecay to zero). We performed simultane-ous recordings of the odor concentrationreaching the fly together with ab3A firingactivity (Fig. 7).
First, we built an LN model for theodor stimulus using the binary state ofthe valve as the input and the PID signal asthe output (Fig. 7b). The resulting linearfilter k(t) peaks at 56 ms, consistent withthe air travel time, and exhibits a long tail( 200 ms, hereafter “integration time”)indicative of some integration of the sig-nal within the delivery tube. The functionN is a straight line revealing that the deliv-ery system is linear.
Next, we built a LN model using thestate of the valve as the input and ab3Aresponse as the output (Fig. 7c). Comparing the time-to-peak ofthis filter with the time-to-peak of the filter obtained for thesignal (Fig. 7b), we estimated a 12 ms delay between the stimulusarrival and the ORN response. The function N has the shape of arectifier (Fig. 7c) and was fitted with a Hill function (see Materialsand Methods).
Finally, we built an LN model using the PID signal as inputand ab3A firing rates as output (Fig. 7d). In this case, the ORNresponse function is deconvolved from the dynamical proper-ties of the stimulus, and the filter only reflects the effects ofphysiological processes. We call this filter the response func-tion of the ORN. As reported previously (Kim et al., 2011;Nagel and Wilson, 2011), the filter shows a positive and anegative lobe, suggesting that the neuron is taking a derivativeof the odor stimulus. The area under the filter is not zero, inagreement with the fact that this ORN does not return tobaseline activity after a step stimulus (Fig. 4a). The integrationtime for this ORN (estimated as the width of the filter) is 100ms, much shorter than the integration time of the deliverysystem. Cross-validation (see Materials and Methods) showsthat the estimated LN model can accurately predict the re-sponse of ab3A (NR � 0.41) (Fig. 7a, bottom, red).
Adaptive properties of ab3A response to a flickering stimulusTo what extent does the LN model depend on the statistics of thestimulus signal? Figure 7e shows LN models for the odor signaland ab3A extracted using stimulus sequences with different cor-relation times (� � 30, 50, and 100 ms). The LN model for thevalve-to-odor transformation is independent of �, suggesting thatour method to estimate the model is not affected by the stimuluscorrelation time (for the range of � values considered here). Incontrast, ab3A response function does exhibit a small depen-dency on �. The filter becomes slightly wider as the correlationtime of the input signal is increased, suggesting that the neuronmay adapt its response kinetics to the dynamics of the stimulus(Hosoya et al., 2005). We will investigate this issue further infuture studies.
The short 100 ms integration time of ab3A response func-tion (Fig. 7d) is consistent with the initial phasic response of thisneuron to step increases in methyl butyrate (Figs. 4a, 5a). How-ever, it is too short to explain the slower adaptation of the ab3Aresponse to prolonged stimuli reported in Figure 4b. To quantifyhow the neuron might adapt to the flickering stimulus, we fol-lowed a procedure used for the analysis of adaptation in the retina(Baccus and Meister, 2002). We estimated LN models for theearly (first 10 s) and the late (last 10 s) response of ab3A to the
Figure 4. Normalized response dynamics is independent of background intensity. Experimental procedure (top and Materialsand Methods): a constant stable background of odorant was used to adapt the neuron response. After 1 min, 500 ms puffs ofincreasing concentrations of the same odor were applied. a, PSTH of ab3A response to the background stimulus normalizedby peak response. Labels correspond to the peak response used to normalize each curve (methyl butyrate, n � 12; ethylacetate, n � 5– 8; ethyl butyrate, n � 12). b, Peak response to the puffs applied on top of the background as a function ofdilution for different background intensities. Dots indicate mean � SEM peak response; error bars are too small to be
visible. Lines are fit with y � B � Axn
xn � Kn. c, Top, PSTH of the response to 500 ms puffs normalized by peak
response. One concentration for each background as arrowed in b. Bottom, p value obtained by ANOVA performed on themean responses at each time point (bins of 30 ms); red indicates p � 0.05.
6290 • J. Neurosci., April 10, 2013 • 33(15):6285– 6297 Martelli et al. • Dynamical Properties of Olfactory Receptor Neurons

flickering signal (Fig. 7f). Although thelinear filter k(r) remains invariant, thenonlinear function N becomes less steepas the neuron adapts to the flickeringstimulus. This result is consistent with ourfinding that the presence of an odor back-ground induces a change in the dose re-sponse of ab3A but does not affect ab3Aresponse dynamics (Fig. 4). We obtainedsimilar results for the response of ab3A toethyl acetate, 1-octen-3ol (Fig. 7f),2-butanone, and 1-pentanol (data notshown), as well as for the response of themaxillary palp neuron pb1A to 2-butanoneand isoamyl acetate (Fig 7f).
The change observed in the nonlinearfunction during adaptation depends onthe particular odor–receptor combina-tion: for example, pb1A shows greater ad-aptation to 2-butanone than to isoamylacetate. Note that the early response func-tion was estimated from the first 10 s ofthe time series, and it is very likely thatsome adaptation already takes place dur-ing this time. The limited amount of datadoes not allow us to extract LN models forsegments shorter than 10 s.
Different odorants induce smalltemporal delays in the responsefunctions of two ORNs located in theantenna and the maxillary palpFinally, we investigated how the responsefunction of ab3A and pb1A depend onodor identity. We generated a flickeringstimulus of the slow odorant 1-octen-3-oland compared the PID and ab3A re-sponses (Fig. 8a) with those obtained withthe fast odorant methyl butyrate (Fig.7a). With 1-octen-3-ol, the PID trace issmoother and ab3A response appearsmore tonic. Neither odor concentrationnor neuron firing goes to zero when thevalve is closed (Fig. 8a). To identify theorigin of such differences, we comparedthe filters obtained for the two odorants.The valve-to-odor filter peaks at the sametime for both odorants but exhibits a lon-ger tail for 1-octen-3-ol (Fig. 8b, left) withan integration time twice as long as formethyl butyrate, consistent with theslower stimulus dynamics of that odorant.The valve-to-ORN filter also shows a lon-ger integration time with 1-octen-3-ol(Fig. 8b, middle). In addition, we observea small 4 ms delay in the peak of the filter,which is consistent across single-neuronrecordings (data not shown). Interest-ingly, apart from the same 4 ms delay, thefilters obtained for the odor-to-ORNtransformation (the response function ofab3A) exhibit less difference between thetwo odorants than those obtained for the
Figure 6. Temporal differences in ORN responses could enhance discrimination between odors of different speed. a, PCA andhierarchical clustering of ab3A response dynamics shown in Figure 5a normalized by peak response (only concentrations within thesensitive regime of the neuron were used). The 3 s after stimulus onset were considered for the analysis. Projection onto the firsttwo principal components shows that responses to different concentrations of the same odor cluster together and odor types areclearly separated in this representation. 1but, methyl butyrate; 5ol, 1-pentanol; 1o3ol, 1-octen-3-ol; dsucc, diethyl succinate.Inset, PID measurements of the same four odorants illustrate the differences in stimulus dynamics. b, Same analysis as in a for theresponse of ab3A to four odors with similar dynamics (inset). Responses to the different odors are very similar, and simpleclassification algorithm cannot separate odor type from intensity. 1but, methyl butyrate; 2ac, ethyl acetate; 1ac, methyl acetate;2hep, 2-heptanone.
Figure 5. Stimulus dynamics depends on odorant type and affect ORN response dynamics. a, Left column, Normalized PIDtraces for multiple dilutions of the odor signal measured at the fly position when a short square puff is generated in the deliverytube. For fast odorants, the stimulus dynamics is invariant with respect to concentration, whereas for slow odorants it depends onthe liquid dilution (Fig. 1d). Right column, Raster plot and PSTH of ab3A response to the corresponding odorants at increasingdilutions. b, Same as a for different odor–receptor combinations. Note that we were not able to obtain a PID measurement for allthe dilutions used to stimulate the ORN due to the lower sensitivity of the PID compared with that of the ORN. Dilutions used for thePID measurements: methyl butyrate, 10 �3, 5 � 10 �3, 10 �2, 10 �1; 1-pentanol, 10 �2, 3 � 10 �2,10 �1, 3 � 10 �1; 1-octen-3-ol, 10 �3, 3 � 10 �3, 10 �2, 3 � 10 �2, 10 �1; diethyl succinate, 3 � 10 �2, 10 �1; propyl acetate, 10 �2, 3 � 10 �2, 10 �1.
Martelli et al. • Dynamical Properties of Olfactory Receptor Neurons J. Neurosci., April 10, 2013 • 33(15):6285– 6297 • 6291

valve-to-odor transformation (Fig. 8b, right). In particular thelonger tail observed with 1-octen-3-ol in the valve-to-ORN filteris gone.
These results suggest that the large differences observed in ab3Adynamics between the two odorants (Figs. 7a, 8a) might be domi-nated by differences in stimulus dynamics. If this is true, it should bepossible to use a single filter to predict the response to both odorantsonce a measure of the stimulus is provided. To test this hypothesis,we used PID measurements of 1-octen-3-ol concentration (appro-priately scaled and shifted by 4 ms) as input into the LN model ofab3A obtained with methyl butyrate (Fig. 8c). The prediction of the
response to the slow odor is remarkably good (NR � 0.44), compa-rable with the one obtained for methyl butyrate itself (NR � 0.41).Importantly, it was better than the prediction obtained doing thesame cross-prediction with the valve-to-ORN filters (NR � 0.62).We attempted to extract similar LN models for other slow odors thatactivate ab3A, such as �-hexalactone and diethyl succinate. How-ever, ab3A is very sensitive to these odorants whereas the PID is not,and we were unable to obtain reliable measurements of the stimulusto use as input to the LN model.
We examined the response function of ab3A to a total of fiveodorants: (1) methyl butyrate; (2) 1-octen-3-ol; (3) ethyl acetate;
Figure 7. Adaptive properties of ab3A response quantified using an LN model. a, Top to bottom, On–Off state of the valve driving the odor; PID response measured at the fly; and raster plot andPSTH of ab3A response (black, n � 18) and prediction from LN model obtained using the filter shown in d (red). Stimulus sequence was 30 s long with 30 ms correlation time. b– d, LN models forvalve-to-odor, valve-to-ab3A, and odor-to-ab3A transformations. Left to right, Linear filter k(t) and nonlinear static transformation N. NR indicates the quality of the model prediction, and a value�1 means that the prediction is within the variance of the response (see Materials and Methods). e, Adaptive response to flickering stimuli with different correlation times. All three correlation timeswere tested on each neuron (n � 13), and the stimulus sequences was 30 s long. Left, Valve-to-odor transformation is independent from the stimulus correlation time. Right, Odor-to-ab3Atransformation shows a faster negative lobe for shorter correlation times. f, After the onset of a stationary flickering stimulus, ab3A and pb1A adapt their gain but not their response kinetics. Filtersand static functions were extracted for the first 10 s (early response) and the last 10 s (late response) of a 60-s-long flickering sequence with 100 ms correlation time. Top, Linear filters are identicalfor early and late responses for all odor–receptor combinations. Bottom, The static function shows a decrease in slope of different degree for the different odor–receptor combinations.
6292 • J. Neurosci., April 10, 2013 • 33(15):6285– 6297 Martelli et al. • Dynamical Properties of Olfactory Receptor Neurons

(4) 2-butanone; and (5) 1-pentanol (Fig. 9a– d). To reduce theeffect of cell-to-cell and fly-to-fly variability in our comparison,we tested two odors on each neuron and compared LN modelsobtained for each odor pair. A correlation time of 100 ms wasused for the flickering stimulus. For 1-octen-3-ol, we obtainedresults similar to those measured with a 30 ms correlation time inthe input (Fig. 8): apart from a small temporal shift, the filterextracted for methyl butyrate can be used to predict ab3A re-sponse to 1-octen-3-ol (Fig. 9a). For ethyl acetate, 2-butanone,and 1-pentanol, we do not observe any difference in the valve-to-odor filters (apart from a small shift due to the different positionof the valves on the delivery tube) (Fig. 9b– d, top). The odor-to-ORN filters estimated for pairs of odors have different responsedelays with shifts of up to 12 ms and exhibit only minor differ-ences in their shapes (Fig. 9b– d, middle). Given that the stimuluscontribution was deconvolved from the ORN response, thesedifferences in response delay can be entirely attributed to physi-ological processes. Once shifted in time by the appropriateamount, the filters obtained with methyl butyrate (in red) can beused to predict with good accuracy the response of ab3A to theother odorants (Fig. 9b–d, bottom) and this despite small differ-ences in the filters shape. We note a larger difference for the ab3A1-pentanol response. Consistent with the finding that the linearresponse of ab3A was invariant over the course of the flickeringstimulus experiment (Fig. 7f), we found that the response delaysmeasured for pairs of odorants at the very beginning of the flick-ering stimulus were the same as those measured at the end of theflickering stimulus. These odor-dependent latencies in the re-sponse of ab3A remained invariant, although the neuron sensi-tivity was adapting to the flickering stimulus.
We also measured the response function of pb1A, a neuronlocated in the maxillary palp, to 2-butanone and isoamyl acetate.Despite the different vapor pressure (Fig. 2b, 71 mmHg for2-butanone and 5 mmHg for isoamyl acetate), we did not observeany difference in the dynamics of the two odor stimuli (Fig. 9e,top), likely because of the very low concentration of 2-butanone
used to elicit a firing rate comparable with isoamyl acetate ( 100Hz). The linear filter for the response of pb1A (Fig. 9e, bottom)has a smaller negative lobe than what was found for ab3A, sug-gesting that the response function depends on the neuron iden-tity as reported previously (Nagel and Wilson, 2011). Like forab3A, the main difference between the response functions ofpb1A to the two odorants is a small delay (18 ms) between thecorresponding filters. We demonstrated this by predicting theresponse of pb1A to a flickering stimulus of isoamyl acetate usingthe filter measured for 2-butanone (appropriately shifted intime by 18 ms) (NR � 0.49). A previous study reported largerdifferences in the responses of pb1A to these two odorants (Na-gel and Wilson, 2011). Differences are to be expected if one of thetwo odorants is used at concentrations near the bottom of thedynamic range in which neural responses are close to the tonic-to-phasic transition. Indeed, the responses of pb1A to higherodorant concentrations (Nagel and Wilson, 2011, their Fig. 6)exhibit smaller differences between these two odorants. An-other likely source of differences stems from the dependency ofthe ORN response on the correlation time in the stimulus (Fig.7e). The cutoff frequency of the flickering stimulus is 100 ms inthis study, much shorter that in the study by Nagel and Wilson(2011). Finally, the dependency of the stimulus dynamics on thedelivery system configuration, odor type, and concentration mayalso contribute to the differences. For example, we noticed thatthe small difference in odor stimulus that we observedbetween methyl butyrate and 1-pentanol when deliveredthrough the Pasteur pipette (Fig. 5a) is absent when the odor isdelivered using a bottle (Fig. 9d, top). Similarly, ab3A re-sponse does not show a silent period after an odor puff, but itdoes show silent periods after the closing of the valve duringthe flickering odor stimulation. These observations supportthe importance of taking stimulus dynamics and neuron ad-aptation in account to study the contribution of physiologicalprocesses to ORN response dynamics.
Figure 8. ab3A response to a slow odor can be predicted using the LN model fitted to the response to methyl butyrate. a, Top to bottom, On–Off state of the valve driving the odor; PIDresponse measured at the fly; and raster plot and PSTH of ab3A response (black, n � 18) and prediction from LN model obtained using the odor-to-ORN filter (blue). Both 1-octen-3-oland methyl butyrate (Fig. 7) were presented in series on the same neurons. A stimulus sequence was 30 s long with 30 ms correlation time. A recovery time of 3–5 min was allowedbetween stimulations. b, Linear filters for valve-to-odor, valve-to-ab3A, and odor-to-ab3A transformations for both methyl butyrate (red) and 1-octen-3-ol (blue). c, Prediction (purple)of the measured response of ab3A (black) to 1-octen-3-ol (PID; blue) using the model of ab3A (red) built from the response to methyl butyrate. Odor signal was shifted by 4 ms to takeinto account the shift in the response function (see also Fig. 9). It was also appropriately normalized to take into account the different gains of the PID and ORN responses to the differentodorants.
Martelli et al. • Dynamical Properties of Olfactory Receptor Neurons J. Neurosci., April 10, 2013 • 33(15):6285– 6297 • 6293

DiscussionHere we identified three key aspects of ORN response dynamics.Our first result is that ORN response dynamics are independentof stimulus intensity in the middle of the neuron dynamic range(Fig. 3). Near the bottom of the dynamic range, responses be-come more tonic and often depend on concentration. For satu-rating stimuli, we observed prolonged responses that do notrescale. Adaptation at the level of both transduction and firingcould be involved in the concentration invariance observed here(Liu and Wang, 2001). In photoreceptors and vertebrate ORNs,increases in stimulus intensity elicit faster response kinetics (Bay-lor and Nunn, 1986; Reisert and Matthews, 1999). Similarly, localfield potential recordings from Drosophila ORNs show an in-crease in onset kinetics (Nagel and Wilson, 2011). Additionalinvestigations are necessary to understand the mechanisms un-derlying the concentration invariance of the firing rate. In vision,adaptation to a background is usually accompanied by an accel-eration of response kinetics (Baylor and Hodgkin, 1974; Burnsand Baylor, 2001). In contrast, adaptation to a background inboth vertebrate and insect ORNs has been shown to slow downthe kinetics of the response to low stimulus concentrations (Re-isert and Matthews, 1999; Nagel and Wilson, 2011). Here weshow that adaptation to a background shifts and reduces thedynamic range, but in addition, we find that, for a large part of theadapted dynamic range, response dynamics to short puffs remainindependent of the concentration of stimulus and background(Figs. 4, 7f).
These results suggest that, within a population of ORNs, neu-rons activated in this regime are able to encode the dynamics ofthe stimulus independently of its intensity. Hence, for each odor-ant, a relatively small number of ORNs might be sufficient toreliably capture the stimulus dynamics (Geffen et al., 2009). Thisproperty could be useful to maintain olfactory-driven navigationcapabilities independent of signal intensity and background. Aprevious study (Asahina et al., 2009) suggested that, when climb-ing an odor gradient, Drosophila larvae rely on the response ofvarious individual ORNs with distinct but overlapping dynamicranges. A similar principle enhances the capability of bacteria tonavigate chemical environments (Sourjik and Berg, 2002; Lazovaet al., 2011). Additional investigations are needed to understandthe role of low, saturated, and super-sustained responses (Mon-tague et al., 2011). Concentration invariance of behavior may beachieved by processing in the antennal lobe (Asahina et al., 2009).Local inhibitory neurons in the antennal lobe have been shown toperform a normalization of the activity of a single glomerulus bythe total activity of the ORN population (Olsen et al., 2010).These observations pose the question of whether processing inthe Drosophila antennal lobe may provide the means to extractconcentration-invariant information from temporal patterns ofactivity in the ORN population.
Our second result is that, under several conditions, ORN re-sponses can be strongly affected by the odor-specific dynamics ofthe stimulus (Figs. 1, 2, 5, 6). In one case, we show that a single LNmodel can be used to predict the temporal response of an ORN to
Figure 9. Odor-dependent delays in the ORN response function. Top and middle, Linear filters extracted for valve-to-odor and odor-to-ORN transformations for different odor–receptorcombinations. Odor pairs were tested on the same neurons by presenting two 60-s-long time series of stimulus flickering at 100 ms correlation time one after the other. A recovery time of 3–5 minwas allowed between stimulations. The shift between the two filters was estimated as the difference in the time-to-peak between the odor in red and the one in dark blue. A negative shift in thevalve-to-odor filters is due to the fact that the odor in dark blue is delivered through a valve that is slightly closer to the exit of the delivery tube. A variation in the secondary flow rate of 1% wasallowed to adjust stimulus concentration: this caused different values of the delay for different odor pairs. All delays measured in the valve-to-odor filters were consistent with the delay estimatedfrom the speed of the airstream and the relative position of the two valves. The delays quantified for the odor-to-ORN linear filters already account for the differences in the position of the valve andrepresent delays in the physiological response of the neurons. Bottom, Cross-prediction of the response to the odor in blue given the filter extracted for the odor in red. Black, Mean firing rate inresponse to the “blue” odor; blue, firing rate predicted using the filter in blue; purple, firing rate predicted using the filter in red.
6294 • J. Neurosci., April 10, 2013 • 33(15):6285– 6297 Martelli et al. • Dynamical Properties of Olfactory Receptor Neurons

different odors, providing direct measurements of the odor stim-uli reaching the fly (Figs. 8c, 9). In Figure 10, we use simulationsto explore how the differences in stimulus dynamics might affectORN dynamics. Assuming a single response function, ORN re-sponses can be more or less phasic depending on the dynamics ofthe input stimulus (Fig. 10a). Consistent with what we observedin Figure 3, within the linear regime of the model, the ORNresponds to different stimulus intensities with the same dynamics(Fig. 10b). Provided that the stimulus dynamics is concentrationinvariant, the model predicts concentration-invariant responsesfor fast and slow odorants (Fig. 10b,c). However, no rescaling ofthe ORN response should be expected when both the dynamicsand intensity of the stimulus change (Fig. 10d). This seems sim-
ilar to what we observed with most slow odorants we tested (Figs.1d, 5). A better control of the stimulus is required to investigateexperimentally the concentration dependency of the ORN re-sponse dynamics for slow odorants. We showed recently thatORNs respond to mixtures of excitatory and inhibitory odorantswith distinct dynamics that reflect the physico-chemical proper-ties of the odorants (Su et al., 2011). The LN model for ab3A canqualitatively account for the measured response dynamics solelyfrom the different dynamics of the constituent odorants, as-suming the contribution of the excitatory and inhibitoryodorant to be additive (Fig. 11). Differences in stimulus dy-namics alone could play an important role in the perception ofodor mixtures.
Our third result is that, when differences in stimulus dynamicsare carefully removed from the neuronal responses, ORN re-sponse dynamics still exhibit odor-dependent delays (Fig. 9).Other studies (Hallem and Carlson, 2006; Raman et al., 2010;Montague et al., 2011; Nagel and Wilson, 2011) have reportedlarger differences in the response of a single ORN to differentodorants, suggesting that a bigger dataset might reveal greatervariability than what we observed here. However, with few excep-tions (Montague et al., 2011; Nagel and Wilson, 2011), mostprevious studies assumed stimuli to be independent of odor typeand considered only one or few concentrations of the stimulus.Here we first quantified the dose response of each ORN– odorpair and then identified a regime of the dynamic range over whichdynamics are concentration invariant. The response dynamics
for different ORN– odor pairs were thencompared within this regime. Moreover,we quantified the response function of thedelivery system for each odorant and re-moved its contribution from the ORN re-sponse, obtaining response functions thatonly depend on physiological processes.Within this limited dataset, the shape of theresponse function only depends mildly onodorant identity but shows odor-dependentdelays with differences up to 18 ms (Fig. 9).These delays remained constant betweenthe beginning and end of the flickeringstimulus, although the neuron sensitiv-ity adapted to the stimulus (Fig. 7f). Odor-specific response delays have been observedpreviously in vertebrates ORNs and M/Tcells (Spors et al., 2006; Junek et al., 2010). Inthe fly, odor-dependent delays could origi-nate at different levels of the transductionprocess. For example, there could be rate-limiting events in the capture of odorant,their transport by odorant binding proteins,
and their interaction with ORs.Can odor-dependent differences in stimulus dynamics and
odor-dependent delays in ORN response affect behavior?Several experiments suggest that animals can use temporal
information to distinguish between two olfactory stimuli. Forexample, mice can discriminate small delays of the order of 10 msin the activation of the ORNs (Smear et al., 2011). Bees can dis-criminate two odor stimuli time shifted by only few milliseconds(Szyszka et al., 2012). Flies can discriminate between two odorsusing a single ORN type (DasGupta and Waddell, 2008). More-over, odor speed affects the capacity of humans to discriminatemixtures of odorants and tastants (Mozell, 1964a; Kuznicki andTurner, 1988; Laing et al., 1994; Jinks and Laing, 1999).
Figure 10. Modeling the effect of different stimulus dynamics and intensity on ORN re-sponse dynamics. The same LN model (Fig. 7d) is used for all simulations. Simulated stimuli(first column) were all 500 ms long with exponential rising and decay timescale � and producednonsaturated responses. a, Response to stimuli with identical intensities but different time-scales (� � 13– 800 ms). b, Response to stimuli with different amplitudes but identical time-scales (� � 10 ms). c, Same as in b but for a slow odor (� � 300 ms). d, Same as in c but now� decreases with stimulus intensity as we observed for slow odors (Fig. 1d) (� � 0.1–1 s).
Figure 11. Simulation of the response to a mixture of an excitatory and an inhibitory odor qualitatively reproduce recentmeasurements (Su et al., 2011). a, Excitatory response to a puff of a fast odor. Top, Stimulus dynamics; middle, raster plot of theresponse generated using an LN Poisson model cascade; bottom, corresponding firing rate. The neuron response was simulatedusing the linear filter and the static nonlinear function estimated for ab3A (Fig. 7d). b, Response to a mixture of a fast excitatory anda slow inhibitory odorant. Response was calculated as above, using a linear combination of the two odors as stimulus. Thissimulation shows that a slow inhibitor can shorten and sharpen the response of a fast excitatory odor. c, Prolonged response to apuff of slow excitatory odor. d, Biphasic response to the sum of slow excitatory and fast inhibitory odorants.
Martelli et al. • Dynamical Properties of Olfactory Receptor Neurons J. Neurosci., April 10, 2013 • 33(15):6285– 6297 • 6295
It is widely accepted in perfumery that the composition of afragrance changes over time as a result of differential evaporationof the individual components (Carles, 1962; Teixeira et al., 2009).Here we show that the concentration of the individual compo-nents can fluctuate differently depending on their physico-chemical properties. In ecology, much attention has been paid tothe passive transport of odorants by turbulent flows (Murlis et al.,1992; Carde and Willis, 2008; Riffell et al., 2008). While most ofthese works focused on situations in which the temporal dynam-ics of the stimulus are dominated by those of the air flow awayfrom surfaces, here we examined what happens in the vicinity ofsurfaces. This situation is ecologically relevant to the fruit fly thatspends a large amount of its lifetime walking (Carey et al., 2006).Interactions between odorant and surfaces introduce retarda-tions in the stimulus dynamics that are odor specific (Figs. 1,2a,c,d), and our results suggest that insects may be able to detectsuch relative temporal differences downwind of a nearby source(Fig. 2c). Behavioral experiments suggest that animals use fluctu-ations in odor concentration to identify different odor sources(Hopfield and Gelperin, 1989; Hopfield, 1991). It would be in-teresting in the future to investigate whether odor-dependentdynamics might be used to reveal the presence of different com-ponents within the same source.
Odor dependent differences in stimulus dynamics may affecttracking performance as well. For example the structure of anodor plume can greatly modify the way a moth tracks an odorsignal down to its source (Baker et al., 1985; Mafraneto andCarde, 1994). Tracking capability in flies may also depend onodor identity (Krishnan et al., 2011), but whether this is attribut-able to differences in the input stimulus, ORN response, ordownstream processing remains unclear.
The temporal aspect of ORN responses may add coding ca-pacity to the spatial representation of odors at the periphery ofthe olfactory system. We have shown how ORN odor-specificdynamics originate in part from the stimulus itself in addition tothe interactions between odorants and the periphery of the olfac-tory system. Whether and how the olfactory system uses the di-versity in stimulus dynamics to enhance odor discrimination andtracking remains an open question.
ReferencesAndersson MN, Schlyter F, Hill SR, Dekker T (2012) What reaches the an-
tenna? How to calibrate odor flux and ligand-receptor affinities. ChemSenses 37:403– 420. CrossRef Medline
Asahina K, Louis M, Piccinotti S, Vosshall LB (2009) A circuit supportingconcentration-invariant odor perception in Drosophila. J Biol 8:9.CrossRef Medline
Baccus SA, Meister M (2002) Fast and slow contrast adaptation in retinalcircuitry. Neuron 36:909 –919. CrossRef Medline
Baker TC, Willis MA, Haynes KF, Phelan PL (1985) A pulsed cloud of sex-pheromone elicits upwind flight in male moths. Physiol Entomol 10:257–265. CrossRef
Baylor DA, Hodgkin AL (1974) Changes in time scale and sensitivity inturtle photoreceptors. J Physiol 242:729 –758. Medline
Baylor DA, Nunn BJ (1986) Electrical properties of the light-sensitive con-ductance of rods of the salamander Ambystoma tigrinum. J Physiol 371:115–145. Medline
Brown SL, Joseph J, Stopfer M (2005) Encoding a temporally structuredstimulus with a temporally structured neural representation. Nat Neuro-sci 8:1568 –1576. CrossRef Medline
Burns ME, Baylor DA (2001) Activation, deactivation, and adaptation invertebrate photoreceptor cells. Annu Rev Neurosci 24:779 – 805. CrossRefMedline
Carde RT, Willis MA (2008) Navigational strategies used by insects to finddistant, wind-borne sources of odor. J Chem Ecol 34:854 – 866. CrossRefMedline
Carey JR, Papadopoulos N, Kouloussis N, Katsoyannos B, Muller HG, WangJL, Tseng YK (2006) Age-specific and lifetime behavior patterns in Dro-sophila melanogaster and the Mediterranean fruit fly, Ceratitis capitata.Exp Gerontol 41:93–97. CrossRef Medline
Carles J (1962) A method of creation in perfumery. Soap Perfumery Cos-metics 35:328 –335.
Daly KC, Wright GA, Smith BH (2004) Molecular features of odorants sys-tematically influence slow temporal responses across clusters of coordi-nated antennal lobe units in the moth Manduca sexta. J Neurophysiol92:236 –254. CrossRef Medline
DasGupta S, Waddell S (2008) Learned odor discrimination in Drosophilawithout combinatorial odor maps in the antennal lobe. Curr Biol 18:1668 –1674. CrossRef Medline
Dayan P, Abbott LF (2001) Theoretical neuroscience: computational andmathematical modeling of neural systems. Cambridge, MA: Massachu-setts Institute of Technology.
de Bruyne M, Foster K, Carlson JR (2001) Odor coding in the Drosophilaantenna. Neuron 30:537–552. CrossRef Medline
Duchamp-Viret P, Duchamp A, Chaput MA (2000) Peripheral odor codingin the rat and frog: quality and intensity specification. J Neurosci 20:2383–2390. Medline
Friedrich RW, Laurent G (2001) Dynamic optimization of odor representa-tions by slow temporal patterning of mitral cell activity. Science 291:889 –894. CrossRef Medline
Geffen MN, Broome BM, Laurent G, Meister M (2009) Neural encoding ofrapidly fluctuating odors. Neuron 61:570 –586. CrossRef Medline
Hallem EA, Carlson JR (2006) Coding of odors by a receptor repertoire. Cell125:143–160. CrossRef Medline
Hopfield JF, Gelperin A (1989) Differential conditioning to a compoundstimulus and its components in the terrestrial mollusk Limax-maximus.Behav Neurosci 103:329 –333. CrossRef
Hopfield JJ (1991) Olfactory computation and object perception. Proc NatlAcad Sci U S A 88:6462– 6466. CrossRef Medline
Hosoya T, Baccus SA, Meister M (2005) Dynamic predictive coding by theretina. Nature 436:71–77. CrossRef Medline
Ito I, Bazhenov M, Ong RC, Raman B, Stopfer M (2009) Frequency transi-tions in odor-evoked neural oscillations. Neuron 64:692–706. CrossRefMedline
Jinks A, Laing DG (1999) Temporal processing reveals a mechanism forlimiting the capacity of humans to analyze odor mixtures. Brain Res CognBrain Res 8:311–325. CrossRef Medline
Junek S, Kludt E, Wolf F, Schild D (2010) Olfactory coding with patterns ofresponse latencies. Neuron 67:872– 884. CrossRef Medline
Kim AJ, Lazar AA, Slutskiy YB (2011) System identification of Drosophilaolfactory sensory neurons. J Comput Neurosci 30:143–161. CrossRefMedline
Krishnan P, Duistermars BJ, Frye MA (2011) Odor identity influencestracking of temporally patterned plumes in Drosophila. BMC Neurosci12:62. CrossRef Medline
Kuznicki JT, Turner LS (1988) Temporal dissociation of taste mixture com-ponents. Chem Senses 13:45– 62. CrossRef
Laing DG, Eddy A, Francis GW, Stephens L (1994) Evidence for the tempo-ral processing of odor mixtures in humans. Brain Res 651:317–328.CrossRef Medline
Langmuir I (1932) Vapor pressures, evaporation, condensation and adsorp-tion. J Am Chem Soc 54:2798 –2832. CrossRef
Lazova MD, Ahmed T, Bellomo D, Stocker R, Shimizu TS (2011) Responserescaling in bacterial chemotaxis. Proc Natl Acad Sci U S A 108:13870 –13875. CrossRef Medline
Lei H, Christensen TA, Hildebrand JG (2004) Spatial and temporal organi-zation of ensemble representations for different odor classes in the mothantennal lobe. J Neurosci 24:11108 –11119. CrossRef Medline
Liu YH, Wang XJ (2001) Spike-frequency adaptation of a generalized leakyintegrate-and-fire model neuron. J Comput Neurosci 10:25– 45. CrossRefMedline
Mafraneto A, Carde RT (1994) Fine-scale structure of pheromoneplumes modulates upwind orientation of flying moths. Nature 369:142–144. CrossRef
Malnic B, Hirono J, Sato T, Buck LB (1999) Combinatorial receptor codesfor odors. Cell 96:713–723. CrossRef Medline
Montague SA, Mathew D, Carlson JR (2011) Similar odorants elicit differ-
6296 • J. Neurosci., April 10, 2013 • 33(15):6285– 6297 Martelli et al. • Dynamical Properties of Olfactory Receptor Neurons

ent behavioral and physiological responses, some supersustained. J Neu-rosci 31:7891–7899. CrossRef Medline
Mozell MM (1964a) Evidence for sorption as a mechanism of the olfactoryanalysis of vapours. Nature 203:1181–1182. CrossRef Medline
Mozell MM (1964b) Olfactory discrimination: electrophysiological spatio-temporal basis. Science 143:1336 –1337. CrossRef Medline
Murlis J, Elkinton JS, Carde RT (1992) Odor plumes and how insects usethem. Annu Rev Entomol 37:505–532. CrossRef
Nagel KI, Wilson RI (2011) Biophysical mechanisms underlying olfactoryreceptor neuron dynamics. Nat Neurosci 14:208 –216. CrossRef Medline
Olsen SR, Bhandawat V, Wilson RI (2010) Divisive normalization in olfac-tory population codes. Neuron 66:287–299. CrossRef Medline
Rabe M, Verdes D, Seeger S (2011) Understanding protein adsorption phe-nomena at solid surfaces. Adv Colloid Interface Sci 162:87–106. CrossRefMedline
Raman B, Joseph J, Tang J, Stopfer M (2010) Temporally diverse firing pat-terns in olfactory receptor neurons underlie spatiotemporal neural codesfor odors. J Neurosci 30:1994 –2006. CrossRef Medline
Reisert J, Matthews HR (1999) Adaptation of the odour-induced responsein frog olfactory receptor cells. J Physiol 519:801– 813. CrossRef Medline
Riffell JA, Abrell L, Hildebrand JG (2008) Physical processes and real-timechemical measurement of the insect olfactory environment. J Chem Ecol34:837– 853. CrossRef Medline
Schaefer AT, Margrie TW (2007) Spatiotemporal representations in the ol-factory system. Trends Neurosci 30:92–100. CrossRef Medline
Schuckel J, Meisner S, Torkkeli PH, French AS (2008) Dynamic propertiesof Drosophila olfactory electroantennograms. J Comp Physiol A Neuro-ethol Sens Neural Behav Physiol 194:483– 489. CrossRef Medline
Smear M, Shusterman R, O’Connor R, Bozza T, Rinberg D (2011) Percep-tion of sniff phase in mouse olfaction. Nature 479:397– 400. CrossRefMedline
Sourjik V, Berg HC (2002) Receptor sensitivity in bacterial chemotaxis.Proc Natl Acad Sci U S A 99:123–127. CrossRef Medline
Spors H, Wachowiak M, Cohen LB, Friedrich RW (2006) Temporal dynam-ics and latency patterns of receptor neuron input to the olfactory bulb.J Neurosci 26:1247–1259. CrossRef Medline
Stopfer M, Jayaraman V, Laurent G (2003) Intensity versus identity codingin an olfactory system. Neuron 39:991–1004. CrossRef Medline
Su CY, Menuz K, Carlson JR (2009) Olfactory perception: receptors, cells,and circuits. Cell 139:45–59. CrossRef Medline
Su CY, Martelli C, Emonet T, Carlson JR (2011) Temporal coding of odormixtures in an olfactory receptor neuron. Proc Natl Acad Sci U S A 108:5075–5080. CrossRef Medline
Szyszka P, Stierle JS, Biergans S, Galizia CG (2012) The speed of smell: odor-object segregation within milliseconds. PLoS One 7:e36096. CrossRefMedline
Teixeira MA, Rodriguez O, Mata VG, Rodrigues AE (2009) The diffusion ofperfume mixtures and the odor performance. Chem Eng Sci 64:2570 –2589. CrossRef
van Wesenbeeck I, Driver J, Ross J (2008) Relationship between the evapo-ration rate and vapor pressure of moderately and highly volatile chemi-cals. Bull Environ Contam Toxicol 80:315–318. CrossRef Medline
Vetter RS, Sage AE, Justus KA, Carde RT, Galizia CG (2006) Temporal in-tegrity of an airborne odor stimulus is greatly affected by physical aspectsof the odor delivery system. Chem Senses 31:359 –369. CrossRef Medline
Wilson RI, Turner GC, Laurent G (2004) Transformation of olfactory rep-resentations in the Drosophila antennal lobe. Science 303:366 –370.CrossRef Medline
Zou H, Hastie T (2005) Regularization and variable selection via the elasticnet. J R Stat Soc B Biol Sci 67:301–320. CrossRef
Martelli et al. • Dynamical Properties of Olfactory Receptor Neurons J. Neurosci., April 10, 2013 • 33(15):6285– 6297 • 6297