cement and concrete research - jos brouwers - index · which make their use non-feasible due to...
TRANSCRIPT

Cement and Concrete Research 54 (2013) 161–179
Contents lists available at ScienceDirect
Cement and Concrete Research
j ourna l homepage: ht tp : / /ees .e lsev ie r .com/CEMCON/defau l t .asp
Photovoltaic's silica-rich waste sludge as supplementary cementitiousmaterial (SCM)
G. Quercia a,b,⁎, J.J.G. van der Putten b, G. Hüsken c, H.J.H. Brouwers b
a Materials innovation institute (M2i), Mekelweg 2, P.O. Box 5008, 2600 GA Delft, The Netherlandsb Eindhoven University of Technology, Department of the Built Environment, P.O. Box 513, 5600 MB Eindhoven, The Netherlandsc BAM Federal Institute for Materials Research and Testing, Unter den Eichen 87, D-12205 Berlin, Germany
⁎ Corresponding author at: Materials innovation institu5008, 2600 GA Delft, The Netherlands.
E-mail address: [email protected] (G. Quercia).
0008-8846/$ – see front matter © 2013 Elsevier Ltd. All rihttp://dx.doi.org/10.1016/j.cemconres.2013.08.010
a b s t r a c t
a r t i c l e i n f oArticle history:Received 18 December 2012Accepted 15 August 2013Available online xxxx
Keywords:Nano-silica sludge (D)Supplementary cementitious materials (D)Pozzolanic index (C)Mortar (E)
Waste sludge, a solid recovered fromwastewater of photovoltaic-industries, composes of agglomerates of nano-particles like SiO2 and CaCO3. This sludge deflocculates in aqueous solutions into nano-particles smaller than1 μm. Thus, this sludge constitutes a potentially hazardous waste when it is improperly disposed. Due to itshigh content of amorphous SiO2, this sludge has a potential use as supplementary cementitious material(SCM) in concrete. In this study the main properties of three different samples of photovoltaic's silica-richwaste sludge (nSS) were physically and chemically characterized. The characterization techniques included:scanning electronmicroscopy (SEM), X-ray energy dispersive spectroscopy (EDS), X-ray diffraction (XRD), nitro-gen physical adsorption isotherm (BETmethod), density by Helium pycnometry, particle size distribution deter-mined by laser light scattering (LLS) and zeta-potential measurements by dynamic light scattering (DLS). Inaddition, a dispersability study was performed to design stable slurries to be used as liquid additives for the con-crete production on site. The effects on the hydration kinetics of cement pastes by the incorporation of nSS in thedesigned slurries were determined using an isothermal calorimeter. A compressive strength test of standardmortars with 7% of cement replacement was performed to determine the pozzolanic activity of the wastenano-silica sludge. Finally, the hardened system was fully characterized to determine the phase composition.The results demonstrate that the nSS can be utilized as SCM to replace portion of cement inmortars, thereby de-creasing the CO2 footprint and the environmental impact of concrete.
© 2013 Elsevier Ltd. All rights reserved.
1. Introduction
Photovoltaic or PV is the technology which converts sunlight intoelectricity. With increasing concerns surrounding the global climateand the uncertainty of oil sources and prices among other traditionalfuels, the solar power industry has been growing substantially in recentyears. Since 1990, photovoltaic module installed power had increasedmore than 500 times from 46 megawatts (MW) to 30.8 GW in 2012[1], making it the world's fastest-growing energy technology. Due tothe rapid expansion of the silicon Photovoltaic industry it receivesincreased attention because of the potential environmental impact oftheir process and products. Decommissioning at the end of the lifecycle of PV modules, which are expected to last around 30 years [2], isan important factor. There are also concerns regarding their disposalas they may contain small amounts of regulated materials. Differentresearchers have focused on the recycling waste streams from the PVslicing production process. Wang et al. [3] published a novel approachfor recycling “kerf” loss from the cutting slurry waste. Also Kong et. al.
te (M2i), Mekelweg 2, P.O. Box
ghts reserved.
[4] made efforts to recycle silicon powder from the silicon wafer backgrinding. Recently, researchers [3,5] suggest the use of cement basedmaterial fixation capacity to the possible re-utilization of solar cell resi-due to construction materials, which will lower the costs and help todecrease the waste disposal from PV systems.
Nowadays supplementary cementitious materials (SCMs) are wide-ly used in concrete either in blended cements or added separately to theconcretemix [6]. The use of silica-rich SCM such as blast furnace slag, flyash,metakaolin andmicro-silica represents a viable solution to partiallyreplace ordinary Portland cement. Other possible materials, which areunder research worldwide, are silica fines. They are mainly composedof high purity SiO2 with micron and submicron particles. Examples ofthis are silica flour (Sf), micro-silica (mS), fumed silica (FS) and nano-silica (nS). However, these products are obtained in complex processeswhich make their use non-feasible due to their price or in some casetheir availability for the construction industry [7,8]. In this context,another potential source of nano-silica particles is the waste sludge,generated during the polishing process of photovoltaic (PV) solar panels[9]. This waste sludge is collected during the filtering steps of theslurry used in the polishing or finishing process of the silicon solarpanels by chemical mechanical planarization (CMP) [10]. In SouthKorea, 50,000 tons of CMP silica sludge are generated annually. The

Table 1Chemical analysis and phase composition of the cement used (CEM I 52.5 N).
Oxide composition by XRF(mass %)
Mineral composition by Rietveldrefinement (mass %) [70]
SiO2 19.64 Alite (C3S) 58.67Na2O 0.35 Belite (C2S) 17.05Al2O3 4.80 Aluminate (C3A) 3.24Fe2O3 3.28 Ferrite (C4AF) 10.26CaO 63.34 Calcite 3.01Cl 0.06 Anhydrite 2.99P2O5 0.59 Bassanite 1.16K2O 0.06 Syngenite 0.94MgO 1.99 Ca-Langbeinite 0.53TiO2 0.34 Gypsum (CS) 0.06SO3 2.07 Free lime (CaO) 0.97Others 0.62 Periclase (MgO) 0.97LOI 1.56 Others 0.15
162 G. Quercia et al. / Cement and Concrete Research 54 (2013) 161–179
polishing slurries are usually composed of a stable colloidal nano-silica, fumed silica, nano-CaCO3 and other types of suspensions [9–12].This sludge deflocculates in aqueous solutions into nano-particles small-er than 1 μm. Thus, this nano-silica sludge (nSS) is potentially hazardouswaste when it is improperly dumped. The feasibility to use waste sludgefrom semiconductor industry in cement mortars was established forthe first time by Lee and Liu in 2009 [13] and later by other researchers[14–16]. However, the use of waste sludge from PV panel CMP processhas not been studied yet.
In addition to the need to improve the properties of concrete, theenvironmental impact of the cement used in concrete industry is be-coming an important issue. The component with the highest environ-mental impact that is used for concrete production in terms of energyand CO2 emissions is cement clinker. In general, 0.85 ton of CO2 isreleased when 1 ton of cement clinker is produced [17]. It is calculatedthat cement clinker production contributes 5 to 8% to the total CO2
emissions worldwide [17]. Consequently, the construction sector de-mands concrete with a lower environmental impact. Based on thesepremises, the aim of this research is to determine the potential use ofphotovoltaic's silica-rich sludge as supplementary cementitious materi-al (SCM) in concrete. In this study, themain properties of three differentsamples of photovoltaic's silica-rich waste sludge were physically andchemically characterized. The final goal is to demonstrate that the nSScan be utilized as SCM to replace portion of cement in mortars, therebydecreasing the CO2 footprint of concrete and to avoid the environmentalimpact of PV waste landfill.
In this research, the initial characterization and testing of differentsilica-rich waste sludges (nSS) obtained from one South Korean photo-voltaic panel producer are presented. To access the potential use of nSSas supplementary cementitious material, three different batches of nSSwere physically and chemically characterized. In addition, a dispersabilitystudy was performed to design stable slurries to be used as liquid addi-tives for the concrete production on site. The designed slurries were test-ed using an isothermal calorimeter. Finally, standard cement pastes andmortars with 7% by weight of cement (bwoc) replacement were fullycharacterized to determine the pozzolanic activity and to assess the feasi-bility of the waste silica-rich sludge as supplementary cementitiousmaterial in concrete.
2. Materials and experimental methods
2.1. Materials
Three batches of CMP sludge cake from wet waste were obtainedfrom DAE Pyung Ceramics Co., Ltd. located in South Korea. After dryingat 105 °C for 24 h until a complete dry state (constant weight) wasobtained, the water content of the sludge was determined to be be-tween 33 and 39%. These cakes had ivory white color. The cementusedwas ordinary Type I Portland cement OPC (CEM I 52.5 N) producedby ENCI Cement, The Netherlands. The OPC had an apparent density of3.15 g/cm3 and a Blaine specific surface area of 484 m2/g. The chemicalcomposition (determined by XRF) and the proportion ofmineral phasesprovided by the producer are shown in Table 1. Standard sandwas usedaccording to EN 196-1 [18], with particles size between 0 and 2 mm. Inaddition, a commercial micro-silica (mS) slurry with 50% of solid wasused for comparison.
2.2. Experimental methods
2.2.1. Particle morphological characteristicsSize and morphology of the particles of the silica sludge were ana-
lyzed using a high resolution scanning electron microscope (FEI Quanta600 FEG-SEM) with a Schottky field emitter gun (at voltage of 10 keVand 0.6 mbar of low-vacuumpressure). Furthermore, a general chemicalanalysis was performed using EDAX® energy dispersive spectroscopy(EDS) detector.
2.2.2. XRD and XRF of the silica sludgePowder X-ray diffraction (XRD) analysis was carried out using an
X-ray diffractometer (Rigaku, Geigerflex, Japan) with Cu Kα1 radiationand a 6 h scanning range between 5° and 100°. The XRD scans wererun at 0.02° per step with a counting time of 4 s. In order to obtain amore accurate chemical composition of the investigated nano-silicasludge, a quantitative X-ray fluorescence (XRF) analysis by the fusionmethod (routine 4C) was performed. The results were obtained by anexternal laboratory (Activation Laboratories Ltd, Canada) [19]. In theXRF analysis a standard micro-silica was included as comparison.
2.2.3. TG/DSC of the silica sludgeA thermal gravimetric (TG) and differential scanning calorimetric
(DSC) analysis were performed to determine the amount of adsorbedwater and other types of possible contaminants (carbonates, organics,etc.) in thenano-silica sludge. AnSTA449F1 Jupiter (Netzsch Instruments)was used to perform the TG/DSC analysis. The temperature was increasedgradually from room temperature to 1000 °C at 10 K/min, keeping it con-stant for 2 h at 1000 °C. The sampleswere tested as received and a simplehand grinding was performed prior testing.
2.2.4. Nitrogen physical adsorption isotherm (BET method)A Micromeritics TriStar 3000 equipment using N2 with a soaking
time of 12 h at 120 °C was used for the gas physisorption analysis.Using the BET theory [20] and the standard procedure described byDin ISO 9277:1995 [21], the specific surface area (SSABET) of the silicasamples was determined. The physisorption analyses were carried outthree times with a standard deviation below 5% for the SSABET. Theparticle size of the nano-silica was calculated from the geometricalrelationship between surface area and mass given by [22]:
d ¼ 6000ρ � SSABET
ð1Þ
where d is the particle size of nano-silica in nm, ρ the density of thematerial in g/cm3 and SSABET the surface area in m2/g. This particlesize is an average value, considering that the particles are spherical.
2.2.5. Specific density by helium pycnometryA helium pycnometer AccuPyc® II 1340 from Micromeritics was
used to determine the specific density of the different nano-silica sam-ples. Before the density measurements, the samples were dried anddegassed at 105 °C for 24 h. Helium was used as the displacementmedium. Ten purges of the system were performed to ensure the equi-librium and to complete a total degassing of the sample. Thiswas followedby 12 consecutive volumemeasurements, which were used to determinethe average density.

Table 3
163G. Quercia et al. / Cement and Concrete Research 54 (2013) 161–179
2.2.6. Particle size distribution (PSD) and zeta potential (ξ) by dynamiclight scattering (DLS)
The laser light diffractionwas used to determine theparticle size dis-tribution of the original nano-silica sludge and the resulting stable slur-ries. The PSDs were measured in this study in liquid dispersion (water)with aMalvern™Mastersizer™ 2000 laser light diffraction device, usingMie scattering theory as the measuring principle and following the ISOstandard 13320-1 (1999) [23]. A Hydro S unit was used to disperse thesamples. A spherical shape was assumed to calculate the particle sizedistribution.
The zeta potential of stable slurries formulated with the nano-silicasludge was measured using dynamic light scattering (Malvern™Zetasizer™Nano ZS) according to ISO 13321 (2006) [24]. A convention-al cell was used for particle size measurement (distribution in volume)[25].
2.2.7. Dispersability study with high shear mixerDue to the highly agglomerated state of the nano-silica sludge,
a dispersability study was performed. For this study only a sample ofnano-silica sludge (batch 2) was considered. Batch 1 was discarded forthe dispersability study due to its high content of impurities (discussedin Section 3). Cakes of dried nano-silica sludge from batch 2 were pre-dispersed inwater (1 wt.%) in a glass stirred vessel (1 L beaker). Disper-sions were transferred to the high energy shear mixer (Silverson® L5Musing a size reduction stator head). The rotor speed was set to the re-quired value (3000 and 7000 rpm) and at each speed the dispersionswere sheared for 210 min. Small samples from the dispersion weretaken at certain times and the particle size distribution (PSD) wasmeasured using LLS. In addition, zeta potential was measured tostudy the stability of the dispersion. A dispersion study was also per-formed with varying pH values of the solution prepared with 25%NH4OH.
2.2.8. Design of stable nano-silica slurries for their use as SCMThree different stabilized slurries were designed for their use in the
calorimetry and mortar tests. Table 2 shows the different componentsused to obtain stable slurries. The slurries were prepared using driedsilica sludge (16.5 wt.%) from different batches. Each sample was pre-dispersed for 1 h at 7000 rpm in water, using a glass stirred vesselcoupled to an Ultramix® stirrer. Prior to the pre-dispersion step,NH4OH and a polycarboxylate type superplasticizer (SP) were added tostabilize the slurries and to adjust the final pH value between 9.1 and9.6. Then the dispersions were transferred to the high shear mixer, butusing a size reduction stator head for additional 30 min. The obtainedslurries were stable in time. No gelling was observed over a time periodof 3 weeks with static conditions.
2.2.9. Hydration kinetics of cement pastes with nano-silicaA calorimetric analysis of cement mortars with w/c ratio of 0.5 was
performed using the slurry prepared from the nSS batch 2. For this pur-pose, an 8-channel TAM® Air isothermal micro calorimeter from TAInstruments (U.S.A.) was used. In total 4 different cement pastes with0, 3, 6 and 9% of nSS based on theweight of cement (bwoc) were tested
Table 2Proportioning of the designed silica sludge slurries.
Batch number 1 2 3
Water (g) 600 600 600Powder nano-silica sludge (g)a 200 200 200NH4OH 25% (g) 14.3 14.3 14.3SP (PCE type) (g) 4.4 4.4 4.4Final pH 9.27 9.58 9.12Slurry density (g/cm3) 1.070 1.103 1.102Solid content (wt.%)b 16.06 16.48 16.32
a 30 to 35% content of H2O.b Computed by drying 5 g of slurry at 110 °C for 24 h.
in duplicate for 72 h at 20 °C. The cement pastes were mixed with ahandmixer for 1 min. The calorimetric analysiswas performed to assesswhether the nano-silica sludge particles exhibit an acceleration effect orany pozzolanic activity. The results were analyzed using the TAM assis-tance software. By means of the software tool, the dormant period, therelative setting time and the time to reach the maximum hydrationpeak were determined. The dormant period, relative setting times aswell as the time to reach the maximum peak were defined as proposedby [26–28]. Similarly, a second calorimetric analysis was performedusing the slurries prepared from batches 1–3 and the standard micro-silica slurry. In total 4 different cement pastes with 7% by weight ofcement (bwoc) replacement, w/c of 0.5 and SP content (based onthe mortar recipes shown in Table 3 without sand addition) weretested in duplicate for 70 h at 20 °C. The cement pastes were mixedwith a high energy (600 W) hand blender (Philips HR1363) for2 min. The resultswere analyzed using the sameprocedure as previouslydescribed.
2.2.10. Compressive strength of cured cement mortars and pozzolanicactivity
To determine the pozzolanic index or activity of the nSS, differentcement mortars were prepared and tested following the procedureestablished in CEN-EN 196-1 [18]. A 7% by weight of cement replace-ment was selected based on the procedure described by Justnes andOstnor [29]. In total 9 standard prisms per mix were tested followingthe mix designs presented in Table 3. The SP content in these mixeswas adjusted to obtain a spread flow of 175 ± 15 mm (Hägermanncone). The flexural and compressive strength of the mixes was deter-mined at 1, 7 and 28 days. Finally, the pozzolanic activity index wascalculated based on the results of the standard cement mortar at 7and 28 days. In addition, the pozzolanic index was compared with theresults obtained for one commercial micro-silica slurry.
2.2.11. Characterization of the hydrated mortarsAs the use of silica-rich waste sludge should influence the amount
and kind of formed hydration phases and thus the volume, the porosityand finally the durability properties of concrete, different characteriza-tion techniques were performed to consider the photovoltaic's silica-rich sludge as supplementary cementitious material.
2.2.11.1. Microstructural characterization and analysis. The microstruc-tural morphology of the prepared mortars (reference, batches 1–2 andmicro-silica) was analyzed using the same ESEM/EDS devices and pro-cedures as described in Section 2.2.1. For this analysis, 5 mmthick slideswere horizontally extracted fromhardened prisms at the age of 28-daysusing a precision diamond saw. After cutting, the samples were groundby hand and moderate pressure on the middle-speed lap wheel withp180, p320 and p600 SiC papers. Polishing was done on a lap wheelwith 15, 7, 3, 1 and 0.25 μm diamond pastes for about 2 min each.
Mix designs of mortars used for determining compressive strength and pozzolanic index.
Materials Reference Batch 1 Batch 2 Batch 3 Micro-silica
CEM I 52.5 N (g) 450.0 418.5 418.5 418.5 418.5nSS slurry (16.5 wt.%) (g) 0 196.9a 196.9a 196.9a 0mS slurry (50 wt.%) (g) 0 0 0 0 72.3Water (g) 225 59.6 59.6 59.6 184.2Standard sand 0–2 mm (g) 1350 1350 1350 1350 1350SP for standardworkability (g) 0 2.01 0.93 0.93 1.07Total SP (% bwoc) 0 0.68 0.44 0.44 0.24w/c 0.5 0.5 0.5 0.5 0.5Air voids (%)b 6.14 10.98 6.15 – 3.99Slump-flow (mm), 15 strokes 176 ± 4 176 ± 3 181 ± 4 180 ± 5 182 ± 7
a Included 0.54 wt.% of SP according to Table 2.b Estimated value.

164 G. Quercia et al. / Cement and Concrete Research 54 (2013) 161–179
After polishing, the samples were immersed in isopropanol for threedays to stop the hydration completely and then dried in an oven forextra three days at 70 °C. Finally, the samples were stored in a desicca-tor over silica-gel (in vacuum) until the ESEM analysis was performed.The images were obtained using the BSE detector in low vacuummode (60 mbar) and using an acceleration voltage of 20–15 keV.
2.2.11.2. Phase composition of the hydrated mortars by TGA/DTG and XRD.Extracted slides of each mortar composition at the age of 28-days weresoaked in isopropanol for three days to stop the hydration. After-wards, the slides were crushed and pulverized by the use of an auto-matic mortar crusher for 1 min and dried at 70 °C for three days.Thermogravimetric analysis (TGA) and derivative thermogravimetricanalysis (DTG) were performed using the same device as described inSection 2.2.3. A total quantity of 74–92 mg was heated at 5 K/minfrom 20 to 1000 °C. The tests were performed at atmospheric pressurewith a nitrogen flow of 20 mL/min. Alumina (Al2O3) crucibles wereused in the experiments. The amount of chemically bound water,portlandite (CH) and calcite was determined by the mass losses. Themass losses were determined in three different temperature intervals.The mass loss due to the decomposition of CH, ranging from about410 °C to 550 °C, the mass loss corresponding to the decomposition ofmonocarboaluminates and calcite (release of CO2), measured between550 °C and about 750 °C, and themass loss corresponding to the releaseof chemically bound water (H), defined here as the measuredmass lossbetween 105 °C and about 1000 °C minus the mass loss due to carbon-ation (measured between 550 °C and about 750 °C). The start and endof each temperature interval are determined for each sample based onthe DTG-curve. The mass losses were calculated taking into accountthe molecular weight of each component (CH, calcite and water) andwere expressed as % of the dry mortar mass at 550 °C. Moreover, themass losses of CH and calcite were corrected taking into account theoriginal calcite content (ex. batch 2 sample) and the chemical reactionbetween CH an CO2 (carbonation) using the methodology describedin [30].
Powder X-ray diffraction (XRD) spectrums were obtained withpulverized mortar samples from the same batches used to obtain theTG/DTG profile. XRD qualitative analysis was carried out using the samedevice as described in Section 2.2.2 with Cu Kα1 radiation and a 2 h scan-ning range between 3° and 70°. The XRD scans were run at 0.05° per stepwith a counting time of 5 s.
2.2.11.3. Permeable (water accessible) porosity. To assess the permeableporosity and other related durability properties of the mortars contain-ing nSS, two cylindrical samples (height of approximately 110 mm, di-ameter of 100 mm) for the reference, silica sludge batches 1–2 and forthe micro-silica slurry were cast, striped after 1 day and cured underwater for 28 days. Three mortar discs, two with a height of approxi-mately 15 mm and one with a height of approximately 50 mm foreach mortar mix were extracted from the inner layers of eight differentcylindrical samples. In total 16 discs (15 mm in height) were used todetermine the permeable porosity, following the procedure describedin the ASTM 1202 [31] and the remaining discs were used for the RCMand conductivity test (Section 2.2.11.4). The vacuum-saturation tech-niquewas applied tofill the accessible poreswithwater, as this techniqueis concluded to be the most efficient by Safiuddin and Heran [32].
2.2.11.4. Rapid Chloride Migration (RCM) test and conductivity test. To un-derstand the impact of cement replacement on the durability of cementpastes, the Rapid ChlorideMigration test was performed. In total 8 discs(50 mm in height), two for each mix, were used for RCM tests at theage of 28 days. One day prior to the RCM test, the specimens werepre-conditioned (vacuum-saturation with limewater). The RCM testwas performed according to NT Build 492 [33], using the test set-updescribed in [34]. The duration of the RCM test for all samples was24 h. After the test, the penetration depth of chlorides was measured
on split samples by applying a colourimetric indicator for chlorides(0.1 M AgNO3 solution) and the values of the chloride migration coeffi-cients (DRCM) were calculated according to [33].
Before the RCM test, the electrical resistance was measured on thesame saturated samples by using the so-called ‘two electrodes’method[35]. For this, an AC test signal (f = 1 kHz) was applied between twostainless-steel electrodes and the resistance of the concrete sampleplaced between the electrodes was registered. Finally, the conductivityof the samples was calculated taking into account their thicknessesand transversal areas.
3. Results and discussion
3.1. Characterization of the PV silica-rich sludge
3.1.1. FEG-SEM and EDS analysisFig. 1, shows themorphology of the different nSS particles of batches
1, 2 and 3 obtained using a FEG-SEM microscope. The nSS is character-ized by a wide particle size distribution, containing particles in themicro- and nano-range (Fig. 1a) that show a highly agglomeratedstate. Angular, irregular and spherical particles are also identified. Thesemi-quantitative chemical analysis that was performed using an EDSdetector demonstrates that the nSS batch 1 has a high content of SiO2
(86–95%). Other elements that were identified were Na, Al and P.These elements probably originate from the stabilization agents thatare normally used in colloidal silica products and the chemicals totreat the waste water as well. The analysis of nSS of batches 2 and 3shows small angular and spherical particles (Fig. 1b–c). The sphericalparticles are composed of SiO2 (silica fume), commonly used in thepreparation of CMP slurries [11]. In addition, small angular particleswith a high content of Ca and C (detected by EDS) were also identified.The calcium richparticles are composed of CaCO3 (validated byXRD andTG/DSC analysis), which is used for CMP slurries as well [10–12]. Thechemical analysis demonstrates that the silica sludge of batches 2 and3 have a lower content of SiO2 (46.8%) compared to batch 1. Other el-ements that were identified are C, Na, Cl, Ca, Mg, K, and Al. Anotherobservation is that the chloride content in the samples is high,reaching values of 0.56 to 1.9%. The high chloride concentration origi-nates,most likely, from theuse of deflocculating agents of thewaste treat-ment or from chlorates used as oxidizing agents [36]. Several authorsreported [36–38] thatwater extracted from the sludge is normally treatedwith aluminum poly-chloride compounds to deflocculate the nano-particles.
3.1.2. X-ray fluorescence (XRF) and X-ray diffraction (XRD) analysisIn order to obtain detailed information on the chemical composition
of the investigated nano-silica sludge, a quantitative X-ray fluorescenceanalysiswas performed. The results are shown in Table 4. The data dem-onstrate that the nano-silica sludge of batch 1 is rich in SiO2 (80.6%),Al2O3 (8.9%), P2O5 (3.2%) and SO3 (2.1%). These results are in line withthe chemical analysis performed using the EDS detector. Furthermore,it is demonstrated that the silica sludge of batches 2 and 3 is rich inCaO and SiO2, with an equivalent content between 41 and 43 wt.% ofSiO2 and 45 to 56 wt.% of CaO. Another observation is the high concen-tration of chloride (Cl−), confirmed in both samples (1.34 to 1.9 wt.%).This concentration of chloride is above the maximum concentration(0.3 wt.%) specified for micro-silica in NEN EN 3263-1:200 [39] and itis inclusively higher than themaximum concentration specified for Bot-tom ashes (0.62 wt.%) [40]. In this case, it is recommended to determinethe total chloride content in these samples by titration method as it isspecified in DIN EN 196-2 [41] for cement. The high chloride contentwould limit the application of this type of waste sludge in concrete,makes it maybe not feasible for special exposition classes.
In addition to the XRF analysis, X-ray diffraction (XRD) measure-ments were performed to verify whether the silica sludge has crystal-line impurities. The results for the silica sludge of batch 1 are shown in

Angular particles (CaCO3)
Spherical silica fume
10 µm
b
5 µm
Nano-particles agglomerates
c
a
Debris
Nano-particles agglomerates
50 µm
Fig. 1. FEG-SEM photomicrographs of nSS, a) batch 1, b) batch 2 and c) batch 3.
Table 4Chemical composition of the waste silica sludge and reference micro-silica by XRF.
Substance Batch 1(mass %)
Batch 2(mass %)
Batch 3(mass %)
Micro-silica(mass %)
SiO2 80.58 40.67 43.09 96.12Na2O 2.55 0.36 0.27 0.21Al2O3 8.86 1.50 1.37 0.86Fe2O3 0.39 0.41 0.47 0.34CaO 1.96 55.79 44.51 0.39Cl 0.56 1.86 1.34 0.30P2O5 3.22 0.02 0.03 0.07K2O 0.14 0.13 0.11 1.05MgO 0.15 0.75 0.60 0.53TiO2 0.06 0.06 0.06 0.01MnO 0.01 – 0.03 0.04SO3 2.07 0.28 0.15 0.36Total C 1.01 11.91 10.69 0.66
165G. Quercia et al. / Cement and Concrete Research 54 (2013) 161–179
Fig. 2 (diffraction pattern—a). The XRD spectrum shown in Fig. 2 is typ-ical for materials with high content of amorphous phases; no crystallinephases were identified for this batch. On the contrary, the results of thesilica sludge of batches 2 and 3, shown in Fig. 2 (diffraction pattern—band pattern—c, respectively), revealed that in these two samples thecontent of crystalline phases (in addition to amorphous SiO2) is high.The crystalline phases identified were mainly calcium carbonates(type CaCO3) and chloride containing phases (NaCl and CaCl2). In addi-tion, also CaO and remnant Si were found, probably in small amounts,based on the relative height of their peaks. These results are in linewith the high calcium and chloride content found by the EDS and XRFanalyses.
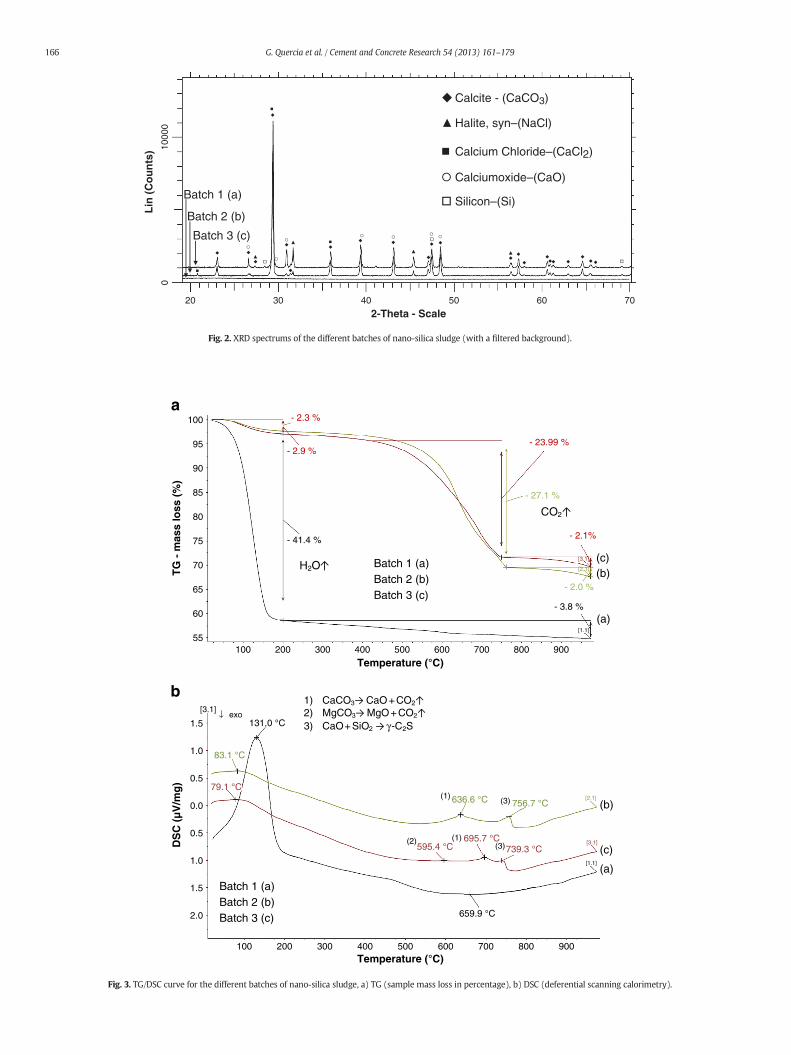
3.1.3. Gravimetric (TG) and differential scanning calorimetry (DSC)To complement the characterization of the different silica sludge
samples, a combined TG/DSC analysis was performed. Fig. 3a showsthe mass loss over the temperature. It is evident from Fig. 3a thatbatch 1 is mainly composed of water (42 to 45%) and amorphous SiO2.The temperature range between 20 and 200 °C, where this batchshows the main mass loss, is typically for hydroxylated colloidal silica,which is mainly used in the production of CMP slurries. The peakshown in Fig. 3b (131 °C) is related with zeolitic water (water insidethe porous structure of the amorphous silica). In case of batches 2 and3, the water content is lower than batch 1, but both samples have amain loss ofweight between420 and 750 °C. This loss ofweight is causedby the de-carbonatation (CO2 release) of the calcium carbonates. Takinginto account the loss of mass (23–27% CO2) and the molecular weightof each compound, it is possible to estimate that batch 2 and batch3 have 56% and 49% of CaCO3 respectively. Analyzing Fig. 3b, severalobservations can be made. Firstly, the peak where the water is re-leased is related to the difference in the porous structure (explainedin Section 3.1.4) and to the composition of both samples. The peakscorresponded to 131 °C to batch 1 and between 79.1 and 83.1 °C forbatches 2 and 3. Secondly, the successive peaks for batches 2 and 3are related to the de-carbonation of CaCO3 (636.6 and 695.7 °C) andMgCO3 (595.4 °C) and the consequent formation of CaO, which reactslater with the amorphous SiO2 to form γ-C2S (739.3 and 756.7 °C).
3.1.4. Nitrogen physical absorption (BET specific surface area) and densityanalysis
The different adsorption curves obtained for the batches of silicasludge are presented in Fig. 4a. All samples show absorption curves ofType IV, as it is classified by the International Union of Pure and AppliedChemistry (IUPAC) [42]. These curves are typical for mesoporous pow-ders. The calculated BET specific surface areas are: 178 m2/g for batch1, 29 m2/g for batch 2 and 38 m2/g for batch 3 (Fig. 4b). These resultsare in agreement with the FEG-SEM, XRD and XRF analyses. In general,a larger content of nano-silica in the samples gives a larger specific sur-face area. The BET surface area calculated for batches 2 and 3 is compa-rable to the values specified for micro-silica in NEN EN 13263-1:2005[39], where a value between15 and 35 m2/g is given. Using the calculatedBET specific surface area (Fig. 4b), the density of the particles (compareSection 3.1.5) and the procedure presented by [22], it was possibleto determine the size of the primary particles in the different batchesusing Eq. (1). An average primary particle size computed for the differ-ent batches of silica sludge were: 16 nm, 84 nm and 66 nm for batch 1,batch 2 and batch 3, respectively.
3.1.5. Specific density of the nano-silica sludge particles by heliumpycnometry
The results of the density measurements are depicted in Fig. 5together with the density limit of commercial nano- and micro-silica
2-Theta - Scale
Batch 1 (a)
20
010
000
30 40 50 60 70
Batch 2 (b)
Batch 3 (c)
Calcite - (CaCO3)
Halite, syn–(NaCl)
Calcium Chloride–(CaCl2)
Silicon–(Si)
Calciumoxide–(CaO)
Lin
(C
ou
nts
)
Fig. 2. XRD spectrums of the different batches of nano-silica sludge (with a filtered background).
a
b
Batch 1 (a)Batch 2 (b)Batch 3 (c)
(a)
(b)(c)
Temperature (°C)
TG
- m
ass
loss
(%
)
- 2.3 %
- 2.9 % - 23.99 %
- 2.1%
- 27.1 %
CO2
H2O
- 2.0 %
- 41.4 %
- 3.8 %
131.0 °C
659.9 °C
83.1 °C
636.6 °C 756.7 °C
79.1 °C
595.4 °C 695.7 °C
Batch 1 (a)Batch 2 (b)Batch 3 (c)
(a)
(b)
(c)
1) CaCO3 CaO +CO2
2) MgCO3 MgO + CO2
3) CaO+SiO2 γ-C2S
(1)(3)
(1)(3)
(2)739.3 °C
[3.1]
[1.1]
[1.1]
[2.1]
[3.1]
[2.1]
Temperature (°C)
DS
C (
µV
/mg
)
[3.1]exo
1.5
55
60
65
70
75
80
85
90
95
100
1.0
0.5
0.0
0.5
1.0
1.5
2.0
100 200 300 400 500 600 700 800 900
100 200 300 400 500 600 700 800 900
Fig. 3. TG/DSC curve for the different batches of nano-silica sludge, a) TG (sample mass loss in percentage), b) DSC (deferential scanning calorimetry).
166 G. Quercia et al. / Cement and Concrete Research 54 (2013) 161–179

(178m2/g)
(38m2/g)
(29y = 0.1500x + 0.0007
y = 0.1146x + 0.0006
y = 0.0243x + 0.0002
m2/g)
Daverage= 16nm
Daverage= 66nm
Daverage= 84nm
P/n
(P0-
P)
/ (cm
3 /(S
TP
)
Relative Pressure (P/P0)
Relative Pressure (P/P0)
Vo
lum
e A
dso
rbed
(cm
3 /g
ST
P)
a
b
600
500
Adsorption (Batch 1)
Description (Batch 1)
Adsorption (Batch 2)
Description (Batch 2)
Adsorption (Batch 3)
Description (Batch 3)
Batch 1
Batch 2
Batch 3
400
300
200
100
0
0.035
0.030
0.025
0.020
0.015
0.010
0.005
0.0000 0.1 0.2 0.3
0 0.2 0.4 0.6 0.8 1
Fig. 4. a) Nitrogen adsorption/desorption isotherms for the different batches of nano-silica sludge, b) BET plot derived in the relative pressure range from 0.20 to 0.04.
167G. Quercia et al. / Cement and Concrete Research 54 (2013) 161–179
powder [43]. In this context the nano-silica of batch 1 is the only samplewith density values in the nano-silica range (average 2.17 g/cm3). Theother two batches presented specific densities higher than the specifiedlimits for micro-silica (2.30 g/cm3). The average values obtained were2.45 g/cm3 for batch 2 and 2.40 g/cm3 for batch 3. The reason for thehigh density is the high content of CaCO3, as discussed previously;batch 2 and batch 3 have 52 and 62 wt.% of CaCO3, which density isabout 2.73 g/cm3.
3.2. Dispersability study with high shear energy mixer and zeta potential(ξ) measurements
Due to the highly agglomerated state of the nano-silica sludge, adispersability study was performed. For this study only a sample ofbatch 2 was considered based on the similarity to batch 3. Batch 1 wasdiscarded for the dispersability studies due to its high content of impu-rities. In addition, zeta potential was measured to study the stability ofthe dispersion. The results of the performed tests are presented inFigs. 6 and 7. Comparing the results shown in Figs. 6 and 7, several ob-servations and conclusions can be drawn. First, the size reducing effect
or dispersion ismore effective at 7000 rpm than at 3000 rpm. In the lat-ter case, an effective reduction was observed after the first 30 min ofstirring, but with proceeding stirring time, only the coarse particles(D(0.9) parameter) were affected, whereas the other two parameters(D(0.5) and D(0.1)) showed a constant value over that period. Thesame behavior was also confirmed by the constant values of the surfaceweighted mean, shown in Fig. 6b. It is evident that the introducedenergy was not sufficient to break the agglomerated particles tonanoparticles and to totally disperse them. The maximum amountof nanoparticles generated during the studied period was 14.5% by vol-ume. Similar trends were obtained with the experiments at 7000 rpm(Fig. 7). Even though more energy was introduced into the system,only D(0.9) and D(0.5) are effectively reduced. The highermixing ener-gy results inmore nanoparticles at shorter time. During the first 30 min,almost the same amount (by volume) of nanoparticleswas generated at7000 rpm as generated at 3000 rpm during 210 min. The maximumamount of nanoparticles generated at 7000 rpm was 22% by volume.This behavior has already been reported by different authors [44–47].In general, larger agglomerates suspended in a fluid are broken whenthe hydrodynamic forces exceed the cohesive bonds between particles

Number of cycles
Sp
ecif
ic d
ensi
ty (
g/c
m3 )
ρ1=2.17
ρ3=2.40
ρ2=2.45
mS
nSCommercial micro-silica
2.50
2.40
2.30
2.20
2.10
2.00
1.900 2 4 6 8 10 12 14
Commercial powder nano-silica
Batch 3
Batch 2
Batch 1
Fig. 5. Specific densities of the different batches of nano-silica sludge versus the number of measured cycles.
168 G. Quercia et al. / Cement and Concrete Research 54 (2013) 161–179
or smaller agglomerates. The strength of individual bonds depends onthe type of nanoparticles (van der Waals interactions), surface proper-ties (wettability, zeta potential, etc.) and the nature of the dispersionmedia (liquid bridges within agglomerates). Different mechanisms offracturing have been postulated (shattering, rupture and erosion) andtheir occurrence depends on the size of the agglomerates and the ener-gy introduced to the dispersion [45]. It has been postulated that erosionoccurs at low energy intensity and that particles are broken by fragmen-tation when the energy intensity increases [48]. As the agglomeratesbecome smaller during de-agglomeration, surface forces become moreimportant than mass forces and for agglomerates smaller than 1 μm,surface forces are more than one million times larger than mass force[49] (see, Fig. 8). Therefore, fracturing of large agglomerates is relativelysimple, whereas fracturing of agglomerates smaller than 1 μmmight bevery difficult and it has been suggested that the particles smaller than10 to 100 nm cannot be broken by mechanical action [50]. Probably, itis the case of the nano-silica sludge particles. It was easy to break thebigger agglomerates (decreasing of D(0.9) and D(0.5)), but the smallerones (D(0.1) and particles lower than 1 μm) reached a constant valueearlier (see, Fig. 7a). Based on these results, it can be concluded thatthe breaking mechanism is dominated by the erosion and rupture ofthe bigger agglomerates. In addition, it is evident that the energy intro-duced in the system (7000 rpm) and the time of stirring were notenough to produce shattering of the agglomerates to nano-particles.It is recommended to perform further research using another type ofmechanical mixing technique or increase the stirring time to more than210 min.
Other researchers reported [44,46,51] that the mechanical stirringshould be complemented with chemical additives to increase thedispersability and to overcome the forces involvedwhen small agglom-erates are generated during the dispersing process. For that reason,experiments with varying pH values of the dispersion were performed.The results for varying pH values of the dispersion between 7.8 and 9.6were similar (Fig. 9), only a small increase in the volume of nanoparticleswas observed. Nevertheless, the dispersion shows more stability overtime and less sedimentation of the particles was observed after 3 days.The zeta potential of the silica particles dispersed using the high-energy mixer is shown in Table 5. Studying the results presented inTable 5, it is evident that it is easier to disperse the silica sludge ofbatch 2 due to the higher zeta potential (−39.3 mV). It can be statedthat with higher pH value, the particle surfaces are more negatively
charged [52]. A more negative zeta potential produces more stable dis-persions due to the electrostatic repulsion of the particles, which avoidstheir re-agglomeration. The higher zeta potential improves the stabilityof the particles smaller than 1 μm. Despite of the higher stability, it isstill not possible to increase the volume of dispersed nano-particles tomore than 22% (Fig. 9b).
3.3. Hydration kinetics of cement pastes with nano-silica
Studying the obtained curves (Fig. 10a), it is evident that the replace-ment of cementwith different amounts of nSS of batch 2 does not have adecreasing effect on the heat flow of the blended paste. On the contrary,a higher heat flow was found due to the nucleation effects producedin the cement paste and due to the pozzolanic activity promoted bythe presence of amorphous nano-silica and CaCO3 particles (Fig. 10b).Different authors reported [6,53–56] that nano-particles can acceleratethe setting of cement pastes due to two acting mechanisms. The firstone is the so-called filler effect that appears when the nano-particlesare inert. Fillers with very high specific surface area produce more nu-cleation points for C–S–H seeds at early age. When the thermodynamicbarrier is exceeded, these nuclei start to grow and to form second stageC–S–H gel and portlandite [57]. The second effect is routed to the reac-tivity of the nano-particles in the case of amorphous SiO2. The smallamorphous SiO2 particles react with the CH released from the hydrationof the calcium silicates in the clinker forming extra C–S–H gel. Similarly,it is stated that part of the CaCO3 is reactive [58] and it can be incorpo-rated in the hydration products from the aluminate phases (ex. AFmor AFt) [6,58]. These two effects are probably acting at the same timeproducing the extra heat observed when the concentration of batch2 silica sludge is increased. Another observation can be made fromFig. 10a. It is possible to observe that higher amounts of silica sludgebatch 2 produce the appearance of a second peak (indicated by a blackarrow at 30 h in Fig. 10a). Normally, this peak appears at about 30 hof hydration and can be attributed to the formation of monosulfo-aluminate phases (AFm) [57,58] due to the reaction between the initialettringite (AFt) formed at early age and the remnant C3A. Likewise, itcan be also caused by the formation of manocarboaluminate (CO3–
AFm) as it was stated by other authors [6,58] for OPC–CaCO3 blends.The accelerating effect of the silica sludge batch 2 is evident fromFig. 11a. In this figure, it is possible to observe that the rate of heat(increasing slope) in the acceleration period follows a linear relationship

Stirring time (min)
Par
ticl
e si
ze p
aram
eter
D(0
.x)
(µm
)
Stirring time (min)
Su
rfac
e w
eig
hte
d m
ean
D[3
,2]
(µm
)
Vo
l. o
f p
arti
cles
sm
alle
r th
an 1
µm
(%
V)
a
b
35
30
25
20
15
10
5
0
10
9
8
7
6
5
4
3
2
1
0
0 50 100 150 200 250
0 50 100 150 200 2500
2
4
6
8
10
12
14
16
D(0.9)
D(0.5)
D(0.1)
3000 rpm (pH=7.54)
Particle Vol%
Fig. 6. a) Evolution of the granulometric parameters of one nano-silica sludge (batch 2, 3000 rpm over 210 min, pH = 7.54), b) surface weighted mean (D[3,2]) and volume (%) ofnanoparticles generated.
169G. Quercia et al. / Cement and Concrete Research 54 (2013) 161–179
(R2 = 0.99). It is possible that the slope of this period is related to theincreased amount of nucleation sites produced by the increased specificsurface area.
Despite of the accelerating effect described before, thepresence of SPin the silica sludge caused an extension of the dormant period (Fig. 10aand Table 6). The increasing amount of batch 2 nSS slurry increases thetotal SP content as well (see Table 2). Despite the retardation effect onthe dormant period (calculated as the time between the lower pointof the heat flow curve and the first inflection point in the main peak),the relative setting time (calculated as the time between the first andthe second inflection point in the heat flow curve), as well as the timeto reach the maximum hydration peak of the cement paste, were accel-erated. The pozzolanic activity of the silica sludge batch 2 is confirmedby the presence of an increase of the total heat shown in Fig. 10b. Thetotal heat is the contribution of heat produced by the cement particlesthemselves (accelerated by thefiller addition) and theheat contributionof the pozzolanic reaction between the nano-silica particles and the pre-cipitated Ca(OH)2 [58]. The total heat can be related to the hydration de-gree of the paste (α = Q(t)/Qmax) [59]. Similarly, the hydration degree
of the paste was related to the compressive strength of the paste, if theparameters of themicrostructure are similar (ex. porosity). Thus, highercompressive strength is expectedwith the progressive increase of nano-silica sludge. In contrast to the rate of heat evolution during the acceler-ation period, the maximum extrapolated heat (Qmax) follows an expo-nential trend (Fig. 11b) with a good correlation (R2 = 0.96).
As an additional hydration kinetic study, cement pastes followingthe recipe shown in Table 3 (without sand) were tested by isothermalcalorimetry. The purpose of this testwas to compare the effect of thedif-ferent silica sludge batches (1–3) at the same replacement level (7%bwoc) and comparable workability (adjusted by different SP amount)on the hydration kinetics of the standard mortars. The resultant heatflow and accumulative heat evolution curves are shown in Fig. 12.In Fig. 12a, it is possible to observe that the silica sludge of batch 1presented, at the initial 24 h of hydration, a lower heat flow but awider peak compared to the pure cement paste. These differences canbe attributed to several factors. The first influencing factor is related tothe delaying effect due to the presence of SP in the paste of batch 1(0.68% bwoc). Nevertheless, the delaying effect of the SP normally

Stirring time (min)
Su
rfac
e w
eig
hte
d m
ean
D[3
,2]
(µm
)
Vo
l. o
f p
arti
cles
sm
alle
r th
an 1
µm
(%
V)
Stirring time (min)
Par
ticl
e si
ze p
aram
eter
D(0
.x)
(µm
)
a
b
40
35
30
25
20
15
10
5
0
14
12
10
8
6
4
2
00 50 100 150 200 250
0
5
10
15
20
25
0 50 100 150 200 250
D(0.9)
D(0.5)
D(0.1)
7000 rpm (pH=7.94)
Particle Vol%
Fig. 7. a) Evolution of the granulometric parameters of one nano-silica sludge (batch 2, 7000 rpm over 210 min, pH = 7.94), b) surface weighted mean (D[3,2]) and volume (%) ofnanoparticles generated.
101
FD
capillary force
van der Waals force
electr
osta
tic fo
rce
parti
cle
wei
ght
100
10-1
10-1 100 101
Particle size D [μm]
Adh
esiv
e fo
rce
[μN
]
102 103
10-2
10-3
10-4
Fig. 8. Interparticle forces of spherical particles and particle weight in dependence of theparticle diameter [71].
170 G. Quercia et al. / Cement and Concrete Research 54 (2013) 161–179
influences the dormant period (as it is evident from Table 7) but willnot change the height of the maximum peak of hydration. A change inthe maximum peak height is normally expected with retarding agentsinstead of PCE type superplasticizer [60]. This leads to a second possiblefactor that could produce the reduction in the hydration peak. Thesecond factor should be the precipitation of initial hydration products,supported by a higher heat during the initial dissolution of the pastes(initial 2.5 h), or the adsorption of some contaminants such as un-known organics or water-soluble phosphates (batch 1 has 3.2% ofP2O5) on the surface of the cement grains with some protective proper-ties producing a retarding effect in the rate of Alite hydration. Thus, thehydration rate is reduced (see Fig. 13a), but extended in time (wideningthe hydration peak). The widening of the hydration peak is also the re-sult of the higher rate of hydration in the aluminate phases. Differentauthors [58,60] reported that a small amount (0.05%) of water-solubleP2O5 or organophosphonates produces setting retardation. The mecha-nism reported [60] involves the adsorption of phosphonate groups ontothe nuclei of cement hydrates, thus hindering their growth. Even though

Stirring time (min)
Stirring time (min)
Par
ticl
e si
ze p
aram
eter
D(0
.x)
(µm
) S
urf
ace
wei
gh
ted
mea
n D
[3,2
] (µ
m)
Vo
l. o
f p
arti
cles
sm
alle
r th
an 1
µm
(%
V)
a
b
35
30
25
20
15
10
5
0
12
10
8
6
4
2
0
0 50 100 150 200 250
0 50 100 150 200 2500
5
10
15
20
25
30
D(0.9)
D(0.5)
D(0.1)
7000 rpm (pH=9.3 - 9.6)
Particle Vol%
Fig. 9. a) Evolution of the granulometric parameters of nano-silica sludge (batch 2, 7000 rpm and 210 min, pH = 9.6), b) surfaceweightedmean (D[3,2]) and volume (%) of nanoparticlesgenerated.
171G. Quercia et al. / Cement and Concrete Research 54 (2013) 161–179
a lower heatflowwas observed in pasteswith the silica sludge of batch 1,the accumulative heat is similar at 78 h of hydration (Fig. 12b) and theextrapolated maximum heat becomes higher than for cement, butlower than that of the other silica sludge batches (2–3), as it is shownin Fig. 13b. The lower heat flow observed is not expected because the sil-ica sludge of batch 1 has the highest BET specific surface area (178 m2/g),thus a higher filler and pozzolanic effect are expected to produce an in-crease in the heat flow curve compared to the reference cement pasteand the other silica sludge batches (with BET of 29–38 m2/g).
Contrary to the silica sludge of batch 1, batches 2–3 presented higherheat flow than the cement paste, but similar to the reference micro-
Table 5Zeta potential of the nano-silica of batch 2 dispersed in tap water (1 wt.%) at 25 °C.
Sample Zeta potential (mV)
Silica sludge 3000 rpm pH = 7.4 −26.1Silica sludge 7000 rpm pH = 7.8 −26.6Silica sludge 7000 rpm pH = 9.6 −39.3
silica studied. The main differences observed are the heat released dur-ing the first hours and the height of the second hydration peak relatedto the aluminate phases. This is attributed to the different amount ofCaCO3 estimated (Section 3.1.3) in the silica sludge of batches 2–3 (56and 49%, respectively). The higher amount of CaCO3 (lower SiO2) ofthe silica sludge of batch 2 influenced in more extent the aluminatehydration peak mainly due to the filler and pozzolanic effect explainedbefore. The small difference in the composition is also observed inFig. 13a where the silica sludge of batch 2 shows a slightly lower rateof hydration (slope) during the acceleration period due to its lower con-tent of SiO2 compared to batch 3. Both silica sludges (batches 2–3) arecharacterized by slightly higher rate of hydration (slope during theacceleration period) compared to the reference micro-silica (Fig. 13a).It is caused by the higher BET specific surface area of the silica sludges(29, 38 and 22 m2/g for batch 2–3 and micro-silica, respectively). Also,the differences in the composition influenced the estimated dormantperiod, relative setting time and the time to reach the maximum peakof hydration as it is shown in Table 7. In general, a higher amount ofSiO2 with the same SP content (0.44% bwoc) produced shorter dormant

ΔQ
Qmax= QCEM·fCEM + QnSS·fnSS
1.5CH + S +2.5H →C1.5SH3.8
RST
TRMP
Dormant period
RST: Relative setting time TRMP: Time to reach the maximum peak ΔHF: Change in heat flow
ΔHF
AFm: monosulfoaluminate
phases
a
b
5.0
4.0
3.0
2.0
1.0
0.0
350
300
250
200
150
100
50
0
0 10 20 30 40 50 60 70
Time (h)
0 10 20 30 40 50 60 70 80
Time (h)
Hea
t fl
ow
(m
W/g
cem
ent)
Hea
t (J
/gce
men
t)
2.0
1.6
1.2
Hea
t fl
ow
(m
W/g
cem
ent)
Time (h)
0.8
0.40 1 2
CEM I 52.5N
3% bwoc silica sludge batch 2
6% bwoc silica sludge batch 2
9% bwoc silica sludge batch 2
CEM I 52.5N
3% bwoc silica sludge batch 2
6% bwoc silica sludge batch 2
9% bwoc silica sludge batch 2
3 4 5
Fig. 10. a) Normalized heat flow of cement pasteswith batch 2 nSS addition (bwoc) and details of the different stages of the dormant period, b) normalized total heat evolution of cementpastes (Q) with batch 2 nSS addition (bwoc).
172 G. Quercia et al. / Cement and Concrete Research 54 (2013) 161–179
period and setting times for the silica sludge of batch 3. Nevertheless, itdoes not apply for themicro-silica slurry (96% of SiO2 and 0.24% bwoc ofSP), which shows a longer dormant period and the time to reach themaximum hydration peak (see, Table 7).
Fig. 13b shows the maximum extrapolated heat for the differentpastes with 7% cement replacement. The cementitious properties ofthe different silica sludge batches are confirmed by the presence of anincrease of the total heat compared to the cement reference. The totalheat is the contribution of heat produced by the cement particles them-selves (accelerated by the filler addition) and the probable heat con-tribution of the pozzolanic reaction between the nano-silica particlesand the precipitated portlandite [58]. A further analysis is presented inSection 3.5.
3.4. Compressive strength tests of cured cement mortars and pozzolanicactivity
The evolution of the mechanical properties of the different mortarstested is shown in Fig. 14. Analyzing the evolution of the flexural
strength over time (Fig. 14a), several observations can be made. Atearly age (1 day) the flexural strength was influenced by the differentdoses of SP added to the mortar (see Table 3). The nano-silica of batch1 showed the lowest flexural strength due to the high content of SP(0.68%) and probably due to differences in their chemical compositionand the presence of contaminants. On the contrary, batches 2 and 3showed already at 1 day comparable flexural strength than the refer-ence standard mortar (CEM I 52.5 N). At 7 days, the same behavior inthe flexural strength was observed for all tested mortars, with the ex-ception that the difference in the strength of batch 1 to the referencemortar is smaller. Finally, at 28 days all tested mortars obtained lowerflexural strength than the reference mortar. It is important to noticethat all 28 days average flexural strength values are near to the errorband of the test (±8.3%).
In case of the compressive strength of the tested mortars (Fig. 14b)at 1 day, it is also possible to observe the influences of the different SPconcentration. At this age, the mortar prepared using the nano-silicaof batch 3 showed the highest compressive strength. In addition, thenano-silica of batch 1 presented the lowest compressive strength —

y = 36.53x+ 654.75R2 = 0.99
y = 343.44e0.01x
R2 = 0.96
a
b
1,200
1,000
800
600
400
Slo
pe
acce
lera
ted
per
iod
(μW
/gce
men
t. h)
Ext
rap
ola
ted
max
. hea
t (J
/gce
men
t)
200
0
400
390
380
370
360
350
340
330
320
310
300
0 2 4Nano-silica sludge addition (wt.%)
6 8 10
0 2 4Nano-silica sludge addition (wt.%)
6 8 10
Fig. 11. a) Changes in the slope of the accelerated period caused by the addition of nSS(data were derived from the curves of Fig. 9a, b) changes in the extrapolated maximumheat of cement paste with nSS (derived from the curves of Fig. 9b taking into account anexponential fit decay model).
AFm: monosulfoaluminate phases
+ ΔHF
- ΔHF
ΔQ
a
b
4.5
4.0
3.5
3.0
Hea
t fl
ow
(m
W/g
cem
ent)
Hea
t (J
/gce
men
t)
Time (h)
2.5
2.0
1.5
1.0
0.5
0.0
350
300
250
200
150
100
50
0
0 10 20 30 40 50
Time (h)0 20 40 60 80
CEM I 52.5N (No SP)
Batch 1 (SP 0.68 wt%)
Batch 2 (SP 0.44 wt%)
Batch 3 (SP 0.44 wt%)
Micro-silica (SP 0.24 wt%)
CEM I 52.5N (No SP)
Batch 1 (SP 0.68 wt%)
Batch 2 (SP 0.44 wt%)
Batch 3 (SP 0.44 wt%)
Micro-silica (SP 0.24 wt%)
Fig. 12. a) Normalized heat flow of cement pastes with 7% bwoc of nSS and different SPcontent, b) normalized total heat evolution of cement pastes (Q) with 7% bwoc of nSSand different SP content.
173G. Quercia et al. / Cement and Concrete Research 54 (2013) 161–179
(similar to the flexural strength). The lowest compressive strength ofthe silica of batch 1 is the result of its P2O5 content. The 1 day compres-sive strength results are in line with the calorimetric curves shown inFig. 12a. At 7 days, the strength development of the samples of batches2, 3 and the referencemicro-silica reached higher compressive strengththan the referencemortar (CEM I 52.5 N). At this age, the delaying effectobserved for the silica sludge of batch 1 is still evident. Finally, at28 days the compressive strength of the mortar with nano-silica ofbatch 3 resulted in higher compressive strength than the mortar with100% cement (CEM I 52.5 N), but lower than the micro-silica mortar.At this age, the mortar prepared with silica sludge of batch 1 showedthe lowest compressive strength (60 N/mm2). Apparently, at 28 daysthe delaying effects produced by the P2O5 content in batch 1 are over-come and the mortar developed its normal strength. Another factor totake into account in the compressive strength results is the volume of
Table 6Hydration kinetics of cement pastes containing nano-silica of batch 2.
Paste type Dormant period(h:min)
Relative setting time(h:min)
Peak time(h:min)
CEM I 52.5 N 0:39 2:03 7:393% bwoc nSS batch 2 1:03 1:56 7:206% bwoc nSS batch 2 1:22 1:45 6:589% bwoc nSS batch 2 1:35 1:40 6:35
air voids of themortarswhich influences thefinal compressive strength.In general, it is empirically accepted that 1% increase in air void volumewill lead to a 5% decrease in compressive strength [61]. Table 3 showsthe estimated air void content of the hardened mortars. The data listedin Table 3 reveal that the mortar with the highest air void content wasbatch 1 (11%) and the lowest value was obtained by the mortar withmicro-silica (4%). The difference in the air void content helps to explainwhy the silica sludge of batch 1 presented the lowest compressivestrength despite of its highest specific surface area. The methodologyused to obtain themechanical properties of themortar can be validatedcomparing the specified values of the cement (CEM I 52.5 N) as pub-lished in the ENCI “Betonpocket 2010” [62] (1 day 22 ± 3 N/mm2 and28 days 65 ± 4 N/mm2). In this case, the experimental values obtainedare in the range reported for this type of cement produced in the ENCImanufacturing facilities of Maastricht, The Netherlands.
Table 7Hydration kinetics of cement pastes containing 7% bwoc of the different samples studied.
Paste type Dormant period(h:min)
Relative setting time(h:min)
Peak time(h:min)
CEM I 52.5 N (No SP) 0:42 2:10 8:47Batch 1 (SP 0.68%) 1:32 1:31 10:48Batch 2 (SP 0.44%) 1:49 2:01 9:38Batch 3 (SP 0.44%) 1:29 1:51 8:19Micro-silica slurry (SP 0.24%) 1:41 1:58 9:32

a
b
0.8
0.6
0.4
Slo
pe
acce
lera
ted
per
iod
(mW
/gce
men
t. h)
Ext
rap
ola
ted
max
. hea
t(J
/gce
men
t)
0.2
0.0
370
365
360
355
350
345
340
335
330
CEM I 52.5N Batch 1 Batch 2 Batch 3 Micro-silica
CEM I 52.5N Batch 1 Batch 2 Batch 3 Micro-silica
Fig. 13. a) Changes in the slopeof the accelerated period causedby the addition of 7%bwocof nSS and different SP amount, b) changes in the extrapolated maximum heat of cementpastewith 7% bwoc of nSS and different SP content. The datawere derived from the curvesof Fig. 12a and b.
Fle
xura
l str
eng
th (
N/m
m2 )
Co
mp
ress
ive
stre
ng
th (
N/m
m2 )
a
b
12
10
CEM I 52.5NBatch 1Batch 2Batch 3Micro-silica
CEM I 52.5N
Batch 1
Batch 2
Batch 3
Micro-silica
8
6
4
2
0
70
60
50
40
30
20
10
0
1 7Age (days)
28
1 7Age (days)
28
5.4
23
51
61
1522 22
42
53 5360 61 63 64
55
25
8.6 8.5
3.6
5.56.2 5.8
7.99.1 9.1 8.9
7.78.4
7.6 8.0
Fig. 14. Development of the mechanical properties of the tested mortars (7% nSS bwoc),a) flexural strength, b) compressive strength.
Lower limit EN 13263-1
110
7 days activity index
28 days activity index105
100
Po
zzo
lan
ic a
ctiv
ity
ind
ex
95
90
85
80Batch 1 Batch 2 Batch 3 Micro-silica
82
102
107
104
99100
103
106
Fig. 15. 7 and 28 days pozzolanic index of the different nSS slurries tested.
174 G. Quercia et al. / Cement and Concrete Research 54 (2013) 161–179
The values of the 7 and 28 days compressive strength were used toestimate the relative pozzolanic activity index of the different nano-silica and the micro-silica sample. The pozzolanic index was calculatedbased on the compressive strength of the reference mortar (100%) andis shown in Fig. 15. The computed activity index demonstrated thatthe nano-silica sludge has pozzolanic activity and confirms the resultsobtained by the isothermal calorimetric measurements. The activityindex varied between 82 and 107 for all silica samples. Only the mortarwith the silica sludge of batch 1 showed an index lower than 100%. Onthe contrary, themortars with silica sludge of batches 2 and 3 presenteda pozzolanic activity index of 100–103%. In general, the minimum poz-zolanic activity index specified for micro-silica is 95 (lower limit) [39],this means that it is possible to classify the nano-silica sludge as a poz-zolanic material like the micro-silica tested. Even though positiveresults were obtained, further research is needed to guarantee a con-stant quality of the nano-silica sludge due to the variations that wereobserved for the analyzed different batches. Furthermore, extra testsshould be performed to determine themaximum amount of cement re-placement that can be realized by the application of this type of wastenano-silica.
3.5. Characterization of the hydrated mortar
3.5.1. Microstructural characterization and analysisFig. 16 shows an overview of thematrix and sand distribution of the
hardened mortars. The microstructural characteristics of the mortarswere found to be similar. The main differences observed were in the
air void content and the narrow pore size distribution. It is expected be-cause of the varying air void content of the mortars. The highest valuewas measured for batch 1 (11%) and the lowest for the micro-silica(4%), as it is shown in Table 3. Nevertheless, from a microstructuralpoint of view, the mortars prepared with batch 1 and micro-silicapresented a denser and lower porous interphase than the cement sam-ple (Fig. 16e and f). On the contrary, in batch 2 more small pores were

a
Reference
1 mm
1 mm
Batch 1
Air voids
Batch 2
1 mm Porous
Porous
1 mm
Micro-silica
b
c d
50 µm 20 µm
e f
ITZ
Micro-silica Batch 1
ITZ
Fig. 16. ESEM–BSE pictures of different mortars tested at 28 days, a) reference, b) batch 2, c) batch 1, d) micro-silica, e) detailed ITZ in batch 1 mortar and f) detailed ITZ in micro-silicamortar.
175G. Quercia et al. / Cement and Concrete Research 54 (2013) 161–179
observed in the sand grain interphases. In addition, only themortar for-mulated with silica sludge of batch 1showed big unreacted agglomer-ates that are rich in iron (verified by EDS). Despite the presence of bigagglomerates, the hardened matrix looks denser, probably due to ahigher degree of hydration caused by the presence of amorphous silicaparticles with high specific surface area. In the following sectionsmore evidence will be provided about the different effects of the silicasludges.
3.5.2. Phases composition of the hydrated mortars by TGA/DTG and XRDThe extent of cement hydration was estimated from changes ob-
served by TGA/DTG and relative changes in the peak intensities of thecrystalline phases in the XRDpatterns. The results of thermogravimetricanalysis are summarized in Fig. 17a and Table 8. For the interpretationof TGA/DTG results shown in Fig. 17a, it has been reported [57,58,63]
that the mass loss at 100–130 °C corresponds to the evaporation ofadsorbed water, at 115–125 °C to C–S–H gel, ettringite at tempera-tures of 120–130 °C, AFm phases at 180–200 °C, calcium hydroxide(portlandite) in the range of 410–550 °C and calcium carbonate at680–750 °C. In addition, a presence of a broad initial peak, related to aCO2 release at 550–680 °C has been attributed as an indication of theformation of significant fraction of calcium manocarboaluminate [64].When comparing the mass loss in the different mixtures, four differ-ences can be observed. Firstly, the initial shoulder presented at the tem-perature range of 85–115 °C disappeared in the case of the silica ofbatch 1 and becomes more noticeable in the case of the micro-silicamortar. Secondly, the main peaks attributed to the portlandite amountin the mortars are low compared to the peak of the reference mortar.This is caused by the pozzolanic reaction produced by the presence ofamorphous SiO2 in the silica sludge (batches 1–2) and the micro-silica

b
10 20 30 40 502-Theta - Scale
Lo
g (
Co
un
ts)
Temperature (°C)
DT
G -
dif
fere
nti
al m
ass
loss
(%/m
in)
TG
- m
ass
loss
(w
t.%
)
a
Reference
Batch 1
Batch 2
Micro-silica
0.02
0
-0.02
-0.04
-0.06
-0.08
-0.1
-0.12
0.14
-0.16
-0.180 100
ReferenceBatch 1Batch 2Micro-silica
200 300 400 500
Portlandite
Ettingite
Calcite
AFm
C-S-H
Monocarbonate
600 700 800 900 100093
94
95
96
97
98
99
100
Fig. 17. a) TGA/DTG of the mortar studied, b) 28 days XRD spectra for the tested mortars,■ alite, Δ belite, ◘ ferrite, ♦ calcite, □ α-quartz, ◯ portlandite, ▲ ettringite, ◊ calciummonosulfoaluminate and ● calcium monocarboaluminate.
25
20 19.1 19.4 19.517.5)
176 G. Quercia et al. / Cement and Concrete Research 54 (2013) 161–179
slurry. Thirdly, the two peaks related to the monocarboaluminates andcalcite decomposition are different. The height of these two peaks de-pends on the initial CaCO3 content of the cement and silica sludge ofbatch 2. One interesting observation is the fact that both peaks areshifted to the right for the case of batch 1. This is an evidence of therefinement of the microstructure due to a higher degree of hydration.Finally, the last difference is observed for the peak at 750–930 °C,which is bigger in the presence of the silica sludge andmicro-silica. Un-fortunately, no direct explanation of this extra mass loss was found inthe literature. This peak is related to the decomposition of other un-known remnant phases (sulfates or other hydrates) that are formeddue to the refinement of the C–S–H gel caused by the promoted pozzo-lanic reaction between silica nano-particles with high specific surfacearea. Evidence for this is that the peak is higher for the samples withmore surface area and amorphous silica content. The quantitative re-sults calculated by the mass loss and stequiometric considerations areshown in Table 8. For the data presented in Table 8 it is evident that
Table 8Results of thermogravimetric analysis of the studied standard mortars.
Mortar Portlandite(wt.%)
Chemicallybound water(wt.%)
Calcite(wt.%)
CEM I 52.5 N (No SP) 9.42 3.40 2.25Batch 1 (SP 0.68%) 6.09 3.82 1.94Batch 2 (SP 0.44%) 6.76 3.23 2.57Micro-silica slurry (SP 0.24%) 6.23 3.74 1.76
the portlandite content is considerably decreased (34–35% average) forbatch 1 and micro-silica mortars. The decrease is low (28%) for batch 2.The results demonstrated that the silica sludge (batches 1–2) posessupplementary cementitious properties. In addition, the calculatedchemically bound water that gives indication about the hydrationdegree of the mortar's cement matrix is high in the presence ofbatch 1 and micro-silica. On the contrary, batch 2 presented loweramount of chemically bound water. It can be attributed to dilutioneffects (less cement content) and lower reactivity due to its diminishedcontent of SiO2 (40.7%). Similarly, the final calcite content varieddepending on the sludge composition. The lowest values were foundfor the samples with higher amount of SiO2 (batch 1 and micro-silica).It is possible that the promotion of the hydration due to the filler andpozzolanic effect increases also the partial reactivity of CaCO3 (formationof mono and hemicarboaluminate phases) [6].
The results obtained by TGA/DTG were confirmed by XRD. A closerinspection of the XRD patterns (Fig. 17b) shows qualitatively the de-creased intensities of the alite, belite, aluminate and ferrite phases inmortars with silica sludge (batches 1–2) and micro-silica compared tothe reference sample, which is evident for higher hydration degrees.The main phases identified were quartz, calcite and portlandite. Thehydrated phases identified were ettringite and in minor extent calciummonosulfoaluminate andmonocarboaluminate. Other phases could notbe identified in the XRD analysis as many peaks overlapped or arepoorly crystalline. The TG/DTG and XRD results are consistent to thethermodynamically modeled expected phases for the complete hydra-tion of Portland cement blended with SiO2 [6,64]. For a concentrationof 3 to 5% of SiO2 (equivalent added with a 7% cement replacement bythe different sludges) the expected phases are ettringite, portlandite,monocarboaluminate, hydrotalcite, calcite, aluminum hydroxide andjennite-like C–(A-)S–H gel.
3.5.3. Permeable (water accessible) porosityThe results of the measurements of the permeable or total porosity
of the mortars are presented in Fig. 18. The results are surprisinglyshowing that the reference mortar has comparable porosity (19.1%) asthe mortars containing silica sludge of batches 1–2 (19.4 and 19.5%, re-spectively). On the contrary, themortarwithmicro-silica has the lowesttotal porosity (17.5%). The porosity and the tortuosity of the pores in thehardened cement paste are normally reduced when pozzolanic mate-rials are added, and this influences many properties such as the com-pressive and splitting tensile strength [65]. Nevertheless, Yogendranand Langan [66] stated that for the addition of micro-silica the totalpore volume is not necessarily changed, but larger pores appear to besubdivided into smaller pores. Apparently, the same behavior wasfound for the mortars containing silica sludge. In addition, it has beenstated [6] that the partial replacement of cement with SCM leads to adecrease in the total volume of formed hydration phases. This means
15
To
tal p
oro
sity
(V
ol.%
10
5
0CEM I 52.5N Batch 1 Batch 2 Micro-silica
Fig. 18.Water permeable or accessible porosity at 28 days of the tested mortars.

177G. Quercia et al. / Cement and Concrete Research 54 (2013) 161–179
that blended pastes have higher total porosities than 100% OPC pastes.This can be the reason of the high porosity values found. Another factorof influence is related to the different air content of the mortars. Someresearchers [32] state that the vacuum-saturation technique is alsoable to take air voids into account. This means that the porosity valuesshown in Fig. 18 consider also the differences in the air content of themixes (the lower the air content the lower the permeable porosity).This is in line with the lowest value of total porosity found for themicro-silica mortar which poses as well the lowest air void content(4%) and with the general microstructure observed by SEM analysis asdescribed in Section 3.5.1. Even though the highest total porosity wasmeasured for the silica sludge mortar a refined pore structure wouldbe expected.
3.5.4. Rapid Chloride Migration (RCM) test and conductivity testFig. 19a shows the average values of the conductivity measured
on hardened cylindrical reference mortars and the mortar with silicasludge of batches 1–2 and micro-silica. It is clearly demonstrated thatthe conductivity of the mortar is reduced by the silica sludge of batch1 (−45%) and by themicro-silica (−79%) compared to the referencesamples. Meanwhile, the mortar with the silica sludge of batch 2presented a slightly lower conductivity than the reference sample(−3.5%). This behavior is an indication of the ability of the water sat-urated pore structure of the hydrated mortar to transport electricalcharge. Different authors [67–69] established that the conductivity isdirectly related to the porosity, the pore structure (tortuosity, connec-tivity and conductivity) and to the pH of the pore solution (the pH inpresence of amorphous silica is decreased, as was established in [34]).
a
b
35
30
29
16
28
6
25
20
15
10
5
0
16
1413.9
9.0
13.7
3.1
12
10
8
6
4
2
0
CEM I 52.5N
Co
nd
uct
ivit
y (m
S/m
)
Batch 1 Batch 2 Micro-silica
CEM I 52.5N Batch 1 Batch 2 Micro-silica
DR
CM
(x1
012
m2 /
s)
Fig. 19. 28 day results of the tested mortars, a) conductivity, b) chloride migration coeffi-cient (DRCM).
In general, higher porosity means higher conductivity due to the pres-ence of more volumetric fractions of interconnected pores. The lowerconductivity values shown by the mortars with high amount of nano-silica (batch 1 and micro-silica) are the result of the pore structurerefinement (less connected pores) due to the progressive pozzolanicreaction and higher hydration degree (confirmed by TG/DTG and themicrostructural analysis). Apparently, the lower concentration of SiO2
(40.7%) and the highest concentration of CaCO3 in batch 2 producedsimilar conductivity values compared to the reference sample. Thisbehavior is consistent with the low hydration degree presented in thismortar (lower chemically bound water content). These results demon-strate that the replacement of cement by the silica sludge does not haveadverse effects on the pore structures. On the contrary, similar or lowerconductivities are obtained due to a refined pore structure. Thus, theimprovement of the pore structure of concrete depends on the equiva-lent SiO2 content of the silica sludge.
The Rapid Chloride Migration test (performed according to NT Build492 [33]) is a commonly used accelerated technique for determiningthe chloride transport rate in concrete. The output of the test (the so-called chloride migration coefficient DRCM) is employed in service-lifedesign models for concrete elements and structures exposed to chlo-rides. This technique was employed in the standard mortar to assessthe possible effect of the chloride content of the silica sludges on thedurability of the hardened mortars. In this context, Fig. 19b presentsthe average values of the calculated chloride migration coefficient(DRCM) of each mortar studied. Like the conductivity test results, themigration coefficients are much lower for the mixes containing highamounts of silica. The mortar with micro-silica shows again the bestperformance. The explanation for this behavior is the same as previouslydiscussed for the conductivity test results. A finer porosity, greater tortu-osity and more precipitated C–S–H gel reduce the ingress speed of chlo-rides into the mortars. In spite of the high chloride concentration of thesilica sludge of batch 2 (1.9%), the DRCM coefficient of the mortar wasslightly improved. This means that at replacement level as used in thepresent study (7% bwoc) no adverse effects on the durability of the hard-ened cement paste would be expected. Extra durability assessmentshould be performed for further replacement levels. On the contrary,if batch 1 is used to replace cement an extended durability would beexpected.
4. Conclusions
In the presentwork, the physical and chemical characteristics of sev-eral photovoltaic's silica-rich sludges samples were determined andstudied. The effect on the compressive strength of mortars due to theaddition of stable slurries formulated of silica sludge was discussed. Inaddition, several assessment testswere conducted to investigate the po-tential use of photovoltaic's silica-rich waste sludge as supplementarycementitious material for concrete. A series of tests were carried outon mortars with 7% bwoc replacement level to compare the perfor-mance of the silica-rich sludge with those of micro-silica. Based ontest results several conclusions can be drawn:
1. The silica sludge samples studied are composed of highly agglomer-ated nanoparticles and micro-sized waste particles. Their chemicalanalyses reveal a high content of amorphous SiO2 and CaCO3 withsome impurities related to the additives used to prepare the originalpolishing slurries.
2. The dispersability study using a high-energy shear mixer demon-strated that it is possible to disperse the agglomerated particles ofthe original filter cake to nano-size. The resulting slurries are stableslurries and easy to prepare for the application in concrete.
3. The mechanical properties (flexural and compressive strength) ofmortars with 7% bwoc of silica sludge are similar, and in some casesslightly higher, to the referencemortar. Therefore, the silica sludge of

178 G. Quercia et al. / Cement and Concrete Research 54 (2013) 161–179
batches 2 and 3 can be classified as a pozzolanic material having anactivity index higher than 100.
4. The detail characterization of the hydrated systemwith photovoltaic'ssilica-rich waste demonstrated that the replacement of cement withthis material influenced the amount and kind of formed hydrationphases and thus the volume, the porosity and finally the durabilityof the tested mortars. At the level of substitution used in the presentstudy, major changes are in the amount of chemically bound water(C–S–H gel formed), the consumption of portlandite, conductivityand chloride migration. At early age, filler and nucleating effects pro-duced an increased reaction of the clinker phases; except for the silicasludge of batch 1 that had a retarding effect due to its content ofwater-soluble P2O5. In addition, it was found that the hydration ofthe aluminate phases is affected depending on the CaCO3 and SiO2
content of the studied sludge samples.
Even though positive results were obtained, further research isneeded to study if this type of waste material can be supplied with astable chemical composition. In addition, it is important to study thelong-term effects on the concrete durability due to the high substitutionlevels which are due to the chloride content that was found in thesludge. The results demonstrate that the photovoltaic's silica-rich wastesilica should be used as a potential SCM to partly replace cement inconcrete, thereby decreasing the CO2 footprint of concrete and the envi-ronmental impact associated with landfill of wastes.
Acknowledgments
This researchwas carried out under the Project NumberM81.1.09338in the framework of the Research Program of the Materials innovationinstitute (www.m2i.nl) and The European Community's Seventh Frame-work Program, ProMine: Nano-particle products from new mineral re-sources in Europe, FP7-NMP-2008-LARGE-2 under Grant agreement228559. The authors also wish to express their gratitude to P. Spiesz forhis collaboration and following sponsors of the Building MaterialsResearch Group at TU Eindhoven: Rijkswaterstaat Centre for Infrastruc-ture, Graniet-Import Benelux, Kijlstra Betonmortel, StruykVerwo, Attero,ENCI, Provincie Overijssel, Rijkswaterstaat Directie Zeeland, A&GMaasvlakte, BTE, Alvon Bouwsystemen, V.d. Bosch Beton, Selor, Twee“R” Recycling, GMB, Schenk Concrete Consultancy, Intron, GeochemRe-search, Icopal, BN International, APPAll Remove, Consensor, Eltomation,Knauf Gips, Hess ACC Systems, Kronos and Joma International (chrono-logical order of joining).
References
[1] www.pvmarketresearch.com (consulted Dec. 2012).[2] L.J. Fernandez, R. Ferrer, D.F. Aponte, P. Fernandez, Recycling silicon solar cell waste
in cement-based systems, Sol. Energy Mater. Sol. Cells 95 (2011) 1701–1706.[3] T.Y. Wang, Y.C. Lin, C.Y. Tai, R. Sivakumar, D.K. Rai, C.W. Lan, A novel approach for
recycling of kerf loss silicon from cutting slurry waste for solar cell applications,J. Cryst. Growth 310 (2008) 3403–3406.
[4] M.S. King, H.C. Jung, H.S. Hong, G.S. Kim, H.S. Chung, A study of hot consolidationproperties for recycled silicon powder, Curr. Appl. Phys. 11 (1) (2011) S54–S58.
[5] L. Fernandez-Carrasco, R. Ferrer, D.F. Aponte, S. Martinez-Ramirez, Stabilization ofphotovoltaic panels cell wastes in building material matrices, 1st Spanish NationalConference on Advances in Materials Recycling and Eco-Energy, Madrid, 12–13 November, 2009, pp. 189–192.
[6] B. Lothenbach, K. Scrivener, R.D. Hooton, Supplementary cementitious materials,Cem. Concr. Res. 41 (2011) 1244–1256.
[7] A. Dunster, Silica fume in concrete, Information Paper No. IP 5/09, IHS BRE Press,Garston, U.K, 2009.
[8] G. Quercia, H.J.H. Brouwers, Application of nano-silica (nS) in concrete mixtures, in:Gregor Fisher, Mette Geiker, Ole Hededal, Lisbeth Ottosen, Henrik Stang (Eds.), 8thFIB International Ph.D. Symposium in Civil Engineering, Lyngby, Denmark: DTU Byg,2010, pp. 431–436.
[9] G.J.M. Phylipsen, E.A. Alsema, Environmental life-cycle assessment of multicrystallinesilicon solar cell modules, NOVEM Report 95057, Department of Science, Technologyand Society, Utrecht University, September 2005, pp. 1–65.
[10] Y. Yamamoto, T. Yamada, T. Satou,M. Ishizuka, T. Kinoshita, N. Yasunaga, Developmentof polishing technique for silicon wafer, Advanced Materials and Optoelectronics, 3rdTechnical report, Sumitomo Osaka Cement Co. Ltd., 2002, pp. 4–9.
[11] J. Min Kim, Y. Kwan Kim, Two possible ways of lowering the production costof crystalline silicon wafers for solar cells, J. Ceram. Process. Res. 5 (3) (2004)227–231.
[12] Y. Morioka, M. Kinoshita, Sh. Haba, An approach to slurry characterization for CMP,Nitta Haas Research Paper, PacRim-CMP, 2004, pp. 153–155.
[13] T.C. Lee, F.J. Liu, Recovery of hazardous semiconductor-industry sludge as a usefulresource, J. Hazard. Mater. 168 (2009) 359–365.
[14] T.C. Lee, Recycling of municipal incinerator fly–ash slag and semiconductor wastesludge as admixtures in cement mortar, Constr. Build. Mater. 23 (2009) 3305–3331.
[15] T.C. Lee, K.L. Lin, X.W. Su, K.K. Lin, Recycling CMP sludge as resources in concrete,Constr. Build. Mater. 30 (2012) 243–251.
[16] C.J. Chang, L. Tseng, T.S. Lin, W.J. Wang, T.C. Lee, Recycling of modified MSWI ash–mix slag and CMP sludge as a cement substitute and its optimal composition, IndianJ. Eng. Mater. Sci. 19 (February 2012) 31–40.
[17] British Cement Association, Emissions factor for cement provided by the BritishCement Association. Available at www.bca.org.uk. June 2006.
[18] CEN EN 196-1, Methods of Testing Cement Part 1: Determination of Strength,European Commission for Standardization, 2005. 1–36.
[19] Activation Laboratories Ltd., Certificate of Analysis, Number A12-03763, A12-06724,June–April 2011. 1–6 (Canada).
[20] S. Brunauer, P.H. Emmett, E. Teller, Adsorption of gases in multimolecular layers,J. Am. Chem. Soc. 60 (1938) 309–319.
[21] DIN ISO 9277, Determination of the Specific Surface Area of Solids by Gas AdsorptionUsing the BET Method, German Institute of Normalization, 1995. 1–19.
[22] G. Thiele, M. Poston, R. Brown, A Case Study in Sizing Nanoparticles, MicromeriticsAnalytical Services, 2010. 1 (available at www.micromiretics.com).
[23] ISO 13320-1, Particle Size Analysis — Laser Diffraction Methods — Part 1: GeneralPrinciples, International Organization for Standardization, CH-1211 Genève 20,Switzerland, 1999. 1–42.
[24] ISO 13321, Particle Size Analysis — Photon Correlation Spectroscopy, InternationalOrganization for Standardization, CH-1211 Genève 20, Switzerland, 2006. 1–108.
[25] Ltd Malvern Instruments, “Zeta Sizer Nano-User Manual — Zeta potential theory”,MAN0317 Issue 5.0, August 2009. 265–275 (U.K.).
[26] L. Wadsö, Applications of an eight-channel isothermal conduction calorimeter forcement hydration studies, Cem. Int. (5) (2005) 94–101.
[27] J. Bensted, Some applications of conduction calorimetry, Adv. Cem. Res. 1 (1987) 35–44.[28] J. Bensted, Chemical aspects of normal setting of Portland cement, in: J.F. Young
(Ed.), Characterization and Performance Prediction of Cement and Concrete, UnitedEngineering Trustees Inc., Washington, D.C., USA, 1983, pp. 69–86.
[29] H. Justnes, T. Ostnor, Pozzolanic, amorphous silica produced from themineral Olivine,in: V.M.Malhotra (Ed.), Proceedings of the 7th CANMET/ACI International Conferenceon Fly Ash, Silica Fume, Slag, and Natural Pozzolans in Concrete vol. II, vol. 199,American Concrete Institute -ACI Special Publication, Chennai, India, July 22–272001, pp. 769–781.
[30] N. De Belie, J. Kratky, S. van Vlierberghe, Influence of pozzolans and slag on themicrostructure of partially carbonated cement paste by means of water vapour andnitrogen sorption experiments and BET calculations, Cem. Concr. Res. 40 (2010)1723–1733.
[31] ASTM C1202, Standard Test Method for Electrical Indication of Concrete's Ability toResist Chloride Ion Penetration, Annual Book of ASTM Standards, vol. 04.02,American Society for Testing and Materials, Philadelphia, July 2005, pp. 1–6.
[32] Md Safiuddin, N. Hearn, Comparison of ASTM saturation techniques for measuringthe permeable porosity of concrete, Cem. Concr. Res. 35 (2005) 1008–1013.
[33] NordtestmethodNT Build 492, Concrete, Mortar andCement-Based RepairMaterials:Chloride Migration Coefficient from Non-Steady-State Migration Experiments, 1999.1–8 (Finland).
[34] P. Spiesz, M.M. Ballari, H.J.H. Brouwers, RCM: a new model accounting for thenonlinear chloride binding isotherm and the non-equilibrium conditions betweenthe free- and bound-chloride concentrations, Constr. Build. Mater. 27 (2012)293–304.
[35] R.B. Polder, Test methods for onsite measurement of resistivity of concrete a RILEMTC-154 technical recommendation, Constr. Build. Mater. 15 (2001) 125–1301.
[36] H.L. Sheng, R.Y. Chung, Chemical and physical treatments of chemical mechanicalpolishing wastewater from semiconductor fabrication, J. Hazard. Mater. B108 (2004)103–109.
[37] W. Dena, Ch. Huang, Electrocoagulation for removal of silica nano-particles fromchemical–mechanical-planarization wastewater, Colloids Surf., A Physicochem. Eng.Asp. 254 (2005) 81–89.
[38] P.A. Budiman, Treatment of Chemical Mechanical Polishing Waste Water of Semi-conductor Manufacturer. (Thesis for Master degree) National Taiwan Universityof Science and Technology, Taiwan, April 2006. 1–96.
[39] NEN EN 13263-1 A1, Silica Fume for Concrete — Part 1: Definitions, Requirementsand Conformity Criteria, Netherlands Standardization Institute, 2005. 1–29.
[40] CUR, Vliegas als vulstof in beton, Civieltechnisch Centrum Uitvoering Research enRegelgeving, Gouda, 1992.
[41] DIN EN 196-2, Methods of Testing Cement Part 2: Chemical Analysis of Cement;German Version EN 1962:2005, German Institute of Normalization, 2005. 1–52.
[42] International Union of Pure and Applied Chemistry (IUPAC), Reporting data forgas/solid systems with special reference to the determination of surface area andporosity, Pure Appl. Chem. 57 (4) (1985) 603–619.
[43] ECETOC JACC REPORT No. 51, Synthetic Amorphous Silica (CAS No. 7631-86-9),European Centre for Ecotoxicology and Toxicology of Chemicals, Brussels, September2006. 1–231.
[44] A.W. Pacek, P. Ding, A.T. Utomo, Effect of energy density, pH and temperature onde-aggregation in nano-particles/water suspensions in high shear mixer, PowderTechnol. 173 (2007) 203–210.

179G. Quercia et al. / Cement and Concrete Research 54 (2013) 161–179
[45] N.G. Özcan-Taskin, G. Padron, Effect of particle type on the mechanisms of breakupof nanoscale particle clusters, 13th European Conference on Mixing, London, April14–17 2009, pp. 1–8.
[46] P. Ding, M.G. Orwa, A.W. Pacek, De-agglomeration of hydrophobic and hydrophilicsilica nano-powders in high shear mixer, Powder Technol. 195 (2009) 121–226.
[47] G. Padron, W.P. Eagles, N.G. Özcan-Taskin, G. McLeod, Effect of particle propertieson break up of nanoparticle clusters using an in-line rotor–stator, J. Dispers. Sci.Technol. 29 (2008) 580–586.
[48] M. Goa, E. Frossberg, Prediction of product size distribution for a stirred ball mill,Powder Technol. 84 (1995) 101–106.
[49] K. Kendall, C. Staiton, Adhesion and aggregation of fine particles, Powder Technol.121 (2001) 223–229.
[50] S.Mende, F. Stenger,W. Peukert, J. Schweder,Mechanical production and stabilizationof submicron particles in stirred media, Powder Technol. 132 (2003) 64–73.
[51] R. Wengeler, H. Nirschl, Turbulent hydrodynamic stress induced dispersionand fragmentation of nanoscale agglomerates, J. Colloid Interface Sci. 306 (2007)162–273.
[52] K. Ralph, Iler, The Chemistry of Silica: Solubility, Polymerization, Colloid and SurfaceProperties, and Biochemistry, Wiley, New York, 1979.
[53] B. Lothenbach, G. Le Saout, M.B. Haha, R. Figi, E. Wieland, Hydration of a low-alkaliCEMIII/B-SiO2 cement (LAC), Cem. Concr. Res. 42 (2012) 410–423.
[54] P. Hou, Sh. Kawashima, D. King, D.J. Corr, J. Qian, P. Shah, Modification effects ofcolloidal nano-SiO2 on cement hydration and its gel property, Compos. Part B 45 (1)(2013) 440–448.
[55] M.H. Zhang, J. Islam, S. Peethamparan, Use of nano-silica to increase early strengthand reduce setting time of concreteswith high volumes of slag, Cem. Concr. Compos.34 (2012) 650–662.
[56] L. Nicoleau, The acceleration of cement hydration by seeding: influence of cementmineralogy, in: H.-B. Fischer, K.-A. Bode, C. Beuthan (Eds.), Proceedings of the 18thInternational Conference on BuildingMaterials (IBAUSIL 2012), 12. Bis 15. September,Weimar, Germany, Bauhaus-University, Weimar, Germany, 2012, pp. 1–13.
[57] H.F.W. Taylor, Cement Chemistry, 2nd editions Thomas Telford Edition, 1997.1–459.
[58] P.C. Hewlett, Lea's Chemistry of Cement and Concrete, 3th edition JohnWiley & SonInc., New York, 1988. 1–1053.
[59] K. van Breugel, Simulation of Hydration and Formation of Structure in HardeningCement-Based Materials. (PhD. Thesis) Delft University of Technology, Delft, TheNetherlands, 1991. 1–305.
[60] E.B. Nelson, D. Guillot, Cement additives and mechanism of action, chapter 3, WellCementing, second editions, Schlumberger ltd., Sugar Land, Texas, U.S.A, 2006. 71–80.
[61] A.M. Neville, Properties of Concrete, 4th ed. Prentice Hall/Pearson, Harlow, U.K.,2000. 1–844.
[62] B.V. Enci, Betonpocket 2010, Heidelberg Cement Group, 's-Hertogenbosch, TheNetherlands, 2009. 1–288 (in Dutch).
[63] V.S. Ramachandran, R.M. Paroli, J.J. Beaudoin, A.H. Delgado, Handbook of ThermalAnalysis of Construction Materials, William Andrew Publishing, Norwich, New York,U.S.A., 2002. 1–680.
[64] B. Lothenbach, E.Wieland, A thermodynamic approach to the hydration of sulphate-resisting Portland cement, Waste Manage. 26 (2006) 706–719.
[65] E.J. Garboczi, Permeability, diffusivity, and microstructural parameters: a criticalreview, Cem. Concr. Res. 20 (1990) 591–601.
[66] V. Yogendran, B.W. Langan, Utilization of silica fume in high strength concrete,Proceedings of Utilization of High Strength Concrete, Stavanger, Tapir Publisher,Trondheim, Norway, 1987.
[67] D. Desmet, J. Hernandez, L. Willain, J. Vantomme, Porosity determination ofselfcompacting concrete using forced saturation, Proceeding of the XIII InternationalConference on Cement Chemistry, Madrid, July 4–8 2011, pp. 1–7.
[68] C. Andrade, R. D' Andrea, J.C. Lopez, A. Cienfuegos-Jovellano, J.M. Alvarez, J.M. Millan,Use of electrical resistivity as complementary tool for controlling the concreteproduction, Proceeding of the XIII International Conference on Cement Chemistry,Madrid, July 4–8 2011, pp. 1–7.
[69] C. Andrade, O. Rio, A. Castillo,M. Castellote, R. D' Andrea, ANDT Performancemethodbased on electrical resistivity for the specification of concrete durability, ECCOMASThematic Conference on Computational Methods in Tunnelling, Vienna, Austria,August 27–29 2007, pp. 1–9.
[70] M. Hunger, Chemical andMineralogical Composition of CEM I 52.5 NManufactured atENCI B.V,Maastricht Facilities, TheNetherlands,May 2013. (Personal communication).
[71] G. Hüsken, A Multifunctional Design Approach for Sustainable Concrete: WithApplication to Concrete Mass Products. (PhD. Thesis) Eindhoven University ofTechnology, No. 148, Eindhoven, The Netherlands, 2010. 109.