cement sector in africa & cdm - world bank group
TRANSCRIPT

Cement Sector in Africa & CDM Investing in Clean Technologies
and Energy Savings
Key SheetMay 2009

ii
Cement Sector in Africa & CDM
The findings and opinions expressed in this paper are the sole responsibility of Econoler International. They do not necessarily reflect the views of the World Bank.

iii
Table of Contents
Introduction .............................................................................................................. 1
Background ......................................................................................................... 1
Targeted Audience and Aims of the Key Sheet ......................................................... 1
Greenhouse Gas Emissions at a Glance ...................................................................2
cdm works ..............................................................................................................3
The cdm, a New Approach for the cement Industry ..............................................3
Overview of the cdm Project Portfolio ..................................................................5
cdm Projects in the cement Sector ......................................................................6
drivers of India’s Success in the cdm .....................................................................6
cdm Projects in Africa’s cement Sector ................................................................7
cdm Business opportunities in AFRIcA ......................................................................9
Waste Heat Recovery Projects ............................................................................. 11
Alternative Fuels and Fuel Switching .................................................................... 12
Blended cement ................................................................................................ 14
Energy Efficiency Projects ................................................................................... 15
conclusion .............................................................................................................. 17


1
Introduction
Background
In 2006, the World Bank launched carbon Finance Assist (cF-Assist), a capacity building and technical assistance program to enable the full participation of develop-ing countries and economies in transition in the carbon market. The World Bank, an active partner of the Nairobi Framework, plays a critical role in the carbon market and has committed itself to ensuring carbon finance business development in Africa. This Framework, initiated in 2006 by the United Nations Organizations has the spe-cific target of helping developing countries, especially those in Sub-Saharan Africa, to improve their level of participation in the cdm. The Framework consists in three main objectives, considered to be key priority targets in order to move the cdm forward, i.e., (i) building capacity in devel-oping cdm project activities, (ii) promoting investment opportunities for projects, and (iii) improving information sharing and the exchange of views on cdm activities.
To deliver on this commitment, the cF-Assist Program undertook a series of studies in the transportation and the ce-ment sectors. more recently, cF-Assist coordinated the production and dissemina-tion of the World Bank’s study on Low-carbon Energy Projects for development in Sub-Saharan Africa, which explores the
potential for projects, based on approved cdm methodologies.
Within its four-year existence, cF-Assist has been instrumental in the overall effort of the World Bank by implementing capacity and institutional building programs in nearly 50 countries, and helping identify more than 200 carbon finance projects. The ultimate goal of this effort is to expand busi-ness opportunities for cost-effective energy savings and clean technology transfer that will be of benefit to economic sectors.
Targeted Audience and Aims of the Key Sheet
many developing countries, particularly those of Sub-Saharan Africa are lagging behind in the development of cmd proj-ects. To overcome the barriers to the cdm, a study entitled “Cement Sector Program – Barriers to CDM Projects Development in the Cement Sector in Africa” was commissioned by cF-Assist in 2008. The study includes (1) an analysis and assessment of existing barriers faced by project developers in the cement industry and (2) recommendations based on lessons learned from projects in India, the second largest registered cdm cement project host country. The study also looks at existing investments in the cement industry and identifies new carbon mitiga-tion opportunities in the most relevant areas: (a) energy efficiency, (b) waste heat recovery, (c) fuel switching with biomass
2
Cement Sector in Africa & CDM
and (d) clinker substitution with alternative raw materials.
The realization of cdm projects is pri-marily dependent on the dynamism of the private sector. However, cdm promotion requires strong support on the part of gov-ernments through an investment-friendly institutional framework and preferential incentives for carbon reduction projects. This key sheet is intended for private and public sector players such as cement plant managers and directors, bankers and financiers, government agency repre-sentatives and consultants. In fact, being aware of the barriers and hurdles for cdm promotion and keeping up-to-date with cdm developments is crucial for decision-makers.
This key sheet has been produced based on the “cement Sector Study” find-ings. Specifically, the key sheet will:
Serve as a background document for O
information and awareness-raising of industry decision-makers on the benefits of carbon financecontribute to strengthening the confi- O
dence of policy-makers on cdm oppor-tunities in energy intensive industriesForm the basis for cdm promotion O
Help establish the link for project inves- O
tors and developers through information on opportunities in the cement sector and other avenues for partnership.
Greenhouse Gas Emissions at a Glance
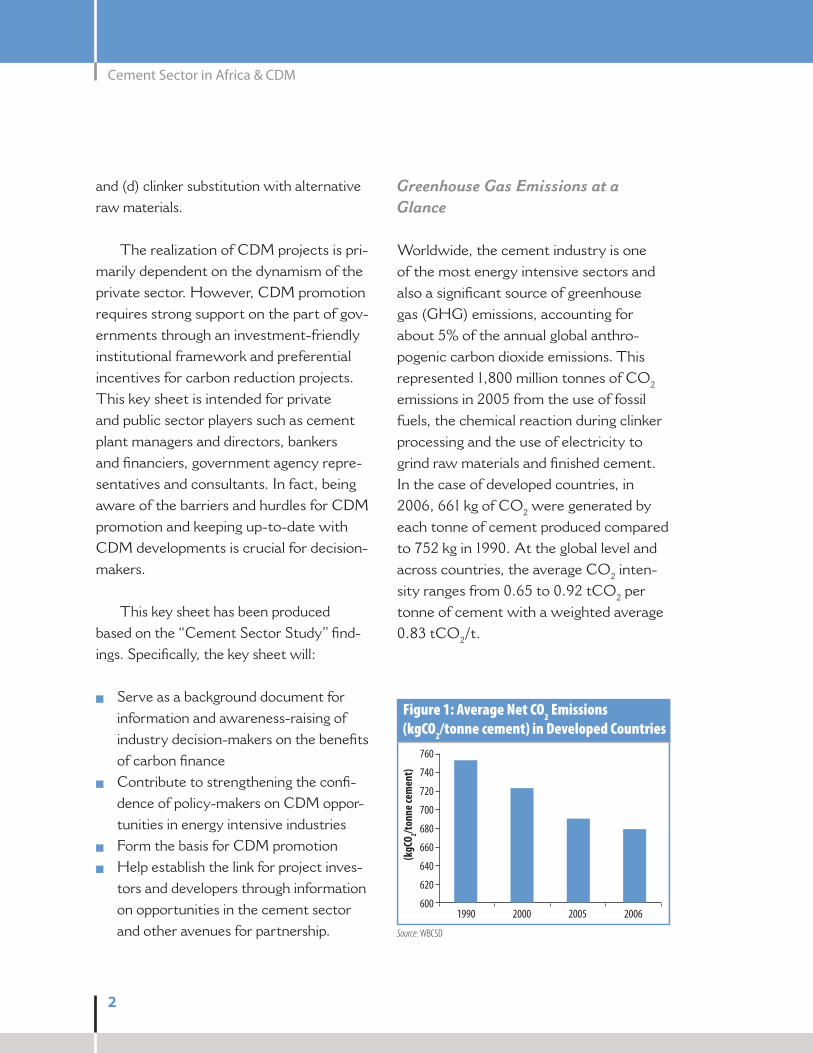
Worldwide, the cement industry is one of the most energy intensive sectors and also a significant source of greenhouse gas (GHG) emissions, accounting for about 5% of the annual global anthro-pogenic carbon dioxide emissions. This represented 1,800 million tonnes of cO2 emissions in 2005 from the use of fossil fuels, the chemical reaction during clinker processing and the use of electricity to grind raw materials and finished cement. In the case of developed countries, in 2006, 661 kg of cO2 were generated by each tonne of cement produced compared to 752 kg in 1990. At the global level and across countries, the average cO2 inten-sity ranges from 0.65 to 0.92 tcO2 per tonne of cement with a weighted average 0.83 tcO2/t.
Figure 1: Average Net CO2 Emissions (kgCO2/tonne cement) in Developed Countries
760
740
720
700
680
660
640
620
600
(kgC
O 2/tonn
e cem
ent)
2006200520001990
Source: WBCSD

3
Cement Sector in Africa & CDM
According to the World Business council for Sustainable development (WBcSd), 80% of future cO2 emissions from the cement sector will be generated by developing and in transition countries; particularly because they need to build much needed infrastructures, such as hous-ing, roads, hospitals and schools. However, cO2 emissions do not increase as rapidly as the level of cement production because of improvements in the emissions intensity of the cement making process.
CDM works
The CDM, a New Approach for the Cement Industry
The clean development mechanism (cdm) was established under the Kyoto Protocol as one of the three flexibility mech-anisms to encourage industrialized countries (Annex I) to develop projects that reduce greenhouse gas (GHG) emissions in non Annex I countries as an alternative to more expensive emission reductions in their own countries. The cdm offers the opportunity to (1) reduce production costs using incen-tives from the carbon market, (2) imple-ment clean energy technology projects, (3) improve cost-effectiveness and (4) reduce the risks associated with such technologies.
The current cdm system requires project-by-project assessment of baseline
settings and proof of “additionality” on the basis of a rather subjective assessment of the project developers’ intention.
demonstrating “additionnality” is key for the cdm process as it provides evidence that the “project outcomes” go beyond what would have occurred under business-as-usual activities. This subjective approach has resulted in some difficulties associated with project approval and high transaction and monitoring costs.
GHG emissions can be dramatically de-creased through low emission cement pro-cessing as well as reducing the energy input or energy source. cdm possibilities pertain more or less to the different phases of the whole manufacturing process as shown in figure 2. Four types of possible projects are described in Table 1. These include: waste heat recovery and use, fuel switching or substitution, increasing the blend of addi-tives and energy efficiency.
The most commonly used approved methodologies are:
Acm 0005: displacement of clinker and i. substitution with fly ash or other additivesAcm 0003: Partial substitution of fossil ii. fuels with alternative energy materials including biomass by-productsAcm 0004: Another group of projects iii. was registered to introduce technologies aimed at capturing the waste heat gas

4
Cement Sector in Africa & CDM
Raw
mill
Th
e ho
mog
-en
ized
ra
w
mat
eria
ls
are
mill
ed
and
drie
d in
a m
ill.
Qua
rryi
ng a
nd R
aw M
ater
ials
Pre
para
tion
Clin
ker P
rodu
ctio
nCe
men
tGri
ndin
g an
d D
istr
ibut
ion
Redu
cing
impa
cts
Qua
rryi
ng a
ctiv
ities
hav
e im
pact
s on
the
loca
l lan
dsca
pe a
nd e
colo
gy a
nd c
an
caus
e no
ise
and
traf
fic p
robl
ems f
or
loca
l com
mun
ities
. Hol
cim
has
es
tabl
ishe
d a
num
ber o
f sys
tem
s to
m
anag
e ou
r qua
rrie
s res
pons
ibly.
The
se
syst
ems h
elp
to m
inim
ize
nois
e,
tran
spor
t an
d vi
sual
impa
ct,t
o re
duce
th
e us
e of
nat
ural
reso
urce
s and
to
optim
ize
quar
ry re
habi
litat
ion.
Qua
rry
Lim
esto
ne
and
othe
r ra
w m
ater
ials
ar
e ex
trac
ted
usin
g dr
illin
g an
d bl
astin
g te
chni
ques
.
Clin
ker c
oole
r Th
e m
olte
n ce
men
t clin
ker i
s ra
pidl
y co
oled
.
AMS
II.D
Co
oler
up-
grad
atio
n ot
her e
ffic
ient
tech
-no
logi
es
ACM
0005
Cem
ent
Blen
ding
ACM
0004
AM00
24AM
S III
.QW
aste
Hea
t Rec
over
y fo
r Pre
heat
ing
&
Pow
er ACM
0003
Fu
el o
il, c
oal,
biom
ass,
tires
, slu
dges
, fat
, ru
bber
, etc
.
Clin
ker s
iloCo
oled
clin
ker i
s st
ored
in
prep
arat
ion
for
grin
ding
on
site
or
tran
spor
t to
othe
r site
s.
Cem
ent m
illCe
men
t clin
ker i
s gr
ound
with
aro
und
5% o
f gyp
sum
and
ot
her a
ltern
ativ
e ce
men
titio
us
mat
eria
ls su
ch a
s sl
ag o
r fly
ash
to
form
the
final
ce
men
t typ
es.
Logi
stic
sCe
men
t is
tran
s-po
rted
in
bags
or a
s a
bulk
po
wde
r.
Kiln
At fl
ame
tem
pera
ture
s up
to
2,00
0°C
and
mat
eria
ls
tem
pera
ture
s up
to 1,
450°
C th
e ra
w m
ater
ials
are
tran
sfor
med
in
to c
linke
r min
eral
s.
Preh
eate
rTh
e ra
w
mat
eria
l is
preh
eate
d be
fore
ent
ry
into
the
kiln
.
Dus
t filt
er
Bagh
ouse
filte
rs o
r el
ectr
osta
tic p
reci
pita
tors
re
mov
e pa
rtic
les f
rom
kiln
an
d m
ill e
xhau
st g
ases
.
Crus
her
The
quar
ried
mat
eria
l is
redu
ced
in s
ize
in
crus
hers
by
com
pres
sion
or
impa
ct.
Opt
ion
for O
ld Q
uarr
y Re
stor
atio
n th
roug
h Ja
trop
ha P
lant
atio
n
Pre-
calc
iner
Pre-
heat
erup
-gra
dati
on
Cool
erEx
haus
t Gas
AMS
II.D
Tran
spor
tTh
e cr
ushe
d ra
w m
ater
ial
is tr
ansp
orte
d to
the
cem
ent
plan
t,m
ainl
y us
ing
conv
ey-
ors
or ra
il w
agon
s.
Mix
ing
bed
The
limes
tone
, cl
ay a
nd
alte
rnat
ive
raw
m
ater
ials
ar
e m
ixed
an
d ho
mog
-en
ized
.
Clin
ker p
rodu
ctio
n re
quire
s int
ensi
ve
use
of ra
w m
ater
ials
and
ene
rgy,
and
al
so re
sults
in e
mis
sion
s to
the
atm
osph
ere,
the
mos
t sig
nific
ant b
eing
CO
2. H
olci
m is
redu
cing
its d
eman
d fo
r na
tura
l res
ourc
es a
nd it
s CO
2 em
issi
ons
per t
onne
of p
rodu
ct b
y re
plac
ing
foss
il fu
els a
nd ra
w m
ater
ials
with
was
te a
nd
indu
stria
l by-
prod
ucts
.
Use
of s
econ
dary
cem
entit
ious
mat
eria
ls
redu
ces t
he a
mou
nt o
f clin
ker r
equi
red
per t
onne
of
cem
ent.
This
redu
ces o
ur C
O2 e
mis
sion
s per
to
nne
of c
emen
t and
our
con
sum
ptio
n of
nat
ural
ra
w m
ater
ials
. Dis
trib
utio
n is
via
the
mos
t co
st-e
ffec
tive
met
hod
to m
arke
t– 7
0% is
by
road
,the
rem
aind
er b
y ra
il an
d sh
ip. T
rans
port
by
road
can
be
a so
urce
of n
uisa
nce
and
traf
fic
safe
ty ri
sk, w
hich
we
aim
to li
mit.
Dus
t, N
Ox,
SO
2 and
VO
C em
issi
ons a
re
subj
ect t
o co
ntin
uous
mon
itorin
g un
der a
new
Hol
cim
stan
dard
. Hea
t re
cove
red
from
the
kiln
and
clin
ker
cool
er is
recy
cled
for p
rehe
atin
g th
e ra
w m
eal,
redu
cing
ther
mal
ene
rgy
cons
umpt
ion.
Cem
ent M
ater
ials
in B
lue
Hea
t Flo
w in
Red
Source:
Adap
ted fro
m Ho
lcim
Publi
catio
n
Figu
re 2:
Cem
ent M
anuf
actu
ring
Proc
ess a
nd CD
M P
roje
ct O
ppor
tuni
ties

5
Cement Sector in Africa & CDM
Table 1: Technology Description and CDM Project Types
Project Type Approved Methodologies Technology Description
Waste Heat Recovery AM0024ACM0012ACM0004AMS III.Q
Capture of waste heat vented at the pre-calciner •and/or cooler end of kilns and use to preheat raw materials and fuelHeat recovery at boilers and generation units and •production of electricity.
Alternative Fuels ACM0003ACM0002AM0049AMS I.DAMS III.B
Use of renewable resources for less resource-inten-•sive processes such as grinding,In pyro-processing, fossil fuels can be partly replaced •by alternative fuels such as gas or unconventional masses (tires, plastics, textiles or rubber, etc.)
Changing Blending/Mix of Cement
ACM0005 Increase in the proportion of additives, such as •limestone, pozzolana and fly ash in the fine grinding process thereby reducing the clinker content.
Energy Efficiency AMS II.D Multi-technology options including: upgradation •of preheaters, upgrading clinker coolers, optimiza-tion of grinding media, automatic controls, variable speed drives, efficient motors, etc.
generated in the clinker-making process (i.e. in cement kilns) to produce electric-ity instead of only venting the waste heat into the atmosphereApproved small-scale methodologies iv. especially: AmS II.d on energy effi-ciency and fuel switching measures for industrial plants, AmS III.B on switching fossil fuels and AmS I.d.
Overview of the CDM Project Portfolio
According to the World Bank’s 2008 State and Trends of the Global carbon market
report, the market more than doubled to reach USd 64 billion in 2007 from USd 31.2 billion in 2006. The market is still driven by the European Union Emission Trading System (EU ETS) market, which alone accounted for USd 50 billion in 2007. The transactions value of project-based markets (cdm, JI, voluntary market, etc.) was USd 13.6 billion in 2007 (USd 6.5 bil-lion in 2006). The cdm accounted for the vast majority of project-based transactions, at 87% of the volume and 91% of the value. Africa ranks fourth with 5% of the transac-tion market. Projects in Africa have been contracted to supply about 50 mtcO2e to

6
Cement Sector in Africa & CDM
the market so far, with more than 20 mt-cO2e transacted in 2007 alone.
In the case of Africa, two interesting les-sons could be drawn from the cdm pipeline. The first concerns the increase observed in the trend of cdm project development. From 2 projects in 2004, the number of projects submitted per annum increased to 25 in 2008. The second interesting fact is that new countries have entered the list of countries that have submitted projects for registration. most of these new countries are francophone: congo democratic Re-public, mali, Senegal, madagascar, but also Zambia and cote d’Ivoire to some extent.
CDM Projects in the Cement Sector
The cement sector is a significant source of greenhouse gases, which makes the sector interesting for cO2 emissions mitigation options. As of January 2009, 203 cdm
projects were initiated by the cement in-dustry. A total of 52 cement-related cdm projects were registered, 12 were rejected, 121 projects are at the validation stage (of which 13 are located in India, 78 in china and 3 in Africa) and 18 projects have been submitted for registration or are being cor-rected. The dominance of china and India in carbon trading under the cdm is begin-ning to influence the business dynamics of these countries in various sectors. Accord-ing to the confederation of Indian Industry (cII) estimates, companies have started adopting cleaner, sustainable technolo-gies and earned about USd 341 million in 2007 just by selling their carbon credits. Out of the 52 projects registered, 25 (48%) are being developed by the Indian cement industry and will account for a total volume of 2.2 million tcO2e per year over the first commitment period (2008–2010).
The remaining 27 cdm projects stem from china (17), Indonesia (3), Israel (1), malaysia (1), Argentina (1), Uruguay (1), colombia (1), Peru (1) and costa Rica (1).
Drivers of India’s Success in the CDM
The success of the Indian cement industry in the cdm is driven by a combination of determining factors:
Government Policy and Regulatory O
Framework Influencing the Cement Sector: By establishing an Energy
(As a share of volume supplied)
China; 72%
India; 6%
Rest of Latin America; 5%
Rest of Asia; 5%Africa; 5%
Brazil; 6%
ECA; 1%
Figure 3: Location of CDM Projects in 2007
Source: World Bank, 2008.

7
Cement Sector in Africa & CDM
conservation Act in 2001, the Govern-ment of India has played a critical role in influencing the cement industry. The new regulatory framework has been a catalyst for the promotion of energy ef-ficiency in the industrial sector, including India’s cement sector. The Bureau of Energy Efficiency (BEE) created under this Act identified cement companies as energy intensive industries, requir-ing them to report periodically on their energy consumption and efficiency levels. The result was an increase in cdm projects through energy efficiency improvements in cement processes.Indian Industry Organizations Provid- O
ing Technical Assistance: The leading role played by the Indian industry orga-nizations that provide assistance to and raise the awareness of industry managers is recognized as critical to the success of the cdm. These organizations have cre-
ated the dynamics for clean technologies in the Indian cement sector and promote energy efficiency with data for bench-marking as a means to reduce production costs and to cope with energy shortages and coal availability constraints. They have increased the awareness of the cdm sector opportunities.Assistance by External Donors and O
Agencies: The sector has benefited from bilateral technical assistance programs. Showcases of cement plant practices, achievements and capabilities in India in the field of efficient cost-effective tech-nologies through bilateral assistance from the GTZ through the Indo-German Ener-gy Efficiency Program and from NEdO/Japan for waste heat recovery demon-stration projects have been recorded.Large Groups Playing a Champion O
Role: The largest Indian cement compa-nies like the Aditya Birla Group, Orient cement, Binani cement, Shree ce-ments, Acc, India cements, Gujarat Ambuja and Lafarge all played a pioneer role in initiating cdm projects using their own funds.Enabling Environment O : Enhancement of the overall cdm project development environment, including an operational designated National Authority (dNA) and the availability of qualified local con-sultants that enable project development, data collection and an interface between international consultants and carbon credit buyers and project participants.
Distribution of Registered CDM Projects in Cement Sector
Figure 4: Breakdown of Registered CDM Projects in the Cement Sector
Source: Data from UNEP CDM Pipeline, Jan. 2009.
India;48%
China;33%
Indonesia;6%
Others;13%
8
Cement Sector in Africa & CDM
The lessons learned from India show that most cdm projects in the cement industry were largely through the initia-tive of industry management where the awareness programs of industry associa-tions and other government agencies in the field played a supportive role in influ-encing the decision-making. cdm proj-ects were taken up to take advantage of additional benefits for energy efficiency projects or to make them more financially attractive.
CDM Projects in Africa’s Cement Sector
No project has been registered by the African cement industry yet. However, this pattern is changing with four cdm projects under registration. The four projects are:
Senegal’s SOcOcIm cdm fuel switch- O
ing project using Jatropha plantations and biomass residues to substitute 40% of the coal burnt in kilns (see Box 1),
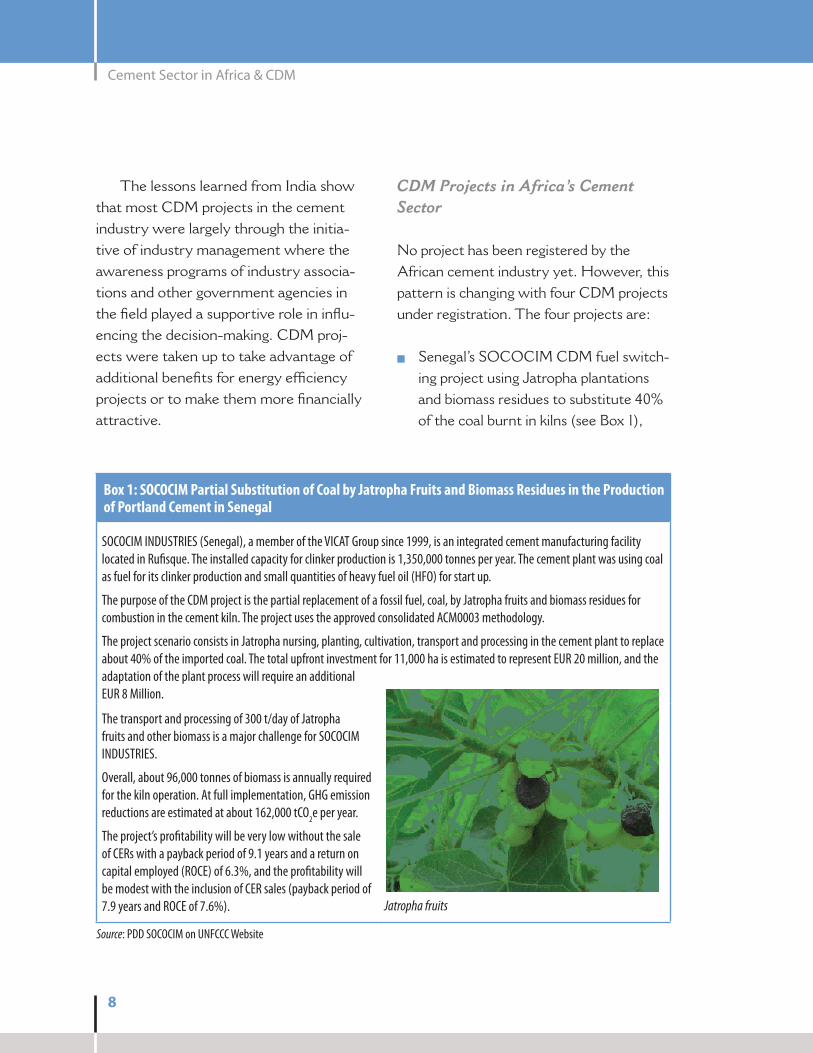
Box 1: SOCOCIM Partial Substitution of Coal by Jatropha Fruits and Biomass Residues in the Production of Portland Cement in Senegal
SOCOCIM INDUSTRIES (Senegal), a member of the VICAT Group since 1999, is an integrated cement manufacturing facility located in Rufisque. The installed capacity for clinker production is 1,350,000 tonnes per year. The cement plant was using coal as fuel for its clinker production and small quantities of heavy fuel oil (HFO) for start up.
The purpose of the CDM project is the partial replacement of a fossil fuel, coal, by Jatropha fruits and biomass residues for combustion in the cement kiln. The project uses the approved consolidated ACM0003 methodology.
The project scenario consists in Jatropha nursing, planting, cultivation, transport and processing in the cement plant to replace about 40% of the imported coal. The total upfront investment for 11,000 ha is estimated to represent EUR 20 million, and the adaptation of the plant process will require an additional EUR 8 Million.
The transport and processing of 300 t/day of Jatropha fruits and other biomass is a major challenge for SOCOCIM INDUSTRIES.
Overall, about 96,000 tonnes of biomass is annually required for the kiln operation. At full implementation, GHG emission reductions are estimated at about 162,000 tCO2e per year.
The project’s profitability will be very low without the sale of CERs with a payback period of 9.1 years and a return on capital employed (ROCE) of 6.3%, and the profitability will be modest with the inclusion of CER sales (payback period of 7.9 years and ROCE of 7.6%). Jatropha fruits
Source: PDD SOCOCIM on UNFCCC Website

9
Cement Sector in Africa & CDM
Nigeria’s WAPcO cdm blended O
cement projects in the Shagamu and Ewekoro Plants (see Box 2),Egypt’s cEmEX Assuit cdm project O
for the partial substitution of fossil fuels by renewable plantation biomass and biomass residues.EAPcc in Kenya has submitted a Pdd O
for increasing the blend in cement pro-duction using substitute raw materials at its Nairobi plant.
Under the cF-Assist sectoral study, a new project is being developed. It reached the Project design document (Pdd) stage in early 2009 (see Box 3).
In parallel, Lafarge East Africa is also undertaking four cdm projects. Three of the projects are for fuel substitution (the Hima Plant in Uganda, the Bamburi and mombasa Plants in Kenya and the mbeya Plant in Tanzania). The average annual
Box 2: Lafarge Cement WAPCO Blended Cement Project at the Shagamu Cement and Ewekoro Cement Plants in Nigeria
The project aims to manufacture and sell a new type of cement (hereafter referred to as “blended cement”) categorized under a new cement standard (Nigerian standard CEM II/A-L 32.5N). The project is being implemented at the two WAPCO Cement production sites located in Shagamu and Ewekoro, both in Ogun State in South West Nigeria. The production capacities of the two cement works are 1.32 million tonnes and 1.0 million tonnes of cement per year for Shagamu and Ewekoro respectively.
The main barrier to a successful introduction of blended cement onto the Nigerian cement market has been identified as an aversion of consumers to a change to any cement other than OPC, which has been the only type on the market. WAPCO has developed and successfully implemented a significant marketing effort to reduce this barrier.
The blended cement project intends to gradually reduce the clinker content of WAPCO’s Shagamu cement production and that of Ewekoro Cement Works by about 86.6% and 84.7% in 2005 to 75% in 2017. The methodology used is ACM0005.
The baseline scenario was the current practice in Nigeria where the amount of non-gypsum additive materials in OPC is limited to 6%, thus resulting in a clinker factor above 89% for the CEM I brand of cement (where the gypsum content is about 5–6%). This clinker factor can be achieved without major investments. WAPCO worked jointly with the Nigerian Cement Manufactur-ing group, the SON, relevant governmental agencies, cement users, etc., to propose a new blended cement standard.
The baseline benchmark considered in the project is a clinker-to-cement ratio of 0.908 for the two plants and the country benchmark is 0.89. Baseline emissions are 0.8483 tCO2e/tonne Blended Cement (BC) and 0.8185 tCO2/tonne BC for the Shagamu and Ewekoro plants respectively.
The clinker-to-cement ratio in the project scenario is 0.75. At terms, projects emissions are estimated at 0.3688 tCO2/tonne BC for Shagamu and 0.4603 tCO2/tonne BC for Ewekoro.
The expected emissions reduction from the project is 1,324,140 tonnes CO2 per year with respectively 865,789 tCO2e and 458,351 tCO2e for Shagamu and Ewekoro.
Source: PDD WAPCO, UNFCCC Website
10
Cement Sector in Africa & CDM
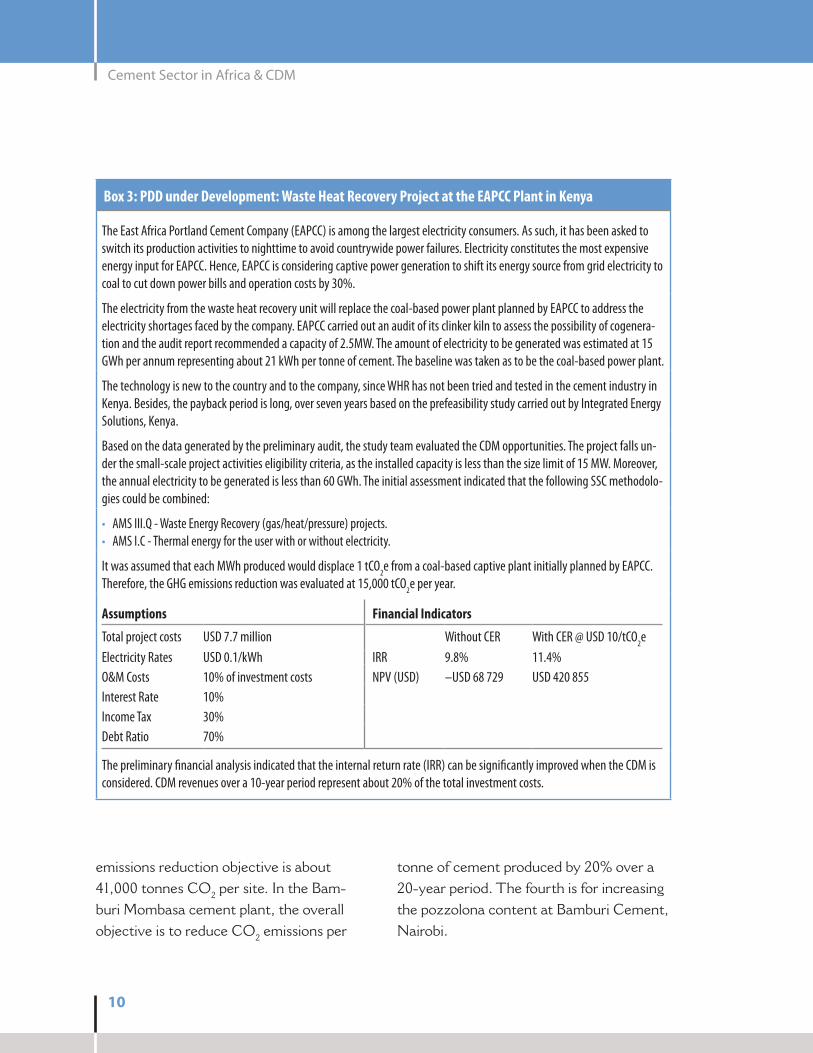
Box 3: PDD under Development: Waste Heat Recovery Project at the EAPCC Plant in Kenya
The East Africa Portland Cement Company (EAPCC) is among the largest electricity consumers. As such, it has been asked to switch its production activities to nighttime to avoid countrywide power failures. Electricity constitutes the most expensive energy input for EAPCC. Hence, EAPCC is considering captive power generation to shift its energy source from grid electricity to coal to cut down power bills and operation costs by 30%.
The electricity from the waste heat recovery unit will replace the coal-based power plant planned by EAPCC to address the electricity shortages faced by the company. EAPCC carried out an audit of its clinker kiln to assess the possibility of cogenera-tion and the audit report recommended a capacity of 2.5MW. The amount of electricity to be generated was estimated at 15 GWh per annum representing about 21 kWh per tonne of cement. The baseline was taken as to be the coal-based power plant.
The technology is new to the country and to the company, since WHR has not been tried and tested in the cement industry in Kenya. Besides, the payback period is long, over seven years based on the prefeasibility study carried out by Integrated Energy Solutions, Kenya.
Based on the data generated by the preliminary audit, the study team evaluated the CDM opportunities. The project falls un-der the small-scale project activities eligibility criteria, as the installed capacity is less than the size limit of 15 MW. Moreover, the annual electricity to be generated is less than 60 GWh. The initial assessment indicated that the following SSC methodolo-gies could be combined:
AMS III.Q - Waste Energy Recovery (gas/heat/pressure) projects.•AMS I.C - Thermal energy for the user with or without electricity.•
It was assumed that each MWh produced would displace 1 tCO2e from a coal-based captive plant initially planned by EAPCC. Therefore, the GHG emissions reduction was evaluated at 15,000 tCO2e per year.
Assumptions Financial Indicators
Total project costs USD 7.7 million Without CER With CER @ USD 10/tCO2eElectricity Rates USD 0.1/kWh IRR 9.8% 11.4%O&M Costs 10% of investment costs NPV (USD) –USD 68 729 USD 420 855Interest Rate 10%Income Tax 30%Debt Ratio 70%
The preliminary financial analysis indicated that the internal return rate (IRR) can be significantly improved when the CDM is considered. CDM revenues over a 10-year period represent about 20% of the total investment costs.
emissions reduction objective is about 41,000 tonnes cO2 per site. In the Bam-buri mombasa cement plant, the overall objective is to reduce cO2 emissions per
tonne of cement produced by 20% over a 20-year period. The fourth is for increasing the pozzolona content at Bamburi cement, Nairobi.
11
Cement Sector in Africa & CDM
CDM Business opportunities in AFRICA
cdm can offer attractive opportunities for supporting the development priorities of host countries as reflected in national development plans, in sectoral environmen-tal plans and in social development strate-gies. In essence, the function of this flexible mechanism is to assist the trade of carbon credits and offsets between Annex I and non-Annex I countries on a competitive basis. The cost-benefit analysis of cdm projects includes other factors, such as environmental protection, the population’s health as well as social, political and eco-nomic impacts in a view to ensure a win-
win situation for all participating countries. Thus, the trading of GHG emission offsets under the cdm represents a cost-effective and flexible market-based mechanism for achieving the overall targets of reductions in GHG emissions.
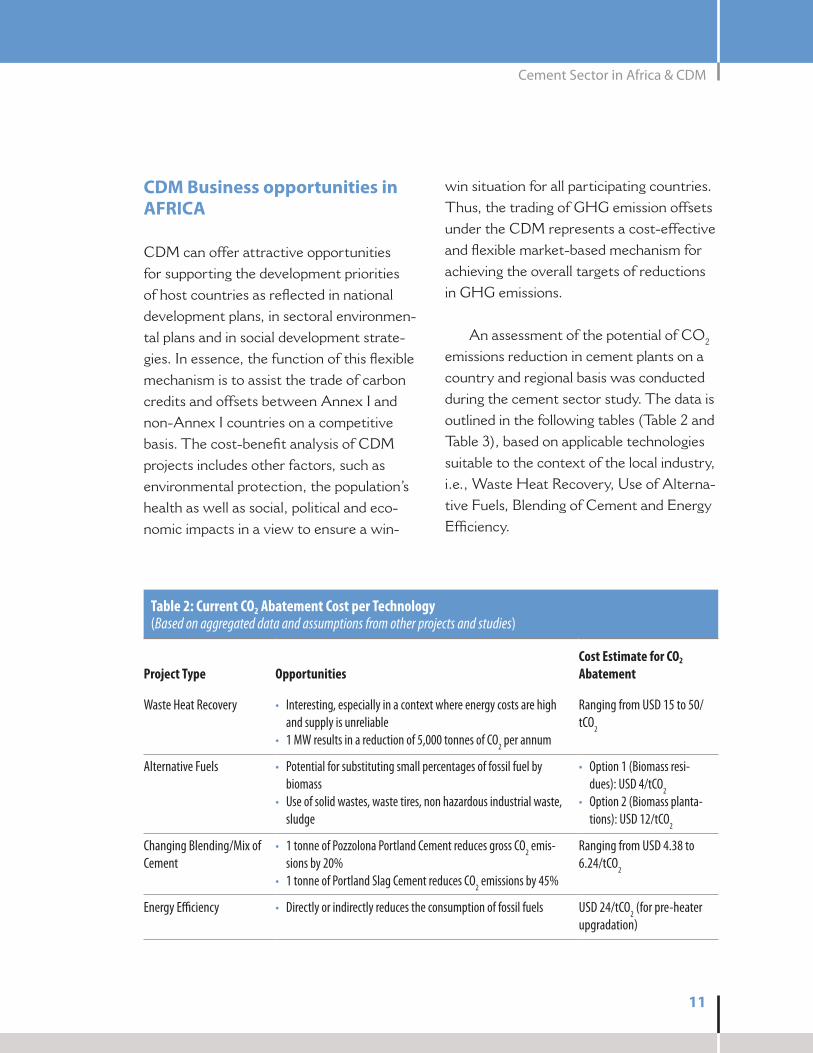
An assessment of the potential of cO2 emissions reduction in cement plants on a country and regional basis was conducted during the cement sector study. The data is outlined in the following tables (Table 2 and Table 3), based on applicable technologies suitable to the context of the local industry, i.e., Waste Heat Recovery, Use of Alterna-tive Fuels, Blending of cement and Energy Efficiency.
Table 2: Current CO2 Abatement Cost per Technology(Based on aggregated data and assumptions from other projects and studies)
Project Type OpportunitiesCost Estimate for CO2 Abatement
Waste Heat Recovery Interesting, especially in a context where energy costs are high •and supply is unreliable1 MW results in a reduction of 5,000 tonnes of CO• 2 per annum
Ranging from USD 15 to 50/tCO2
Alternative Fuels Potential for substituting small percentages of fossil fuel by •biomassUse of solid wastes, waste tires, non hazardous industrial waste, •sludge
Option 1 (Biomass resi-•dues): USD 4/tCO2
Option 2 (Biomass planta-•tions): USD 12/tCO2
Changing Blending/Mix of Cement
1 tonne of Pozzolona Portland Cement reduces gross CO• 2 emis-sions by 20%1 tonne of Portland Slag Cement reduces CO• 2 emissions by 45%
Ranging from USD 4.38 to 6.24/tCO2
Energy Efficiency Directly or indirectly reduces the consumption of fossil fuels• USD 24/tCO2 (for pre-heater upgradation)
12
Cement Sector in Africa & CDM
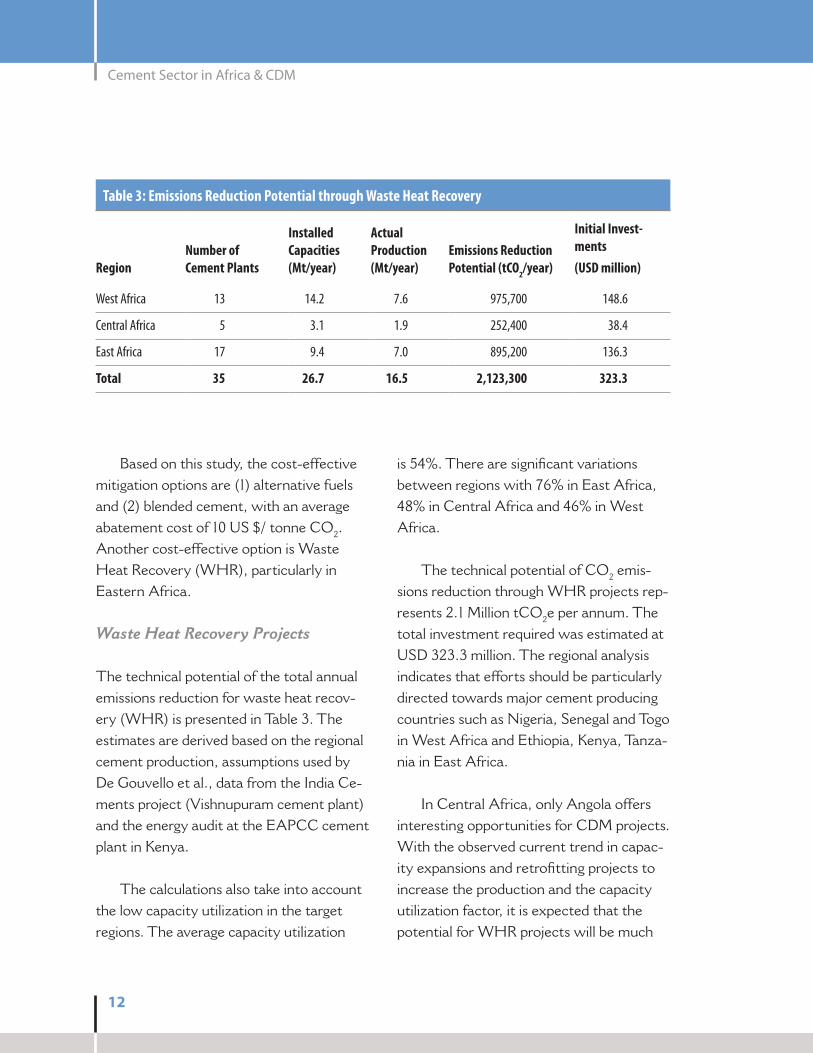
Table 3: Emissions Reduction Potential through Waste Heat Recovery
RegionNumber of Cement Plants
Installed Capacities (Mt/year)
Actual Production (Mt/year)
Emissions Reduction Potential (tCO2/year)
Initial Invest-ments(USD million)
West Africa 13 14.2 7.6 975,700 148.6
Central Africa 5 3.1 1.9 252,400 38.4
East Africa 17 9.4 7.0 895,200 136.3
Total 35 26.7 16.5 2,123,300 323.3
Based on this study, the cost-effective mitigation options are (1) alternative fuels and (2) blended cement, with an average abatement cost of 10 US $/ tonne cO2. Another cost-effective option is Waste Heat Recovery (WHR), particularly in Eastern Africa.
Waste Heat Recovery Projects
The technical potential of the total annual emissions reduction for waste heat recov-ery (WHR) is presented in Table 3. The estimates are derived based on the regional cement production, assumptions used by de Gouvello et al., data from the India ce-ments project (Vishnupuram cement plant) and the energy audit at the EAPcc cement plant in Kenya.
The calculations also take into account the low capacity utilization in the target regions. The average capacity utilization
is 54%. There are significant variations between regions with 76% in East Africa, 48% in central Africa and 46% in West Africa.
The technical potential of cO2 emis-sions reduction through WHR projects rep-resents 2.1 million tcO2e per annum. The total investment required was estimated at USd 323.3 million. The regional analysis indicates that efforts should be particularly directed towards major cement producing countries such as Nigeria, Senegal and Togo in West Africa and Ethiopia, Kenya, Tanza-nia in East Africa.
In central Africa, only Angola offers interesting opportunities for cdm projects. With the observed current trend in capac-ity expansions and retrofitting projects to increase the production and the capacity utilization factor, it is expected that the potential for WHR projects will be much
13
Cement Sector in Africa & CDM
higher in the future. A significant feature of waste heat recovery projects for power generation is the high initial investment cost that induces a high cO2 abatement cost ranging from USd 15–50/tcO2 de-pending on the size of the project and other factors such as grid fossil-based electricity displacement.
However, as shown in the case of the WHR project at the EAPcc plant in Kenya (see Box 3), the financial indicators of a WHR project can improve significantly when the cdm is considered and cdm benefits can compensate for about 20% of the project costs over the crediting period.
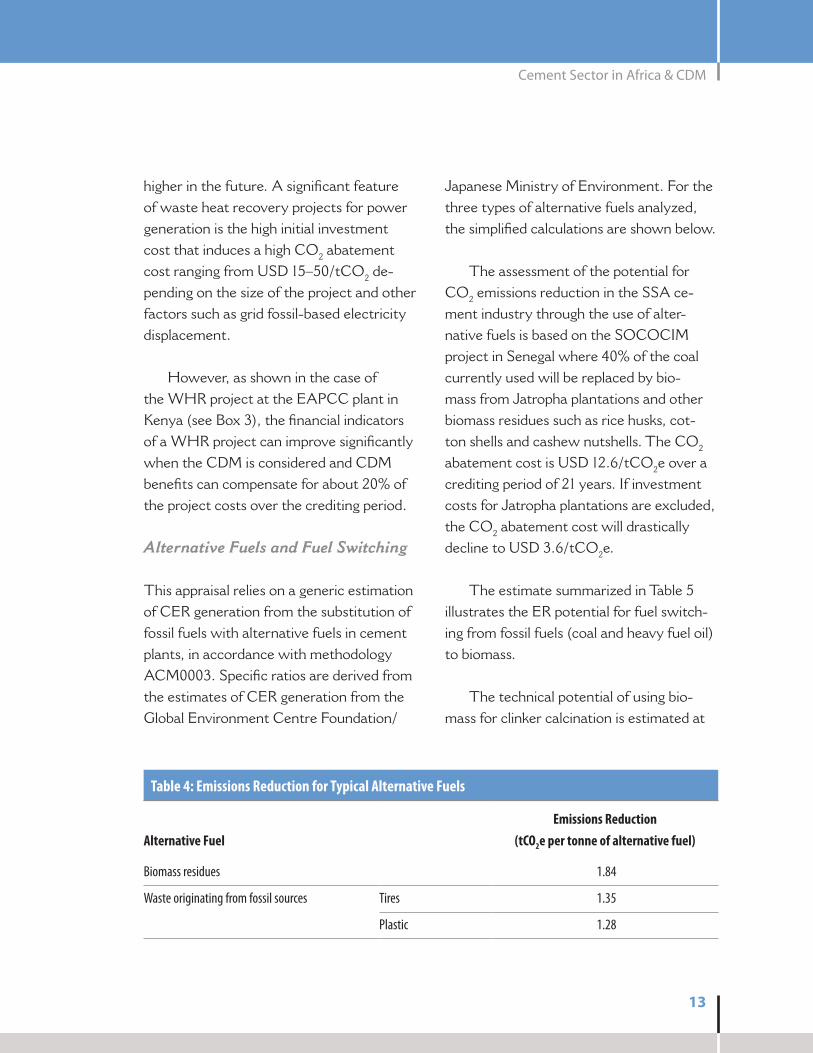
Alternative Fuels and Fuel Switching
This appraisal relies on a generic estimation of cER generation from the substitution of fossil fuels with alternative fuels in cement plants, in accordance with methodology Acm0003. Specific ratios are derived from the estimates of cER generation from the Global Environment centre Foundation/
Japanese ministry of Environment. For the three types of alternative fuels analyzed, the simplified calculations are shown below.
The assessment of the potential for cO2 emissions reduction in the SSA ce-ment industry through the use of alter-native fuels is based on the SOcOcIm project in Senegal where 40% of the coal currently used will be replaced by bio-mass from Jatropha plantations and other biomass residues such as rice husks, cot-ton shells and cashew nutshells. The cO2 abatement cost is USd 12.6/tcO2e over a crediting period of 21 years. If investment costs for Jatropha plantations are excluded, the cO2 abatement cost will drastically decline to USd 3.6/tcO2e.
The estimate summarized in Table 5 illustrates the ER potential for fuel switch-ing from fossil fuels (coal and heavy fuel oil) to biomass.
The technical potential of using bio-mass for clinker calcination is estimated at
Table 4: Emissions Reduction for Typical Alternative Fuels
Alternative FuelEmissions Reduction
(tCO2e per tonne of alternative fuel)
Biomass residues 1.84
Waste originating from fossil sources Tires 1.35
Plastic 1.28

14
Cement Sector in Africa & CDM
2.4 million tcO2e and the required invest-ment amounts to around USd 536.0 mil-lion. However, these initial investments are estimated on a production ratio basis only. This means that savings of scale are not accounted for. For instance, it is realistic to assume that the marginal cost of additional units of alternative fuel will decrease to a certain extent. It is also realistic to assume that transaction costs might be reduced after a demand-driven alternative fuel dis-tribution capacity or network has been put in place.
It should be noted that sources of alter-native fuels can also be tires, plastic, waste oil, etc. Each project will need to assess the potential of alternative fuels present in the surroundings of the cement plant, the availability of the resources and the alterna-tive uses in the country. As many of SSA countries have vast lands, dedicated energy plantations (Jatropha, casurina trees or other species) could be an interesting solu-
tion for biomass supply issues as is the case in Senegal and Egypt.
Blended Cement
Blended cement, as defined in the Stan-dard Specification for Blended Hydraulic cements (ASTm c 595), is a mixture of portland cement and blast furnace slag or a “mixture of portland cement and a poz-zolan (most commonly fly ash).” The use of blended cements in concrete reduces mixing water and bleeding, improves finish-ability and workability, enhances sulfate resistance, inhibits the alkali-aggregate reaction and lessens heat evolution during hydration, thus moderating the chances for thermal cracking on cooling.
developing blended cement projects as cdm projects will require setting up a baseline and demonstrating that the pro-posed project scenario is additional. Ac-cording to the Global Environment centre’s
Table 5: Emissions Reduction Potential for Fuel Substitution Projects in SSA Cement Kilns
RegionActual Production
(Mt/year)Quantity of Biomass Needed (tonne/year)
Emissions Reduction Potential (tCO2/year)
Initial Investment(USD million)
West Africa 7.6 646,900 1,099,700 246.3
Central Africa 1.9 167,300 284,500 63.7
East Africa 7.0 593,500 1,009,000 226.0
Total 16.5 1,407,700 2,393,200 536.0

15
Cement Sector in Africa & CDM
cER Estimation Toolkit, cO2 emissions reduction associated with an increased share of additives in blended cement could be roughly estimated at 0.009 tcO2e per tonne of blended cement produced for each 1% of increased share of additives.
The estimate of the potential for blend-ed cement projects in the SSA cement sector is based on assumptions posited in the study by de Gouvello et al. assuming the clinker content will be reduced from 95 percent to 75 percent (increasing the share of additives by 20%) in Ordinary Portland cement (OPc) production plants spread over the continent.
The results of the analysis showed that 50 blended cement cdm projects could be developed in 24 countries using the Acm0005 methodology. When packaged, these projects would yield a total emissions reduction of 2.4 million tcO2e per annum representing 0.105 tcO2e per tonne of
cement produced. An estimated USd 105 million would be needed to implement these projects leading to a cost of USd 4.38 per tonne of cO2 reduced over a 10-year period.
Energy Efficiency Projects
The estimated energy savings potential seems to be significant in the SSA cement industry, especially in the socio-economical context of the continent where most of the population does not have access to elec-tricity. As can be noted, the cdm would not constitute the main incentive for the efficient use of electrical energy in many countries. However, electricity savings could be spurred by a reduction in produc-tion costs since energy is one of the most expensive inputs for cement manufactur-ing, and it might be interesting to come up with the following.
The scope of energy efficiency projects in the cement industry is very large. It encom-
Table 6: Emissions Reduction Potential for Blended Cement in SSA Cement Kilns
Region Number of PlantsActual Production
(Mt/year)Emission Reductions
(tCO2e/year)Investment Cost
(USD million)
West Africa 21 12.1 1,281,900 56.1
Central Africa 8 3.0 318,400 13.9
East Africa 21 7.6 807,300 35.4
Total 50 22.7 2,407,600 105.4

16
Cement Sector in Africa & CDM
passes system upgradation, specific technolo-gies such as variable speed drives, motors, compressed air, ventilators as well as process controls and energy management systems. Up till now, only a few cement plants have carried out detailed energy audits.
The potential of energy savings dis-tinguishes thermal savings and electricity savings using the average specific energy consumption and a target. Thus, the target for specific thermal energy is 750 kcal/kg of clinker from a baseline of 950 750 kcal/kg of clinker in integrated cement plants only and electricity is cut down from 120 to 90 kWh/tonne of cement for all units.
The total monetary savings from energy efficiency measures and emission reductions sales in the SSA cement indus-
try could amount to USd 409.6 million in fuel savings, USd 66 million in electricity savings and USd 139.2 million in terms of emissions reduction.
The potential for kiln fuel savings is in the order of 12.5 million gigajoules (GJ) per year from 35 clinker production units across 17 countries in SSA. This represents annual savings of 553,000 tonnes of coal or 345,000 tonnes of heavy fuel oil. The equivalent cO2 emissions reduction could amount to 1 million tcO2 distributed mainly in West Africa (46%) and East Africa (42%) with the majority of the potential in Nigeria, Senegal, Ethiopia, Kenya and Tanzania.
The total electricity savings potential is about 660 GWh/year and GHG emissions reduction is estimated at 319,000 tonnes for
Table 7: Assumptions for Energy Savings and Emissions Reduction Estimate
Parameters Value
Baseline specific thermal energy use 950 kcal/kg of clinker
Project scenario specific thermal energy use 750 kcal/kg of clinker
Emissions factor of coal and heavy fuel oil (HFO) burnt in kilns Coal: 0.0946 tCO• 2/GJHFO: 0.0774 tCO• 2/GJAverage considered: 0.086 tCO• 2/GJ
Baseline specific electricity use 120 kWh/tonne of cement
Project scenario specific electricity use 90 kWh/tonne of cement
Number of plants considered for thermal energy savings 35 plants in 17 countries (excluding South Africa)
Number of plants considered for electricity savings 49 facilities in 20 countries (excluding South Africa)

17
Cement Sector in Africa & CDM
49 cement facilities. Electricity savings and the related GHG emissions reduction in se-lected SSA cement plants cover integrated plants and grinding units. It clearly appears that, when taken in the perspective of the cdm, the emissions reduction potential is very low or insignificant in some countries like dR congo, Ethiopia, Uganda, etc. where the saved electricity would mainly be hydro-based.
The estimated energy savings potential seems to be significant in the SSA cement industry, especially in the socio-economical context of the continent where most of the population does not have access to electric-ity. As noted, the cdm would not con-stitute the main incentive for the efficient use of electrical energy in many countries. However, electricity savings could be spurred by a reduction in production costs
Table 8: Emissions Reduction Potential in SSA Cement Plants from Fuel & Electricity Savings
(Monetary savings are based on: Electricity: US$ 0.1/kWh, Fuel: US$ 0.95/liter; Emissions Reduction: US$ 10/tCO2e)
Source of Energy West Africa Central Africa East Africa Total
Fuel
Number of Facilities 13 5 17 35
Estimate of Clinker Production (Mt/year) 6.9 1.8 6.3 15.0
Thermal Savings Potential (GJ/year) 5,735,500 1,483,900 5,262,200 12,481,600
Annual Energy Cost Savings (USD million) 188.2 48.7 172.7 409.6
Emissions Reduction (tCO2e/year) 493,200 127,600 452,500 1,073,300
Carbon Revenues over 10 Years (USD million) 49.3 12.8 45.2 107.3
Major Countries Nigeria, Senegal, Togo
Angola , DR Congo
Kenya, Ethiopia, Tanzania
—
Elec
trici
ty
Number of Facilities 22 7 20 49
Estimate of Cement Production (Mt/year) 11.7 3.0 7.3 22.0
Electricity Savings Potential (GWh/year) 350.6 90.3 219.5 660.4
Annual Electricity Cost Savings (USD million) 35 9 22 66
Emissions Reduction Potential (tCO2e/year) 253,900 18,500 46,600 319,000
CDM Revenues over 10 Years (USD million) 25.4 1.85 4.7 31.9
Major Countries Nigeria, Senegal, Togo
Low potential Low potential —

18
Cement Sector in Africa & CDM
since energy is one of the most expensive inputs for cement manufacturing.
Conclusion
As detailed in this sheet, Africa’s cement sector offers substantial opportunities for developing attractive cdm projects. Ac-cording to the review conducted under cF-Assist supervision, there is an untapped potential for cost reductions in SSA ce-ment manufacturing facilities using exist-ing technologies. However, some specific actions must be launched by key stakehold-ers, i.e. cement plant managers, govern-ment policy-makers and the international community. The strongest commitment should originate in the private sector, more particularly from cEOs in the cement industry whose leadership can serve as the catalyst to introduce changes in favour of the promotion of cleaner technologies and support to business expansion recognizing the sustainable development issues faced by the global economy.
Therefore, the following actions are recommended to the target groups:
a) For Top Industry Management
Undertake study tours in Asia (India and 1. china) to learn about their successful approaches and discuss how the cdm contributed to the expansion of cement industries in the area.
Adopt, on a voluntary basis, best O
practices regarding cement manu-facturing, by promoting clean invest-ments:Best practices can help reduce up O
to 15% of the energy costs. Plant managers can set energy and cO2 targets and implement data acquisi-tion to correct production processes and achieve better energy use.
Ensure that the technical managers 2. and staff of cement plants are aware of energy efficiency and best practices.Promote the adoption of Energy man-3. agement Systems (EmS) within the Industry:
most plants seek to be certified un- O
der ISO 9000 and 14000 by installing an environment management sys-tem. An energy management sys-tem could be coupled to the current practices to record the plant’s energy performance and cO2 intensity.Setting up an energy management O
system requires the allocation of resources, including energy managers and an energy management budget.
conduct energy audits and assess cdm 4. opportunities at the plants and develop an action plan to reduce production costs using the carbon finance incentives:
Energy audits could be the first step O
in identifying potential energy sav-ings and cost reductions. The audits should go beyond current investiga-tions in looking at cdm opportuni-

19
Cement Sector in Africa & CDM
ties using existing technologies and methodologies.An action plan for project implemen- O
tation can be derived from the assess-ment, based on a company’s priorities and strategic planning. Low cost measures can be the starting point.The energy audit reports should be O
updated periodically and the plant’s key performance indicators, derived.
Encourage information sharing through-5. out the industry by developing bench-marking.Promote national and regional research 6. on blended cement.
b) For Financing InstitutionsThe community of local and regional 1. financing institutions should be proac-tive in informing members and partici-pating organizations about the benefits of carbon finance:
Increase the awareness of local bank- O
ers and regional financing institutions of the opportunities that carbon finance offers. members should be informed about the lending opportu-nities in the carbon business, particu-larly in the cdm sectoral approach.
Local and regional financing institutions 2. should work closely with international financing institutions (AfdB, WB) and other multilateral organizations to de-sign tailored capacity-building programs on the cdm for African bankers.
The community of local and regional 3. financing institutions should establish an information sharing system for their members.
c) For African Governmental Institutions
National policy-makers should develop a 1. legal and regulatory framework to support cdm development in their countries.Establish financial and economic incen-2. tives for project developers in energy intensive sectors.Provide adequate financial and human 3. resources to the National designated Authorities (dNA) to allow them to support cdm in the cement industry.
ContactsFor more information about the cement Sector Study, please visit www.cfassist.org or contact the cF-Assist Support Team at the following address:
carbon Finance Assist O
The World Bank1818 H StreetNW Washington, dc 20433, USAPhone: +1 (202) 473–8537E-mail: [email protected]: www.cfassist.org
