cene 486c 50% design report - cefns.nau.edu design report march 2nd, 2017 team flaming bunnies ......
TRANSCRIPT

CENE 486C
50% Design Report
March 2nd, 2017
Team Flaming Bunnies (2016-2017)
Prepared by:
Brando Gutierrez
Gabe Green
Skylar Clemons
Prepared for:
Dr. Wilbert Odem, Ph.D., P.E.
Tom Runyon, Hydrologist for the Coconino Forest Service

Table of Contents
1.0 Acknowledgements ..............................................................................................................1
2.0 Project Description ...............................................................................................................1
2.1 Background ................................................................................................................................... 1
2.2 Site Conditions .............................................................................................................................. 1
2.3 Tasks and Sub Tasks ...................................................................................................................... 2
3.0 Technical Section ..................................................................................................................3
3.1 Testing and Analysis ...................................................................................................................... 3
3.2 Work in Progress ........................................................................................................................... 9
3.3 Future Work Needed to be Completed ......................................................................................... 9
4.0 References ..........................................................................................................................10
5.0 Appendices .........................................................................................................................11
Appendix A.................................................................................................................................... 11
Appendix B-................................................................................................................................... 12
Appendix C .................................................................................................................................... 13
Appendix D ................................................................................................................................... 16
Table of Figures
Figure 3.11: Soil profile of the undisturbed sections of Allan Lake. ......................................................... 3
Figure 3.12: Soil profile of the side casted mix near the trenches. ............................................................ 4
Figure 3.13: Soil Profile of the Trenches. ................................................................................................ 5
Figure 3.14: The soil profile of the undisturbed soils at Allan Lake. ........................................................ 6
Figure 3.15: The soil profile of the side casted mixture near the trenches................................................. 6
Figure 3.16: Surveying Allan Lake in the Fall of 2016. ........................................................................... 7
Figure 3.17: The topographic map of Allan Lake. ................................................................................... 8
Figure 3.18: TIN surface of Allan Lake. .................................................................................................. 8
List of Tables
Table 3.19: Organic Results for the top soil in each sample soil profile.................................................... 9

1
1.0 ACKNOWLEDGEMENTS
We would like to acknowledge and thank Tom Runyon who is the coordinator hydrologist for
the Coconino National Forest. Tom is our client but also a strong supporter for the work we are
doing. In addition, we would like to thank Kit MacDonald who is the soil and watershed program
manager for the Coconino and Kaibab National Forest. Kit has helped us with fieldwork and
gathering samples. As well as providing feedback and support towards any of our concerns. Both
professionals continue to support our design project and we are grateful for their contributions.
2.0 PROJECT DESCRIPTION
2.1 BACKGROUND
The Allan Lake Wetland Restoration project aims to restore the wetlands’ historical ability to
retain water and support wetland vegetation. The fine particle clay layer that had acted as an
impermeable water-holding layer was disturbed during a habitat improvement effort, resulting in
a loss of wetland function. The purpose of this project is to improve the distribution and retention
of water in the wetland area. The Forest Service has a rough idea of how they would like to
approach the restoration, they have previously used a bull dozer and half a dozen workers to
carry out a test restoration in a single section. Figures C1 through C3 in the Appendix show the
differences that are observable at the site between the unrestored area and the test restoration
section. The Forest Service then put out a bid to contractors to see how much it would cost to
have the entire lake restored like their test section, however they did not include a soil analysis of
the site, which made the bids range from $40,000 to $250,000. The main objective for the
students is to conduct the soil analysis, and then based on the soil analysis complete a cost
analysis for the restoration to find a more accurate and exact price for our client Tom Runyon.
Allen Lake is located 2.7 miles north of the intersection of Lake Mary Road and Stoneman Lake
Road, along Lake Mary Road where it can be seen in Appendix A (Latitude 34º 49’ 34.09” N,
Longitude: 111 º 26’ 27.45’’ W). Currently, the lake is a series of ditches surrounding a grassy
field, as shown in the Appendix B. In 1986 Arizona Game and Fish tried to improve waterfowl
habitat by creating the series of ditches in the seasonal Allan Lake area. Their thinking was that
this would allow the water to pool, creating a permanent lake, and would protect the waterfowl
from predators. By creating the ditches with bulldozers and explosives, they disturbed the water
retention layer in the soil, causing the lake to dry much quicker and thus reducing waterfowl
habitat.
Our client is the United States Forest Service (USFS). Tom Runyon is our secondary client who
is a coordinator hydrologist for the Coconino National Forest. Our stakeholders are the species
and plants of the wetland, people who own land and utilities adjacent to the impacted areas,
Arizona Game and Fish, and the general public who has unrestricted access to the site.
2.2 SITE CONDITIONS
During the fall when the site was surveyed and the soil, samples were gathered. The site was
relatively dry and easy to traverse. This can be seen in Figure C1 in the Appendix. This contrasts
with the current conditions of the site. Currently the site is heavily flooded with some snow still

2
on the ground, as shown in Figures C4 though C6 in the Appendix. This poses the problem of not
being able to gather more soil samples until the area has dried some. Fortunately, the lake is
currently at full capacity and overflowing through the natural spillway so flooding cannot
worsen. Due to this, the main limitation of this project is what the site and weather conditions are
like. This can limit the project by delaying the soil gathering as well as prevents the students
from conducting additional survey work. The current conditions impose a delay in collecting
more soil samples for the hydraulic conductivity tests and the proctor compaction tests.
2.3 TASKS AND SUB TASKS
Below is an outline of the tasks that need to be finished in order to successfully complete the
project [5].
Task 1.0: Research
Task 2.0: Field Work
2.1: Survey & Create a Topographic Map
2.2: Soil Sampling
2.3: Soil Profile from Auger Boreholes
Task 3.0: Geotechnical Lab Analysis
3.1: ASTM D2974-Moisture Content
3.2: ASTM D2974-Organic Content
3.3 ASTM D4318-Atterberg Limits
3.4 ASTM C325-Wet Sieve Analysis
3.5: ASTM D5084-Hydraulic Conductivity
3.6: ASTM D-698-Proctor Compaction
Task 4.0: Develop Design
4.1: Develop Compaction Specification
4.2: Cut and Fill
4.3: Cost Analysis
Task 5.0: Project Management
5.1: Communication
5.1a: Client Meetings
5.2b: Team Meetings
5.2: Deliverables
5.2a: Final Report
5.3b: Presentation
5.3: Website

3
3.0 TECHNICAL SECTION
3.1 TESTING AND ANALYSIS
Prior to conducting soil analysis, soil sampling and surveying work were both completed as part
of the fieldwork for the project. While collecting samples at the project site, we used a bore
auger instrument to collect a soil profile. One of the bore logs used during the acquisition of
samples can be seen in Appendix E. A total of 28 soil samples were initially collected from 13
sampling sites by the team, and shown below are some of the representative profiles:
Figure 3.11: Soil profile of the undisturbed sections of Allan Lake.

4
Figure 3.12: Soil profile of the side cast mix near the trenches.
5
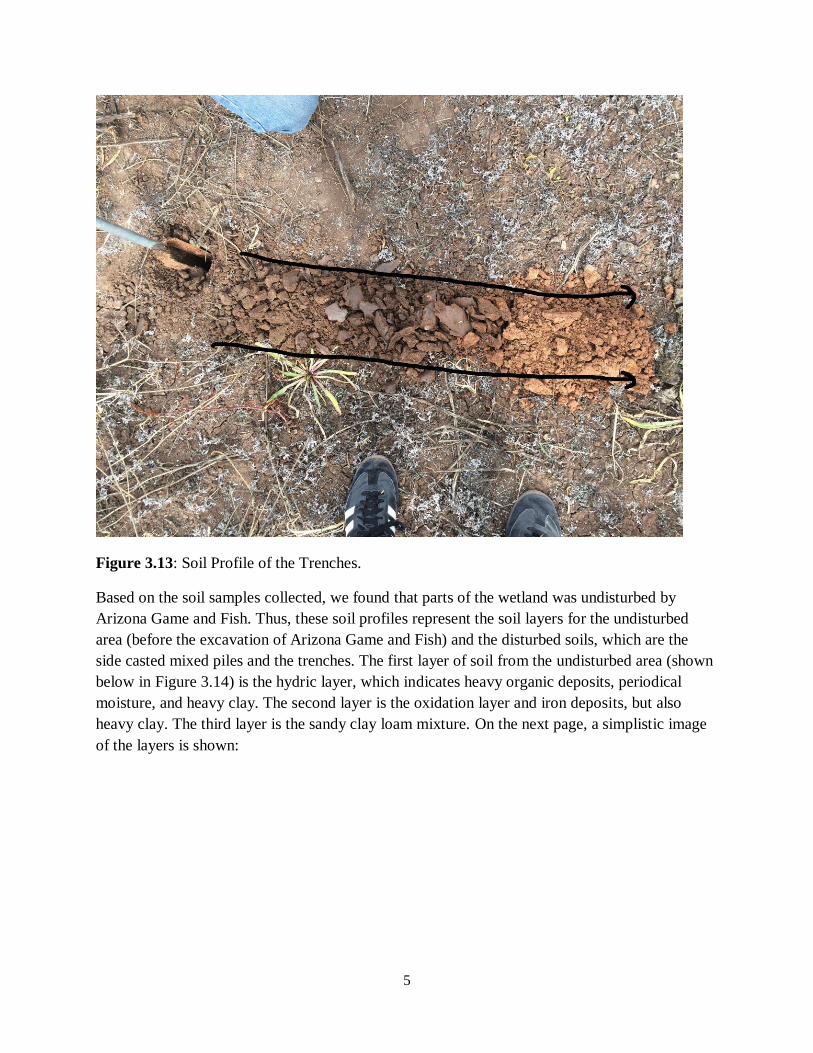
Figure 3.13: Soil Profile of the Trenches.
Based on the soil samples collected, we found that parts of the wetland was undisturbed by
Arizona Game and Fish. Thus, these soil profiles represent the soil layers for the undisturbed
area (before the excavation of Arizona Game and Fish) and the disturbed soils, which are the
side casted mixed piles and the trenches. The first layer of soil from the undisturbed area (shown
below in Figure 3.14) is the hydric layer, which indicates heavy organic deposits, periodical
moisture, and heavy clay. The second layer is the oxidation layer and iron deposits, but also
heavy clay. The third layer is the sandy clay loam mixture. On the next page, a simplistic image
of the layers is shown:

6
Figure 3.14: The soil profile of the undisturbed soils at Allan Lake.
The following figure gives a visual representation of the soil profile of the side cast mixture near
the trenches:
Figure 3.15: The soil profile of the side casted mixture near the trenches.
After collecting soil samples and capturing each soil profile, we conducted surveying work. The
students conducted multiple site visits in order to collect data points. On our first day of
surveying, we established 5 control points with a total station. However, due to the size of the
area a GPS survey unit was borrowed from the forest service and used to complete the majority
of the survey after the first day. Kit MacDonald assisted with the setup and calibration of the
GPS survey unit during the 3 days it was used. Shown on the next page is the total station used
for set the control points for the surveying work:

7
Figure 3.16: Surveying Allan Lake in the Fall of 2016.
Starting from October of 2016 and ending in December of 2016, we were able to collect 2871
points. With the help of the Forest Service and their GPS instrument, we were able to gather
points for an area of 17 acres. Since the GPS instrument allowed for quick point taking, the
following plan was developed: when measuring the trenches, a total of 9 points were to be taken
in a line that runs perpendicular to the trench. Starting at the top edge of the trench, the next
point was taken at ¼ of the way down, the next point was taken ¾ of the down the trench, and
the final point on the one side of the trench was the tow, or the bottom of the trench wall. The
process was repeated on the opposite side, in addition to taking a point at the thalwag. For the
leveled sections of Allan Lake, a point was taken every 6 paces.
8
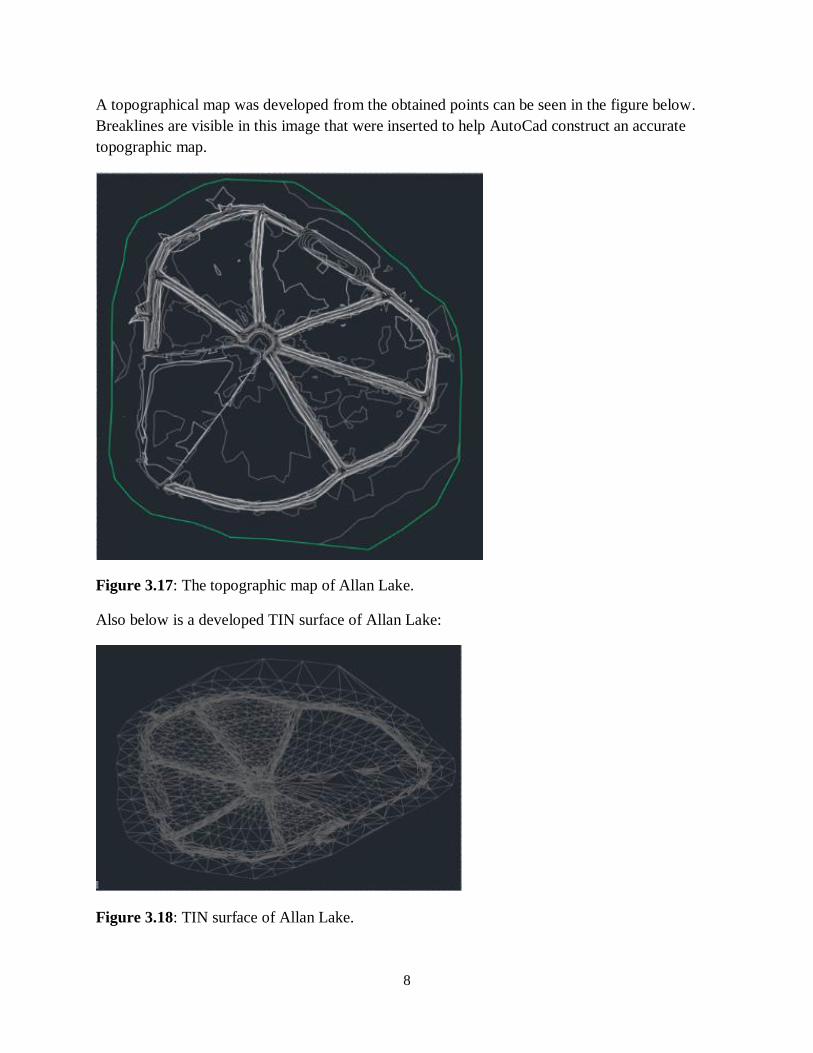
A topographical map was developed from the obtained points can be seen in the figure below.
Breaklines are visible in this image that were inserted to help AutoCad construct an accurate
topographic map.
Figure 3.17: The topographic map of Allan Lake.
Also below is a developed TIN surface of Allan Lake:
Figure 3.18: TIN surface of Allan Lake.

9
After conducting gathering samples and surveying, the team started on the geotechnical lab
analysis. Our first geotechnical lab work was determining the organic content in the top soil
(within 12 inches from the surface). Below is a table that shows the organic content of each soil
profile as well as the average organic content and the standard deviation:
Table 3.19: Organic Results for the top soil in each sample soil profile.
Samples Sample 1
(Undisturbed)
Sample
3
(Trench)
Sample 5
(Side Casted)
Sample 6
(Undisturbed)
Sample 9
(Side Casted)
Sample 11
(Trench)
Sample 13
(Undisturbed)
Organic
(%) 8.17 6.92 9.12 8.74 8.13 7.65 9.56
Samples Sample 16
(Trench)
Sample
18 (Side
Casted)
Sample 21
(Undisturbed)
Sample 23
(Trench)
Sample 25
(Undisturbed)
Sample 27
(Side
Casted)
Organic
(%) 6.63 7.79 11.73 7.24 9.41 9.05
Average = 8.47% Standard Deviation = 1.36%
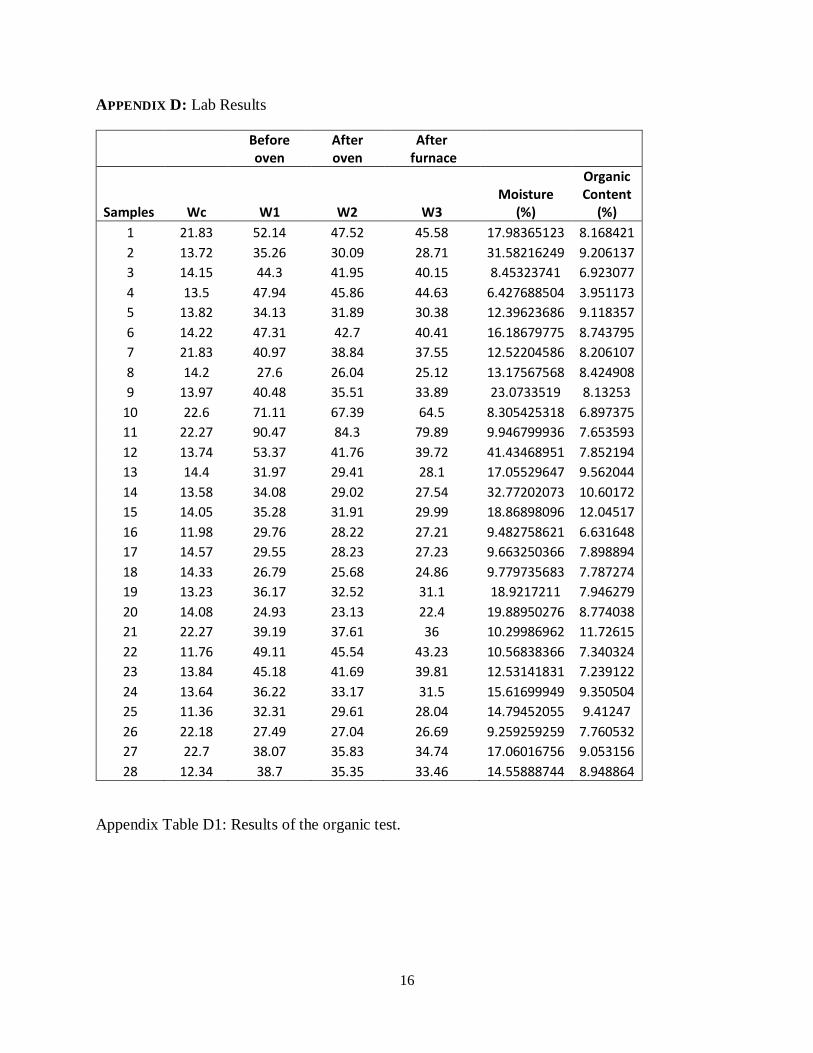
Reference Appendix D to see the organic results for each of the samples per soil profile. It was
noted that the average organic content in the top soil (within 12 inches of the surface) was 8.47%
weight with a standard deviation of 1.36%.
3.2 WORK IN PROGRESS
Currently, the soil tests that are being conducted are the Atterberg limits and Wet Sieve Analysis
that should be completed within a few days. There was a delay in starting these tests due to a
combination of the weather and our client being out of town. We wanted to verify that our
strategy and methods would yield the results that is desired by our client. This was to prevent
wasting any soil samples, as the site is still inaccessible for additional soil gathering.
3.3 FUTURE WORK NEEDED TO BE COMPLETED
The work that is left for the team to complete is the proctor compaction tests and the hydraulic
conductivity soil tests. These tests have not been started yet due to large amount of soil required
relative to the amount that the students have. Once these tests have been completed, it can be
decided roughly how much the site needs to be compacted in order to achieve the desired
hydraulic conductivity. With this data the cut and fill estimate will be completed using the topo
map. Using the cut and fill analysis in AutoCAD, we will then conduct a cost analysis of the
different restoration methods possible to indicate which route will be the best option.

10
4.0 REFERENCES
[1] T. Runyon. (2016, September 6). Allan Lake Statement of Work [Online]. Available email:
[email protected] Message: Introduction.
[2] US Forest Service United States of Department of Agriculture (2016). Allan Lake Wet Rest
Decision Memo Final. [Online]. Available Telnet: http://www.fs.usda.gov/ Directory:
Allan Lake Wetland Restoration Project: Decisions
[3] US Forest Service United States of Department of Agriculture (2016). Decision Cover Letter.
[Online]. Available Telnet: http://www.fs.usda.gov/ Directory: Allan Lake Wetland
Restoration Project: Decisions
[4] Google Earth. (2016). Allan Lake Google Earth [Online] Available: FTP:
https://www.google.com/earth/
[5] B. Gutierrez, G., Green, S., Clemons. (2016, December 2016). Student Project Proposal. Print.

11
5.0 APPENDICES
APPENDIX A- Location of Allan Lake on Google Earth [4]
Appendix Figure A1: Allan Lake location.
Appendix Figure A2: Allan Lake location.

12
APPENDIX B- Arial View of the Trenches of Allan Lake
Appendix Figure B1: View of trenches of Allan Lake.

13
APPENDIX C- Current landscape of the project
Appendix Figure C1: Differences in vegetation between the test restoration section on the right
and the unrestored section on the left. (September 13th, 2016)
Appendix Figure C2: Small puddle of water in the deepest portion of the restored section.
(September 13th, 2016)
14
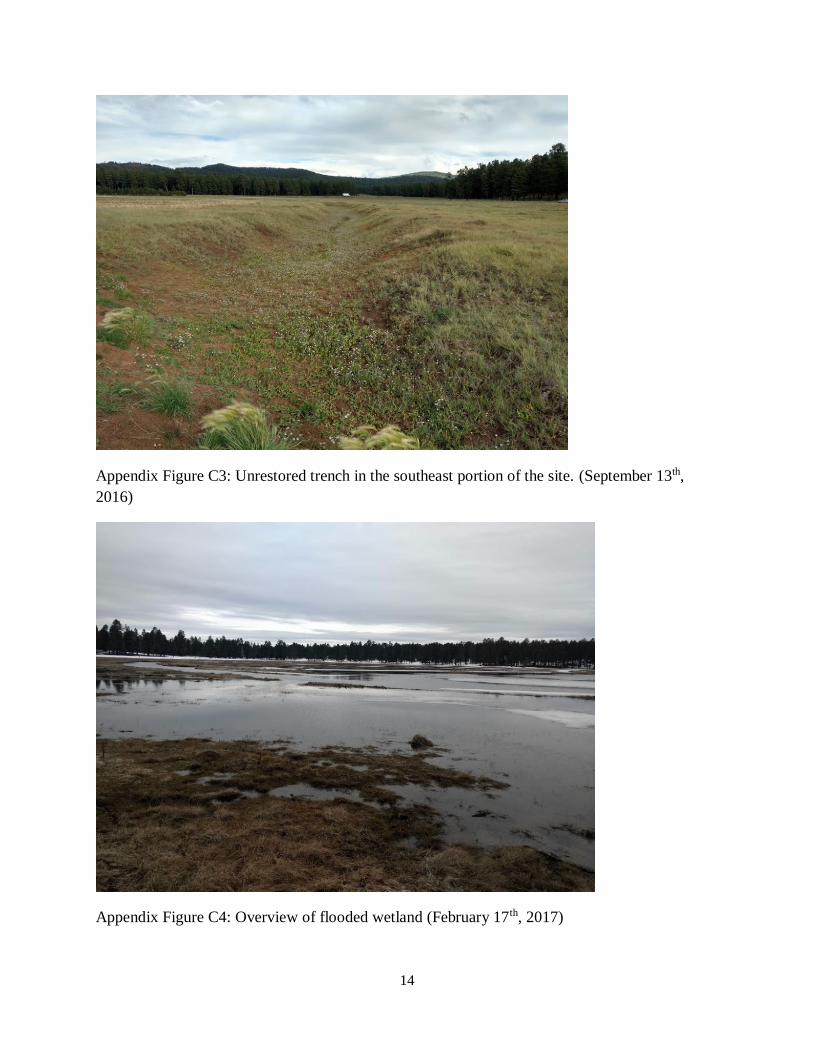
Appendix Figure C3: Unrestored trench in the southeast portion of the site. (September 13th,
2016)
Appendix Figure C4: Overview of flooded wetland (February 17th, 2017)

15
Appendix Figure C5: Looking at the test restoration section on the left and the unrestored section
on the right, with the lake at full capacity. (February 17th, 2017)
Appendix Figure C6: Trenches in the unrestored area covered by ice during the winter. (February
17th, 2017)
16
APPENDIX D: Lab Results
Before oven
After oven
After furnace
Samples Wc W1 W2 W3 Moisture
(%)
Organic Content
(%)
1 21.83 52.14 47.52 45.58 17.98365123 8.168421
2 13.72 35.26 30.09 28.71 31.58216249 9.206137
3 14.15 44.3 41.95 40.15 8.45323741 6.923077
4 13.5 47.94 45.86 44.63 6.427688504 3.951173
5 13.82 34.13 31.89 30.38 12.39623686 9.118357
6 14.22 47.31 42.7 40.41 16.18679775 8.743795
7 21.83 40.97 38.84 37.55 12.52204586 8.206107
8 14.2 27.6 26.04 25.12 13.17567568 8.424908
9 13.97 40.48 35.51 33.89 23.0733519 8.13253
10 22.6 71.11 67.39 64.5 8.305425318 6.897375
11 22.27 90.47 84.3 79.89 9.946799936 7.653593
12 13.74 53.37 41.76 39.72 41.43468951 7.852194
13 14.4 31.97 29.41 28.1 17.05529647 9.562044
14 13.58 34.08 29.02 27.54 32.77202073 10.60172
15 14.05 35.28 31.91 29.99 18.86898096 12.04517
16 11.98 29.76 28.22 27.21 9.482758621 6.631648
17 14.57 29.55 28.23 27.23 9.663250366 7.898894
18 14.33 26.79 25.68 24.86 9.779735683 7.787274
19 13.23 36.17 32.52 31.1 18.9217211 7.946279
20 14.08 24.93 23.13 22.4 19.88950276 8.774038
21 22.27 39.19 37.61 36 10.29986962 11.72615
22 11.76 49.11 45.54 43.23 10.56838366 7.340324
23 13.84 45.18 41.69 39.81 12.53141831 7.239122
24 13.64 36.22 33.17 31.5 15.61699949 9.350504
25 11.36 32.31 29.61 28.04 14.79452055 9.41247
26 22.18 27.49 27.04 26.69 9.259259259 7.760532
27 22.7 38.07 35.83 34.74 17.06016756 9.053156
28 12.34 38.7 35.35 33.46 14.55888744 8.948864
Appendix Table D1: Results of the organic test.

17
Appendix E: Bore logs
Appendix Figure E1: Bore log from sample site 3 in the undisturbed area