census 2010, summary file 1 table of contents toc page · census 2010, summary file 1 table of...
TRANSCRIPT

Census 2010, Summary File 1 TABLE OF CONTENTS TOC Page Area: King County Component:Urban Area Type: State-County (Summary Level: 050)State: WA County: 033 +===================================================================================================================================================+| || ========== PAGE TITLE ========== == Page mnemonic and notes == == Selected in == || (All available pages) == this run == || || General Profile 1: Persons by Race, Age, & Sex; Urban and Rural Gen-1 X || General Profile 2: Households & Families by Type; Household Relationship by Age Gen-2 X || General Profile 3: Population Under 20; Relationship by Age (Under 18) Gen-3 X || General Profile 4: Households & Families by Type, Size, and Age of Household Members Gen-4 X || General Profile 5: Husband-Wife and Unmarried-Partner Households Gen-5 X || General Profile 6: Housing Unit, Tenure, Vacancy Type, Household Size, Householder Race/Age Gen-6 X || General Profile 7: Tenure by Household Type by Age; Nonfamily Households, Nonrelatives Gen-7 X || General Profile 8: Group Quarters Population by Sex by Age by Detailed Type Gen-8 X || General Profile 9: Group Quarters Population by Sex by Detailed Age Gen-9 X || || Age Profile 1: Age by Sex for Persons in Households and Persons in Group Quarters Age-1 X || Age Profile 2: Full Age Detail (All Ages) by Sex, with Medians and Addtitional Aggregations Age-2 X || || Age/Sex Profile for Specific Race/Ethnic Group A: White Alone RaceAge-A (all 15 Races Selected: || ...through... through in list ABCDEFGH || Age/Sex Profile for Specific Race/Ethnic Group O: Two or More Races, Not Hispanic/Latino RaceAge-O below) IJKLMNO || || Race Profile 1: Detailed Race by Hispanic/Latino Ethnicity, with Total Tallies Race-1 X || Race Profile 2: Detailed Race by Hispanic/Latino Ethnicity (18+); Tallies for Householders Race-2 X || Race Profile 3: Matrix Presentation of Multiple Race Combinations Race-3 X || Race Profile 4: Detailed Native American, Asian, Pacific Islander, & Hisp/Latino Subgroups Race-4 X || || Profile of Specific Race/Ethnic Group A: White Alone Race-A (see below; Races Selected: || ...through... through nine 3-page ABCDEFGHI || Profile of Specific Race/Ethnic Group I: White Alone, Not Hispanic or Latino Race-I spreads) || || Specific Race/Ethnic Groups for which various profiles are available: || A = White Alone || B = Black or African American Alone || C = American Indian and Alaska Native Alone || D = Asian Alone || E = Native Hawaiian and Other Pacific Islander Alone || F = Some Other Race Alone || G = Two or More Races || H = Hispanic or Latino of Any Race || I = White Alone, Not Hispanic or Latino || J = Black or African American Alone, Not Hispanic or Latino || K = American Indian and Alaska Native Alone, Not Hispanic or Latino || L = Asian Alone, Not Hispanic or Latino || M = Native Hawaiian and Other Pacific Islander Alone, Not Hispanic or Latino || N = Some Other Race Alone, Not Hispanic or Latino || O = Two or More Races, Not Hispanic or Latino || || || || || || || || || || |+===================================================================================================================================================+Source: Census 2010 Summary File 1 [machine-readable data file]/Prepared by the U.S.Census Bureau, 2011. 06NOV12 Page 1 Prepared by: Washington State Office of Financial Management, Forecasting Division.

Census 2010, Summary File 1 GENERAL PROFILE 1: PERSONS BY RACE, AGE, AND SEX; URBAN AND RURAL Gen-1Area: King County Component:Urban Area Type: State-County (Summary Level: 050)State: WA County: 033 +===================================================================================================================================================+|P1/P15/P16/P17/P35/P36/P37. POPULATION SUMMARY |P12/P13. POPULATION BY AGE AND SEX ||Universe: Persons, Households, Families |Universe: Persons || | ||Total Population 1,869,311 Total Families 444,005 | Both Sexes Male Female ||Total Households 765,527 Population in Families 1,357,464 | Number Pct. Number Pct. Number Pct. || Population in Households 1,832,370 Under 18 years 391,858 | || Under 18 years 398,333 18 years and over 965,606 |All Ages: 1,869,311 100.0 930,606 100.0 938,705 100.0 || 18 years and over 1,434,037 Average Family Size 3.06 | || Average Household Size 2.39 Under 18 years 0.88 | Under 5 117,546 6.3 60,175 6.5 57,371 6.1 || Under 18 years 0.52 18 years and over 2.17 | 5 to 9 109,829 5.9 56,128 6.0 53,701 5.7 || 18 years and over 1.87 | 10 to 14 106,330 5.7 54,487 5.9 51,843 5.5 ||---------------------------------------------------------------------------------| 15 to 17 66,091 3.5 33,956 3.6 32,135 3.4 ||P3/P5. POPULATION BY RACE AND HISPANIC OR LATINO | 18 and 19 46,907 2.5 23,767 2.6 23,140 2.5 ||Universe: Persons Not | 20 23,916 1.3 12,109 1.3 11,807 1.3 || Total Hispanic Hispanic | 21 23,575 1.3 12,061 1.3 11,514 1.2 || | 22 to 24 79,894 4.3 40,136 4.3 39,758 4.2 ||Total: 1,869,311 169,794 1,699,517 | 25 to 29 158,498 8.5 80,592 8.7 77,906 8.3 || White alone 1,269,805 73,250 1,196,555 | 30 to 34 149,656 8.0 76,344 8.2 73,312 7.8 || Black or African American alone 119,381 3,456 115,925 | 35 to 39 145,737 7.8 74,313 8.0 71,424 7.6 || American Indian and Alaska Native alone 14,872 3,098 11,774 | 40 to 44 142,877 7.6 73,265 7.9 69,612 7.4 || Asian alone 280,794 2,031 278,763 | 45 to 49 141,503 7.6 71,670 7.7 69,833 7.4 || Native Hawaiian/Other Pacific Isl. alone 14,409 410 13,999 | 50 to 54 136,377 7.3 68,302 7.3 68,075 7.3 || Some Other Race alone 75,154 70,572 4,582 | 55 to 59 120,289 6.4 58,963 6.3 61,326 6.5 || Two or More Races 94,896 16,977 77,919 | 60 and 61 41,847 2.2 20,318 2.2 21,529 2.3 ||---------------------------------------------------------------------------------| 62 to 64 55,441 3.0 26,686 2.9 28,755 3.1 ||P15/P16A-I/P17A-I. HOUSEHOLDS AND HOUSEHOLD POPULATION BY RACE OF HOUSEHOLDER | 65 and 66 29,031 1.6 13,805 1.5 15,226 1.6 ||Universe: Households and Population in Households by Race of Householder | 67 to 69 35,267 1.9 16,820 1.8 18,447 2.0 || Average | 70 to 74 43,487 2.3 19,913 2.1 23,574 2.5 || Households Pop. in HH HH Size | 75 to 79 33,973 1.8 14,859 1.6 19,114 2.0 ||Householder: | 80 to 84 28,150 1.5 11,047 1.2 17,103 1.8 || White alone 569,626 1,285,017 2.26 | 85 + 33,090 1.8 10,890 1.2 22,200 2.4 || Black or African American alone 46,158 115,734 2.51 | || American Indian and Alaska Native alone 5,337 13,691 2.57 | 18 + 1,469,515 78.6 725,860 78.0 743,655 79.2 || Asian alone 96,433 270,170 2.80 | 65 + 202,998 10.9 87,334 9.4 115,664 12.3 || Native Hawaiian/Other Pacific Islander alone 3,754 14,318 3.81 | || Some Other Race alone 20,107 72,510 3.61 |Median Age 36.8 36.0 37.6 || Two or More Races 24,112 60,930 2.53 | || | || Hispanic or Latino (Any race) 47,090 153,158 3.25 | || White alone, not Hispanic 547,694 1,219,974 2.23 | ||---------------------------------------------------------------------------------|-----------------------------------------------------------------||P35A-I/P36A-I/P37A-I. FAMILIES AND POPULATION IN FAMILIES BY RACE OF HOUSEHOLDER |P2/H2. URBAN AND RURAL ||Universe: Families and Population in Families by Race of Householder |Universe: Population, Housing units || Population Average | || Families in Families Fam. Size | -- Population -- Housing ||Householder: | Number Pct. Units || White alone 317,402 922,161 2.91 | || Black or African American alone 26,608 88,221 3.32 |Total: 1,869,311 100.0 824,563 || American Indian and Alaska Native alone 3,046 9,908 3.25 | Urban: 1,869,311 100.0 824,563 || Asian alone 65,877 222,613 3.38 | Inside urbanized areas 1,848,719 98.9 816,849 || Native Hawaiian/Other Pacific Islander alone 2,868 12,516 4.36 | Inside urban clusters 20,592 1.1 7,714 || Some Other Race alone 14,860 59,110 3.98 | Rural 0 0.0 0 || Two or More Races 13,344 42,935 3.22 | || | || Hispanic or Latino (Any race) 32,314 121,718 3.77 | || White alone, not Hispanic 303,133 871,355 2.87 | |+===================================================================================================================================================+Source: Census 2010 Summary File 1 [machine-readable data file]/Prepared by the U.S.Census Bureau, 2011. 06NOV12 Page 2 Prepared by: Washington State Office of Financial Management, Forecasting Division.
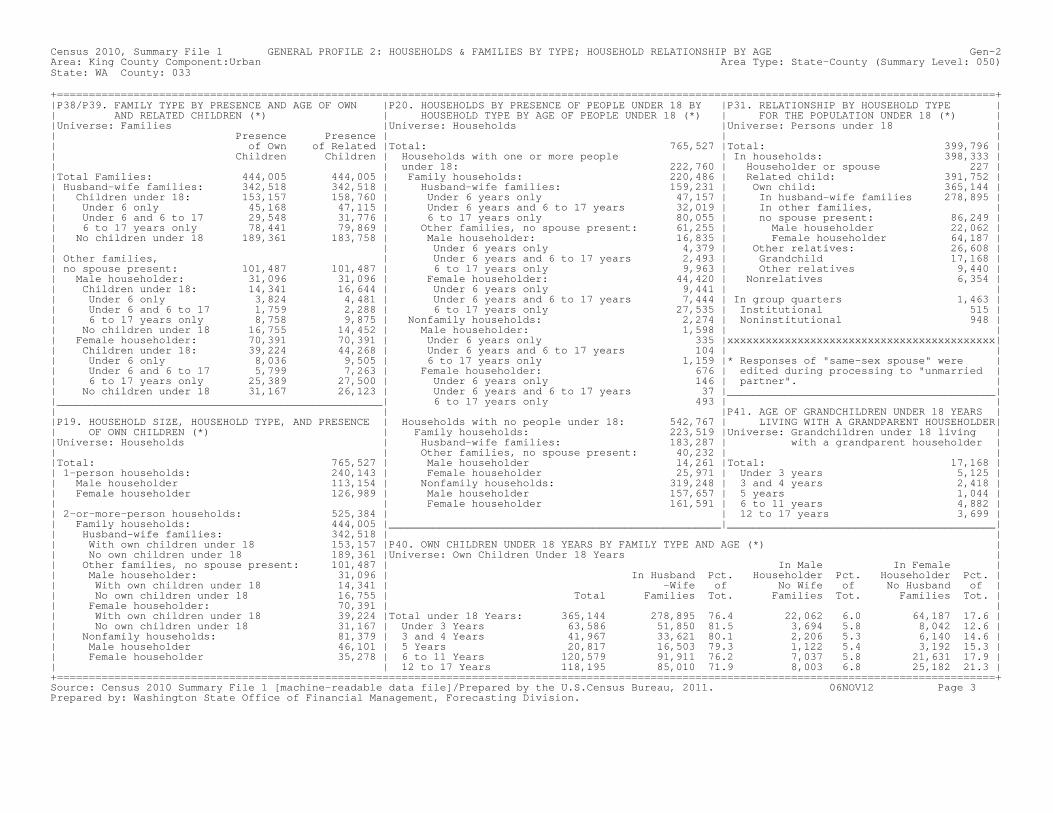
Census 2010, Summary File 1 GENERAL PROFILE 2: HOUSEHOLDS & FAMILIES BY TYPE; HOUSEHOLD RELATIONSHIP BY AGE Gen-2Area: King County Component:Urban Area Type: State-County (Summary Level: 050)State: WA County: 033 +===================================================================================================================================================+|P38/P39. FAMILY TYPE BY PRESENCE AND AGE OF OWN |P20. HOUSEHOLDS BY PRESENCE OF PEOPLE UNDER 18 BY |P31. RELATIONSHIP BY HOUSEHOLD TYPE || AND RELATED CHILDREN (*) | HOUSEHOLD TYPE BY AGE OF PEOPLE UNDER 18 (*) | FOR THE POPULATION UNDER 18 (*) ||Universe: Families |Universe: Households |Universe: Persons under 18 || Presence Presence | | || of Own of Related |Total: 765,527 |Total: 399,796 || Children Children | Households with one or more people | In households: 398,333 || | under 18: 222,760 | Householder or spouse 227 ||Total Families: 444,005 444,005 | Family households: 220,486 | Related child: 391,752 || Husband-wife families: 342,518 342,518 | Husband-wife families: 159,231 | Own child: 365,144 || Children under 18: 153,157 158,760 | Under 6 years only 47,157 | In husband-wife families 278,895 || Under 6 only 45,168 47,115 | Under 6 years and 6 to 17 years 32,019 | In other families, || Under 6 and 6 to 17 29,548 31,776 | 6 to 17 years only 80,055 | no spouse present: 86,249 || 6 to 17 years only 78,441 79,869 | Other families, no spouse present: 61,255 | Male householder 22,062 || No children under 18 189,361 183,758 | Male householder: 16,835 | Female householder 64,187 || | Under 6 years only 4,379 | Other relatives: 26,608 || Other families, | Under 6 years and 6 to 17 years 2,493 | Grandchild 17,168 || no spouse present: 101,487 101,487 | 6 to 17 years only 9,963 | Other relatives 9,440 || Male householder: 31,096 31,096 | Female householder: 44,420 | Nonrelatives 6,354 || Children under 18: 14,341 16,644 | Under 6 years only 9,441 | || Under 6 only 3,824 4,481 | Under 6 years and 6 to 17 years 7,444 | In group quarters 1,463 || Under 6 and 6 to 17 1,759 2,288 | 6 to 17 years only 27,535 | Institutional 515 || 6 to 17 years only 8,758 9,875 | Nonfamily households: 2,274 | Noninstitutional 948 || No children under 18 16,755 14,452 | Male householder: 1,598 | || Female householder: 70,391 70,391 | Under 6 years only 335 |xxxxxxxxxxxxxxxxxxxxxxxxxxxxxxxxxxxxxxxxxx|| Children under 18: 39,224 44,268 | Under 6 years and 6 to 17 years 104 | || Under 6 only 8,036 9,505 | 6 to 17 years only 1,159 |* Responses of "same-sex spouse" were || Under 6 and 6 to 17 5,799 7,263 | Female householder: 676 | edited during processing to "unmarried || 6 to 17 years only 25,389 27,500 | Under 6 years only 146 | partner". || No children under 18 31,167 26,123 | Under 6 years and 6 to 17 years 37 |__________________________________________||___________________________________________________| 6 to 17 years only 493 | || | |P41. AGE OF GRANDCHILDREN UNDER 18 YEARS ||P19. HOUSEHOLD SIZE, HOUSEHOLD TYPE, AND PRESENCE | Households with no people under 18: 542,767 | LIVING WITH A GRANDPARENT HOUSEHOLDER|| OF OWN CHILDREN (*) | Family households: 223,519 |Universe: Grandchildren under 18 living ||Universe: Households | Husband-wife families: 183,287 | with a grandparent householder || | Other families, no spouse present: 40,232 | ||Total: 765,527 | Male householder 14,261 |Total: 17,168 || 1-person households: 240,143 | Female householder 25,971 | Under 3 years 5,125 || Male householder 113,154 | Nonfamily households: 319,248 | 3 and 4 years 2,418 || Female householder 126,989 | Male householder 157,657 | 5 years 1,044 || | Female householder 161,591 | 6 to 11 years 4,882 || 2-or-more-person households: 525,384 | | 12 to 17 years 3,699 || Family households: 444,005 |____________________________________________________|__________________________________________|| Husband-wife families: 342,518 | || With own children under 18 153,157 |P40. OWN CHILDREN UNDER 18 YEARS BY FAMILY TYPE AND AGE (*) || No own children under 18 189,361 |Universe: Own Children Under 18 Years || Other families, no spouse present: 101,487 | In Male In Female || Male householder: 31,096 | In Husband Pct. Householder Pct. Householder Pct. || With own children under 18 14,341 | -Wife of No Wife of No Husband of || No own children under 18 16,755 | Total Families Tot. Families Tot. Families Tot. || Female householder: 70,391 | || With own children under 18 39,224 |Total under 18 Years: 365,144 278,895 76.4 22,062 6.0 64,187 17.6 || No own children under 18 31,167 | Under 3 Years 63,586 51,850 81.5 3,694 5.8 8,042 12.6 || Nonfamily households: 81,379 | 3 and 4 Years 41,967 33,621 80.1 2,206 5.3 6,140 14.6 || Male householder 46,101 | 5 Years 20,817 16,503 79.3 1,122 5.4 3,192 15.3 || Female householder 35,278 | 6 to 11 Years 120,579 91,911 76.2 7,037 5.8 21,631 17.9 || | 12 to 17 Years 118,195 85,010 71.9 8,003 6.8 25,182 21.3 |+===================================================================================================================================================+Source: Census 2010 Summary File 1 [machine-readable data file]/Prepared by the U.S.Census Bureau, 2011. 06NOV12 Page 3 Prepared by: Washington State Office of Financial Management, Forecasting Division.
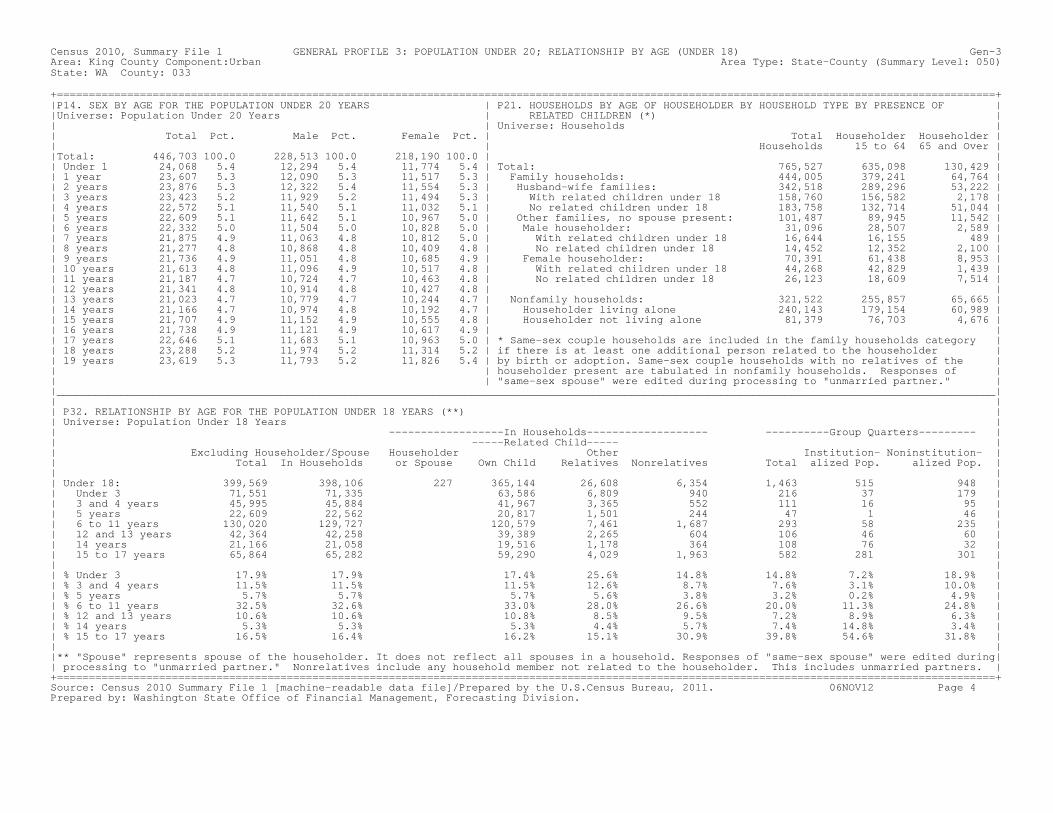
Census 2010, Summary File 1 GENERAL PROFILE 3: POPULATION UNDER 20; RELATIONSHIP BY AGE (UNDER 18) Gen-3Area: King County Component:Urban Area Type: State-County (Summary Level: 050)State: WA County: 033 +===================================================================================================================================================+|P14. SEX BY AGE FOR THE POPULATION UNDER 20 YEARS | P21. HOUSEHOLDS BY AGE OF HOUSEHOLDER BY HOUSEHOLD TYPE BY PRESENCE OF ||Universe: Population Under 20 Years | RELATED CHILDREN (*) || | Universe: Households || Total Pct. Male Pct. Female Pct. | Total Householder Householder || | Households 15 to 64 65 and Over ||Total: 446,703 100.0 228,513 100.0 218,190 100.0 | || Under 1 24,068 5.4 12,294 5.4 11,774 5.4 | Total: 765,527 635,098 130,429 || 1 year 23,607 5.3 12,090 5.3 11,517 5.3 | Family households: 444,005 379,241 64,764 || 2 years 23,876 5.3 12,322 5.4 11,554 5.3 | Husband-wife families: 342,518 289,296 53,222 || 3 years 23,423 5.2 11,929 5.2 11,494 5.3 | With related children under 18 158,760 156,582 2,178 || 4 years 22,572 5.1 11,540 5.1 11,032 5.1 | No related children under 18 183,758 132,714 51,044 || 5 years 22,609 5.1 11,642 5.1 10,967 5.0 | Other families, no spouse present: 101,487 89,945 11,542 || 6 years 22,332 5.0 11,504 5.0 10,828 5.0 | Male householder: 31,096 28,507 2,589 || 7 years 21,875 4.9 11,063 4.8 10,812 5.0 | With related children under 18 16,644 16,155 489 || 8 years 21,277 4.8 10,868 4.8 10,409 4.8 | No related children under 18 14,452 12,352 2,100 || 9 years 21,736 4.9 11,051 4.8 10,685 4.9 | Female householder: 70,391 61,438 8,953 || 10 years 21,613 4.8 11,096 4.9 10,517 4.8 | With related children under 18 44,268 42,829 1,439 || 11 years 21,187 4.7 10,724 4.7 10,463 4.8 | No related children under 18 26,123 18,609 7,514 || 12 years 21,341 4.8 10,914 4.8 10,427 4.8 | || 13 years 21,023 4.7 10,779 4.7 10,244 4.7 | Nonfamily households: 321,522 255,857 65,665 || 14 years 21,166 4.7 10,974 4.8 10,192 4.7 | Householder living alone 240,143 179,154 60,989 || 15 years 21,707 4.9 11,152 4.9 10,555 4.8 | Householder not living alone 81,379 76,703 4,676 || 16 years 21,738 4.9 11,121 4.9 10,617 4.9 | || 17 years 22,646 5.1 11,683 5.1 10,963 5.0 | * Same-sex couple households are included in the family households category || 18 years 23,288 5.2 11,974 5.2 11,314 5.2 | if there is at least one additional person related to the householder || 19 years 23,619 5.3 11,793 5.2 11,826 5.4 | by birth or adoption. Same-sex couple households with no relatives of the || | householder present are tabulated in nonfamily households. Responses of || | "same-sex spouse" were edited during processing to "unmarried partner." ||___________________________________________________________________________________________________________________________________________________|| || P32. RELATIONSHIP BY AGE FOR THE POPULATION UNDER 18 YEARS (**) || Universe: Population Under 18 Years || ------------------In Households------------------- ----------Group Quarters--------- || -----Related Child----- || Excluding Householder/Spouse Householder Other Institution- Noninstitution- || Total In Households or Spouse Own Child Relatives Nonrelatives Total alized Pop. alized Pop. || || Under 18: 399,569 398,106 227 365,144 26,608 6,354 1,463 515 948 || Under 3 71,551 71,335 63,586 6,809 940 216 37 179 || 3 and 4 years 45,995 45,884 41,967 3,365 552 111 16 95 || 5 years 22,609 22,562 20,817 1,501 244 47 1 46 || 6 to 11 years 130,020 129,727 120,579 7,461 1,687 293 58 235 || 12 and 13 years 42,364 42,258 39,389 2,265 604 106 46 60 || 14 years 21,166 21,058 19,516 1,178 364 108 76 32 || 15 to 17 years 65,864 65,282 59,290 4,029 1,963 582 281 301 || || % Under 3 17.9% 17.9% 17.4% 25.6% 14.8% 14.8% 7.2% 18.9% || % 3 and 4 years 11.5% 11.5% 11.5% 12.6% 8.7% 7.6% 3.1% 10.0% || % 5 years 5.7% 5.7% 5.7% 5.6% 3.8% 3.2% 0.2% 4.9% || % 6 to 11 years 32.5% 32.6% 33.0% 28.0% 26.6% 20.0% 11.3% 24.8% || % 12 and 13 years 10.6% 10.6% 10.8% 8.5% 9.5% 7.2% 8.9% 6.3% || % 14 years 5.3% 5.3% 5.3% 4.4% 5.7% 7.4% 14.8% 3.4% || % 15 to 17 years 16.5% 16.4% 16.2% 15.1% 30.9% 39.8% 54.6% 31.8% || ||** "Spouse" represents spouse of the householder. It does not reflect all spouses in a household. Responses of "same-sex spouse" were edited during|| processing to "unmarried partner." Nonrelatives include any household member not related to the householder. This includes unmarried partners. |+===================================================================================================================================================+Source: Census 2010 Summary File 1 [machine-readable data file]/Prepared by the U.S.Census Bureau, 2011. 06NOV12 Page 4 Prepared by: Washington State Office of Financial Management, Forecasting Division.
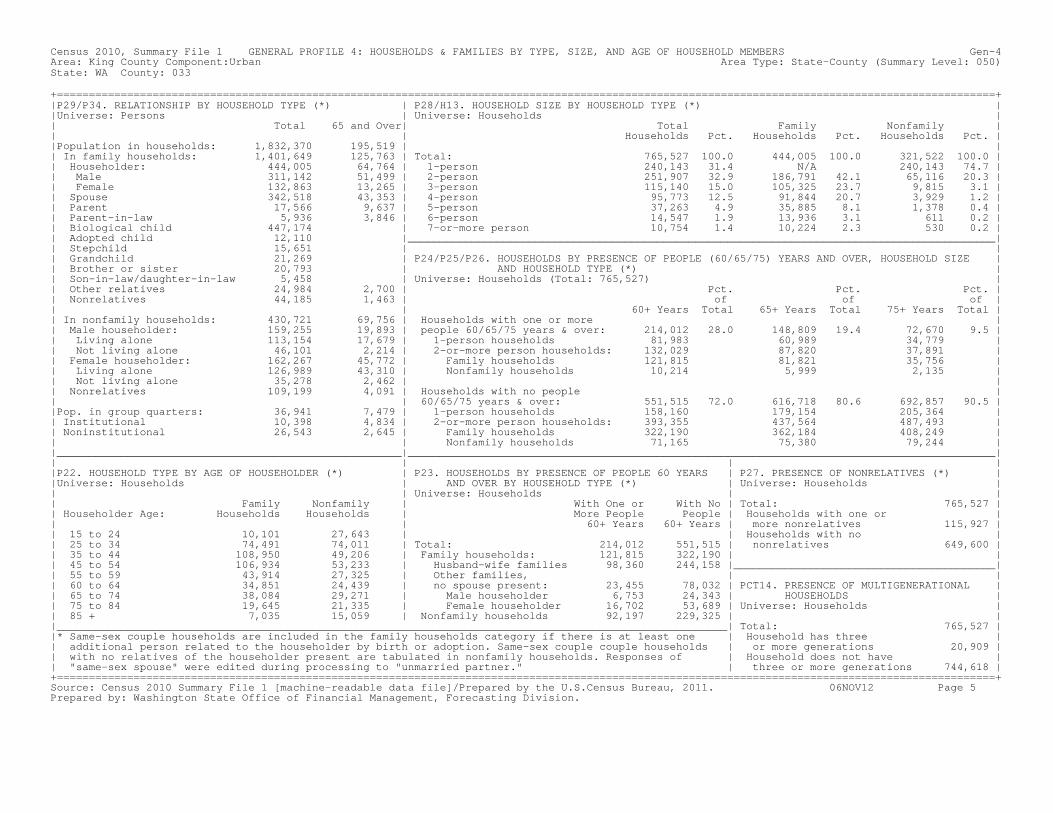
Census 2010, Summary File 1 GENERAL PROFILE 4: HOUSEHOLDS & FAMILIES BY TYPE, SIZE, AND AGE OF HOUSEHOLD MEMBERS Gen-4Area: King County Component:Urban Area Type: State-County (Summary Level: 050)State: WA County: 033 +===================================================================================================================================================+|P29/P34. RELATIONSHIP BY HOUSEHOLD TYPE (*) | P28/H13. HOUSEHOLD SIZE BY HOUSEHOLD TYPE (*) ||Universe: Persons | Universe: Households || Total 65 and Over| Total Family Nonfamily || | Households Pct. Households Pct. Households Pct. ||Population in households: 1,832,370 195,519 | || In family households: 1,401,649 125,763 | Total: 765,527 100.0 444,005 100.0 321,522 100.0 || Householder: 444,005 64,764 | 1-person 240,143 31.4 N/A 240,143 74.7 || Male 311,142 51,499 | 2-person 251,907 32.9 186,791 42.1 65,116 20.3 || Female 132,863 13,265 | 3-person 115,140 15.0 105,325 23.7 9,815 3.1 || Spouse 342,518 43,353 | 4-person 95,773 12.5 91,844 20.7 3,929 1.2 || Parent 17,566 9,637 | 5-person 37,263 4.9 35,885 8.1 1,378 0.4 || Parent-in-law 5,936 3,846 | 6-person 14,547 1.9 13,936 3.1 611 0.2 || Biological child 447,174 | 7-or-more person 10,754 1.4 10,224 2.3 530 0.2 || Adopted child 12,110 |____________________________________________________________________________________________|| Stepchild 15,651 | || Grandchild 21,269 | P24/P25/P26. HOUSEHOLDS BY PRESENCE OF PEOPLE (60/65/75) YEARS AND OVER, HOUSEHOLD SIZE || Brother or sister 20,793 | AND HOUSEHOLD TYPE (*) || Son-in-law/daughter-in-law 5,458 | Universe: Households (Total: 765,527) || Other relatives 24,984 2,700 | Pct. Pct. Pct. || Nonrelatives 44,185 1,463 | of of of || | 60+ Years Total 65+ Years Total 75+ Years Total || In nonfamily households: 430,721 69,756 | Households with one or more || Male householder: 159,255 19,893 | people 60/65/75 years & over: 214,012 28.0 148,809 19.4 72,670 9.5 || Living alone 113,154 17,679 | 1-person households 81,983 60,989 34,779 || Not living alone 46,101 2,214 | 2-or-more person households: 132,029 87,820 37,891 || Female householder: 162,267 45,772 | Family households 121,815 81,821 35,756 || Living alone 126,989 43,310 | Nonfamily households 10,214 5,999 2,135 || Not living alone 35,278 2,462 | || Nonrelatives 109,199 4,091 | Households with no people || | 60/65/75 years & over: 551,515 72.0 616,718 80.6 692,857 90.5 ||Pop. in group quarters: 36,941 7,479 | 1-person households 158,160 179,154 205,364 || Institutional 10,398 4,834 | 2-or-more person households: 393,355 437,564 487,493 || Noninstitutional 26,543 2,645 | Family households 322,190 362,184 408,249 || | Nonfamily households 71,165 75,380 79,244 ||______________________________________________________|____________________________________________________________________________________________|| | | ||P22. HOUSEHOLD TYPE BY AGE OF HOUSEHOLDER (*) | P23. HOUSEHOLDS BY PRESENCE OF PEOPLE 60 YEARS | P27. PRESENCE OF NONRELATIVES (*) ||Universe: Households | AND OVER BY HOUSEHOLD TYPE (*) | Universe: Households || | Universe: Households | || Family Nonfamily | With One or With No | Total: 765,527 || Householder Age: Households Households | More People People | Households with one or || | 60+ Years 60+ Years | more nonrelatives 115,927 || 15 to 24 10,101 27,643 | | Households with no || 25 to 34 74,491 74,011 | Total: 214,012 551,515 | nonrelatives 649,600 || 35 to 44 108,950 49,206 | Family households: 121,815 322,190 | || 45 to 54 106,934 53,233 | Husband-wife families 98,360 244,158 |_________________________________________|| 55 to 59 43,914 27,325 | Other families, | || 60 to 64 34,851 24,439 | no spouse present: 23,455 78,032 | PCT14. PRESENCE OF MULTIGENERATIONAL || 65 to 74 38,084 29,271 | Male householder 6,753 24,343 | HOUSEHOLDS || 75 to 84 19,645 21,335 | Female householder 16,702 53,689 | Universe: Households || 85 + 7,035 15,059 | Nonfamily households 92,197 229,325 | ||_________________________________________________________________________________________________________| Total: 765,527 ||* Same-sex couple households are included in the family households category if there is at least one | Household has three || additional person related to the householder by birth or adoption. Same-sex couple couple households | or more generations 20,909 || with no relatives of the householder present are tabulated in nonfamily households. Responses of | Household does not have || "same-sex spouse" were edited during processing to "unmarried partner." | three or more generations 744,618 |+===================================================================================================================================================+Source: Census 2010 Summary File 1 [machine-readable data file]/Prepared by the U.S.Census Bureau, 2011. 06NOV12 Page 5 Prepared by: Washington State Office of Financial Management, Forecasting Division.

Census 2010, Summary File 1 GENERAL PROFILE 5: HUSBAND-WIFE AND UNMARRIED-PARTNER HOUSEHOLDS Gen-5Area: King County Component:Urban Area Type: State-County (Summary Level: 050)State: WA County: 033 +===================================================================================================================================================+|PCT15. HUSBAND-WIFE AND UNMARRIED-PARTNER HOUSEHOLDS BY SEX PCT17. PRESENCE OF UNMARRIED PARTNER OF HOUSEHOLDER BY HOUSEHOLD TYPE || OF PARTNERS BY PRESENCE OF RELATED AND OWN CHILDREN | FOR THE POPULATION UNDER 18 YEARS IN HOUSEHOLDS || UNDER 18 YEARS (**) | Universe: Population under 18 years in households (excluding householders, ||Universe: Households | spouses, and unmarried partners)(**) || | ||Total: 765,527 100.0 | Total: 398,069 100.0 || Husband-wife households: 342,518 44.7 | Unmarried partner of householder present: 25,756 6.5 || Male householder: 280,046 | In family households: 24,361 6.1 || With related children under 18 years 128,287 | Male householder and male partner 848 0.2 || With own children under 18 years 123,549 | Male householder and female partner 10,597 2.7 || No own children under 18 years 4,738 | Female householder and female partner 1,852 0.5 || No related children under 18 years 151,759 | Female householder and male partner 11,064 2.8 || Female householder: 62,472 | In nonfamily households: 1,395 0.4 || With related children under 18 years 30,473 | Male householder and male partner 27 0.0 || With own children under 18 years 29,608 | Male householder and female partner 1,125 0.3 || No own children under 18 years 865 | Female householder and female partner 63 0.0 || No related children under 18 years 31,999 | Female householder and male partner 180 0.0 || | || Unmarried-partner households: 59,653 7.8 | No unmarried partner of householder present: 372,313 93.5 || Male householder and male partner: 5,452 | In family households: 370,825 93.2 || With related children under 18 years 496 | Husband-wife families 293,422 73.7 || With own children under 18 years 464 | Male householder, no wife present 15,646 3.9 || No own children under 18 years 32 | Female householder, no husband present 61,757 15.5 || No related children under 18 years 4,956 | In nonfamily households 1,488 0.4 || Male householder and female partner: 25,905 | || With related children under 18 years 6,003 |____________________________________________________________________________________|| With own children under 18 years 5,785 | || No own children under 18 years 218 | PCT16. HOUSEHOLD TYPE BY NUMBER OF PEOPLE UNDER 18 YEARS (EXCLUDING HOUSEHOLDERS, || No related children under 18 years 19,902 | SPOUSES, AND UNMARRIED PARTNERS (*)(**) || Female householder and female partner: 4,858 | Universe: Households (Total: 765,527) || With related children under 18 years 1,080 | || With own children under 18 years 1,042 | -------- Family Households -------- || No own children under 18 years 38 | Male Female || No related children under 18 years 3,778 | Householder Householder Nonfamily || Female householder and male partner: 23,438 | Husband/Wife No Wife No Husband Households || With related children under 18 years 6,326 | || With own children under 18 years 6,079 | Total: 342,518 31,096 70,391 321,522 || No own children under 18 years 247 | With no children under 18 183,302 14,284 25,980 319,360 || No related children under 18 years 17,112 | With one child under 18 64,669 9,687 24,176 1,603 || | With two children under 18 66,496 4,933 13,450 440 || All other households: 363,356 47.5 | With three children under 18 20,289 1,539 4,601 89 ||______________________________________________________________| With four or more children under 18 7,762 653 2,184 30 || | ||P33. HOUSEHOLD TYPE FOR THE POPULATION UNDER 18 YEARS IN | * "Families" do not include same-sex married couples even if the marriage was || HOUSEHOLDS (**) | performed in a state issuing marriage certificates for same-sex couples. ||Universe: Population under 18 years in households excluding |____________________________________________________________________________________|| householders, spouses, and unmarried partners | || | ||Total: 398,069 100.0 | ** Same-sex couple households are included in the family households category || In family households: 395,186 99.3 | if there is at least one additional person related to the householder by || In husband-wife families 293,422 | birth or adoption. Same-sex couple households with no relatives of the || In other families: 101,764 | householder present are tabulated in nonfamily households. Responses of || Male householder, no spouse present 27,091 | "same-sex spouse" were edited during processing to "unmarried partner." || Female householder, no spouse present 74,673 | || | || In nonfamily households 2,883 0.7 | |+===================================================================================================================================================+Source: Census 2010 Summary File 1 [machine-readable data file]/Prepared by the U.S.Census Bureau, 2011. 06NOV12 Page 6 Prepared by: Washington State Office of Financial Management, Forecasting Division.
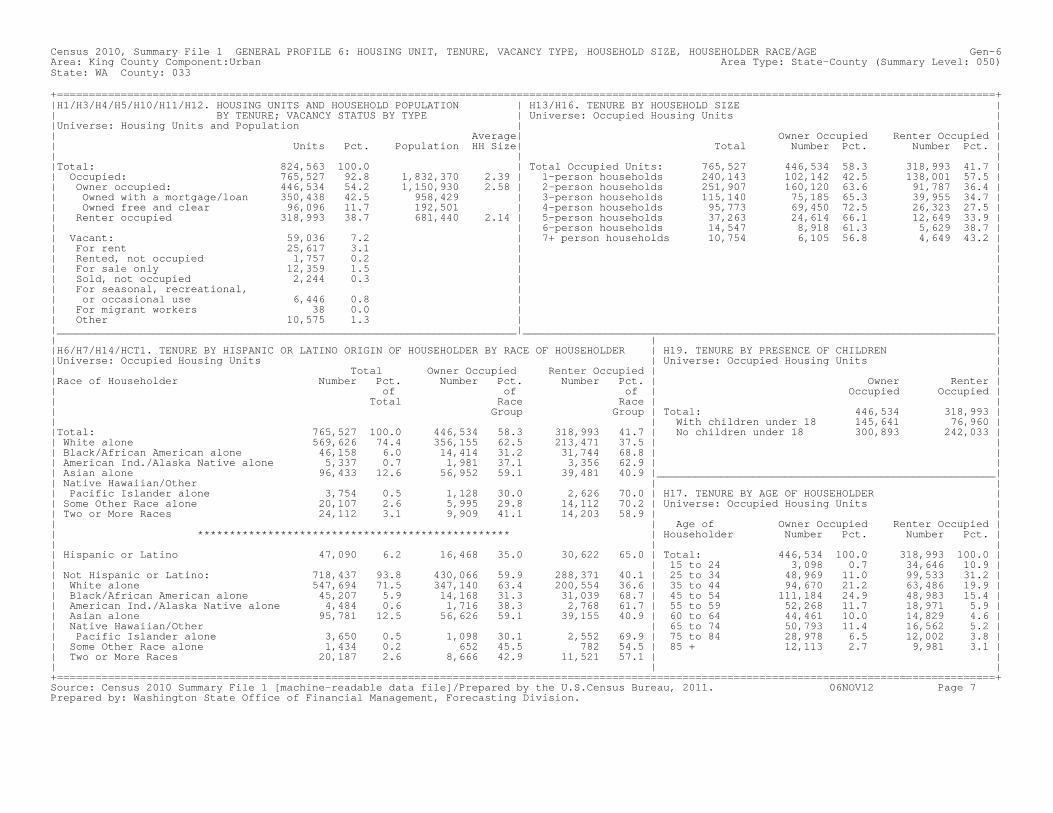
Census 2010, Summary File 1 GENERAL PROFILE 6: HOUSING UNIT, TENURE, VACANCY TYPE, HOUSEHOLD SIZE, HOUSEHOLDER RACE/AGE Gen-6Area: King County Component:Urban Area Type: State-County (Summary Level: 050)State: WA County: 033 +===================================================================================================================================================+|H1/H3/H4/H5/H10/H11/H12. HOUSING UNITS AND HOUSEHOLD POPULATION | H13/H16. TENURE BY HOUSEHOLD SIZE || BY TENURE; VACANCY STATUS BY TYPE | Universe: Occupied Housing Units ||Universe: Housing Units and Population | || Average| Owner Occupied Renter Occupied || Units Pct. Population HH Size| Total Number Pct. Number Pct. || | ||Total: 824,563 100.0 | Total Occupied Units: 765,527 446,534 58.3 318,993 41.7 || Occupied: 765,527 92.8 1,832,370 2.39 | 1-person households 240,143 102,142 42.5 138,001 57.5 || Owner occupied: 446,534 54.2 1,150,930 2.58 | 2-person households 251,907 160,120 63.6 91,787 36.4 || Owned with a mortgage/loan 350,438 42.5 958,429 | 3-person households 115,140 75,185 65.3 39,955 34.7 || Owned free and clear 96,096 11.7 192,501 | 4-person households 95,773 69,450 72.5 26,323 27.5 || Renter occupied 318,993 38.7 681,440 2.14 | 5-person households 37,263 24,614 66.1 12,649 33.9 || | 6-person households 14,547 8,918 61.3 5,629 38.7 || Vacant: 59,036 7.2 | 7+ person households 10,754 6,105 56.8 4,649 43.2 || For rent 25,617 3.1 | || Rented, not occupied 1,757 0.2 | || For sale only 12,359 1.5 | || Sold, not occupied 2,244 0.3 | || For seasonal, recreational, | || or occasional use 6,446 0.8 | || For migrant workers 38 0.0 | || Other 10,575 1.3 | ||________________________________________________________________________|__________________________________________________________________________|| | ||H6/H7/H14/HCT1. TENURE BY HISPANIC OR LATINO ORIGIN OF HOUSEHOLDER BY RACE OF HOUSEHOLDER | H19. TENURE BY PRESENCE OF CHILDREN ||Universe: Occupied Housing Units | Universe: Occupied Housing Units || Total Owner Occupied Renter Occupied | ||Race of Householder Number Pct. Number Pct. Number Pct. | Owner Renter || of of of | Occupied Occupied || Total Race Race | || Group Group | Total: 446,534 318,993 || | With children under 18 145,641 76,960 ||Total: 765,527 100.0 446,534 58.3 318,993 41.7 | No children under 18 300,893 242,033 || White alone 569,626 74.4 356,155 62.5 213,471 37.5 | || Black/African American alone 46,158 6.0 14,414 31.2 31,744 68.8 | || American Ind./Alaska Native alone 5,337 0.7 1,981 37.1 3,356 62.9 | || Asian alone 96,433 12.6 56,952 59.1 39,481 40.9 |_____________________________________________________|| Native Hawaiian/Other | || Pacific Islander alone 3,754 0.5 1,128 30.0 2,626 70.0 | H17. TENURE BY AGE OF HOUSEHOLDER || Some Other Race alone 20,107 2.6 5,995 29.8 14,112 70.2 | Universe: Occupied Housing Units || Two or More Races 24,112 3.1 9,909 41.1 14,203 58.9 | || | Age of Owner Occupied Renter Occupied || ************************************************* | Householder Number Pct. Number Pct. || | || Hispanic or Latino 47,090 6.2 16,468 35.0 30,622 65.0 | Total: 446,534 100.0 318,993 100.0 || | 15 to 24 3,098 0.7 34,646 10.9 || Not Hispanic or Latino: 718,437 93.8 430,066 59.9 288,371 40.1 | 25 to 34 48,969 11.0 99,533 31.2 || White alone 547,694 71.5 347,140 63.4 200,554 36.6 | 35 to 44 94,670 21.2 63,486 19.9 || Black/African American alone 45,207 5.9 14,168 31.3 31,039 68.7 | 45 to 54 111,184 24.9 48,983 15.4 || American Ind./Alaska Native alone 4,484 0.6 1,716 38.3 2,768 61.7 | 55 to 59 52,268 11.7 18,971 5.9 || Asian alone 95,781 12.5 56,626 59.1 39,155 40.9 | 60 to 64 44,461 10.0 14,829 4.6 || Native Hawaiian/Other | 65 to 74 50,793 11.4 16,562 5.2 || Pacific Islander alone 3,650 0.5 1,098 30.1 2,552 69.9 | 75 to 84 28,978 6.5 12,002 3.8 || Some Other Race alone 1,434 0.2 652 45.5 782 54.5 | 85 + 12,113 2.7 9,981 3.1 || Two or More Races 20,187 2.6 8,666 42.9 11,521 57.1 | || | |+===================================================================================================================================================+Source: Census 2010 Summary File 1 [machine-readable data file]/Prepared by the U.S.Census Bureau, 2011. 06NOV12 Page 7 Prepared by: Washington State Office of Financial Management, Forecasting Division.
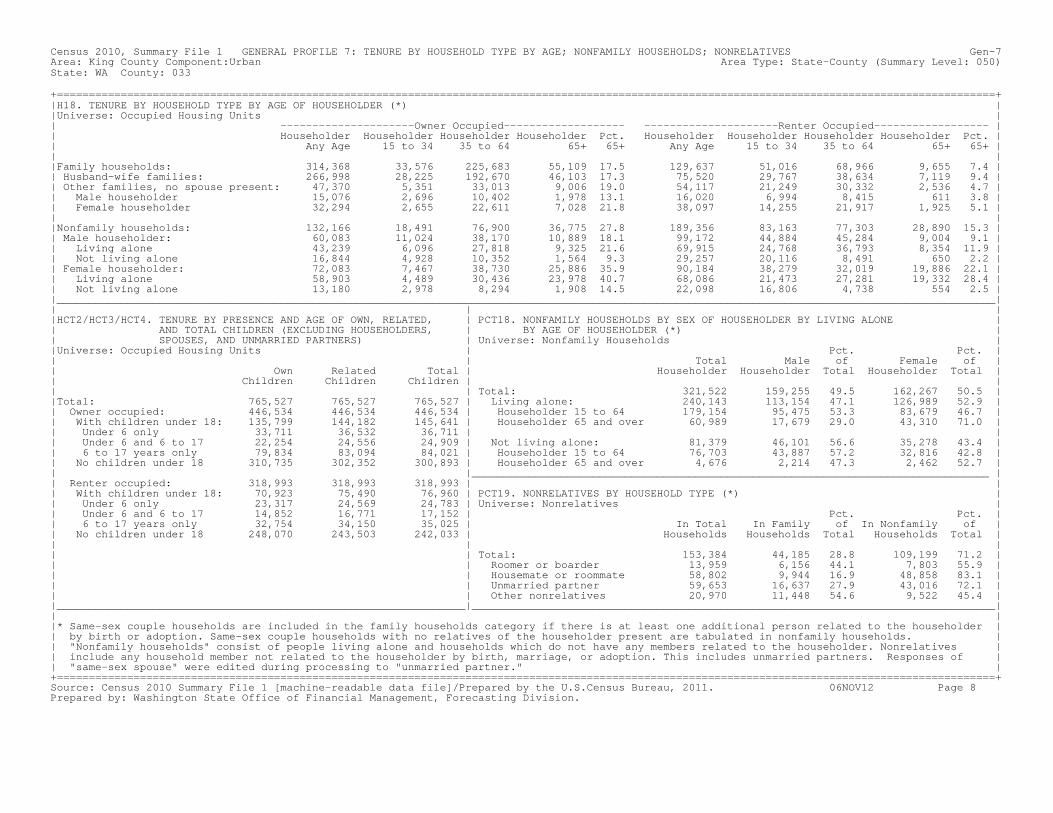
Census 2010, Summary File 1 GENERAL PROFILE 7: TENURE BY HOUSEHOLD TYPE BY AGE; NONFAMILY HOUSEHOLDS; NONRELATIVES Gen-7Area: King County Component:Urban Area Type: State-County (Summary Level: 050)State: WA County: 033 +===================================================================================================================================================+|H18. TENURE BY HOUSEHOLD TYPE BY AGE OF HOUSEHOLDER (*) ||Universe: Occupied Housing Units || ---------------------Owner Occupied------------------- ---------------------Renter Occupied------------------ || Householder Householder Householder Householder Pct. Householder Householder Householder Householder Pct. || Any Age 15 to 34 35 to 64 65+ 65+ Any Age 15 to 34 35 to 64 65+ 65+ || ||Family households: 314,368 33,576 225,683 55,109 17.5 129,637 51,016 68,966 9,655 7.4 || Husband-wife families: 266,998 28,225 192,670 46,103 17.3 75,520 29,767 38,634 7,119 9.4 || Other families, no spouse present: 47,370 5,351 33,013 9,006 19.0 54,117 21,249 30,332 2,536 4.7 || Male householder 15,076 2,696 10,402 1,978 13.1 16,020 6,994 8,415 611 3.8 || Female householder 32,294 2,655 22,611 7,028 21.8 38,097 14,255 21,917 1,925 5.1 || ||Nonfamily households: 132,166 18,491 76,900 36,775 27.8 189,356 83,163 77,303 28,890 15.3 || Male householder: 60,083 11,024 38,170 10,889 18.1 99,172 44,884 45,284 9,004 9.1 || Living alone 43,239 6,096 27,818 9,325 21.6 69,915 24,768 36,793 8,354 11.9 || Not living alone 16,844 4,928 10,352 1,564 9.3 29,257 20,116 8,491 650 2.2 || Female householder: 72,083 7,467 38,730 25,886 35.9 90,184 38,279 32,019 19,886 22.1 || Living alone 58,903 4,489 30,436 23,978 40.7 68,086 21,473 27,281 19,332 28.4 || Not living alone 13,180 2,978 8,294 1,908 14.5 22,098 16,806 4,738 554 2.5 ||___________________________________________________________________________________________________________________________________________________|| | ||HCT2/HCT3/HCT4. TENURE BY PRESENCE AND AGE OF OWN, RELATED, | PCT18. NONFAMILY HOUSEHOLDS BY SEX OF HOUSEHOLDER BY LIVING ALONE || AND TOTAL CHILDREN (EXCLUDING HOUSEHOLDERS, | BY AGE OF HOUSEHOLDER (*) || SPOUSES, AND UNMARRIED PARTNERS) | Universe: Nonfamily Households ||Universe: Occupied Housing Units | Pct. Pct. || | Total Male of Female of || Own Related Total | Householder Householder Total Householder Total || Children Children Children | || | Total: 321,522 159,255 49.5 162,267 50.5 ||Total: 765,527 765,527 765,527 | Living alone: 240,143 113,154 47.1 126,989 52.9 || Owner occupied: 446,534 446,534 446,534 | Householder 15 to 64 179,154 95,475 53.3 83,679 46.7 || With children under 18: 135,799 144,182 145,641 | Householder 65 and over 60,989 17,679 29.0 43,310 71.0 || Under 6 only 33,711 36,532 36,711 | || Under 6 and 6 to 17 22,254 24,556 24,909 | Not living alone: 81,379 46,101 56.6 35,278 43.4 || 6 to 17 years only 79,834 83,094 84,021 | Householder 15 to 64 76,703 43,887 57.2 32,816 42.8 || No children under 18 310,735 302,352 300,893 | Householder 65 and over 4,676 2,214 47.3 2,462 52.7 || |_________________________________________________________________________________ || Renter occupied: 318,993 318,993 318,993 | || With children under 18: 70,923 75,490 76,960 | PCT19. NONRELATIVES BY HOUSEHOLD TYPE (*) || Under 6 only 23,317 24,569 24,783 | Universe: Nonrelatives || Under 6 and 6 to 17 14,852 16,771 17,152 | Pct. Pct. || 6 to 17 years only 32,754 34,150 35,025 | In Total In Family of In Nonfamily of || No children under 18 248,070 243,503 242,033 | Households Households Total Households Total || | || | Total: 153,384 44,185 28.8 109,199 71.2 || | Roomer or boarder 13,959 6,156 44.1 7,803 55.9 || | Housemate or roommate 58,802 9,944 16.9 48,858 83.1 || | Unmarried partner 59,653 16,637 27.9 43,016 72.1 || | Other nonrelatives 20,970 11,448 54.6 9,522 45.4 ||________________________________________________________________|__________________________________________________________________________________|| ||* Same-sex couple households are included in the family households category if there is at least one additional person related to the householder || by birth or adoption. Same-sex couple households with no relatives of the householder present are tabulated in nonfamily households. || "Nonfamily households" consist of people living alone and households which do not have any members related to the householder. Nonrelatives || include any household member not related to the householder by birth, marriage, or adoption. This includes unmarried partners. Responses of || "same-sex spouse" were edited during processing to "unmarried partner." |+===================================================================================================================================================+Source: Census 2010 Summary File 1 [machine-readable data file]/Prepared by the U.S.Census Bureau, 2011. 06NOV12 Page 8 Prepared by: Washington State Office of Financial Management, Forecasting Division.

Census 2010, Summary File 1 GENERAL PROFILE 8: GROUP QUARTERS POPULATION BY SEX BY AGE BY DETAILED TYPE Gen-8Area: King County Component:Urban Area Type: State-County (Summary Level: 050)State: WA County: 033 +===================================================================================================================================================+|PCT20/PCT21. GROUP QUARTERS POPULATION BY SEX BY AGE BY GROUP QUARTERS TYPE ||Universe: Population in Group Quarters | || Total 18 to 64 65 & Over | Total 18 to 64 65 & Over || | ||Total: 36,941 27,999 7,479 |Male: 19,829 16,653 2,324 || | || Institutionalized population: 10,398 5,049 4,834 | Institutionalized population: 5,727 3,925 1,444 || Correctional facilities for adults: 3,713 3,662 26 | Correctional facilities for adults: 3,224 3,176 25 || Federal detention centers 831 821 10 | Federal detention centers 688 679 9 || Federal prisons 0 0 0 | Federal prisons 0 0 0 || State prisons 0 0 0 | State prisons 0 0 0 || Local jails and other municipal | Local jails and other municipal || confinement facilities 2,418 2,377 16 | confinement facilities 2,150 2,111 16 || Correctional residential facilities 464 464 0 | Correctional residential facilities 386 386 0 || Military disciplinary barracks & jails 0 0 0 | Military disciplinary barracks & jails 0 0 0 || | || Juvenile facilities: 539 53 0 | Juvenile facilities: 364 31 0 || Group homes for juveniles | Group homes for juveniles || (non-correctional) 89 17 0 | (non-correctional) 52 9 0 || Residential treatment centers for | Residential treatment centers for || juveniles (non-correctional) 210 24 0 | juveniles (non-correctional) 142 17 0 || Correctional facilities intended for | Correctional facilities intended for || juveniles 240 12 0 | juveniles 170 5 0 || | || Nursing facilities/Skilled-nursing fac. 5,934 1,257 4,677 | Nursing facilities/Skilled-nursing fac. 2,023 663 1,360 || | || Other institutional facilities: 212 77 131 | Other institutional facilities: 116 55 59 || Mental (Psychiatric) hospitals and | Mental (Psychiatric) hospitals and || psychiatric units in other hospitals 87 52 33 | psychiatric units in other hospitals 46 36 10 || Hospitals with patients who have no | Hospitals with patients who have no || usual home elsewhere 8 2 4 | usual home elsewhere 6 0 4 || In-patient hospice facilities 117 23 94 | In-patient hospice facilities 64 19 45 || Military treatment facilities with | Military treatment facilities with || assigned patients 0 0 0 | assigned patients 0 0 0 || Residential schools for people with | Residential schools for people with || disabilities 0 0 0 | disabilities 0 0 0 || | || Noninstitutionalized population: 26,543 22,950 2,645 | Noninstitutionalized population: 14,102 12,728 880 || College/University student housing 12,243 12,171 0 | College/University student housing 5,497 5,467 0 || | || Military quarters: 362 362 0 | Military quarters: 304 304 0 || Military barracks and dormitories | Military barracks and dormitories || (non-disciplinary) 0 0 0 | (non-disciplinary) 0 0 0 || Military ships 362 362 0 | Military ships 304 304 0 || | || Other noninstitutional facilities: 13,938 10,417 2,645 | Other noninstitutional facilities: 8,301 6,957 880 || Emergency and transitional shelters | Emergency and transitional shelters || (with sleeping facilities) for people | (with sleeping facilities) for people || experiencing homelessness 3,085 2,588 136 | experiencing homelessness 2,088 1,810 98 || Group homes intended for adults 4,720 2,892 1,786 | Group homes intended for adults 2,179 1,624 531 || Residential treatment centers, adults 985 908 71 | Residential treatment centers, adults 584 555 26 || Maritime/merchant vessels 307 305 2 | Maritime/merchant vessels 277 275 2 || Workers group living quarters and | Workers group living quarters and || Job Corps centers 994 531 329 | Job Corps centers 481 317 90 || Other noninstitutional facilities 3,847 3,193 321 | Other noninstitutional facilities 2,692 2,376 133 || | |+===================================================================================================================================================+Source: Census 2010 Summary File 1 [machine-readable data file]/Prepared by the U.S.Census Bureau, 2011. 06NOV12 Page 9 Prepared by: Washington State Office of Financial Management, Forecasting Division.
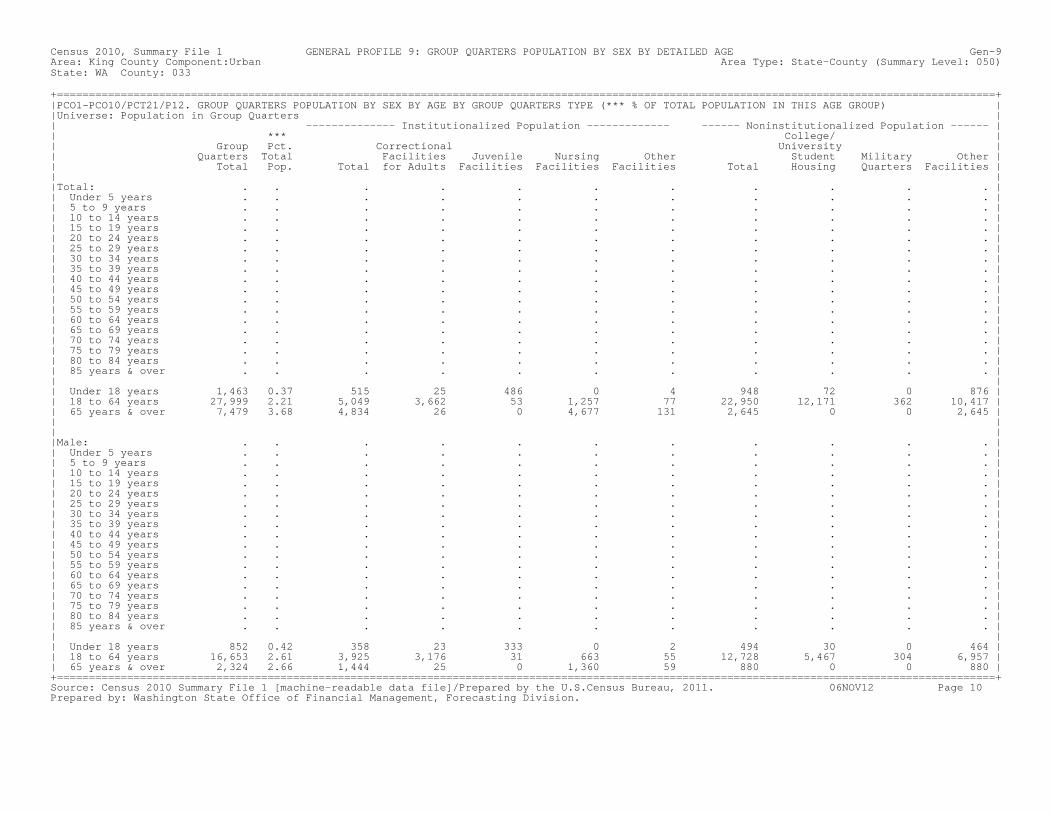
Census 2010, Summary File 1 GENERAL PROFILE 9: GROUP QUARTERS POPULATION BY SEX BY DETAILED AGE Gen-9Area: King County Component:Urban Area Type: State-County (Summary Level: 050)State: WA County: 033 +===================================================================================================================================================+|PCO1-PCO10/PCT21/P12. GROUP QUARTERS POPULATION BY SEX BY AGE BY GROUP QUARTERS TYPE (*** % OF TOTAL POPULATION IN THIS AGE GROUP) ||Universe: Population in Group Quarters || -------------- Institutionalized Population ------------- ------ Noninstitutionalized Population ------ || *** College/ || Group Pct. Correctional University || Quarters Total Facilities Juvenile Nursing Other Student Military Other || Total Pop. Total for Adults Facilities Facilities Facilities Total Housing Quarters Facilities || ||Total: . . . . . . . . . . . || Under 5 years . . . . . . . . . . . || 5 to 9 years . . . . . . . . . . . || 10 to 14 years . . . . . . . . . . . || 15 to 19 years . . . . . . . . . . . || 20 to 24 years . . . . . . . . . . . || 25 to 29 years . . . . . . . . . . . || 30 to 34 years . . . . . . . . . . . || 35 to 39 years . . . . . . . . . . . || 40 to 44 years . . . . . . . . . . . || 45 to 49 years . . . . . . . . . . . || 50 to 54 years . . . . . . . . . . . || 55 to 59 years . . . . . . . . . . . || 60 to 64 years . . . . . . . . . . . || 65 to 69 years . . . . . . . . . . . || 70 to 74 years . . . . . . . . . . . || 75 to 79 years . . . . . . . . . . . || 80 to 84 years . . . . . . . . . . . || 85 years & over . . . . . . . . . . . || || Under 18 years 1,463 0.37 515 25 486 0 4 948 72 0 876 || 18 to 64 years 27,999 2.21 5,049 3,662 53 1,257 77 22,950 12,171 362 10,417 || 65 years & over 7,479 3.68 4,834 26 0 4,677 131 2,645 0 0 2,645 || || ||Male: . . . . . . . . . . . || Under 5 years . . . . . . . . . . . || 5 to 9 years . . . . . . . . . . . || 10 to 14 years . . . . . . . . . . . || 15 to 19 years . . . . . . . . . . . || 20 to 24 years . . . . . . . . . . . || 25 to 29 years . . . . . . . . . . . || 30 to 34 years . . . . . . . . . . . || 35 to 39 years . . . . . . . . . . . || 40 to 44 years . . . . . . . . . . . || 45 to 49 years . . . . . . . . . . . || 50 to 54 years . . . . . . . . . . . || 55 to 59 years . . . . . . . . . . . || 60 to 64 years . . . . . . . . . . . || 65 to 69 years . . . . . . . . . . . || 70 to 74 years . . . . . . . . . . . || 75 to 79 years . . . . . . . . . . . || 80 to 84 years . . . . . . . . . . . || 85 years & over . . . . . . . . . . . || || Under 18 years 852 0.42 358 23 333 0 2 494 30 0 464 || 18 to 64 years 16,653 2.61 3,925 3,176 31 663 55 12,728 5,467 304 6,957 || 65 years & over 2,324 2.66 1,444 25 0 1,360 59 880 0 0 880 |+===================================================================================================================================================+Source: Census 2010 Summary File 1 [machine-readable data file]/Prepared by the U.S.Census Bureau, 2011. 06NOV12 Page 10 Prepared by: Washington State Office of Financial Management, Forecasting Division.
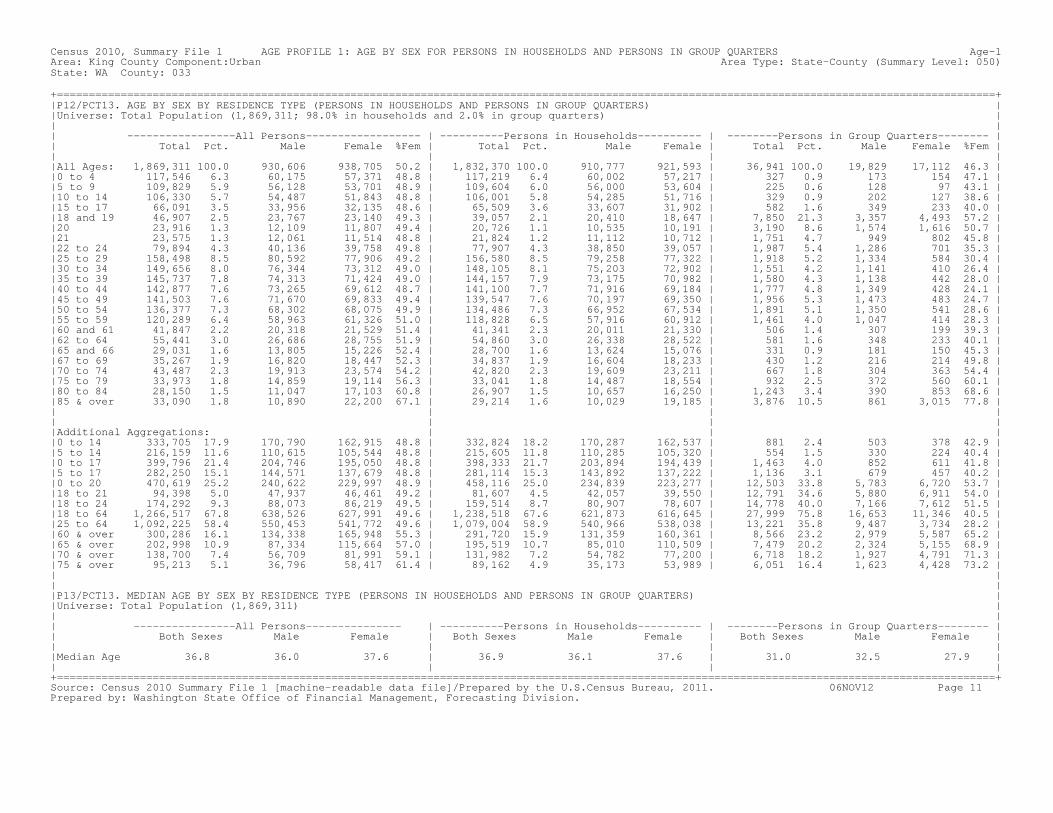
Census 2010, Summary File 1 AGE PROFILE 1: AGE BY SEX FOR PERSONS IN HOUSEHOLDS AND PERSONS IN GROUP QUARTERS Age-1Area: King County Component:Urban Area Type: State-County (Summary Level: 050)State: WA County: 033 +===================================================================================================================================================+|P12/PCT13. AGE BY SEX BY RESIDENCE TYPE (PERSONS IN HOUSEHOLDS AND PERSONS IN GROUP QUARTERS) ||Universe: Total Population (1,869,311; 98.0% in households and 2.0% in group quarters) || || -----------------All Persons------------------ | ----------Persons in Households---------- | --------Persons in Group Quarters-------- || Total Pct. Male Female %Fem | Total Pct. Male Female | Total Pct. Male Female %Fem || | | ||All Ages: 1,869,311 100.0 930,606 938,705 50.2 | 1,832,370 100.0 910,777 921,593 | 36,941 100.0 19,829 17,112 46.3 ||0 to 4 117,546 6.3 60,175 57,371 48.8 | 117,219 6.4 60,002 57,217 | 327 0.9 173 154 47.1 ||5 to 9 109,829 5.9 56,128 53,701 48.9 | 109,604 6.0 56,000 53,604 | 225 0.6 128 97 43.1 ||10 to 14 106,330 5.7 54,487 51,843 48.8 | 106,001 5.8 54,285 51,716 | 329 0.9 202 127 38.6 ||15 to 17 66,091 3.5 33,956 32,135 48.6 | 65,509 3.6 33,607 31,902 | 582 1.6 349 233 40.0 ||18 and 19 46,907 2.5 23,767 23,140 49.3 | 39,057 2.1 20,410 18,647 | 7,850 21.3 3,357 4,493 57.2 ||20 23,916 1.3 12,109 11,807 49.4 | 20,726 1.1 10,535 10,191 | 3,190 8.6 1,574 1,616 50.7 ||21 23,575 1.3 12,061 11,514 48.8 | 21,824 1.2 11,112 10,712 | 1,751 4.7 949 802 45.8 ||22 to 24 79,894 4.3 40,136 39,758 49.8 | 77,907 4.3 38,850 39,057 | 1,987 5.4 1,286 701 35.3 ||25 to 29 158,498 8.5 80,592 77,906 49.2 | 156,580 8.5 79,258 77,322 | 1,918 5.2 1,334 584 30.4 ||30 to 34 149,656 8.0 76,344 73,312 49.0 | 148,105 8.1 75,203 72,902 | 1,551 4.2 1,141 410 26.4 ||35 to 39 145,737 7.8 74,313 71,424 49.0 | 144,157 7.9 73,175 70,982 | 1,580 4.3 1,138 442 28.0 ||40 to 44 142,877 7.6 73,265 69,612 48.7 | 141,100 7.7 71,916 69,184 | 1,777 4.8 1,349 428 24.1 ||45 to 49 141,503 7.6 71,670 69,833 49.4 | 139,547 7.6 70,197 69,350 | 1,956 5.3 1,473 483 24.7 ||50 to 54 136,377 7.3 68,302 68,075 49.9 | 134,486 7.3 66,952 67,534 | 1,891 5.1 1,350 541 28.6 ||55 to 59 120,289 6.4 58,963 61,326 51.0 | 118,828 6.5 57,916 60,912 | 1,461 4.0 1,047 414 28.3 ||60 and 61 41,847 2.2 20,318 21,529 51.4 | 41,341 2.3 20,011 21,330 | 506 1.4 307 199 39.3 ||62 to 64 55,441 3.0 26,686 28,755 51.9 | 54,860 3.0 26,338 28,522 | 581 1.6 348 233 40.1 ||65 and 66 29,031 1.6 13,805 15,226 52.4 | 28,700 1.6 13,624 15,076 | 331 0.9 181 150 45.3 ||67 to 69 35,267 1.9 16,820 18,447 52.3 | 34,837 1.9 16,604 18,233 | 430 1.2 216 214 49.8 ||70 to 74 43,487 2.3 19,913 23,574 54.2 | 42,820 2.3 19,609 23,211 | 667 1.8 304 363 54.4 ||75 to 79 33,973 1.8 14,859 19,114 56.3 | 33,041 1.8 14,487 18,554 | 932 2.5 372 560 60.1 ||80 to 84 28,150 1.5 11,047 17,103 60.8 | 26,907 1.5 10,657 16,250 | 1,243 3.4 390 853 68.6 ||85 & over 33,090 1.8 10,890 22,200 67.1 | 29,214 1.6 10,029 19,185 | 3,876 10.5 861 3,015 77.8 || | | || | | ||Additional Aggregations: | | ||0 to 14 333,705 17.9 170,790 162,915 48.8 | 332,824 18.2 170,287 162,537 | 881 2.4 503 378 42.9 ||5 to 14 216,159 11.6 110,615 105,544 48.8 | 215,605 11.8 110,285 105,320 | 554 1.5 330 224 40.4 ||0 to 17 399,796 21.4 204,746 195,050 48.8 | 398,333 21.7 203,894 194,439 | 1,463 4.0 852 611 41.8 ||5 to 17 282,250 15.1 144,571 137,679 48.8 | 281,114 15.3 143,892 137,222 | 1,136 3.1 679 457 40.2 ||0 to 20 470,619 25.2 240,622 229,997 48.9 | 458,116 25.0 234,839 223,277 | 12,503 33.8 5,783 6,720 53.7 ||18 to 21 94,398 5.0 47,937 46,461 49.2 | 81,607 4.5 42,057 39,550 | 12,791 34.6 5,880 6,911 54.0 ||18 to 24 174,292 9.3 88,073 86,219 49.5 | 159,514 8.7 80,907 78,607 | 14,778 40.0 7,166 7,612 51.5 ||18 to 64 1,266,517 67.8 638,526 627,991 49.6 | 1,238,518 67.6 621,873 616,645 | 27,999 75.8 16,653 11,346 40.5 ||25 to 64 1,092,225 58.4 550,453 541,772 49.6 | 1,079,004 58.9 540,966 538,038 | 13,221 35.8 9,487 3,734 28.2 ||60 & over 300,286 16.1 134,338 165,948 55.3 | 291,720 15.9 131,359 160,361 | 8,566 23.2 2,979 5,587 65.2 ||65 & over 202,998 10.9 87,334 115,664 57.0 | 195,519 10.7 85,010 110,509 | 7,479 20.2 2,324 5,155 68.9 ||70 & over 138,700 7.4 56,709 81,991 59.1 | 131,982 7.2 54,782 77,200 | 6,718 18.2 1,927 4,791 71.3 ||75 & over 95,213 5.1 36,796 58,417 61.4 | 89,162 4.9 35,173 53,989 | 6,051 16.4 1,623 4,428 73.2 || || ||P13/PCT13. MEDIAN AGE BY SEX BY RESIDENCE TYPE (PERSONS IN HOUSEHOLDS AND PERSONS IN GROUP QUARTERS) ||Universe: Total Population (1,869,311) || || ----------------All Persons--------------- | ----------Persons in Households---------- | --------Persons in Group Quarters-------- || Both Sexes Male Female | Both Sexes Male Female | Both Sexes Male Female || | | ||Median Age 36.8 36.0 37.6 | 36.9 36.1 37.6 | 31.0 32.5 27.9 || | | |+===================================================================================================================================================+Source: Census 2010 Summary File 1 [machine-readable data file]/Prepared by the U.S.Census Bureau, 2011. 06NOV12 Page 11 Prepared by: Washington State Office of Financial Management, Forecasting Division.
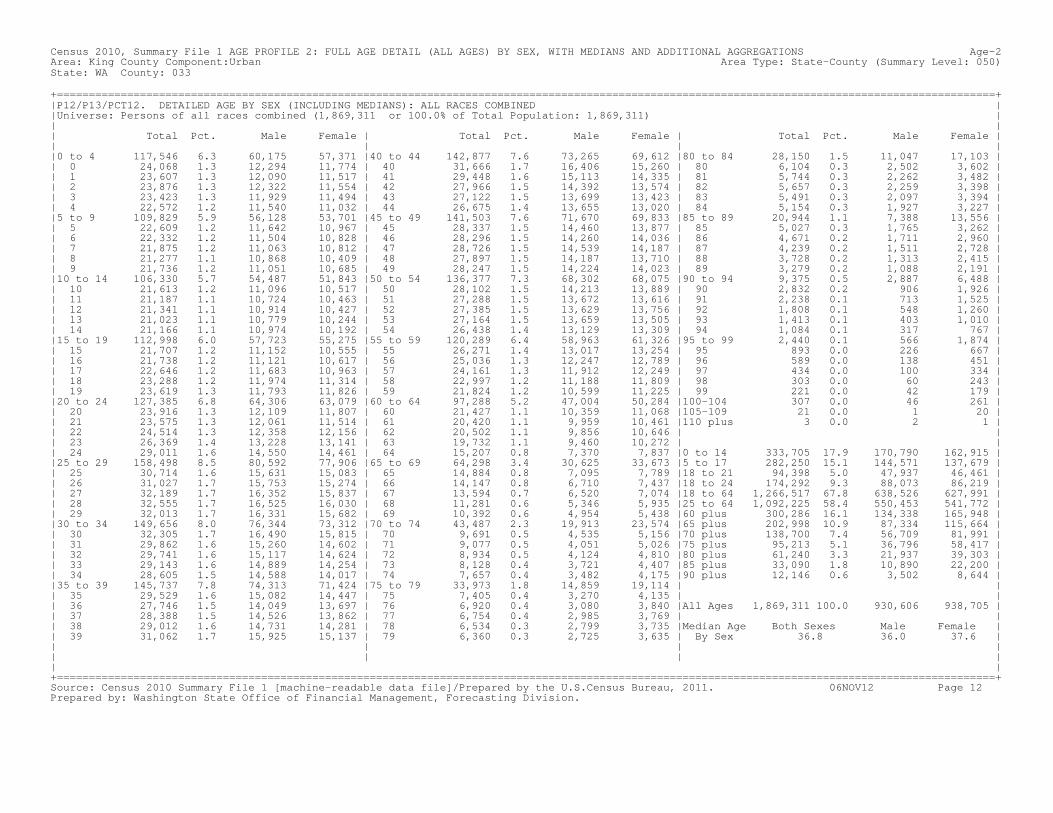
Census 2010, Summary File 1 AGE PROFILE 2: FULL AGE DETAIL (ALL AGES) BY SEX, WITH MEDIANS AND ADDITIONAL AGGREGATIONS Age-2Area: King County Component:Urban Area Type: State-County (Summary Level: 050)State: WA County: 033 +===================================================================================================================================================+|P12/P13/PCT12. DETAILED AGE BY SEX (INCLUDING MEDIANS): ALL RACES COMBINED ||Universe: Persons of all races combined (1,869,311 or 100.0% of Total Population: 1,869,311) || || Total Pct. Male Female | Total Pct. Male Female | Total Pct. Male Female || | | ||0 to 4 117,546 6.3 60,175 57,371 |40 to 44 142,877 7.6 73,265 69,612 |80 to 84 28,150 1.5 11,047 17,103 || 0 24,068 1.3 12,294 11,774 | 40 31,666 1.7 16,406 15,260 | 80 6,104 0.3 2,502 3,602 || 1 23,607 1.3 12,090 11,517 | 41 29,448 1.6 15,113 14,335 | 81 5,744 0.3 2,262 3,482 || 2 23,876 1.3 12,322 11,554 | 42 27,966 1.5 14,392 13,574 | 82 5,657 0.3 2,259 3,398 || 3 23,423 1.3 11,929 11,494 | 43 27,122 1.5 13,699 13,423 | 83 5,491 0.3 2,097 3,394 || 4 22,572 1.2 11,540 11,032 | 44 26,675 1.4 13,655 13,020 | 84 5,154 0.3 1,927 3,227 ||5 to 9 109,829 5.9 56,128 53,701 |45 to 49 141,503 7.6 71,670 69,833 |85 to 89 20,944 1.1 7,388 13,556 || 5 22,609 1.2 11,642 10,967 | 45 28,337 1.5 14,460 13,877 | 85 5,027 0.3 1,765 3,262 || 6 22,332 1.2 11,504 10,828 | 46 28,296 1.5 14,260 14,036 | 86 4,671 0.2 1,711 2,960 || 7 21,875 1.2 11,063 10,812 | 47 28,726 1.5 14,539 14,187 | 87 4,239 0.2 1,511 2,728 || 8 21,277 1.1 10,868 10,409 | 48 27,897 1.5 14,187 13,710 | 88 3,728 0.2 1,313 2,415 || 9 21,736 1.2 11,051 10,685 | 49 28,247 1.5 14,224 14,023 | 89 3,279 0.2 1,088 2,191 ||10 to 14 106,330 5.7 54,487 51,843 |50 to 54 136,377 7.3 68,302 68,075 |90 to 94 9,375 0.5 2,887 6,488 || 10 21,613 1.2 11,096 10,517 | 50 28,102 1.5 14,213 13,889 | 90 2,832 0.2 906 1,926 || 11 21,187 1.1 10,724 10,463 | 51 27,288 1.5 13,672 13,616 | 91 2,238 0.1 713 1,525 || 12 21,341 1.1 10,914 10,427 | 52 27,385 1.5 13,629 13,756 | 92 1,808 0.1 548 1,260 || 13 21,023 1.1 10,779 10,244 | 53 27,164 1.5 13,659 13,505 | 93 1,413 0.1 403 1,010 || 14 21,166 1.1 10,974 10,192 | 54 26,438 1.4 13,129 13,309 | 94 1,084 0.1 317 767 ||15 to 19 112,998 6.0 57,723 55,275 |55 to 59 120,289 6.4 58,963 61,326 |95 to 99 2,440 0.1 566 1,874 || 15 21,707 1.2 11,152 10,555 | 55 26,271 1.4 13,017 13,254 | 95 893 0.0 226 667 || 16 21,738 1.2 11,121 10,617 | 56 25,036 1.3 12,247 12,789 | 96 589 0.0 138 451 || 17 22,646 1.2 11,683 10,963 | 57 24,161 1.3 11,912 12,249 | 97 434 0.0 100 334 || 18 23,288 1.2 11,974 11,314 | 58 22,997 1.2 11,188 11,809 | 98 303 0.0 60 243 || 19 23,619 1.3 11,793 11,826 | 59 21,824 1.2 10,599 11,225 | 99 221 0.0 42 179 ||20 to 24 127,385 6.8 64,306 63,079 |60 to 64 97,288 5.2 47,004 50,284 |100-104 307 0.0 46 261 || 20 23,916 1.3 12,109 11,807 | 60 21,427 1.1 10,359 11,068 |105-109 21 0.0 1 20 || 21 23,575 1.3 12,061 11,514 | 61 20,420 1.1 9,959 10,461 |110 plus 3 0.0 2 1 || 22 24,514 1.3 12,358 12,156 | 62 20,502 1.1 9,856 10,646 | || 23 26,369 1.4 13,228 13,141 | 63 19,732 1.1 9,460 10,272 | || 24 29,011 1.6 14,550 14,461 | 64 15,207 0.8 7,370 7,837 |0 to 14 333,705 17.9 170,790 162,915 ||25 to 29 158,498 8.5 80,592 77,906 |65 to 69 64,298 3.4 30,625 33,673 |5 to 17 282,250 15.1 144,571 137,679 || 25 30,714 1.6 15,631 15,083 | 65 14,884 0.8 7,095 7,789 |18 to 21 94,398 5.0 47,937 46,461 || 26 31,027 1.7 15,753 15,274 | 66 14,147 0.8 6,710 7,437 |18 to 24 174,292 9.3 88,073 86,219 || 27 32,189 1.7 16,352 15,837 | 67 13,594 0.7 6,520 7,074 |18 to 64 1,266,517 67.8 638,526 627,991 || 28 32,555 1.7 16,525 16,030 | 68 11,281 0.6 5,346 5,935 |25 to 64 1,092,225 58.4 550,453 541,772 || 29 32,013 1.7 16,331 15,682 | 69 10,392 0.6 4,954 5,438 |60 plus 300,286 16.1 134,338 165,948 ||30 to 34 149,656 8.0 76,344 73,312 |70 to 74 43,487 2.3 19,913 23,574 |65 plus 202,998 10.9 87,334 115,664 || 30 32,305 1.7 16,490 15,815 | 70 9,691 0.5 4,535 5,156 |70 plus 138,700 7.4 56,709 81,991 || 31 29,862 1.6 15,260 14,602 | 71 9,077 0.5 4,051 5,026 |75 plus 95,213 5.1 36,796 58,417 || 32 29,741 1.6 15,117 14,624 | 72 8,934 0.5 4,124 4,810 |80 plus 61,240 3.3 21,937 39,303 || 33 29,143 1.6 14,889 14,254 | 73 8,128 0.4 3,721 4,407 |85 plus 33,090 1.8 10,890 22,200 || 34 28,605 1.5 14,588 14,017 | 74 7,657 0.4 3,482 4,175 |90 plus 12,146 0.6 3,502 8,644 ||35 to 39 145,737 7.8 74,313 71,424 |75 to 79 33,973 1.8 14,859 19,114 | || 35 29,529 1.6 15,082 14,447 | 75 7,405 0.4 3,270 4,135 | || 36 27,746 1.5 14,049 13,697 | 76 6,920 0.4 3,080 3,840 |All Ages 1,869,311 100.0 930,606 938,705 || 37 28,388 1.5 14,526 13,862 | 77 6,754 0.4 2,985 3,769 | || 38 29,012 1.6 14,731 14,281 | 78 6,534 0.3 2,799 3,735 |Median Age Both Sexes Male Female || 39 31,062 1.7 15,925 15,137 | 79 6,360 0.3 2,725 3,635 | By Sex 36.8 36.0 37.6 || | | || | | || |+===================================================================================================================================================+Source: Census 2010 Summary File 1 [machine-readable data file]/Prepared by the U.S.Census Bureau, 2011. 06NOV12 Page 12 Prepared by: Washington State Office of Financial Management, Forecasting Division.

Census 2010, Summary File 1 AGE/SEX PROFILE FOR SPECIFIC RACE/ETHNIC GROUP A: WHITE ALONE AgeRace-AArea: King County Component:Urban Area Type: State-County (Summary Level: 050)State: WA County: 033 +===================================================================================================================================================+|P12A/P13A/PCT12A. DETAILED AGE BY SEX (INCLUDING MEDIANS): WHITE ALONE ||Universe: White Alone Persons (1,269,805 or 67.9% of Total Population: 1,869,311) || || Total Pct. Male Female | Total Pct. Male Female | Total Pct. Male Female || | | ||0 to 4 64,777 5.1 33,268 31,509 |40 to 44 99,859 7.9 51,963 47,896 |80 to 84 23,403 1.8 9,317 14,086 || 0 13,304 1.0 6,833 6,471 | 40 21,814 1.7 11,529 10,285 | 80 4,989 0.4 2,093 2,896 || 1 12,986 1.0 6,657 6,329 | 41 20,506 1.6 10,684 9,822 | 81 4,739 0.4 1,883 2,856 || 2 12,960 1.0 6,690 6,270 | 42 19,594 1.5 10,218 9,376 | 82 4,723 0.4 1,910 2,813 || 3 12,964 1.0 6,640 6,324 | 43 19,137 1.5 9,812 9,325 | 83 4,608 0.4 1,799 2,809 || 4 12,563 1.0 6,448 6,115 | 44 18,808 1.5 9,720 9,088 | 84 4,344 0.3 1,632 2,712 ||5 to 9 62,652 4.9 32,089 30,563 |45 to 49 102,983 8.1 52,450 50,533 |85 to 89 18,000 1.4 6,342 11,658 || 5 12,717 1.0 6,543 6,174 | 45 20,161 1.6 10,347 9,814 | 85 4,302 0.3 1,503 2,799 || 6 12,779 1.0 6,607 6,172 | 46 20,403 1.6 10,396 10,007 | 86 3,961 0.3 1,465 2,496 || 7 12,483 1.0 6,322 6,161 | 47 20,802 1.6 10,584 10,218 | 87 3,652 0.3 1,299 2,353 || 8 12,088 1.0 6,183 5,905 | 48 20,681 1.6 10,518 10,163 | 88 3,237 0.3 1,144 2,093 || 9 12,585 1.0 6,434 6,151 | 49 20,936 1.6 10,605 10,331 | 89 2,848 0.2 931 1,917 ||10 to 14 63,175 5.0 32,520 30,655 |50 to 54 102,881 8.1 51,828 51,053 |90 to 94 8,318 0.7 2,534 5,784 || 10 12,644 1.0 6,532 6,112 | 50 20,821 1.6 10,631 10,190 | 90 2,492 0.2 800 1,692 || 11 12,533 1.0 6,329 6,204 | 51 20,468 1.6 10,288 10,180 | 91 1,984 0.2 617 1,367 || 12 12,702 1.0 6,456 6,246 | 52 20,790 1.6 10,385 10,405 | 92 1,618 0.1 484 1,134 || 13 12,554 1.0 6,505 6,049 | 53 20,604 1.6 10,394 10,210 | 93 1,254 0.1 352 902 || 14 12,742 1.0 6,698 6,044 | 54 20,198 1.6 10,130 10,068 | 94 970 0.1 281 689 ||15 to 19 67,360 5.3 34,534 32,826 |55 to 59 93,048 7.3 46,044 47,004 |95 to 99 2,158 0.2 488 1,670 || 15 13,093 1.0 6,719 6,374 | 55 20,112 1.6 10,074 10,038 | 95 781 0.1 189 592 || 16 12,981 1.0 6,678 6,303 | 56 19,371 1.5 9,555 9,816 | 96 529 0.0 123 406 || 17 13,694 1.1 7,053 6,641 | 57 18,725 1.5 9,312 9,413 | 97 382 0.0 83 299 || 18 13,935 1.1 7,208 6,727 | 58 17,994 1.4 8,865 9,129 | 98 265 0.0 52 213 || 19 13,657 1.1 6,876 6,781 | 59 16,846 1.3 8,238 8,608 | 99 201 0.0 41 160 ||20 to 24 79,023 6.2 39,778 39,245 |60 to 64 76,473 6.0 37,242 39,231 |100-104 268 0.0 40 228 || 20 14,125 1.1 7,211 6,914 | 60 16,488 1.3 8,027 8,461 |105-109 13 0.0 0 13 || 21 13,905 1.1 7,085 6,820 | 61 15,837 1.2 7,839 7,998 |110 plus 3 0.0 2 1 || 22 15,243 1.2 7,688 7,555 | 62 16,314 1.3 7,873 8,441 | || 23 16,872 1.3 8,403 8,469 | 63 15,893 1.3 7,664 8,229 | || 24 18,878 1.5 9,391 9,487 | 64 11,941 0.9 5,839 6,102 |0 to 14 190,604 15.0 97,877 92,727 ||25 to 29 102,606 8.1 52,642 49,964 |65 to 69 50,919 4.0 24,526 26,393 |5 to 17 165,595 13.0 85,059 80,536 || 25 20,080 1.6 10,190 9,890 | 65 11,770 0.9 5,692 6,078 |18 to 21 55,622 4.4 28,380 27,242 || 26 20,105 1.6 10,324 9,781 | 66 11,250 0.9 5,373 5,877 |18 to 24 106,615 8.4 53,862 52,753 || 27 20,686 1.6 10,573 10,113 | 67 11,035 0.9 5,354 5,681 |18 to 64 875,413 68.9 444,889 430,524 || 28 21,112 1.7 10,936 10,176 | 68 8,837 0.7 4,244 4,593 |25 to 64 768,798 60.5 391,027 377,771 || 29 20,623 1.6 10,619 10,004 | 69 8,027 0.6 3,863 4,164 |60 plus 240,493 18.9 107,934 132,559 ||30 to 34 95,832 7.5 49,471 46,361 |70 to 74 33,710 2.7 15,469 18,241 |65 plus 164,020 12.9 70,692 93,328 || 30 20,724 1.6 10,703 10,021 | 70 7,427 0.6 3,477 3,950 |70 plus 113,101 8.9 46,166 66,935 || 31 19,176 1.5 9,910 9,266 | 71 7,094 0.6 3,142 3,952 |75 plus 79,391 6.3 30,697 48,694 || 32 19,054 1.5 9,799 9,255 | 72 6,865 0.5 3,169 3,696 |80 plus 52,163 4.1 18,723 33,440 || 33 18,692 1.5 9,654 9,038 | 73 6,315 0.5 2,903 3,412 |85 plus 28,760 2.3 9,406 19,354 || 34 18,186 1.4 9,405 8,781 | 74 6,009 0.5 2,778 3,231 |90 plus 10,760 0.8 3,064 7,696 ||35 to 39 95,116 7.5 49,387 45,729 |75 to 79 27,228 2.1 11,974 15,254 | || 35 19,076 1.5 9,869 9,207 | 75 5,833 0.5 2,566 3,267 | || 36 17,727 1.4 9,245 8,482 | 76 5,449 0.4 2,426 3,023 |All Ages 1,269,805 100.0 633,908 635,897 || 37 18,120 1.4 9,433 8,687 | 77 5,413 0.4 2,425 2,988 | || 38 19,170 1.5 9,890 9,280 | 78 5,331 0.4 2,310 3,021 |Median Age Both Sexes Male Female || 39 21,023 1.7 10,950 10,073 | 79 5,202 0.4 2,247 2,955 | By Sex 40.2 39.4 41.1 || | | || | | || |+===================================================================================================================================================+Source: Census 2010 Summary File 1 [machine-readable data file]/Prepared by the U.S.Census Bureau, 2011. 06NOV12 Page 13 Prepared by: Washington State Office of Financial Management, Forecasting Division.
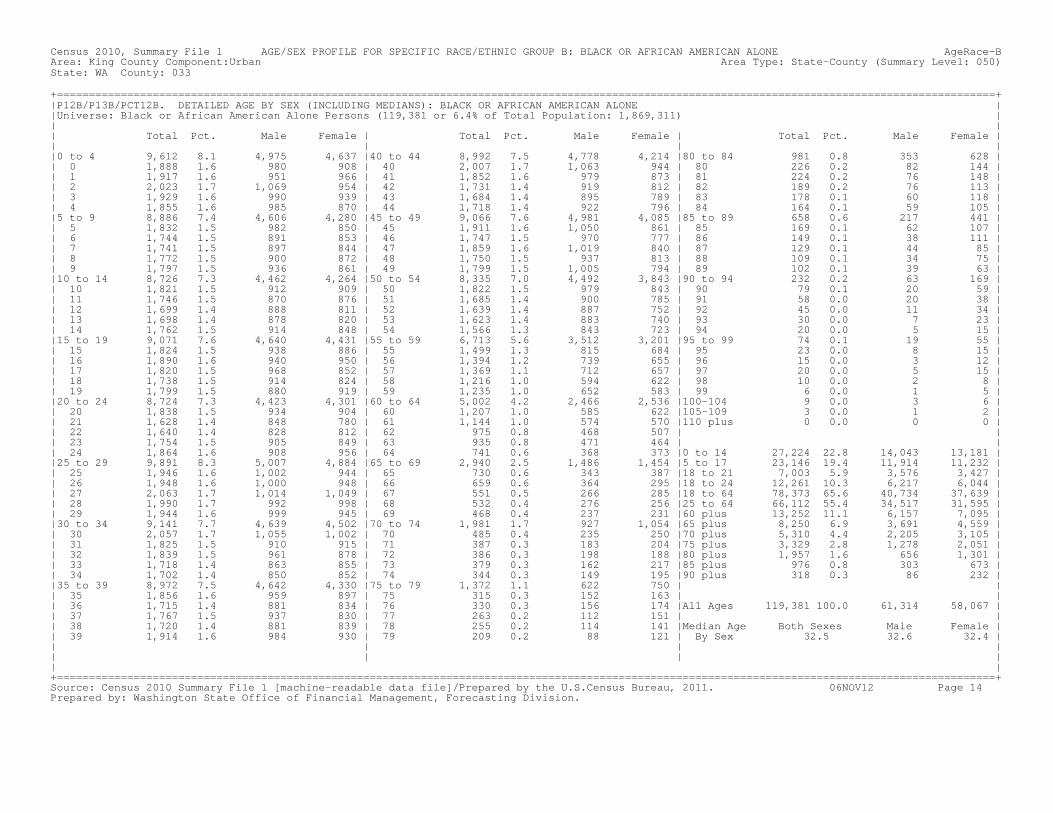
Census 2010, Summary File 1 AGE/SEX PROFILE FOR SPECIFIC RACE/ETHNIC GROUP B: BLACK OR AFRICAN AMERICAN ALONE AgeRace-BArea: King County Component:Urban Area Type: State-County (Summary Level: 050)State: WA County: 033 +===================================================================================================================================================+|P12B/P13B/PCT12B. DETAILED AGE BY SEX (INCLUDING MEDIANS): BLACK OR AFRICAN AMERICAN ALONE ||Universe: Black or African American Alone Persons (119,381 or 6.4% of Total Population: 1,869,311) || || Total Pct. Male Female | Total Pct. Male Female | Total Pct. Male Female || | | ||0 to 4 9,612 8.1 4,975 4,637 |40 to 44 8,992 7.5 4,778 4,214 |80 to 84 981 0.8 353 628 || 0 1,888 1.6 980 908 | 40 2,007 1.7 1,063 944 | 80 226 0.2 82 144 || 1 1,917 1.6 951 966 | 41 1,852 1.6 979 873 | 81 224 0.2 76 148 || 2 2,023 1.7 1,069 954 | 42 1,731 1.4 919 812 | 82 189 0.2 76 113 || 3 1,929 1.6 990 939 | 43 1,684 1.4 895 789 | 83 178 0.1 60 118 || 4 1,855 1.6 985 870 | 44 1,718 1.4 922 796 | 84 164 0.1 59 105 ||5 to 9 8,886 7.4 4,606 4,280 |45 to 49 9,066 7.6 4,981 4,085 |85 to 89 658 0.6 217 441 || 5 1,832 1.5 982 850 | 45 1,911 1.6 1,050 861 | 85 169 0.1 62 107 || 6 1,744 1.5 891 853 | 46 1,747 1.5 970 777 | 86 149 0.1 38 111 || 7 1,741 1.5 897 844 | 47 1,859 1.6 1,019 840 | 87 129 0.1 44 85 || 8 1,772 1.5 900 872 | 48 1,750 1.5 937 813 | 88 109 0.1 34 75 || 9 1,797 1.5 936 861 | 49 1,799 1.5 1,005 794 | 89 102 0.1 39 63 ||10 to 14 8,726 7.3 4,462 4,264 |50 to 54 8,335 7.0 4,492 3,843 |90 to 94 232 0.2 63 169 || 10 1,821 1.5 912 909 | 50 1,822 1.5 979 843 | 90 79 0.1 20 59 || 11 1,746 1.5 870 876 | 51 1,685 1.4 900 785 | 91 58 0.0 20 38 || 12 1,699 1.4 888 811 | 52 1,639 1.4 887 752 | 92 45 0.0 11 34 || 13 1,698 1.4 878 820 | 53 1,623 1.4 883 740 | 93 30 0.0 7 23 || 14 1,762 1.5 914 848 | 54 1,566 1.3 843 723 | 94 20 0.0 5 15 ||15 to 19 9,071 7.6 4,640 4,431 |55 to 59 6,713 5.6 3,512 3,201 |95 to 99 74 0.1 19 55 || 15 1,824 1.5 938 886 | 55 1,499 1.3 815 684 | 95 23 0.0 8 15 || 16 1,890 1.6 940 950 | 56 1,394 1.2 739 655 | 96 15 0.0 3 12 || 17 1,820 1.5 968 852 | 57 1,369 1.1 712 657 | 97 20 0.0 5 15 || 18 1,738 1.5 914 824 | 58 1,216 1.0 594 622 | 98 10 0.0 2 8 || 19 1,799 1.5 880 919 | 59 1,235 1.0 652 583 | 99 6 0.0 1 5 ||20 to 24 8,724 7.3 4,423 4,301 |60 to 64 5,002 4.2 2,466 2,536 |100-104 9 0.0 3 6 || 20 1,838 1.5 934 904 | 60 1,207 1.0 585 622 |105-109 3 0.0 1 2 || 21 1,628 1.4 848 780 | 61 1,144 1.0 574 570 |110 plus 0 0.0 0 0 || 22 1,640 1.4 828 812 | 62 975 0.8 468 507 | || 23 1,754 1.5 905 849 | 63 935 0.8 471 464 | || 24 1,864 1.6 908 956 | 64 741 0.6 368 373 |0 to 14 27,224 22.8 14,043 13,181 ||25 to 29 9,891 8.3 5,007 4,884 |65 to 69 2,940 2.5 1,486 1,454 |5 to 17 23,146 19.4 11,914 11,232 || 25 1,946 1.6 1,002 944 | 65 730 0.6 343 387 |18 to 21 7,003 5.9 3,576 3,427 || 26 1,948 1.6 1,000 948 | 66 659 0.6 364 295 |18 to 24 12,261 10.3 6,217 6,044 || 27 2,063 1.7 1,014 1,049 | 67 551 0.5 266 285 |18 to 64 78,373 65.6 40,734 37,639 || 28 1,990 1.7 992 998 | 68 532 0.4 276 256 |25 to 64 66,112 55.4 34,517 31,595 || 29 1,944 1.6 999 945 | 69 468 0.4 237 231 |60 plus 13,252 11.1 6,157 7,095 ||30 to 34 9,141 7.7 4,639 4,502 |70 to 74 1,981 1.7 927 1,054 |65 plus 8,250 6.9 3,691 4,559 || 30 2,057 1.7 1,055 1,002 | 70 485 0.4 235 250 |70 plus 5,310 4.4 2,205 3,105 || 31 1,825 1.5 910 915 | 71 387 0.3 183 204 |75 plus 3,329 2.8 1,278 2,051 || 32 1,839 1.5 961 878 | 72 386 0.3 198 188 |80 plus 1,957 1.6 656 1,301 || 33 1,718 1.4 863 855 | 73 379 0.3 162 217 |85 plus 976 0.8 303 673 || 34 1,702 1.4 850 852 | 74 344 0.3 149 195 |90 plus 318 0.3 86 232 ||35 to 39 8,972 7.5 4,642 4,330 |75 to 79 1,372 1.1 622 750 | || 35 1,856 1.6 959 897 | 75 315 0.3 152 163 | || 36 1,715 1.4 881 834 | 76 330 0.3 156 174 |All Ages 119,381 100.0 61,314 58,067 || 37 1,767 1.5 937 830 | 77 263 0.2 112 151 | || 38 1,720 1.4 881 839 | 78 255 0.2 114 141 |Median Age Both Sexes Male Female || 39 1,914 1.6 984 930 | 79 209 0.2 88 121 | By Sex 32.5 32.6 32.4 || | | || | | || |+===================================================================================================================================================+Source: Census 2010 Summary File 1 [machine-readable data file]/Prepared by the U.S.Census Bureau, 2011. 06NOV12 Page 14 Prepared by: Washington State Office of Financial Management, Forecasting Division.

Census 2010, Summary File 1 AGE/SEX PROFILE FOR SPECIFIC RACE/ETHNIC GROUP C: AMERICAN INDIAN AND ALASKA NATIVE ALONE AgeRace-CArea: King County Component:Urban Area Type: State-County (Summary Level: 050)State: WA County: 033 +===================================================================================================================================================+|P12C/P13C/PCT12C. DETAILED AGE BY SEX (INCLUDING MEDIANS): AMERICAN INDIAN AND ALASKA NATIVE ALONE ||Universe: American Indian and Alaska Native Alone Persons (14,872 or 0.8% of Total Population: 1,869,311) || || Total Pct. Male Female | Total Pct. Male Female | Total Pct. Male Female || | | ||0 to 4 887 6.0 449 438 |40 to 44 1,145 7.7 596 549 |80 to 84 98 0.7 29 69 || 0 188 1.3 97 91 | 40 213 1.4 116 97 | 80 26 0.2 7 19 || 1 175 1.2 97 78 | 41 229 1.5 125 104 | 81 20 0.1 7 13 || 2 169 1.1 76 93 | 42 216 1.5 107 109 | 82 16 0.1 4 12 || 3 179 1.2 89 90 | 43 249 1.7 128 121 | 83 28 0.2 11 17 || 4 176 1.2 90 86 | 44 238 1.6 120 118 | 84 8 0.1 0 8 ||5 to 9 909 6.1 464 445 |45 to 49 1,173 7.9 599 574 |85 to 89 63 0.4 23 40 || 5 196 1.3 101 95 | 45 223 1.5 115 108 | 85 16 0.1 5 11 || 6 172 1.2 79 93 | 46 248 1.7 121 127 | 86 16 0.1 7 9 || 7 173 1.2 92 81 | 47 254 1.7 135 119 | 87 13 0.1 5 8 || 8 188 1.3 94 94 | 48 228 1.5 127 101 | 88 9 0.1 2 7 || 9 180 1.2 98 82 | 49 220 1.5 101 119 | 89 9 0.1 4 5 ||10 to 14 977 6.6 508 469 |50 to 54 1,210 8.1 605 605 |90 to 94 12 0.1 3 9 || 10 204 1.4 118 86 | 50 254 1.7 121 133 | 90 2 0.0 0 2 || 11 209 1.4 112 97 | 51 226 1.5 114 112 | 91 5 0.0 2 3 || 12 195 1.3 96 99 | 52 251 1.7 118 133 | 92 1 0.0 0 1 || 13 172 1.2 87 85 | 53 255 1.7 136 119 | 93 1 0.0 0 1 || 14 197 1.3 95 102 | 54 224 1.5 116 108 | 94 3 0.0 1 2 ||15 to 19 1,209 8.1 642 567 |55 to 59 922 6.2 462 460 |95 to 99 6 0.0 1 5 || 15 221 1.5 124 97 | 55 217 1.5 101 116 | 95 1 0.0 0 1 || 16 232 1.6 123 109 | 56 175 1.2 93 82 | 96 4 0.0 1 3 || 17 251 1.7 132 119 | 57 177 1.2 93 84 | 97 0 0.0 0 0 || 18 262 1.8 145 117 | 58 168 1.1 81 87 | 98 1 0.0 0 1 || 19 243 1.6 118 125 | 59 185 1.2 94 91 | 99 0 0.0 0 0 ||20 to 24 1,198 8.1 632 566 |60 to 64 671 4.5 335 336 |100-104 2 0.0 1 1 || 20 245 1.6 133 112 | 60 177 1.2 93 84 |105-109 0 0.0 0 0 || 21 237 1.6 128 109 | 61 140 0.9 72 68 |110 plus 0 0.0 0 0 || 22 237 1.6 115 122 | 62 113 0.8 56 57 | || 23 239 1.6 119 120 | 63 139 0.9 70 69 | || 24 240 1.6 137 103 | 64 102 0.7 44 58 |0 to 14 2,773 18.6 1,421 1,352 ||25 to 29 1,234 8.3 603 631 |65 to 69 436 2.9 188 248 |5 to 17 2,590 17.4 1,351 1,239 || 25 235 1.6 125 110 | 65 95 0.6 45 50 |18 to 21 987 6.6 524 463 || 26 251 1.7 114 137 | 66 102 0.7 48 54 |18 to 24 1,703 11.5 895 808 || 27 237 1.6 114 123 | 67 92 0.6 38 54 |18 to 64 10,363 69.7 5,268 5,095 || 28 263 1.8 129 134 | 68 73 0.5 30 43 |25 to 64 8,660 58.2 4,373 4,287 || 29 248 1.7 121 127 | 69 74 0.5 27 47 |60 plus 1,703 11.5 763 940 ||30 to 34 1,208 8.1 594 614 |70 to 74 248 1.7 110 138 |65 plus 1,032 6.9 428 604 || 30 251 1.7 122 129 | 70 59 0.4 30 29 |70 plus 596 4.0 240 356 || 31 244 1.6 125 119 | 71 40 0.3 10 30 |75 plus 348 2.3 130 218 || 32 249 1.7 125 124 | 72 71 0.5 29 42 |80 plus 181 1.2 57 124 || 33 238 1.6 104 134 | 73 33 0.2 18 15 |85 plus 83 0.6 28 55 || 34 226 1.5 118 108 | 74 45 0.3 23 22 |90 plus 20 0.1 5 15 ||35 to 39 1,097 7.4 579 518 |75 to 79 167 1.1 73 94 | || 35 228 1.5 139 89 | 75 44 0.3 16 28 | || 36 199 1.3 90 109 | 76 38 0.3 17 21 |All Ages 14,872 100.0 7,496 7,376 || 37 206 1.4 106 100 | 77 34 0.2 18 16 | || 38 219 1.5 111 108 | 78 23 0.2 10 13 |Median Age Both Sexes Male Female || 39 245 1.6 133 112 | 79 28 0.2 12 16 | By Sex 34.2 33.8 34.6 || | | || | | || |+===================================================================================================================================================+Source: Census 2010 Summary File 1 [machine-readable data file]/Prepared by the U.S.Census Bureau, 2011. 06NOV12 Page 15 Prepared by: Washington State Office of Financial Management, Forecasting Division.

Census 2010, Summary File 1 AGE/SEX PROFILE FOR SPECIFIC RACE/ETHNIC GROUP D: ASIAN ALONE AgeRace-DArea: King County Component:Urban Area Type: State-County (Summary Level: 050)State: WA County: 033 +===================================================================================================================================================+|P12D/P13D/PCT12D. DETAILED AGE BY SEX (INCLUDING MEDIANS): ASIAN ALONE ||Universe: Asian Alone Persons (280,794 or 15.0% of Total Population: 1,869,311) || || Total Pct. Male Female | Total Pct. Male Female | Total Pct. Male Female || | | ||0 to 4 17,698 6.3 9,009 8,689 |40 to 44 22,059 7.9 10,246 11,813 |80 to 84 3,241 1.2 1,196 2,045 || 0 3,452 1.2 1,763 1,689 | 40 5,068 1.8 2,349 2,719 | 80 754 0.3 290 464 || 1 3,555 1.3 1,818 1,737 | 41 4,588 1.6 2,146 2,442 | 81 681 0.2 261 420 || 2 3,671 1.3 1,929 1,742 | 42 4,296 1.5 2,025 2,271 | 82 639 0.2 236 403 || 3 3,552 1.3 1,768 1,784 | 43 4,113 1.5 1,846 2,267 | 83 611 0.2 204 407 || 4 3,468 1.2 1,731 1,737 | 44 3,994 1.4 1,880 2,114 | 84 556 0.2 205 351 ||5 to 9 16,820 6.0 8,475 8,345 |45 to 49 19,718 7.0 9,144 10,574 |85 to 89 1,960 0.7 718 1,242 || 5 3,508 1.2 1,788 1,720 | 45 4,108 1.5 1,905 2,203 | 85 480 0.2 178 302 || 6 3,409 1.2 1,746 1,663 | 46 4,180 1.5 1,885 2,295 | 86 469 0.2 170 299 || 7 3,457 1.2 1,713 1,744 | 47 4,123 1.5 1,926 2,197 | 87 399 0.1 149 250 || 8 3,182 1.1 1,604 1,578 | 48 3,584 1.3 1,737 1,847 | 88 333 0.1 120 213 || 9 3,264 1.2 1,624 1,640 | 49 3,723 1.3 1,691 2,032 | 89 279 0.1 101 178 ||10 to 14 15,238 5.4 7,674 7,564 |50 to 54 17,312 6.2 7,936 9,376 |90 to 94 722 0.3 267 455 || 10 3,110 1.1 1,600 1,510 | 50 3,679 1.3 1,699 1,980 | 90 231 0.1 78 153 || 11 2,953 1.1 1,493 1,460 | 51 3,539 1.3 1,652 1,887 | 91 169 0.1 67 102 || 12 3,079 1.1 1,593 1,486 | 52 3,355 1.2 1,548 1,807 | 92 128 0.0 52 76 || 13 3,025 1.1 1,478 1,547 | 53 3,415 1.2 1,560 1,855 | 93 110 0.0 42 68 || 14 3,071 1.1 1,510 1,561 | 54 3,324 1.2 1,477 1,847 | 94 84 0.0 28 56 ||15 to 19 18,362 6.5 9,280 9,082 |55 to 59 15,085 5.4 6,688 8,397 |95 to 99 173 0.1 51 122 || 15 3,098 1.1 1,578 1,520 | 55 3,349 1.2 1,498 1,851 | 95 73 0.0 25 48 || 16 3,193 1.1 1,633 1,560 | 56 3,159 1.1 1,404 1,755 | 96 34 0.0 9 25 || 17 3,414 1.2 1,772 1,642 | 57 2,967 1.1 1,322 1,645 | 97 29 0.0 11 18 || 18 4,039 1.4 2,024 2,015 | 58 2,812 1.0 1,245 1,567 | 98 25 0.0 6 19 || 19 4,618 1.6 2,273 2,345 | 59 2,798 1.0 1,219 1,579 | 99 12 0.0 0 12 ||20 to 24 21,293 7.6 10,570 10,723 |60 to 64 12,148 4.3 5,505 6,643 |100-104 25 0.0 2 23 || 20 4,427 1.6 2,190 2,237 | 60 2,868 1.0 1,334 1,534 |105-109 5 0.0 0 5 || 21 4,406 1.6 2,205 2,201 | 61 2,690 1.0 1,177 1,513 |110 plus 0 0.0 0 0 || 22 4,037 1.4 1,999 2,038 | 62 2,464 0.9 1,143 1,321 | || 23 4,034 1.4 2,000 2,034 | 63 2,209 0.8 984 1,225 | || 24 4,389 1.6 2,176 2,213 | 64 1,917 0.7 867 1,050 |0 to 14 49,756 17.7 25,158 24,598 ||25 to 29 26,208 9.3 12,571 13,637 |65 to 69 8,269 2.9 3,620 4,649 |5 to 17 41,763 14.9 21,132 20,631 || 25 4,712 1.7 2,356 2,356 | 65 1,861 0.7 815 1,046 |18 to 21 17,490 6.2 8,692 8,798 || 26 5,038 1.8 2,401 2,637 | 66 1,756 0.6 748 1,008 |18 to 24 29,950 10.7 14,867 15,083 || 27 5,507 2.0 2,712 2,795 | 67 1,560 0.6 702 858 |18 to 64 195,905 69.8 92,176 103,729 || 28 5,484 2.0 2,501 2,983 | 68 1,561 0.6 665 896 |25 to 64 165,955 59.1 77,309 88,646 || 29 5,467 1.9 2,601 2,866 | 69 1,531 0.5 690 841 |60 plus 37,576 13.4 16,190 21,386 ||30 to 34 26,784 9.5 12,776 14,008 |70 to 74 6,506 2.3 2,951 3,555 |65 plus 25,428 9.1 10,685 14,743 || 30 5,632 2.0 2,721 2,911 | 70 1,472 0.5 667 805 |70 plus 17,159 6.1 7,065 10,094 || 31 5,224 1.9 2,523 2,701 | 71 1,338 0.5 620 718 |75 plus 10,653 3.8 4,114 6,539 || 32 5,274 1.9 2,475 2,799 | 72 1,381 0.5 632 749 |80 plus 6,126 2.2 2,234 3,892 || 33 5,294 1.9 2,542 2,752 | 73 1,217 0.4 567 650 |85 plus 2,885 1.0 1,038 1,847 || 34 5,360 1.9 2,515 2,845 | 74 1,098 0.4 465 633 |90 plus 925 0.3 320 605 ||35 to 39 26,641 9.5 12,443 14,198 |75 to 79 4,527 1.6 1,880 2,647 | || 35 5,402 1.9 2,548 2,854 | 75 1,046 0.4 464 582 | || 36 5,324 1.9 2,418 2,906 | 76 947 0.3 404 543 |All Ages 280,794 100.0 133,002 147,792 || 37 5,513 2.0 2,587 2,926 | 77 910 0.3 369 541 | || 38 5,241 1.9 2,462 2,779 | 78 808 0.3 309 499 |Median Age Both Sexes Male Female || 39 5,161 1.8 2,428 2,733 | 79 816 0.3 334 482 | By Sex 34.6 33.5 35.6 || | | || | | || |+===================================================================================================================================================+Source: Census 2010 Summary File 1 [machine-readable data file]/Prepared by the U.S.Census Bureau, 2011. 06NOV12 Page 16 Prepared by: Washington State Office of Financial Management, Forecasting Division.
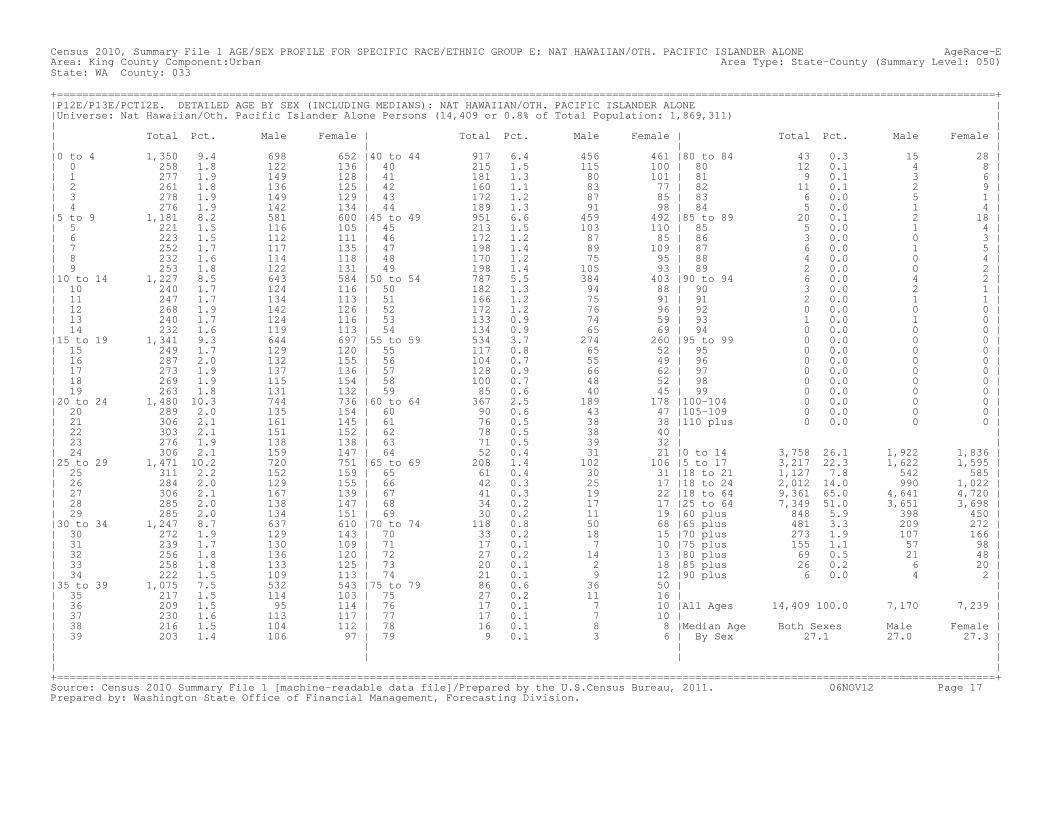
Census 2010, Summary File 1 AGE/SEX PROFILE FOR SPECIFIC RACE/ETHNIC GROUP E: NAT HAWAIIAN/OTH. PACIFIC ISLANDER ALONE AgeRace-EArea: King County Component:Urban Area Type: State-County (Summary Level: 050)State: WA County: 033 +===================================================================================================================================================+|P12E/P13E/PCT12E. DETAILED AGE BY SEX (INCLUDING MEDIANS): NAT HAWAIIAN/OTH. PACIFIC ISLANDER ALONE ||Universe: Nat Hawaiian/Oth. Pacific Islander Alone Persons (14,409 or 0.8% of Total Population: 1,869,311) || || Total Pct. Male Female | Total Pct. Male Female | Total Pct. Male Female || | | ||0 to 4 1,350 9.4 698 652 |40 to 44 917 6.4 456 461 |80 to 84 43 0.3 15 28 || 0 258 1.8 122 136 | 40 215 1.5 115 100 | 80 12 0.1 4 8 || 1 277 1.9 149 128 | 41 181 1.3 80 101 | 81 9 0.1 3 6 || 2 261 1.8 136 125 | 42 160 1.1 83 77 | 82 11 0.1 2 9 || 3 278 1.9 149 129 | 43 172 1.2 87 85 | 83 6 0.0 5 1 || 4 276 1.9 142 134 | 44 189 1.3 91 98 | 84 5 0.0 1 4 ||5 to 9 1,181 8.2 581 600 |45 to 49 951 6.6 459 492 |85 to 89 20 0.1 2 18 || 5 221 1.5 116 105 | 45 213 1.5 103 110 | 85 5 0.0 1 4 || 6 223 1.5 112 111 | 46 172 1.2 87 85 | 86 3 0.0 0 3 || 7 252 1.7 117 135 | 47 198 1.4 89 109 | 87 6 0.0 1 5 || 8 232 1.6 114 118 | 48 170 1.2 75 95 | 88 4 0.0 0 4 || 9 253 1.8 122 131 | 49 198 1.4 105 93 | 89 2 0.0 0 2 ||10 to 14 1,227 8.5 643 584 |50 to 54 787 5.5 384 403 |90 to 94 6 0.0 4 2 || 10 240 1.7 124 116 | 50 182 1.3 94 88 | 90 3 0.0 2 1 || 11 247 1.7 134 113 | 51 166 1.2 75 91 | 91 2 0.0 1 1 || 12 268 1.9 142 126 | 52 172 1.2 76 96 | 92 0 0.0 0 0 || 13 240 1.7 124 116 | 53 133 0.9 74 59 | 93 1 0.0 1 0 || 14 232 1.6 119 113 | 54 134 0.9 65 69 | 94 0 0.0 0 0 ||15 to 19 1,341 9.3 644 697 |55 to 59 534 3.7 274 260 |95 to 99 0 0.0 0 0 || 15 249 1.7 129 120 | 55 117 0.8 65 52 | 95 0 0.0 0 0 || 16 287 2.0 132 155 | 56 104 0.7 55 49 | 96 0 0.0 0 0 || 17 273 1.9 137 136 | 57 128 0.9 66 62 | 97 0 0.0 0 0 || 18 269 1.9 115 154 | 58 100 0.7 48 52 | 98 0 0.0 0 0 || 19 263 1.8 131 132 | 59 85 0.6 40 45 | 99 0 0.0 0 0 ||20 to 24 1,480 10.3 744 736 |60 to 64 367 2.5 189 178 |100-104 0 0.0 0 0 || 20 289 2.0 135 154 | 60 90 0.6 43 47 |105-109 0 0.0 0 0 || 21 306 2.1 161 145 | 61 76 0.5 38 38 |110 plus 0 0.0 0 0 || 22 303 2.1 151 152 | 62 78 0.5 38 40 | || 23 276 1.9 138 138 | 63 71 0.5 39 32 | || 24 306 2.1 159 147 | 64 52 0.4 31 21 |0 to 14 3,758 26.1 1,922 1,836 ||25 to 29 1,471 10.2 720 751 |65 to 69 208 1.4 102 106 |5 to 17 3,217 22.3 1,622 1,595 || 25 311 2.2 152 159 | 65 61 0.4 30 31 |18 to 21 1,127 7.8 542 585 || 26 284 2.0 129 155 | 66 42 0.3 25 17 |18 to 24 2,012 14.0 990 1,022 || 27 306 2.1 167 139 | 67 41 0.3 19 22 |18 to 64 9,361 65.0 4,641 4,720 || 28 285 2.0 138 147 | 68 34 0.2 17 17 |25 to 64 7,349 51.0 3,651 3,698 || 29 285 2.0 134 151 | 69 30 0.2 11 19 |60 plus 848 5.9 398 450 ||30 to 34 1,247 8.7 637 610 |70 to 74 118 0.8 50 68 |65 plus 481 3.3 209 272 || 30 272 1.9 129 143 | 70 33 0.2 18 15 |70 plus 273 1.9 107 166 || 31 239 1.7 130 109 | 71 17 0.1 7 10 |75 plus 155 1.1 57 98 || 32 256 1.8 136 120 | 72 27 0.2 14 13 |80 plus 69 0.5 21 48 || 33 258 1.8 133 125 | 73 20 0.1 2 18 |85 plus 26 0.2 6 20 || 34 222 1.5 109 113 | 74 21 0.1 9 12 |90 plus 6 0.0 4 2 ||35 to 39 1,075 7.5 532 543 |75 to 79 86 0.6 36 50 | || 35 217 1.5 114 103 | 75 27 0.2 11 16 | || 36 209 1.5 95 114 | 76 17 0.1 7 10 |All Ages 14,409 100.0 7,170 7,239 || 37 230 1.6 113 117 | 77 17 0.1 7 10 | || 38 216 1.5 104 112 | 78 16 0.1 8 8 |Median Age Both Sexes Male Female || 39 203 1.4 106 97 | 79 9 0.1 3 6 | By Sex 27.1 27.0 27.3 || | | || | | || |+===================================================================================================================================================+Source: Census 2010 Summary File 1 [machine-readable data file]/Prepared by the U.S.Census Bureau, 2011. 06NOV12 Page 17 Prepared by: Washington State Office of Financial Management, Forecasting Division.

Census 2010, Summary File 1 AGE/SEX PROFILE FOR SPECIFIC RACE/ETHNIC GROUP F: SOME OTHER RACE ALONE AgeRace-FArea: King County Component:Urban Area Type: State-County (Summary Level: 050)State: WA County: 033 +===================================================================================================================================================+|P12F/P13F/PCT12F. DETAILED AGE BY SEX (INCLUDING MEDIANS): SOME OTHER RACE ALONE ||Universe: Some Other Race Alone Persons (75,154 or 4.0% of Total Population: 1,869,311) || || Total Pct. Male Female | Total Pct. Male Female | Total Pct. Male Female || | | ||0 to 4 7,927 10.5 4,098 3,829 |40 to 44 5,341 7.1 3,018 2,323 |80 to 84 111 0.1 40 71 || 0 1,649 2.2 873 776 | 40 1,261 1.7 708 553 | 80 28 0.0 5 23 || 1 1,611 2.1 838 773 | 41 1,126 1.5 629 497 | 81 22 0.0 7 15 || 2 1,612 2.1 836 776 | 42 1,049 1.4 595 454 | 82 24 0.0 11 13 || 3 1,562 2.1 782 780 | 43 959 1.3 535 424 | 83 16 0.0 7 9 || 4 1,493 2.0 769 724 | 44 946 1.3 551 395 | 84 21 0.0 10 11 ||5 to 9 7,004 9.3 3,601 3,403 |45 to 49 3,812 5.1 2,149 1,663 |85 to 89 76 0.1 30 46 || 5 1,483 2.0 773 710 | 45 899 1.2 507 392 | 85 20 0.0 6 14 || 6 1,422 1.9 734 688 | 46 786 1.0 450 336 | 86 22 0.0 12 10 || 7 1,375 1.8 694 681 | 47 766 1.0 437 329 | 87 12 0.0 3 9 || 8 1,397 1.9 735 662 | 48 712 0.9 399 313 | 88 11 0.0 6 5 || 9 1,327 1.8 665 662 | 49 649 0.9 356 293 | 89 11 0.0 3 8 ||10 to 14 6,289 8.4 3,296 2,993 |50 to 54 2,631 3.5 1,493 1,138 |90 to 94 19 0.0 6 13 || 10 1,279 1.7 684 595 | 50 608 0.8 338 270 | 90 6 0.0 2 4 || 11 1,283 1.7 664 619 | 51 576 0.8 326 250 | 91 7 0.0 3 4 || 12 1,267 1.7 636 631 | 52 547 0.7 309 238 | 92 3 0.0 0 3 || 13 1,254 1.7 677 577 | 53 493 0.7 286 207 | 93 3 0.0 1 2 || 14 1,206 1.6 635 571 | 54 407 0.5 234 173 | 94 0 0.0 0 0 ||15 to 19 6,061 8.1 3,185 2,876 |55 to 59 1,654 2.2 924 730 |95 to 99 9 0.0 2 7 || 15 1,183 1.6 638 545 | 55 416 0.6 227 189 | 95 5 0.0 1 4 || 16 1,208 1.6 614 594 | 56 337 0.4 182 155 | 96 3 0.0 1 2 || 17 1,229 1.6 637 592 | 57 344 0.5 202 142 | 97 1 0.0 0 1 || 18 1,183 1.6 640 543 | 58 300 0.4 167 133 | 98 0 0.0 0 0 || 19 1,258 1.7 656 602 | 59 257 0.3 146 111 | 99 0 0.0 0 0 ||20 to 24 7,449 9.9 4,202 3,247 |60 to 64 1,028 1.4 512 516 |100-104 1 0.0 0 1 || 20 1,371 1.8 739 632 | 60 245 0.3 111 134 |105-109 0 0.0 0 0 || 21 1,462 1.9 835 627 | 61 188 0.3 103 85 |110 plus 0 0.0 0 0 || 22 1,464 1.9 809 655 | 62 228 0.3 116 112 | || 23 1,525 2.0 874 651 | 63 181 0.2 82 99 | || 24 1,627 2.2 945 682 | 64 186 0.2 100 86 |0 to 14 21,220 28.2 10,995 10,225 ||25 to 29 8,842 11.8 5,102 3,740 |65 to 69 603 0.8 301 302 |5 to 17 16,913 22.5 8,786 8,127 || 25 1,773 2.4 1,033 740 | 65 158 0.2 78 80 |18 to 21 5,274 7.0 2,870 2,404 || 26 1,770 2.4 1,005 765 | 66 129 0.2 71 58 |18 to 24 9,890 13.2 5,498 4,392 || 27 1,728 2.3 987 741 | 67 125 0.2 55 70 |18 to 64 48,944 65.1 27,655 21,289 || 28 1,763 2.3 1,013 750 | 68 95 0.1 47 48 |25 to 64 39,054 52.0 22,157 16,897 || 29 1,808 2.4 1,064 744 | 69 96 0.1 50 46 |60 plus 2,398 3.2 1,155 1,243 ||30 to 34 8,591 11.4 4,919 3,672 |70 to 74 335 0.4 160 175 |65 plus 1,370 1.8 643 727 || 30 1,853 2.5 1,049 804 | 70 80 0.1 41 39 |70 plus 767 1.0 342 425 || 31 1,687 2.2 942 745 | 71 79 0.1 40 39 |75 plus 432 0.6 182 250 || 32 1,695 2.3 948 747 | 72 77 0.1 31 46 |80 plus 216 0.3 78 138 || 33 1,694 2.3 982 712 | 73 54 0.1 26 28 |85 plus 105 0.1 38 67 || 34 1,662 2.2 998 664 | 74 45 0.1 22 23 |90 plus 29 0.0 8 21 ||35 to 39 7,155 9.5 4,040 3,115 |75 to 79 216 0.3 104 112 | || 35 1,582 2.1 899 683 | 75 48 0.1 21 27 | || 36 1,416 1.9 792 624 | 76 49 0.1 23 26 |All Ages 75,154 100.0 41,182 33,972 || 37 1,440 1.9 809 631 | 77 47 0.1 23 24 | || 38 1,377 1.8 791 586 | 78 42 0.1 22 20 |Median Age Both Sexes Male Female || 39 1,340 1.8 749 591 | 79 30 0.0 15 15 | By Sex 26.6 27.2 25.9 || | | || | | || |+===================================================================================================================================================+Source: Census 2010 Summary File 1 [machine-readable data file]/Prepared by the U.S.Census Bureau, 2011. 06NOV12 Page 18 Prepared by: Washington State Office of Financial Management, Forecasting Division.
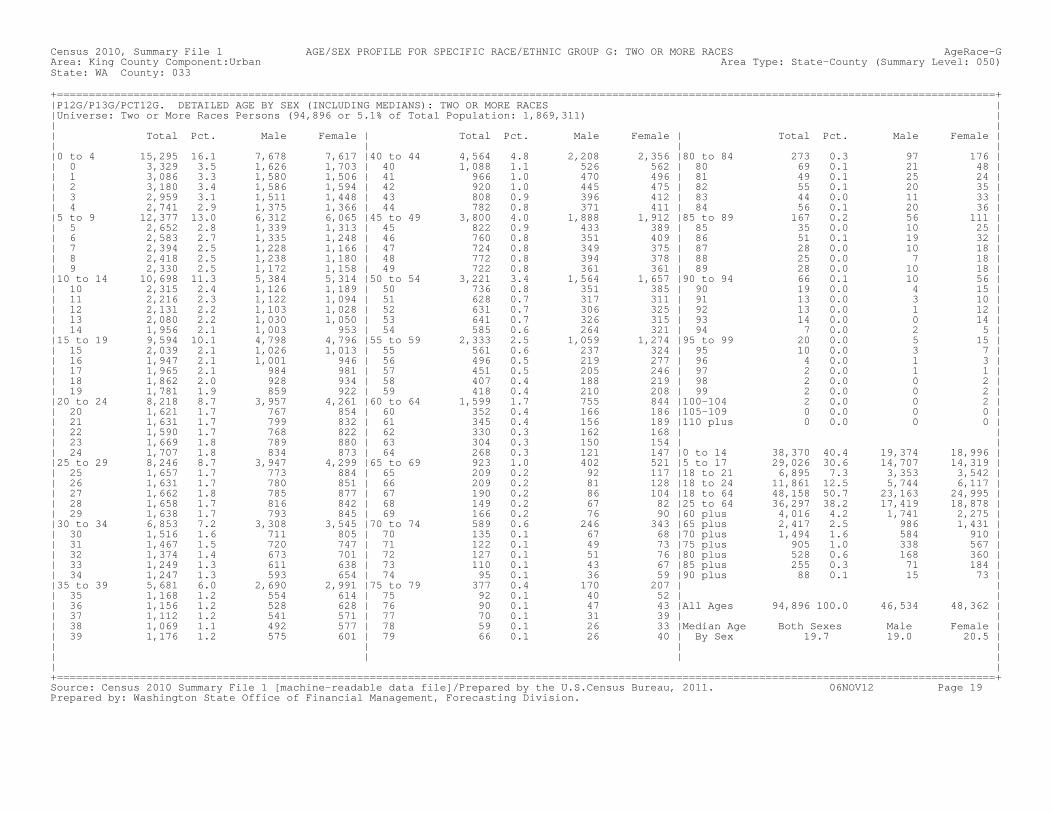
Census 2010, Summary File 1 AGE/SEX PROFILE FOR SPECIFIC RACE/ETHNIC GROUP G: TWO OR MORE RACES AgeRace-GArea: King County Component:Urban Area Type: State-County (Summary Level: 050)State: WA County: 033 +===================================================================================================================================================+|P12G/P13G/PCT12G. DETAILED AGE BY SEX (INCLUDING MEDIANS): TWO OR MORE RACES ||Universe: Two or More Races Persons (94,896 or 5.1% of Total Population: 1,869,311) || || Total Pct. Male Female | Total Pct. Male Female | Total Pct. Male Female || | | ||0 to 4 15,295 16.1 7,678 7,617 |40 to 44 4,564 4.8 2,208 2,356 |80 to 84 273 0.3 97 176 || 0 3,329 3.5 1,626 1,703 | 40 1,088 1.1 526 562 | 80 69 0.1 21 48 || 1 3,086 3.3 1,580 1,506 | 41 966 1.0 470 496 | 81 49 0.1 25 24 || 2 3,180 3.4 1,586 1,594 | 42 920 1.0 445 475 | 82 55 0.1 20 35 || 3 2,959 3.1 1,511 1,448 | 43 808 0.9 396 412 | 83 44 0.0 11 33 || 4 2,741 2.9 1,375 1,366 | 44 782 0.8 371 411 | 84 56 0.1 20 36 ||5 to 9 12,377 13.0 6,312 6,065 |45 to 49 3,800 4.0 1,888 1,912 |85 to 89 167 0.2 56 111 || 5 2,652 2.8 1,339 1,313 | 45 822 0.9 433 389 | 85 35 0.0 10 25 || 6 2,583 2.7 1,335 1,248 | 46 760 0.8 351 409 | 86 51 0.1 19 32 || 7 2,394 2.5 1,228 1,166 | 47 724 0.8 349 375 | 87 28 0.0 10 18 || 8 2,418 2.5 1,238 1,180 | 48 772 0.8 394 378 | 88 25 0.0 7 18 || 9 2,330 2.5 1,172 1,158 | 49 722 0.8 361 361 | 89 28 0.0 10 18 ||10 to 14 10,698 11.3 5,384 5,314 |50 to 54 3,221 3.4 1,564 1,657 |90 to 94 66 0.1 10 56 || 10 2,315 2.4 1,126 1,189 | 50 736 0.8 351 385 | 90 19 0.0 4 15 || 11 2,216 2.3 1,122 1,094 | 51 628 0.7 317 311 | 91 13 0.0 3 10 || 12 2,131 2.2 1,103 1,028 | 52 631 0.7 306 325 | 92 13 0.0 1 12 || 13 2,080 2.2 1,030 1,050 | 53 641 0.7 326 315 | 93 14 0.0 0 14 || 14 1,956 2.1 1,003 953 | 54 585 0.6 264 321 | 94 7 0.0 2 5 ||15 to 19 9,594 10.1 4,798 4,796 |55 to 59 2,333 2.5 1,059 1,274 |95 to 99 20 0.0 5 15 || 15 2,039 2.1 1,026 1,013 | 55 561 0.6 237 324 | 95 10 0.0 3 7 || 16 1,947 2.1 1,001 946 | 56 496 0.5 219 277 | 96 4 0.0 1 3 || 17 1,965 2.1 984 981 | 57 451 0.5 205 246 | 97 2 0.0 1 1 || 18 1,862 2.0 928 934 | 58 407 0.4 188 219 | 98 2 0.0 0 2 || 19 1,781 1.9 859 922 | 59 418 0.4 210 208 | 99 2 0.0 0 2 ||20 to 24 8,218 8.7 3,957 4,261 |60 to 64 1,599 1.7 755 844 |100-104 2 0.0 0 2 || 20 1,621 1.7 767 854 | 60 352 0.4 166 186 |105-109 0 0.0 0 0 || 21 1,631 1.7 799 832 | 61 345 0.4 156 189 |110 plus 0 0.0 0 0 || 22 1,590 1.7 768 822 | 62 330 0.3 162 168 | || 23 1,669 1.8 789 880 | 63 304 0.3 150 154 | || 24 1,707 1.8 834 873 | 64 268 0.3 121 147 |0 to 14 38,370 40.4 19,374 18,996 ||25 to 29 8,246 8.7 3,947 4,299 |65 to 69 923 1.0 402 521 |5 to 17 29,026 30.6 14,707 14,319 || 25 1,657 1.7 773 884 | 65 209 0.2 92 117 |18 to 21 6,895 7.3 3,353 3,542 || 26 1,631 1.7 780 851 | 66 209 0.2 81 128 |18 to 24 11,861 12.5 5,744 6,117 || 27 1,662 1.8 785 877 | 67 190 0.2 86 104 |18 to 64 48,158 50.7 23,163 24,995 || 28 1,658 1.7 816 842 | 68 149 0.2 67 82 |25 to 64 36,297 38.2 17,419 18,878 || 29 1,638 1.7 793 845 | 69 166 0.2 76 90 |60 plus 4,016 4.2 1,741 2,275 ||30 to 34 6,853 7.2 3,308 3,545 |70 to 74 589 0.6 246 343 |65 plus 2,417 2.5 986 1,431 || 30 1,516 1.6 711 805 | 70 135 0.1 67 68 |70 plus 1,494 1.6 584 910 || 31 1,467 1.5 720 747 | 71 122 0.1 49 73 |75 plus 905 1.0 338 567 || 32 1,374 1.4 673 701 | 72 127 0.1 51 76 |80 plus 528 0.6 168 360 || 33 1,249 1.3 611 638 | 73 110 0.1 43 67 |85 plus 255 0.3 71 184 || 34 1,247 1.3 593 654 | 74 95 0.1 36 59 |90 plus 88 0.1 15 73 ||35 to 39 5,681 6.0 2,690 2,991 |75 to 79 377 0.4 170 207 | || 35 1,168 1.2 554 614 | 75 92 0.1 40 52 | || 36 1,156 1.2 528 628 | 76 90 0.1 47 43 |All Ages 94,896 100.0 46,534 48,362 || 37 1,112 1.2 541 571 | 77 70 0.1 31 39 | || 38 1,069 1.1 492 577 | 78 59 0.1 26 33 |Median Age Both Sexes Male Female || 39 1,176 1.2 575 601 | 79 66 0.1 26 40 | By Sex 19.7 19.0 20.5 || | | || | | || |+===================================================================================================================================================+Source: Census 2010 Summary File 1 [machine-readable data file]/Prepared by the U.S.Census Bureau, 2011. 06NOV12 Page 19 Prepared by: Washington State Office of Financial Management, Forecasting Division.

Census 2010, Summary File 1 AGE/SEX PROFILE FOR SPECIFIC RACE/ETHNIC GROUP H: HISPANIC OR LATINO OF ANY RACE AgeRace-HArea: King County Component:Urban Area Type: State-County (Summary Level: 050)State: WA County: 033 +===================================================================================================================================================+|P12H/P13H/PCT12H. DETAILED AGE BY SEX (INCLUDING MEDIANS): HISPANIC OR LATINO OF ANY RACE ||Universe: Hispanic or Latino of Any Race Persons (169,794 or 9.1% of Total Population: 1,869,311) || || Total Pct. Male Female | Total Pct. Male Female | Total Pct. Male Female || | | ||0 to 4 19,483 11.5 9,983 9,500 |40 to 44 11,854 7.0 6,503 5,351 |80 to 84 465 0.3 167 298 || 0 4,073 2.4 2,070 2,003 | 40 2,788 1.6 1,554 1,234 | 80 100 0.1 33 67 || 1 3,953 2.3 2,040 1,913 | 41 2,525 1.5 1,378 1,147 | 81 81 0.0 25 56 || 2 3,956 2.3 2,036 1,920 | 42 2,410 1.4 1,287 1,123 | 82 98 0.1 37 61 || 3 3,867 2.3 1,967 1,900 | 43 2,115 1.2 1,161 954 | 83 89 0.1 36 53 || 4 3,634 2.1 1,870 1,764 | 44 2,016 1.2 1,123 893 | 84 97 0.1 36 61 ||5 to 9 16,431 9.7 8,404 8,027 |45 to 49 8,881 5.2 4,834 4,047 |85 to 89 282 0.2 100 182 || 5 3,493 2.1 1,750 1,743 | 45 2,022 1.2 1,122 900 | 85 73 0.0 28 45 || 6 3,405 2.0 1,773 1,632 | 46 1,860 1.1 1,026 834 | 86 64 0.0 28 36 || 7 3,227 1.9 1,649 1,578 | 47 1,804 1.1 979 825 | 87 55 0.0 20 35 || 8 3,207 1.9 1,664 1,543 | 48 1,690 1.0 918 772 | 88 41 0.0 11 30 || 9 3,099 1.8 1,568 1,531 | 49 1,505 0.9 789 716 | 89 49 0.0 13 36 ||10 to 14 14,407 8.5 7,411 6,996 |50 to 54 6,447 3.8 3,465 2,982 |90 to 94 109 0.1 28 81 || 10 3,060 1.8 1,581 1,479 | 50 1,518 0.9 817 701 | 90 38 0.0 12 26 || 11 2,957 1.7 1,484 1,473 | 51 1,348 0.8 715 633 | 91 27 0.0 9 18 || 12 2,920 1.7 1,471 1,449 | 52 1,289 0.8 694 595 | 92 23 0.0 3 20 || 13 2,790 1.6 1,478 1,312 | 53 1,219 0.7 664 555 | 93 11 0.0 0 11 || 14 2,680 1.6 1,397 1,283 | 54 1,073 0.6 575 498 | 94 10 0.0 4 6 ||15 to 19 13,374 7.9 6,909 6,465 |55 to 59 4,396 2.6 2,266 2,130 |95 to 99 37 0.0 7 30 || 15 2,587 1.5 1,345 1,242 | 55 1,114 0.7 589 525 | 95 14 0.0 2 12 || 16 2,680 1.6 1,384 1,296 | 56 934 0.6 465 469 | 96 10 0.0 2 8 || 17 2,702 1.6 1,370 1,332 | 57 874 0.5 451 423 | 97 5 0.0 0 5 || 18 2,641 1.6 1,367 1,274 | 58 770 0.5 388 382 | 98 3 0.0 1 2 || 19 2,764 1.6 1,443 1,321 | 59 704 0.4 373 331 | 99 5 0.0 2 3 ||20 to 24 15,574 9.2 8,458 7,116 |60 to 64 3,028 1.8 1,479 1,549 |100-104 3 0.0 0 3 || 20 2,842 1.7 1,505 1,337 | 60 701 0.4 321 380 |105-109 1 0.0 0 1 || 21 2,997 1.8 1,655 1,342 | 61 612 0.4 311 301 |110 plus 0 0.0 0 0 || 22 3,121 1.8 1,672 1,449 | 62 630 0.4 316 314 | || 23 3,250 1.9 1,768 1,482 | 63 575 0.3 276 299 | || 24 3,364 2.0 1,858 1,506 | 64 510 0.3 255 255 |0 to 14 50,321 29.6 25,798 24,523 ||25 to 29 18,447 10.9 10,193 8,254 |65 to 69 1,858 1.1 894 964 |5 to 17 38,807 22.9 19,914 18,893 || 25 3,646 2.1 2,047 1,599 | 65 455 0.3 221 234 |18 to 21 11,244 6.6 5,970 5,274 || 26 3,606 2.1 1,994 1,612 | 66 452 0.3 237 215 |18 to 24 20,979 12.4 11,268 9,711 || 27 3,697 2.2 1,980 1,717 | 67 349 0.2 152 197 |18 to 64 106,923 63.0 57,996 48,927 || 28 3,721 2.2 2,038 1,683 | 68 304 0.2 141 163 |25 to 64 85,944 50.6 46,728 39,216 || 29 3,777 2.2 2,134 1,643 | 69 298 0.2 143 155 |60 plus 7,609 4.5 3,505 4,104 ||30 to 34 17,600 10.4 9,588 8,012 |70 to 74 1,071 0.6 482 589 |65 plus 4,581 2.7 2,026 2,555 || 30 3,831 2.3 2,079 1,752 | 70 249 0.1 119 130 |70 plus 2,723 1.6 1,132 1,591 || 31 3,490 2.1 1,868 1,622 | 71 221 0.1 104 117 |75 plus 1,652 1.0 650 1,002 || 32 3,449 2.0 1,881 1,568 | 72 239 0.1 100 139 |80 plus 897 0.5 302 595 || 33 3,409 2.0 1,867 1,542 | 73 180 0.1 75 105 |85 plus 432 0.3 135 297 || 34 3,421 2.0 1,893 1,528 | 74 182 0.1 84 98 |90 plus 150 0.1 35 115 ||35 to 39 15,291 9.0 8,400 6,891 |75 to 79 755 0.4 348 407 | || 35 3,292 1.9 1,813 1,479 | 75 189 0.1 82 107 | || 36 3,069 1.8 1,686 1,383 | 76 173 0.1 84 89 |All Ages 169,794 100.0 89,919 79,875 || 37 3,083 1.8 1,721 1,362 | 77 153 0.1 75 78 | || 38 2,915 1.7 1,557 1,358 | 78 118 0.1 58 60 |Median Age Both Sexes Male Female || 39 2,932 1.7 1,623 1,309 | 79 122 0.1 49 73 | By Sex 26.5 26.9 26.1 || | | || | | || |+===================================================================================================================================================+Source: Census 2010 Summary File 1 [machine-readable data file]/Prepared by the U.S.Census Bureau, 2011. 06NOV12 Page 20 Prepared by: Washington State Office of Financial Management, Forecasting Division.
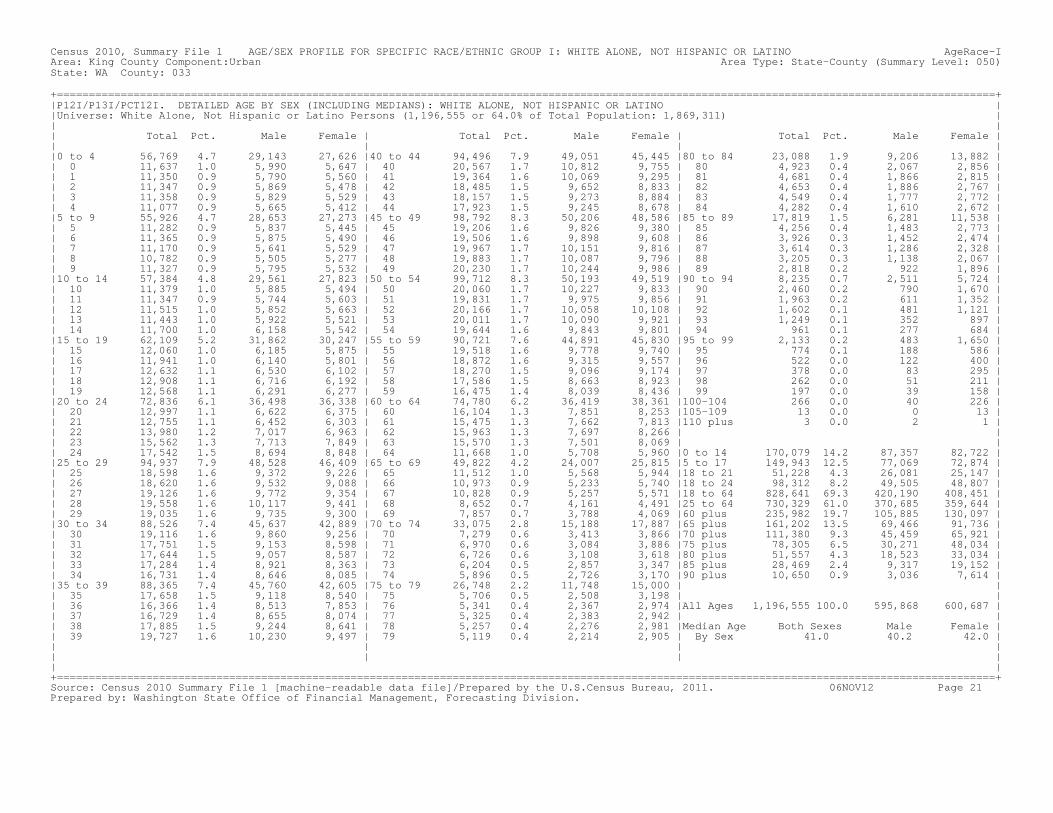
Census 2010, Summary File 1 AGE/SEX PROFILE FOR SPECIFIC RACE/ETHNIC GROUP I: WHITE ALONE, NOT HISPANIC OR LATINO AgeRace-IArea: King County Component:Urban Area Type: State-County (Summary Level: 050)State: WA County: 033 +===================================================================================================================================================+|P12I/P13I/PCT12I. DETAILED AGE BY SEX (INCLUDING MEDIANS): WHITE ALONE, NOT HISPANIC OR LATINO ||Universe: White Alone, Not Hispanic or Latino Persons (1,196,555 or 64.0% of Total Population: 1,869,311) || || Total Pct. Male Female | Total Pct. Male Female | Total Pct. Male Female || | | ||0 to 4 56,769 4.7 29,143 27,626 |40 to 44 94,496 7.9 49,051 45,445 |80 to 84 23,088 1.9 9,206 13,882 || 0 11,637 1.0 5,990 5,647 | 40 20,567 1.7 10,812 9,755 | 80 4,923 0.4 2,067 2,856 || 1 11,350 0.9 5,790 5,560 | 41 19,364 1.6 10,069 9,295 | 81 4,681 0.4 1,866 2,815 || 2 11,347 0.9 5,869 5,478 | 42 18,485 1.5 9,652 8,833 | 82 4,653 0.4 1,886 2,767 || 3 11,358 0.9 5,829 5,529 | 43 18,157 1.5 9,273 8,884 | 83 4,549 0.4 1,777 2,772 || 4 11,077 0.9 5,665 5,412 | 44 17,923 1.5 9,245 8,678 | 84 4,282 0.4 1,610 2,672 ||5 to 9 55,926 4.7 28,653 27,273 |45 to 49 98,792 8.3 50,206 48,586 |85 to 89 17,819 1.5 6,281 11,538 || 5 11,282 0.9 5,837 5,445 | 45 19,206 1.6 9,826 9,380 | 85 4,256 0.4 1,483 2,773 || 6 11,365 0.9 5,875 5,490 | 46 19,506 1.6 9,898 9,608 | 86 3,926 0.3 1,452 2,474 || 7 11,170 0.9 5,641 5,529 | 47 19,967 1.7 10,151 9,816 | 87 3,614 0.3 1,286 2,328 || 8 10,782 0.9 5,505 5,277 | 48 19,883 1.7 10,087 9,796 | 88 3,205 0.3 1,138 2,067 || 9 11,327 0.9 5,795 5,532 | 49 20,230 1.7 10,244 9,986 | 89 2,818 0.2 922 1,896 ||10 to 14 57,384 4.8 29,561 27,823 |50 to 54 99,712 8.3 50,193 49,519 |90 to 94 8,235 0.7 2,511 5,724 || 10 11,379 1.0 5,885 5,494 | 50 20,060 1.7 10,227 9,833 | 90 2,460 0.2 790 1,670 || 11 11,347 0.9 5,744 5,603 | 51 19,831 1.7 9,975 9,856 | 91 1,963 0.2 611 1,352 || 12 11,515 1.0 5,852 5,663 | 52 20,166 1.7 10,058 10,108 | 92 1,602 0.1 481 1,121 || 13 11,443 1.0 5,922 5,521 | 53 20,011 1.7 10,090 9,921 | 93 1,249 0.1 352 897 || 14 11,700 1.0 6,158 5,542 | 54 19,644 1.6 9,843 9,801 | 94 961 0.1 277 684 ||15 to 19 62,109 5.2 31,862 30,247 |55 to 59 90,721 7.6 44,891 45,830 |95 to 99 2,133 0.2 483 1,650 || 15 12,060 1.0 6,185 5,875 | 55 19,518 1.6 9,778 9,740 | 95 774 0.1 188 586 || 16 11,941 1.0 6,140 5,801 | 56 18,872 1.6 9,315 9,557 | 96 522 0.0 122 400 || 17 12,632 1.1 6,530 6,102 | 57 18,270 1.5 9,096 9,174 | 97 378 0.0 83 295 || 18 12,908 1.1 6,716 6,192 | 58 17,586 1.5 8,663 8,923 | 98 262 0.0 51 211 || 19 12,568 1.1 6,291 6,277 | 59 16,475 1.4 8,039 8,436 | 99 197 0.0 39 158 ||20 to 24 72,836 6.1 36,498 36,338 |60 to 64 74,780 6.2 36,419 38,361 |100-104 266 0.0 40 226 || 20 12,997 1.1 6,622 6,375 | 60 16,104 1.3 7,851 8,253 |105-109 13 0.0 0 13 || 21 12,755 1.1 6,452 6,303 | 61 15,475 1.3 7,662 7,813 |110 plus 3 0.0 2 1 || 22 13,980 1.2 7,017 6,963 | 62 15,963 1.3 7,697 8,266 | || 23 15,562 1.3 7,713 7,849 | 63 15,570 1.3 7,501 8,069 | || 24 17,542 1.5 8,694 8,848 | 64 11,668 1.0 5,708 5,960 |0 to 14 170,079 14.2 87,357 82,722 ||25 to 29 94,937 7.9 48,528 46,409 |65 to 69 49,822 4.2 24,007 25,815 |5 to 17 149,943 12.5 77,069 72,874 || 25 18,598 1.6 9,372 9,226 | 65 11,512 1.0 5,568 5,944 |18 to 21 51,228 4.3 26,081 25,147 || 26 18,620 1.6 9,532 9,088 | 66 10,973 0.9 5,233 5,740 |18 to 24 98,312 8.2 49,505 48,807 || 27 19,126 1.6 9,772 9,354 | 67 10,828 0.9 5,257 5,571 |18 to 64 828,641 69.3 420,190 408,451 || 28 19,558 1.6 10,117 9,441 | 68 8,652 0.7 4,161 4,491 |25 to 64 730,329 61.0 370,685 359,644 || 29 19,035 1.6 9,735 9,300 | 69 7,857 0.7 3,788 4,069 |60 plus 235,982 19.7 105,885 130,097 ||30 to 34 88,526 7.4 45,637 42,889 |70 to 74 33,075 2.8 15,188 17,887 |65 plus 161,202 13.5 69,466 91,736 || 30 19,116 1.6 9,860 9,256 | 70 7,279 0.6 3,413 3,866 |70 plus 111,380 9.3 45,459 65,921 || 31 17,751 1.5 9,153 8,598 | 71 6,970 0.6 3,084 3,886 |75 plus 78,305 6.5 30,271 48,034 || 32 17,644 1.5 9,057 8,587 | 72 6,726 0.6 3,108 3,618 |80 plus 51,557 4.3 18,523 33,034 || 33 17,284 1.4 8,921 8,363 | 73 6,204 0.5 2,857 3,347 |85 plus 28,469 2.4 9,317 19,152 || 34 16,731 1.4 8,646 8,085 | 74 5,896 0.5 2,726 3,170 |90 plus 10,650 0.9 3,036 7,614 ||35 to 39 88,365 7.4 45,760 42,605 |75 to 79 26,748 2.2 11,748 15,000 | || 35 17,658 1.5 9,118 8,540 | 75 5,706 0.5 2,508 3,198 | || 36 16,366 1.4 8,513 7,853 | 76 5,341 0.4 2,367 2,974 |All Ages 1,196,555 100.0 595,868 600,687 || 37 16,729 1.4 8,655 8,074 | 77 5,325 0.4 2,383 2,942 | || 38 17,885 1.5 9,244 8,641 | 78 5,257 0.4 2,276 2,981 |Median Age Both Sexes Male Female || 39 19,727 1.6 10,230 9,497 | 79 5,119 0.4 2,214 2,905 | By Sex 41.0 40.2 42.0 || | | || | | || |+===================================================================================================================================================+Source: Census 2010 Summary File 1 [machine-readable data file]/Prepared by the U.S.Census Bureau, 2011. 06NOV12 Page 21 Prepared by: Washington State Office of Financial Management, Forecasting Division.
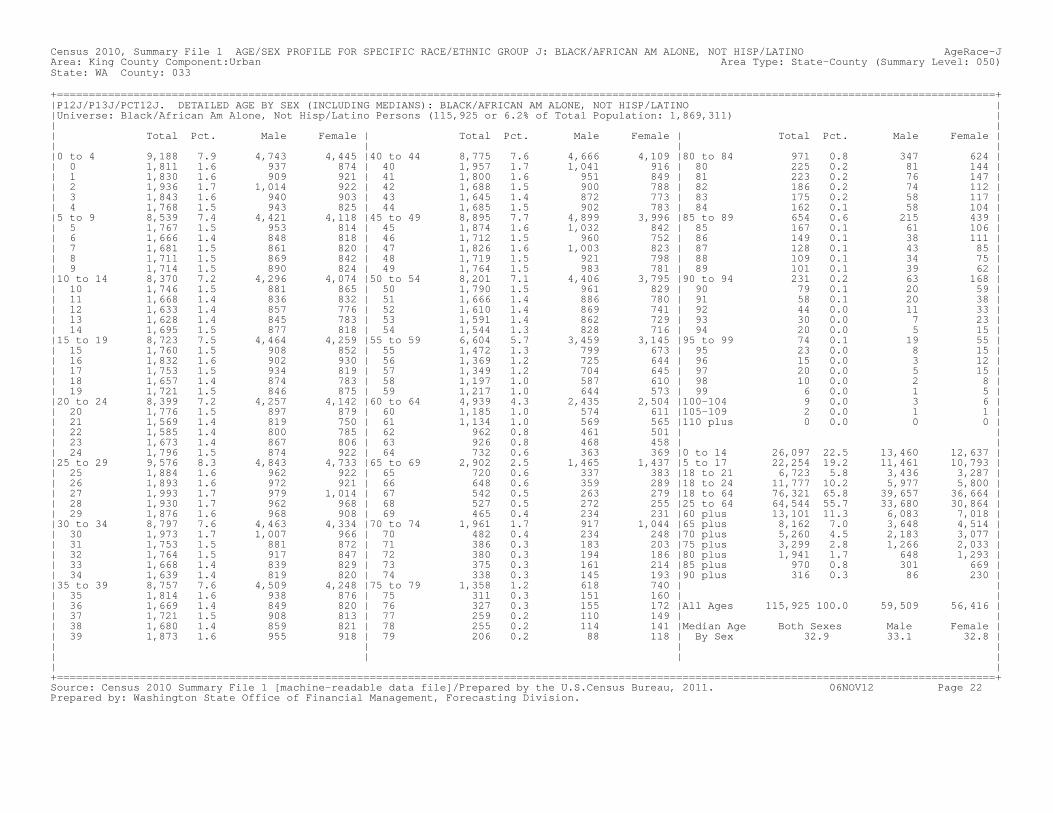
Census 2010, Summary File 1 AGE/SEX PROFILE FOR SPECIFIC RACE/ETHNIC GROUP J: BLACK/AFRICAN AM ALONE, NOT HISP/LATINO AgeRace-JArea: King County Component:Urban Area Type: State-County (Summary Level: 050)State: WA County: 033 +===================================================================================================================================================+|P12J/P13J/PCT12J. DETAILED AGE BY SEX (INCLUDING MEDIANS): BLACK/AFRICAN AM ALONE, NOT HISP/LATINO ||Universe: Black/African Am Alone, Not Hisp/Latino Persons (115,925 or 6.2% of Total Population: 1,869,311) || || Total Pct. Male Female | Total Pct. Male Female | Total Pct. Male Female || | | ||0 to 4 9,188 7.9 4,743 4,445 |40 to 44 8,775 7.6 4,666 4,109 |80 to 84 971 0.8 347 624 || 0 1,811 1.6 937 874 | 40 1,957 1.7 1,041 916 | 80 225 0.2 81 144 || 1 1,830 1.6 909 921 | 41 1,800 1.6 951 849 | 81 223 0.2 76 147 || 2 1,936 1.7 1,014 922 | 42 1,688 1.5 900 788 | 82 186 0.2 74 112 || 3 1,843 1.6 940 903 | 43 1,645 1.4 872 773 | 83 175 0.2 58 117 || 4 1,768 1.5 943 825 | 44 1,685 1.5 902 783 | 84 162 0.1 58 104 ||5 to 9 8,539 7.4 4,421 4,118 |45 to 49 8,895 7.7 4,899 3,996 |85 to 89 654 0.6 215 439 || 5 1,767 1.5 953 814 | 45 1,874 1.6 1,032 842 | 85 167 0.1 61 106 || 6 1,666 1.4 848 818 | 46 1,712 1.5 960 752 | 86 149 0.1 38 111 || 7 1,681 1.5 861 820 | 47 1,826 1.6 1,003 823 | 87 128 0.1 43 85 || 8 1,711 1.5 869 842 | 48 1,719 1.5 921 798 | 88 109 0.1 34 75 || 9 1,714 1.5 890 824 | 49 1,764 1.5 983 781 | 89 101 0.1 39 62 ||10 to 14 8,370 7.2 4,296 4,074 |50 to 54 8,201 7.1 4,406 3,795 |90 to 94 231 0.2 63 168 || 10 1,746 1.5 881 865 | 50 1,790 1.5 961 829 | 90 79 0.1 20 59 || 11 1,668 1.4 836 832 | 51 1,666 1.4 886 780 | 91 58 0.1 20 38 || 12 1,633 1.4 857 776 | 52 1,610 1.4 869 741 | 92 44 0.0 11 33 || 13 1,628 1.4 845 783 | 53 1,591 1.4 862 729 | 93 30 0.0 7 23 || 14 1,695 1.5 877 818 | 54 1,544 1.3 828 716 | 94 20 0.0 5 15 ||15 to 19 8,723 7.5 4,464 4,259 |55 to 59 6,604 5.7 3,459 3,145 |95 to 99 74 0.1 19 55 || 15 1,760 1.5 908 852 | 55 1,472 1.3 799 673 | 95 23 0.0 8 15 || 16 1,832 1.6 902 930 | 56 1,369 1.2 725 644 | 96 15 0.0 3 12 || 17 1,753 1.5 934 819 | 57 1,349 1.2 704 645 | 97 20 0.0 5 15 || 18 1,657 1.4 874 783 | 58 1,197 1.0 587 610 | 98 10 0.0 2 8 || 19 1,721 1.5 846 875 | 59 1,217 1.0 644 573 | 99 6 0.0 1 5 ||20 to 24 8,399 7.2 4,257 4,142 |60 to 64 4,939 4.3 2,435 2,504 |100-104 9 0.0 3 6 || 20 1,776 1.5 897 879 | 60 1,185 1.0 574 611 |105-109 2 0.0 1 1 || 21 1,569 1.4 819 750 | 61 1,134 1.0 569 565 |110 plus 0 0.0 0 0 || 22 1,585 1.4 800 785 | 62 962 0.8 461 501 | || 23 1,673 1.4 867 806 | 63 926 0.8 468 458 | || 24 1,796 1.5 874 922 | 64 732 0.6 363 369 |0 to 14 26,097 22.5 13,460 12,637 ||25 to 29 9,576 8.3 4,843 4,733 |65 to 69 2,902 2.5 1,465 1,437 |5 to 17 22,254 19.2 11,461 10,793 || 25 1,884 1.6 962 922 | 65 720 0.6 337 383 |18 to 21 6,723 5.8 3,436 3,287 || 26 1,893 1.6 972 921 | 66 648 0.6 359 289 |18 to 24 11,777 10.2 5,977 5,800 || 27 1,993 1.7 979 1,014 | 67 542 0.5 263 279 |18 to 64 76,321 65.8 39,657 36,664 || 28 1,930 1.7 962 968 | 68 527 0.5 272 255 |25 to 64 64,544 55.7 33,680 30,864 || 29 1,876 1.6 968 908 | 69 465 0.4 234 231 |60 plus 13,101 11.3 6,083 7,018 ||30 to 34 8,797 7.6 4,463 4,334 |70 to 74 1,961 1.7 917 1,044 |65 plus 8,162 7.0 3,648 4,514 || 30 1,973 1.7 1,007 966 | 70 482 0.4 234 248 |70 plus 5,260 4.5 2,183 3,077 || 31 1,753 1.5 881 872 | 71 386 0.3 183 203 |75 plus 3,299 2.8 1,266 2,033 || 32 1,764 1.5 917 847 | 72 380 0.3 194 186 |80 plus 1,941 1.7 648 1,293 || 33 1,668 1.4 839 829 | 73 375 0.3 161 214 |85 plus 970 0.8 301 669 || 34 1,639 1.4 819 820 | 74 338 0.3 145 193 |90 plus 316 0.3 86 230 ||35 to 39 8,757 7.6 4,509 4,248 |75 to 79 1,358 1.2 618 740 | || 35 1,814 1.6 938 876 | 75 311 0.3 151 160 | || 36 1,669 1.4 849 820 | 76 327 0.3 155 172 |All Ages 115,925 100.0 59,509 56,416 || 37 1,721 1.5 908 813 | 77 259 0.2 110 149 | || 38 1,680 1.4 859 821 | 78 255 0.2 114 141 |Median Age Both Sexes Male Female || 39 1,873 1.6 955 918 | 79 206 0.2 88 118 | By Sex 32.9 33.1 32.8 || | | || | | || |+===================================================================================================================================================+Source: Census 2010 Summary File 1 [machine-readable data file]/Prepared by the U.S.Census Bureau, 2011. 06NOV12 Page 22 Prepared by: Washington State Office of Financial Management, Forecasting Division.
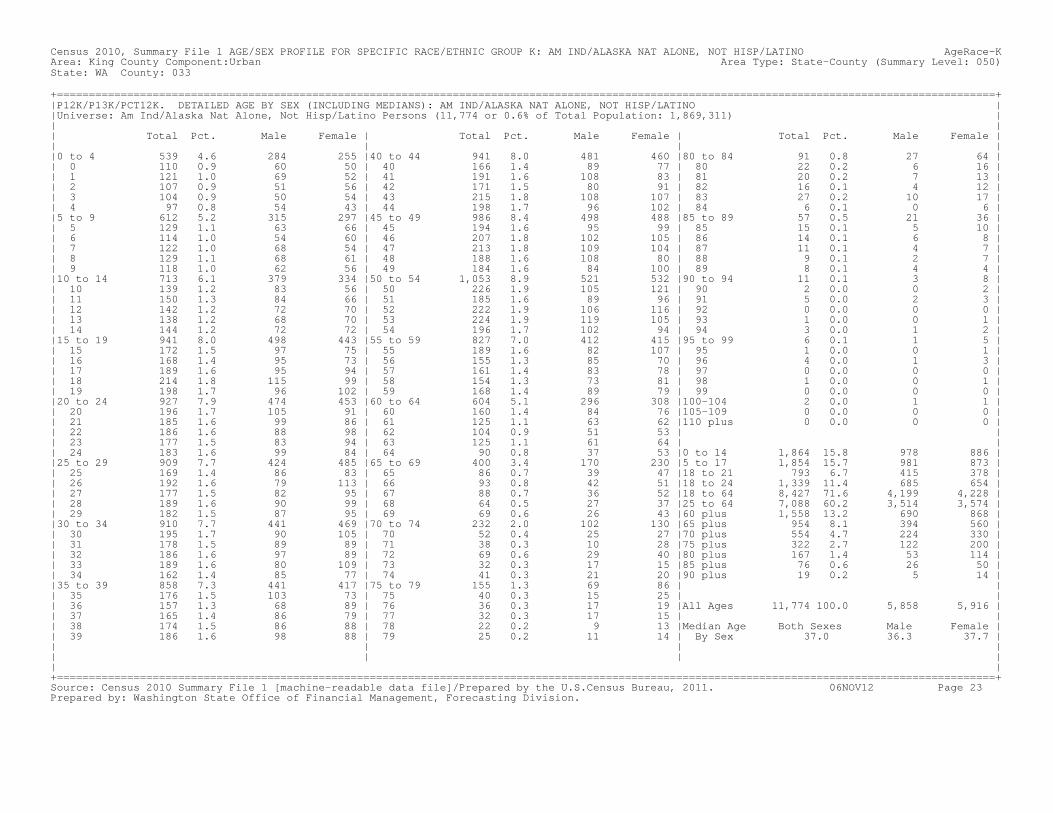
Census 2010, Summary File 1 AGE/SEX PROFILE FOR SPECIFIC RACE/ETHNIC GROUP K: AM IND/ALASKA NAT ALONE, NOT HISP/LATINO AgeRace-KArea: King County Component:Urban Area Type: State-County (Summary Level: 050)State: WA County: 033 +===================================================================================================================================================+|P12K/P13K/PCT12K. DETAILED AGE BY SEX (INCLUDING MEDIANS): AM IND/ALASKA NAT ALONE, NOT HISP/LATINO ||Universe: Am Ind/Alaska Nat Alone, Not Hisp/Latino Persons (11,774 or 0.6% of Total Population: 1,869,311) || || Total Pct. Male Female | Total Pct. Male Female | Total Pct. Male Female || | | ||0 to 4 539 4.6 284 255 |40 to 44 941 8.0 481 460 |80 to 84 91 0.8 27 64 || 0 110 0.9 60 50 | 40 166 1.4 89 77 | 80 22 0.2 6 16 || 1 121 1.0 69 52 | 41 191 1.6 108 83 | 81 20 0.2 7 13 || 2 107 0.9 51 56 | 42 171 1.5 80 91 | 82 16 0.1 4 12 || 3 104 0.9 50 54 | 43 215 1.8 108 107 | 83 27 0.2 10 17 || 4 97 0.8 54 43 | 44 198 1.7 96 102 | 84 6 0.1 0 6 ||5 to 9 612 5.2 315 297 |45 to 49 986 8.4 498 488 |85 to 89 57 0.5 21 36 || 5 129 1.1 63 66 | 45 194 1.6 95 99 | 85 15 0.1 5 10 || 6 114 1.0 54 60 | 46 207 1.8 102 105 | 86 14 0.1 6 8 || 7 122 1.0 68 54 | 47 213 1.8 109 104 | 87 11 0.1 4 7 || 8 129 1.1 68 61 | 48 188 1.6 108 80 | 88 9 0.1 2 7 || 9 118 1.0 62 56 | 49 184 1.6 84 100 | 89 8 0.1 4 4 ||10 to 14 713 6.1 379 334 |50 to 54 1,053 8.9 521 532 |90 to 94 11 0.1 3 8 || 10 139 1.2 83 56 | 50 226 1.9 105 121 | 90 2 0.0 0 2 || 11 150 1.3 84 66 | 51 185 1.6 89 96 | 91 5 0.0 2 3 || 12 142 1.2 72 70 | 52 222 1.9 106 116 | 92 0 0.0 0 0 || 13 138 1.2 68 70 | 53 224 1.9 119 105 | 93 1 0.0 0 1 || 14 144 1.2 72 72 | 54 196 1.7 102 94 | 94 3 0.0 1 2 ||15 to 19 941 8.0 498 443 |55 to 59 827 7.0 412 415 |95 to 99 6 0.1 1 5 || 15 172 1.5 97 75 | 55 189 1.6 82 107 | 95 1 0.0 0 1 || 16 168 1.4 95 73 | 56 155 1.3 85 70 | 96 4 0.0 1 3 || 17 189 1.6 95 94 | 57 161 1.4 83 78 | 97 0 0.0 0 0 || 18 214 1.8 115 99 | 58 154 1.3 73 81 | 98 1 0.0 0 1 || 19 198 1.7 96 102 | 59 168 1.4 89 79 | 99 0 0.0 0 0 ||20 to 24 927 7.9 474 453 |60 to 64 604 5.1 296 308 |100-104 2 0.0 1 1 || 20 196 1.7 105 91 | 60 160 1.4 84 76 |105-109 0 0.0 0 0 || 21 185 1.6 99 86 | 61 125 1.1 63 62 |110 plus 0 0.0 0 0 || 22 186 1.6 88 98 | 62 104 0.9 51 53 | || 23 177 1.5 83 94 | 63 125 1.1 61 64 | || 24 183 1.6 99 84 | 64 90 0.8 37 53 |0 to 14 1,864 15.8 978 886 ||25 to 29 909 7.7 424 485 |65 to 69 400 3.4 170 230 |5 to 17 1,854 15.7 981 873 || 25 169 1.4 86 83 | 65 86 0.7 39 47 |18 to 21 793 6.7 415 378 || 26 192 1.6 79 113 | 66 93 0.8 42 51 |18 to 24 1,339 11.4 685 654 || 27 177 1.5 82 95 | 67 88 0.7 36 52 |18 to 64 8,427 71.6 4,199 4,228 || 28 189 1.6 90 99 | 68 64 0.5 27 37 |25 to 64 7,088 60.2 3,514 3,574 || 29 182 1.5 87 95 | 69 69 0.6 26 43 |60 plus 1,558 13.2 690 868 ||30 to 34 910 7.7 441 469 |70 to 74 232 2.0 102 130 |65 plus 954 8.1 394 560 || 30 195 1.7 90 105 | 70 52 0.4 25 27 |70 plus 554 4.7 224 330 || 31 178 1.5 89 89 | 71 38 0.3 10 28 |75 plus 322 2.7 122 200 || 32 186 1.6 97 89 | 72 69 0.6 29 40 |80 plus 167 1.4 53 114 || 33 189 1.6 80 109 | 73 32 0.3 17 15 |85 plus 76 0.6 26 50 || 34 162 1.4 85 77 | 74 41 0.3 21 20 |90 plus 19 0.2 5 14 ||35 to 39 858 7.3 441 417 |75 to 79 155 1.3 69 86 | || 35 176 1.5 103 73 | 75 40 0.3 15 25 | || 36 157 1.3 68 89 | 76 36 0.3 17 19 |All Ages 11,774 100.0 5,858 5,916 || 37 165 1.4 86 79 | 77 32 0.3 17 15 | || 38 174 1.5 86 88 | 78 22 0.2 9 13 |Median Age Both Sexes Male Female || 39 186 1.6 98 88 | 79 25 0.2 11 14 | By Sex 37.0 36.3 37.7 || | | || | | || |+===================================================================================================================================================+Source: Census 2010 Summary File 1 [machine-readable data file]/Prepared by the U.S.Census Bureau, 2011. 06NOV12 Page 23 Prepared by: Washington State Office of Financial Management, Forecasting Division.
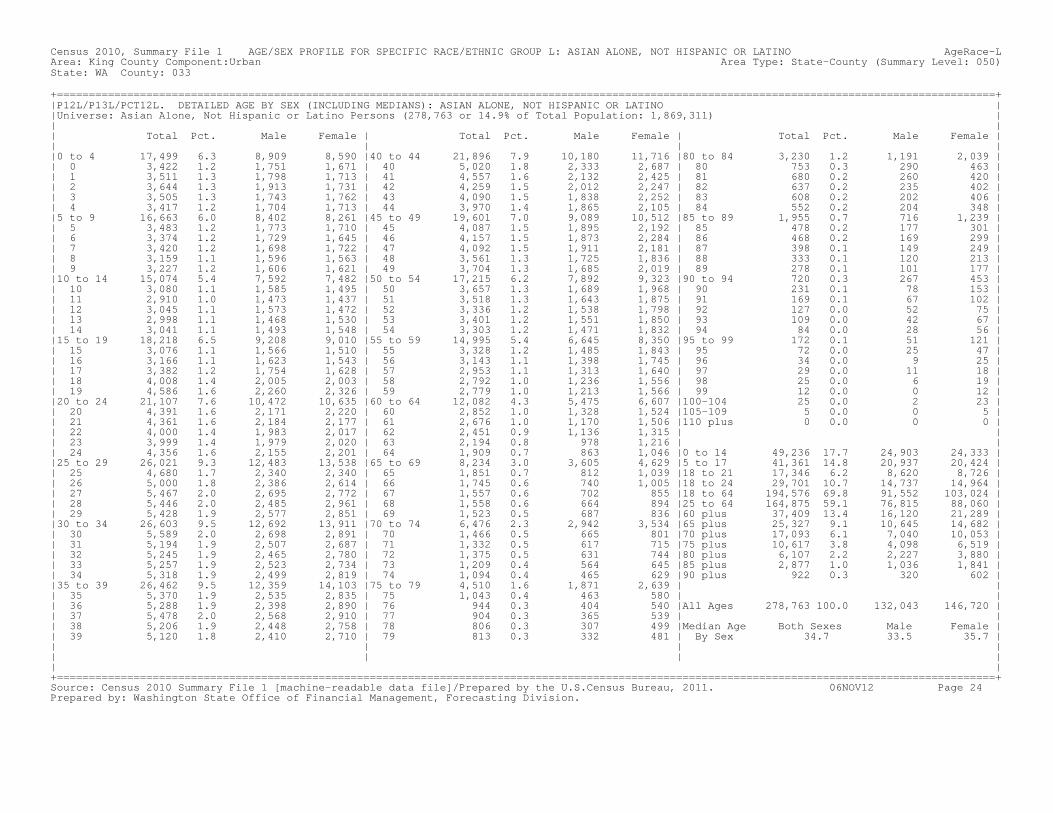
Census 2010, Summary File 1 AGE/SEX PROFILE FOR SPECIFIC RACE/ETHNIC GROUP L: ASIAN ALONE, NOT HISPANIC OR LATINO AgeRace-LArea: King County Component:Urban Area Type: State-County (Summary Level: 050)State: WA County: 033 +===================================================================================================================================================+|P12L/P13L/PCT12L. DETAILED AGE BY SEX (INCLUDING MEDIANS): ASIAN ALONE, NOT HISPANIC OR LATINO ||Universe: Asian Alone, Not Hispanic or Latino Persons (278,763 or 14.9% of Total Population: 1,869,311) || || Total Pct. Male Female | Total Pct. Male Female | Total Pct. Male Female || | | ||0 to 4 17,499 6.3 8,909 8,590 |40 to 44 21,896 7.9 10,180 11,716 |80 to 84 3,230 1.2 1,191 2,039 || 0 3,422 1.2 1,751 1,671 | 40 5,020 1.8 2,333 2,687 | 80 753 0.3 290 463 || 1 3,511 1.3 1,798 1,713 | 41 4,557 1.6 2,132 2,425 | 81 680 0.2 260 420 || 2 3,644 1.3 1,913 1,731 | 42 4,259 1.5 2,012 2,247 | 82 637 0.2 235 402 || 3 3,505 1.3 1,743 1,762 | 43 4,090 1.5 1,838 2,252 | 83 608 0.2 202 406 || 4 3,417 1.2 1,704 1,713 | 44 3,970 1.4 1,865 2,105 | 84 552 0.2 204 348 ||5 to 9 16,663 6.0 8,402 8,261 |45 to 49 19,601 7.0 9,089 10,512 |85 to 89 1,955 0.7 716 1,239 || 5 3,483 1.2 1,773 1,710 | 45 4,087 1.5 1,895 2,192 | 85 478 0.2 177 301 || 6 3,374 1.2 1,729 1,645 | 46 4,157 1.5 1,873 2,284 | 86 468 0.2 169 299 || 7 3,420 1.2 1,698 1,722 | 47 4,092 1.5 1,911 2,181 | 87 398 0.1 149 249 || 8 3,159 1.1 1,596 1,563 | 48 3,561 1.3 1,725 1,836 | 88 333 0.1 120 213 || 9 3,227 1.2 1,606 1,621 | 49 3,704 1.3 1,685 2,019 | 89 278 0.1 101 177 ||10 to 14 15,074 5.4 7,592 7,482 |50 to 54 17,215 6.2 7,892 9,323 |90 to 94 720 0.3 267 453 || 10 3,080 1.1 1,585 1,495 | 50 3,657 1.3 1,689 1,968 | 90 231 0.1 78 153 || 11 2,910 1.0 1,473 1,437 | 51 3,518 1.3 1,643 1,875 | 91 169 0.1 67 102 || 12 3,045 1.1 1,573 1,472 | 52 3,336 1.2 1,538 1,798 | 92 127 0.0 52 75 || 13 2,998 1.1 1,468 1,530 | 53 3,401 1.2 1,551 1,850 | 93 109 0.0 42 67 || 14 3,041 1.1 1,493 1,548 | 54 3,303 1.2 1,471 1,832 | 94 84 0.0 28 56 ||15 to 19 18,218 6.5 9,208 9,010 |55 to 59 14,995 5.4 6,645 8,350 |95 to 99 172 0.1 51 121 || 15 3,076 1.1 1,566 1,510 | 55 3,328 1.2 1,485 1,843 | 95 72 0.0 25 47 || 16 3,166 1.1 1,623 1,543 | 56 3,143 1.1 1,398 1,745 | 96 34 0.0 9 25 || 17 3,382 1.2 1,754 1,628 | 57 2,953 1.1 1,313 1,640 | 97 29 0.0 11 18 || 18 4,008 1.4 2,005 2,003 | 58 2,792 1.0 1,236 1,556 | 98 25 0.0 6 19 || 19 4,586 1.6 2,260 2,326 | 59 2,779 1.0 1,213 1,566 | 99 12 0.0 0 12 ||20 to 24 21,107 7.6 10,472 10,635 |60 to 64 12,082 4.3 5,475 6,607 |100-104 25 0.0 2 23 || 20 4,391 1.6 2,171 2,220 | 60 2,852 1.0 1,328 1,524 |105-109 5 0.0 0 5 || 21 4,361 1.6 2,184 2,177 | 61 2,676 1.0 1,170 1,506 |110 plus 0 0.0 0 0 || 22 4,000 1.4 1,983 2,017 | 62 2,451 0.9 1,136 1,315 | || 23 3,999 1.4 1,979 2,020 | 63 2,194 0.8 978 1,216 | || 24 4,356 1.6 2,155 2,201 | 64 1,909 0.7 863 1,046 |0 to 14 49,236 17.7 24,903 24,333 ||25 to 29 26,021 9.3 12,483 13,538 |65 to 69 8,234 3.0 3,605 4,629 |5 to 17 41,361 14.8 20,937 20,424 || 25 4,680 1.7 2,340 2,340 | 65 1,851 0.7 812 1,039 |18 to 21 17,346 6.2 8,620 8,726 || 26 5,000 1.8 2,386 2,614 | 66 1,745 0.6 740 1,005 |18 to 24 29,701 10.7 14,737 14,964 || 27 5,467 2.0 2,695 2,772 | 67 1,557 0.6 702 855 |18 to 64 194,576 69.8 91,552 103,024 || 28 5,446 2.0 2,485 2,961 | 68 1,558 0.6 664 894 |25 to 64 164,875 59.1 76,815 88,060 || 29 5,428 1.9 2,577 2,851 | 69 1,523 0.5 687 836 |60 plus 37,409 13.4 16,120 21,289 ||30 to 34 26,603 9.5 12,692 13,911 |70 to 74 6,476 2.3 2,942 3,534 |65 plus 25,327 9.1 10,645 14,682 || 30 5,589 2.0 2,698 2,891 | 70 1,466 0.5 665 801 |70 plus 17,093 6.1 7,040 10,053 || 31 5,194 1.9 2,507 2,687 | 71 1,332 0.5 617 715 |75 plus 10,617 3.8 4,098 6,519 || 32 5,245 1.9 2,465 2,780 | 72 1,375 0.5 631 744 |80 plus 6,107 2.2 2,227 3,880 || 33 5,257 1.9 2,523 2,734 | 73 1,209 0.4 564 645 |85 plus 2,877 1.0 1,036 1,841 || 34 5,318 1.9 2,499 2,819 | 74 1,094 0.4 465 629 |90 plus 922 0.3 320 602 ||35 to 39 26,462 9.5 12,359 14,103 |75 to 79 4,510 1.6 1,871 2,639 | || 35 5,370 1.9 2,535 2,835 | 75 1,043 0.4 463 580 | || 36 5,288 1.9 2,398 2,890 | 76 944 0.3 404 540 |All Ages 278,763 100.0 132,043 146,720 || 37 5,478 2.0 2,568 2,910 | 77 904 0.3 365 539 | || 38 5,206 1.9 2,448 2,758 | 78 806 0.3 307 499 |Median Age Both Sexes Male Female || 39 5,120 1.8 2,410 2,710 | 79 813 0.3 332 481 | By Sex 34.7 33.5 35.7 || | | || | | || |+===================================================================================================================================================+Source: Census 2010 Summary File 1 [machine-readable data file]/Prepared by the U.S.Census Bureau, 2011. 06NOV12 Page 24 Prepared by: Washington State Office of Financial Management, Forecasting Division.

Census 2010, Summary File 1 AGE/SEX PROFILE FOR SPECIFIC RACE/ETHNIC GROUP M: NAT HAWAIIAN/OPI ALONE, NOT HISP/LATINO AgeRace-MArea: King County Component:Urban Area Type: State-County (Summary Level: 050)State: WA County: 033 +===================================================================================================================================================+|P12M/P13M/PCT12M. DETAILED AGE BY SEX (INCLUDING MEDIANS): NAT HAWAIIAN/OPI ALONE, NOT HISP/LATINO ||Universe: Nat Hawaiian/OPI Alone, Not Hisp/Latino Persons (13,999 or 0.7% of Total Population: 1,869,311) || || Total Pct. Male Female | Total Pct. Male Female | Total Pct. Male Female || | | ||0 to 4 1,296 9.3 670 626 |40 to 44 890 6.4 441 449 |80 to 84 43 0.3 15 28 || 0 247 1.8 115 132 | 40 209 1.5 112 97 | 80 12 0.1 4 8 || 1 265 1.9 145 120 | 41 174 1.2 77 97 | 81 9 0.1 3 6 || 2 248 1.8 128 120 | 42 154 1.1 78 76 | 82 11 0.1 2 9 || 3 269 1.9 144 125 | 43 167 1.2 84 83 | 83 6 0.0 5 1 || 4 267 1.9 138 129 | 44 186 1.3 90 96 | 84 5 0.0 1 4 ||5 to 9 1,135 8.1 555 580 |45 to 49 937 6.7 452 485 |85 to 89 20 0.1 2 18 || 5 210 1.5 110 100 | 45 209 1.5 100 109 | 85 5 0.0 1 4 || 6 218 1.6 109 109 | 46 169 1.2 86 83 | 86 3 0.0 0 3 || 7 240 1.7 111 129 | 47 194 1.4 87 107 | 87 6 0.0 1 5 || 8 222 1.6 107 115 | 48 168 1.2 74 94 | 88 4 0.0 0 4 || 9 245 1.8 118 127 | 49 197 1.4 105 92 | 89 2 0.0 0 2 ||10 to 14 1,191 8.5 624 567 |50 to 54 773 5.5 375 398 |90 to 94 6 0.0 4 2 || 10 230 1.6 121 109 | 50 176 1.3 91 85 | 90 3 0.0 2 1 || 11 242 1.7 131 111 | 51 162 1.2 73 89 | 91 2 0.0 1 1 || 12 260 1.9 139 121 | 52 168 1.2 72 96 | 92 0 0.0 0 0 || 13 236 1.7 122 114 | 53 133 1.0 74 59 | 93 1 0.0 1 0 || 14 223 1.6 111 112 | 54 134 1.0 65 69 | 94 0 0.0 0 0 ||15 to 19 1,291 9.2 623 668 |55 to 59 524 3.7 268 256 |95 to 99 0 0.0 0 0 || 15 241 1.7 129 112 | 55 117 0.8 65 52 | 95 0 0.0 0 0 || 16 276 2.0 126 150 | 56 103 0.7 54 49 | 96 0 0.0 0 0 || 17 262 1.9 132 130 | 57 124 0.9 63 61 | 97 0 0.0 0 0 || 18 259 1.9 110 149 | 58 97 0.7 48 49 | 98 0 0.0 0 0 || 19 253 1.8 126 127 | 59 83 0.6 38 45 | 99 0 0.0 0 0 ||20 to 24 1,432 10.2 715 717 |60 to 64 358 2.6 184 174 |100-104 0 0.0 0 0 || 20 280 2.0 130 150 | 60 88 0.6 42 46 |105-109 0 0.0 0 0 || 21 294 2.1 153 141 | 61 74 0.5 37 37 |110 plus 0 0.0 0 0 || 22 293 2.1 148 145 | 62 76 0.5 36 40 | || 23 265 1.9 131 134 | 63 69 0.5 38 31 | || 24 300 2.1 153 147 | 64 51 0.4 31 20 |0 to 14 3,622 25.9 1,849 1,773 ||25 to 29 1,426 10.2 694 732 |65 to 69 206 1.5 101 105 |5 to 17 3,105 22.2 1,566 1,539 || 25 302 2.2 146 156 | 65 60 0.4 29 31 |18 to 21 1,086 7.8 519 567 || 26 277 2.0 124 153 | 66 42 0.3 25 17 |18 to 24 1,944 13.9 951 993 || 27 296 2.1 159 137 | 67 41 0.3 19 22 |18 to 64 9,122 65.2 4,505 4,617 || 28 274 2.0 135 139 | 68 34 0.2 17 17 |25 to 64 7,178 51.3 3,554 3,624 || 29 277 2.0 130 147 | 69 29 0.2 11 18 |60 plus 834 6.0 391 443 ||30 to 34 1,212 8.7 620 592 |70 to 74 117 0.8 49 68 |65 plus 476 3.4 207 269 || 30 267 1.9 126 141 | 70 32 0.2 17 15 |70 plus 270 1.9 106 164 || 31 233 1.7 128 105 | 71 17 0.1 7 10 |75 plus 153 1.1 57 96 || 32 245 1.8 129 116 | 72 27 0.2 14 13 |80 plus 69 0.5 21 48 || 33 251 1.8 130 121 | 73 20 0.1 2 18 |85 plus 26 0.2 6 20 || 34 216 1.5 107 109 | 74 21 0.2 9 12 |90 plus 6 0.0 4 2 ||35 to 39 1,058 7.6 520 538 |75 to 79 84 0.6 36 48 | || 35 213 1.5 112 101 | 75 26 0.2 11 15 | || 36 206 1.5 93 113 | 76 16 0.1 7 9 |All Ages 13,999 100.0 6,948 7,051 || 37 224 1.6 108 116 | 77 17 0.1 7 10 | || 38 215 1.5 103 112 | 78 16 0.1 8 8 |Median Age Both Sexes Male Female || 39 200 1.4 104 96 | 79 9 0.1 3 6 | By Sex 27.3 27.1 27.5 || | | || | | || |+===================================================================================================================================================+Source: Census 2010 Summary File 1 [machine-readable data file]/Prepared by the U.S.Census Bureau, 2011. 06NOV12 Page 25 Prepared by: Washington State Office of Financial Management, Forecasting Division.

Census 2010, Summary File 1 AGE/SEX PROFILE FOR SPECIFIC RACE/ETHNIC GROUP N: SOME OTHER RACE ALONE, NOT HISP/LATINO AgeRace-NArea: King County Component:Urban Area Type: State-County (Summary Level: 050)State: WA County: 033 +===================================================================================================================================================+|P12N/P13N/PCT12N. DETAILED AGE BY SEX (INCLUDING MEDIANS): SOME OTHER RACE ALONE, NOT HISP/LATINO ||Universe: Some Other Race Alone, Not Hisp/Latino Persons (4,582 or 0.2% of Total Population: 1,869,311) || || Total Pct. Male Female | Total Pct. Male Female | Total Pct. Male Female || | | ||0 to 4 497 10.8 267 230 |40 to 44 291 6.4 151 140 |80 to 84 16 0.3 5 11 || 0 111 2.4 58 53 | 40 59 1.3 33 26 | 80 6 0.1 0 6 || 1 103 2.2 57 46 | 41 53 1.2 27 26 | 81 2 0.0 1 1 || 2 88 1.9 50 38 | 42 60 1.3 30 30 | 82 5 0.1 3 2 || 3 99 2.2 48 51 | 43 63 1.4 34 29 | 83 0 0.0 0 0 || 4 96 2.1 54 42 | 44 56 1.2 27 29 | 84 3 0.1 1 2 ||5 to 9 464 10.1 226 238 |45 to 49 231 5.0 123 108 |85 to 89 10 0.2 3 7 || 5 88 1.9 53 35 | 45 47 1.0 24 23 | 85 1 0.0 0 1 || 6 107 2.3 50 57 | 46 52 1.1 28 24 | 86 1 0.0 0 1 || 7 86 1.9 45 41 | 47 34 0.7 16 18 | 87 2 0.0 0 2 || 8 95 2.1 41 54 | 48 51 1.1 27 24 | 88 5 0.1 2 3 || 9 88 1.9 37 51 | 49 47 1.0 28 19 | 89 1 0.0 1 0 ||10 to 14 450 9.8 227 223 |50 to 54 220 4.8 114 106 |90 to 94 3 0.1 1 2 || 10 86 1.9 43 43 | 50 55 1.2 29 26 | 90 1 0.0 0 1 || 11 88 1.9 46 42 | 51 43 0.9 21 22 | 91 1 0.0 0 1 || 12 92 2.0 42 50 | 52 51 1.1 24 27 | 92 0 0.0 0 0 || 13 89 1.9 40 49 | 53 36 0.8 18 18 | 93 1 0.0 1 0 || 14 95 2.1 56 39 | 54 35 0.8 22 13 | 94 0 0.0 0 0 ||15 to 19 376 8.2 184 192 |55 to 59 190 4.1 101 89 |95 to 99 1 0.0 0 1 || 15 86 1.9 42 44 | 55 46 1.0 20 26 | 95 0 0.0 0 0 || 16 72 1.6 35 37 | 56 40 0.9 19 21 | 96 1 0.0 0 1 || 17 91 2.0 45 46 | 57 40 0.9 24 16 | 97 0 0.0 0 0 || 18 73 1.6 36 37 | 58 35 0.8 23 12 | 98 0 0.0 0 0 || 19 54 1.2 26 28 | 59 29 0.6 15 14 | 99 0 0.0 0 0 ||20 to 24 306 6.7 171 135 |60 to 64 134 2.9 69 65 |100-104 0 0.0 0 0 || 20 66 1.4 32 34 | 60 41 0.9 19 22 |105-109 0 0.0 0 0 || 21 53 1.2 34 19 | 61 27 0.6 16 11 |110 plus 0 0.0 0 0 || 22 56 1.2 32 24 | 62 26 0.6 16 10 | || 23 70 1.5 39 31 | 63 21 0.5 10 11 | || 24 61 1.3 34 27 | 64 19 0.4 8 11 |0 to 14 1,411 30.8 720 691 ||25 to 29 449 9.8 228 221 |65 to 69 83 1.8 48 35 |5 to 17 1,163 25.4 575 588 || 25 80 1.7 43 37 | 65 24 0.5 13 11 |18 to 21 246 5.4 128 118 || 26 86 1.9 37 49 | 66 17 0.4 8 9 |18 to 24 433 9.5 233 200 || 27 85 1.9 41 44 | 67 18 0.4 13 5 |18 to 64 2,743 59.9 1,422 1,321 || 28 96 2.1 48 48 | 68 13 0.3 10 3 |25 to 64 2,310 50.4 1,189 1,121 || 29 102 2.2 59 43 | 69 11 0.2 4 7 |60 plus 313 6.8 163 150 ||30 to 34 455 9.9 230 225 |70 to 74 44 1.0 23 21 |65 plus 179 3.9 94 85 || 30 107 2.3 55 52 | 70 10 0.2 6 4 |70 plus 96 2.1 46 50 || 31 83 1.8 53 30 | 71 15 0.3 7 8 |75 plus 52 1.1 23 29 || 32 90 2.0 31 59 | 72 8 0.2 4 4 |80 plus 30 0.7 9 21 || 33 86 1.9 44 42 | 73 8 0.2 4 4 |85 plus 14 0.3 4 10 || 34 89 1.9 47 42 | 74 3 0.1 2 1 |90 plus 4 0.1 1 3 ||35 to 39 340 7.4 173 167 |75 to 79 22 0.5 14 8 | || 35 75 1.6 41 34 | 75 5 0.1 2 3 | || 36 73 1.6 29 44 | 76 5 0.1 3 2 |All Ages 4,582 100.0 2,358 2,224 || 37 61 1.3 35 26 | 77 3 0.1 2 1 | || 38 69 1.5 41 28 | 78 4 0.1 3 1 |Median Age Both Sexes Male Female || 39 62 1.4 27 35 | 79 5 0.1 4 1 | By Sex 27.2 27.3 27.1 || | | || | | || |+===================================================================================================================================================+Source: Census 2010 Summary File 1 [machine-readable data file]/Prepared by the U.S.Census Bureau, 2011. 06NOV12 Page 26 Prepared by: Washington State Office of Financial Management, Forecasting Division.
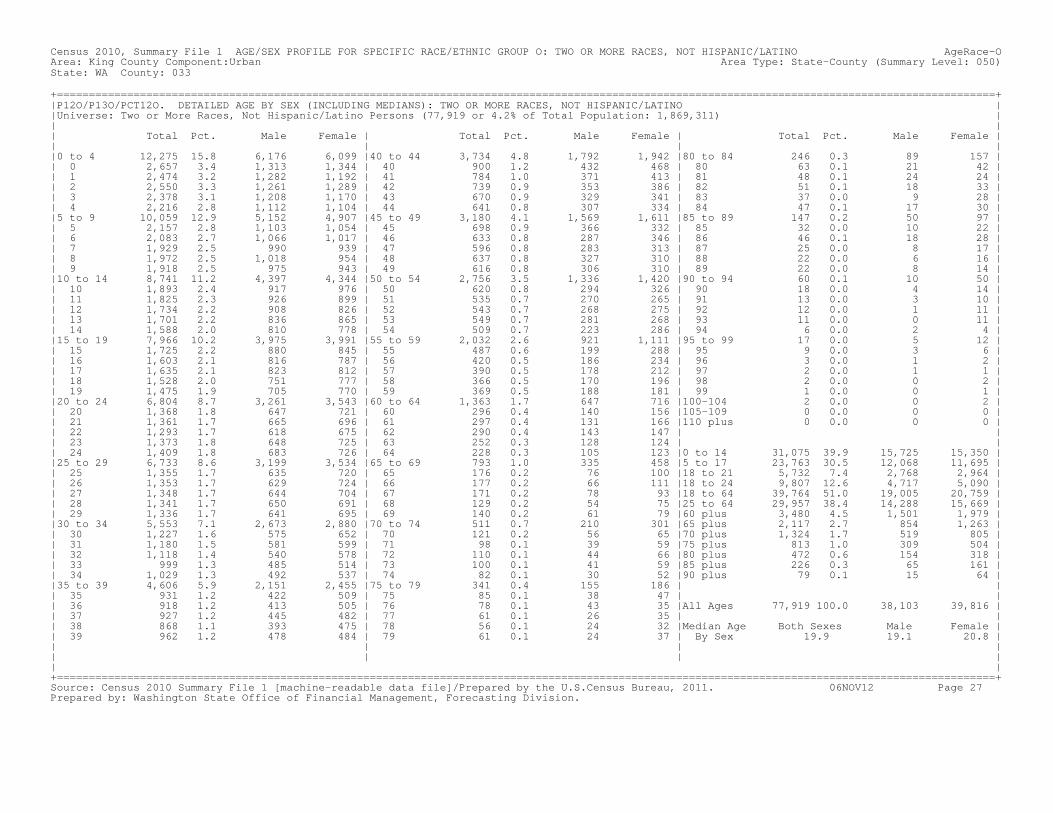
Census 2010, Summary File 1 AGE/SEX PROFILE FOR SPECIFIC RACE/ETHNIC GROUP O: TWO OR MORE RACES, NOT HISPANIC/LATINO AgeRace-OArea: King County Component:Urban Area Type: State-County (Summary Level: 050)State: WA County: 033 +===================================================================================================================================================+|P12O/P13O/PCT12O. DETAILED AGE BY SEX (INCLUDING MEDIANS): TWO OR MORE RACES, NOT HISPANIC/LATINO ||Universe: Two or More Races, Not Hispanic/Latino Persons (77,919 or 4.2% of Total Population: 1,869,311) || || Total Pct. Male Female | Total Pct. Male Female | Total Pct. Male Female || | | ||0 to 4 12,275 15.8 6,176 6,099 |40 to 44 3,734 4.8 1,792 1,942 |80 to 84 246 0.3 89 157 || 0 2,657 3.4 1,313 1,344 | 40 900 1.2 432 468 | 80 63 0.1 21 42 || 1 2,474 3.2 1,282 1,192 | 41 784 1.0 371 413 | 81 48 0.1 24 24 || 2 2,550 3.3 1,261 1,289 | 42 739 0.9 353 386 | 82 51 0.1 18 33 || 3 2,378 3.1 1,208 1,170 | 43 670 0.9 329 341 | 83 37 0.0 9 28 || 4 2,216 2.8 1,112 1,104 | 44 641 0.8 307 334 | 84 47 0.1 17 30 ||5 to 9 10,059 12.9 5,152 4,907 |45 to 49 3,180 4.1 1,569 1,611 |85 to 89 147 0.2 50 97 || 5 2,157 2.8 1,103 1,054 | 45 698 0.9 366 332 | 85 32 0.0 10 22 || 6 2,083 2.7 1,066 1,017 | 46 633 0.8 287 346 | 86 46 0.1 18 28 || 7 1,929 2.5 990 939 | 47 596 0.8 283 313 | 87 25 0.0 8 17 || 8 1,972 2.5 1,018 954 | 48 637 0.8 327 310 | 88 22 0.0 6 16 || 9 1,918 2.5 975 943 | 49 616 0.8 306 310 | 89 22 0.0 8 14 ||10 to 14 8,741 11.2 4,397 4,344 |50 to 54 2,756 3.5 1,336 1,420 |90 to 94 60 0.1 10 50 || 10 1,893 2.4 917 976 | 50 620 0.8 294 326 | 90 18 0.0 4 14 || 11 1,825 2.3 926 899 | 51 535 0.7 270 265 | 91 13 0.0 3 10 || 12 1,734 2.2 908 826 | 52 543 0.7 268 275 | 92 12 0.0 1 11 || 13 1,701 2.2 836 865 | 53 549 0.7 281 268 | 93 11 0.0 0 11 || 14 1,588 2.0 810 778 | 54 509 0.7 223 286 | 94 6 0.0 2 4 ||15 to 19 7,966 10.2 3,975 3,991 |55 to 59 2,032 2.6 921 1,111 |95 to 99 17 0.0 5 12 || 15 1,725 2.2 880 845 | 55 487 0.6 199 288 | 95 9 0.0 3 6 || 16 1,603 2.1 816 787 | 56 420 0.5 186 234 | 96 3 0.0 1 2 || 17 1,635 2.1 823 812 | 57 390 0.5 178 212 | 97 2 0.0 1 1 || 18 1,528 2.0 751 777 | 58 366 0.5 170 196 | 98 2 0.0 0 2 || 19 1,475 1.9 705 770 | 59 369 0.5 188 181 | 99 1 0.0 0 1 ||20 to 24 6,804 8.7 3,261 3,543 |60 to 64 1,363 1.7 647 716 |100-104 2 0.0 0 2 || 20 1,368 1.8 647 721 | 60 296 0.4 140 156 |105-109 0 0.0 0 0 || 21 1,361 1.7 665 696 | 61 297 0.4 131 166 |110 plus 0 0.0 0 0 || 22 1,293 1.7 618 675 | 62 290 0.4 143 147 | || 23 1,373 1.8 648 725 | 63 252 0.3 128 124 | || 24 1,409 1.8 683 726 | 64 228 0.3 105 123 |0 to 14 31,075 39.9 15,725 15,350 ||25 to 29 6,733 8.6 3,199 3,534 |65 to 69 793 1.0 335 458 |5 to 17 23,763 30.5 12,068 11,695 || 25 1,355 1.7 635 720 | 65 176 0.2 76 100 |18 to 21 5,732 7.4 2,768 2,964 || 26 1,353 1.7 629 724 | 66 177 0.2 66 111 |18 to 24 9,807 12.6 4,717 5,090 || 27 1,348 1.7 644 704 | 67 171 0.2 78 93 |18 to 64 39,764 51.0 19,005 20,759 || 28 1,341 1.7 650 691 | 68 129 0.2 54 75 |25 to 64 29,957 38.4 14,288 15,669 || 29 1,336 1.7 641 695 | 69 140 0.2 61 79 |60 plus 3,480 4.5 1,501 1,979 ||30 to 34 5,553 7.1 2,673 2,880 |70 to 74 511 0.7 210 301 |65 plus 2,117 2.7 854 1,263 || 30 1,227 1.6 575 652 | 70 121 0.2 56 65 |70 plus 1,324 1.7 519 805 || 31 1,180 1.5 581 599 | 71 98 0.1 39 59 |75 plus 813 1.0 309 504 || 32 1,118 1.4 540 578 | 72 110 0.1 44 66 |80 plus 472 0.6 154 318 || 33 999 1.3 485 514 | 73 100 0.1 41 59 |85 plus 226 0.3 65 161 || 34 1,029 1.3 492 537 | 74 82 0.1 30 52 |90 plus 79 0.1 15 64 ||35 to 39 4,606 5.9 2,151 2,455 |75 to 79 341 0.4 155 186 | || 35 931 1.2 422 509 | 75 85 0.1 38 47 | || 36 918 1.2 413 505 | 76 78 0.1 43 35 |All Ages 77,919 100.0 38,103 39,816 || 37 927 1.2 445 482 | 77 61 0.1 26 35 | || 38 868 1.1 393 475 | 78 56 0.1 24 32 |Median Age Both Sexes Male Female || 39 962 1.2 478 484 | 79 61 0.1 24 37 | By Sex 19.9 19.1 20.8 || | | || | | || |+===================================================================================================================================================+Source: Census 2010 Summary File 1 [machine-readable data file]/Prepared by the U.S.Census Bureau, 2011. 06NOV12 Page 27 Prepared by: Washington State Office of Financial Management, Forecasting Division.
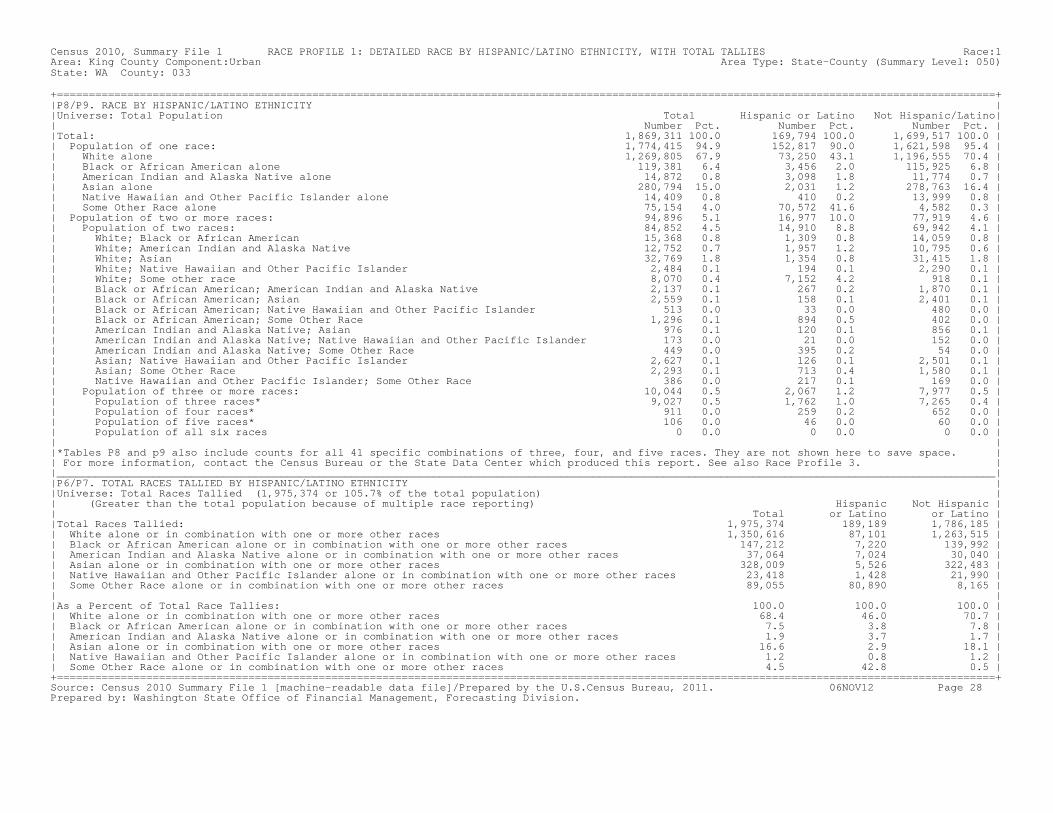
Census 2010, Summary File 1 RACE PROFILE 1: DETAILED RACE BY HISPANIC/LATINO ETHNICITY, WITH TOTAL TALLIES Race:1Area: King County Component:Urban Area Type: State-County (Summary Level: 050)State: WA County: 033 +===================================================================================================================================================+|P8/P9. RACE BY HISPANIC/LATINO ETHNICITY ||Universe: Total Population Total Hispanic or Latino Not Hispanic/Latino|| Number Pct. Number Pct. Number Pct. ||Total: 1,869,311 100.0 169,794 100.0 1,699,517 100.0 || Population of one race: 1,774,415 94.9 152,817 90.0 1,621,598 95.4 || White alone 1,269,805 67.9 73,250 43.1 1,196,555 70.4 || Black or African American alone 119,381 6.4 3,456 2.0 115,925 6.8 || American Indian and Alaska Native alone 14,872 0.8 3,098 1.8 11,774 0.7 || Asian alone 280,794 15.0 2,031 1.2 278,763 16.4 || Native Hawaiian and Other Pacific Islander alone 14,409 0.8 410 0.2 13,999 0.8 || Some Other Race alone 75,154 4.0 70,572 41.6 4,582 0.3 || Population of two or more races: 94,896 5.1 16,977 10.0 77,919 4.6 || Population of two races: 84,852 4.5 14,910 8.8 69,942 4.1 || White; Black or African American 15,368 0.8 1,309 0.8 14,059 0.8 || White; American Indian and Alaska Native 12,752 0.7 1,957 1.2 10,795 0.6 || White; Asian 32,769 1.8 1,354 0.8 31,415 1.8 || White; Native Hawaiian and Other Pacific Islander 2,484 0.1 194 0.1 2,290 0.1 || White; Some other race 8,070 0.4 7,152 4.2 918 0.1 || Black or African American; American Indian and Alaska Native 2,137 0.1 267 0.2 1,870 0.1 || Black or African American; Asian 2,559 0.1 158 0.1 2,401 0.1 || Black or African American; Native Hawaiian and Other Pacific Islander 513 0.0 33 0.0 480 0.0 || Black or African American; Some Other Race 1,296 0.1 894 0.5 402 0.0 || American Indian and Alaska Native; Asian 976 0.1 120 0.1 856 0.1 || American Indian and Alaska Native; Native Hawaiian and Other Pacific Islander 173 0.0 21 0.0 152 0.0 || American Indian and Alaska Native; Some Other Race 449 0.0 395 0.2 54 0.0 || Asian; Native Hawaiian and Other Pacific Islander 2,627 0.1 126 0.1 2,501 0.1 || Asian; Some Other Race 2,293 0.1 713 0.4 1,580 0.1 || Native Hawaiian and Other Pacific Islander; Some Other Race 386 0.0 217 0.1 169 0.0 || Population of three or more races: 10,044 0.5 2,067 1.2 7,977 0.5 || Population of three races* 9,027 0.5 1,762 1.0 7,265 0.4 || Population of four races* 911 0.0 259 0.2 652 0.0 || Population of five races* 106 0.0 46 0.0 60 0.0 || Population of all six races 0 0.0 0 0.0 0 0.0 || ||*Tables P8 and p9 also include counts for all 41 specific combinations of three, four, and five races. They are not shown here to save space. || For more information, contact the Census Bureau or the State Data Center which produced this report. See also Race Profile 3. ||___________________________________________________________________________________________________________________________________________________||P6/P7. TOTAL RACES TALLIED BY HISPANIC/LATINO ETHNICITY ||Universe: Total Races Tallied (1,975,374 or 105.7% of the total population) || (Greater than the total population because of multiple race reporting) Hispanic Not Hispanic || Total or Latino or Latino ||Total Races Tallied: 1,975,374 189,189 1,786,185 || White alone or in combination with one or more other races 1,350,616 87,101 1,263,515 || Black or African American alone or in combination with one or more other races 147,212 7,220 139,992 || American Indian and Alaska Native alone or in combination with one or more other races 37,064 7,024 30,040 || Asian alone or in combination with one or more other races 328,009 5,526 322,483 || Native Hawaiian and Other Pacific Islander alone or in combination with one or more other races 23,418 1,428 21,990 || Some Other Race alone or in combination with one or more other races 89,055 80,890 8,165 || ||As a Percent of Total Race Tallies: 100.0 100.0 100.0 || White alone or in combination with one or more other races 68.4 46.0 70.7 || Black or African American alone or in combination with one or more other races 7.5 3.8 7.8 || American Indian and Alaska Native alone or in combination with one or more other races 1.9 3.7 1.7 || Asian alone or in combination with one or more other races 16.6 2.9 18.1 || Native Hawaiian and Other Pacific Islander alone or in combination with one or more other races 1.2 0.8 1.2 || Some Other Race alone or in combination with one or more other races 4.5 42.8 0.5 |+===================================================================================================================================================+Source: Census 2010 Summary File 1 [machine-readable data file]/Prepared by the U.S.Census Bureau, 2011. 06NOV12 Page 28 Prepared by: Washington State Office of Financial Management, Forecasting Division.

Census 2010, Summary File 1 RACE PROFILE 2: DETAILED RACE BY HISP./LATINO ETHNICITY (18+); TALLIES FOR HOUSEHOLDERS Race:2Area: King County Component:Urban Area Type: State-County (Summary Level: 050)State: WA County: 033 +===================================================================================================================================================+|P10/P11. RACE BY HISPANIC/LATINO ETHNICITY FOR THE POPULATION 18 AND OVER ||Universe: Population 18 and over Total 18 & over Hispanic or Latino Not Hispanic/Latino || Number Pct. Number Pct. Number Pct. ||Total 18 and over: 1,469,515 100.0 111,504 100.0 1,358,011 100.0 || Population of one race: 1,418,940 96.6 102,810 92.2 1,316,130 96.9 || White alone 1,039,433 70.7 49,590 44.5 989,843 72.9 || Black or African American alone 86,623 5.9 2,140 1.9 84,483 6.2 || American Indian and Alaska Native alone 11,395 0.8 2,014 1.8 9,381 0.7 || Asian alone 221,333 15.1 1,430 1.3 219,903 16.2 || Native Hawaiian and Other Pacific Islander alone 9,842 0.7 244 0.2 9,598 0.7 || Some Other Race alone 50,314 3.4 47,392 42.5 2,922 0.2 || Population of two or more races: 50,575 3.4 8,694 7.8 41,881 3.1 || Population of two races: 45,707 3.1 7,817 7.0 37,890 2.8 || White; Black or African American 6,128 0.4 515 0.5 5,613 0.4 || White; American Indian and Alaska Native 9,480 0.6 1,218 1.1 8,262 0.6 || White; Asian 15,675 1.1 575 0.5 15,100 1.1 || White; Native Hawaiian and Other Pacific Islander 1,346 0.1 93 0.1 1,253 0.1 || White; Some Other Race 4,587 0.3 3,945 3.5 642 0.0 || Black or African American; American Indian and Alaska Native 1,533 0.1 164 0.1 1,369 0.1 || Black or African American; Asian 1,284 0.1 67 0.1 1,217 0.1 || Black or African American; Native Hawaiian and Other Pacific Islander 210 0.0 11 0.0 199 0.0 || Black or African American; Some Other Race 661 0.0 377 0.3 284 0.0 || American Indian and Alaska Native; Asian 700 0.0 76 0.1 624 0.0 || American Indian and Alaska Native; Native Hawaiian and Other Pacific Islander 94 0.0 15 0.0 79 0.0 || American Indian and Alaska Native; Some Other Race 287 0.0 244 0.2 43 0.0 || Asian; Native Hawaiian and Other Pacific Islander 1,944 0.1 75 0.1 1,869 0.1 || Asian; Some Other Race 1,559 0.1 337 0.3 1,222 0.1 || Native Hawaiian and Other Pacific Islander; Some Other Race 219 0.0 105 0.1 114 0.0 || Population of three or more races: 4,868 0.3 877 0.8 3,991 0.3 || Population of three races* 4,407 0.3 754 0.7 3,653 0.3 || Population of four races* 392 0.0 97 0.1 295 0.0 || Population of five races* 69 0.0 26 0.0 43 0.0 || Population of all six races 0 0.0 0 0.0 0 0.0 || ||*Tables P10 and P11 also include counts for all 41 specific combinations of three, four, and five races. They are not shown here to save || space. For more information, contact the Census Bureau or the State Data Center which produced this report. ||___________________________________________________________________________________________________________________________________________________||H8/H9. TOTAL RACES TALLIED FOR HOUSEHOLDERS BY HISPANIC/LATINO ETHNICITY ||Universe: Total Races Tallied For Householders In Occupied Housing Units (792,291 or 103.5% of total households) || (Note: Greater than the total number of households because of multiple race reporting) Hispanic Not Hispanic || Total or Latino or Latino ||Total Races Tallied for Householders: 792,291 51,538 740,753 || White alone or in combination with one or more other races 589,492 25,157 564,335 || Black or African American alone or in combination with one or more other races 52,261 1,711 50,550 || American Indian and Alaska Native alone or in combination with one or more other races 13,246 1,941 11,305 || Asian alone or in combination with one or more other races 107,401 1,350 106,051 || Native Hawaiian and Other Pacific Islander alone or in combination with one or more other races 6,105 320 5,785 || Some Other Race alone or in combination with one or more other races 23,786 21,059 2,727 || ||As a Percent of Total Race Tallies for Householders: 100.0 100.0 100.0 || White alone or in combination with one or more other races 74.4 48.8 76.2 || Black or African American alone or in combination with one or more other races 6.6 3.3 6.8 || American Indian and Alaska Native alone or in combination with one or more other races 1.7 3.8 1.5 || Asian alone or in combination with one or more other races 13.6 2.6 14.3 || Native Hawaiian and Other Pacific Islander alone or in combination with one or more other races 0.8 0.6 0.8 || Some Other Race alone or in combination with one or more other races 3.0 40.9 0.4 |+===================================================================================================================================================+Source: Census 2010 Summary File 1 [machine-readable data file]/Prepared by the U.S.Census Bureau, 2011. 06NOV12 Page 29 Prepared by: Washington State Office of Financial Management, Forecasting Division.
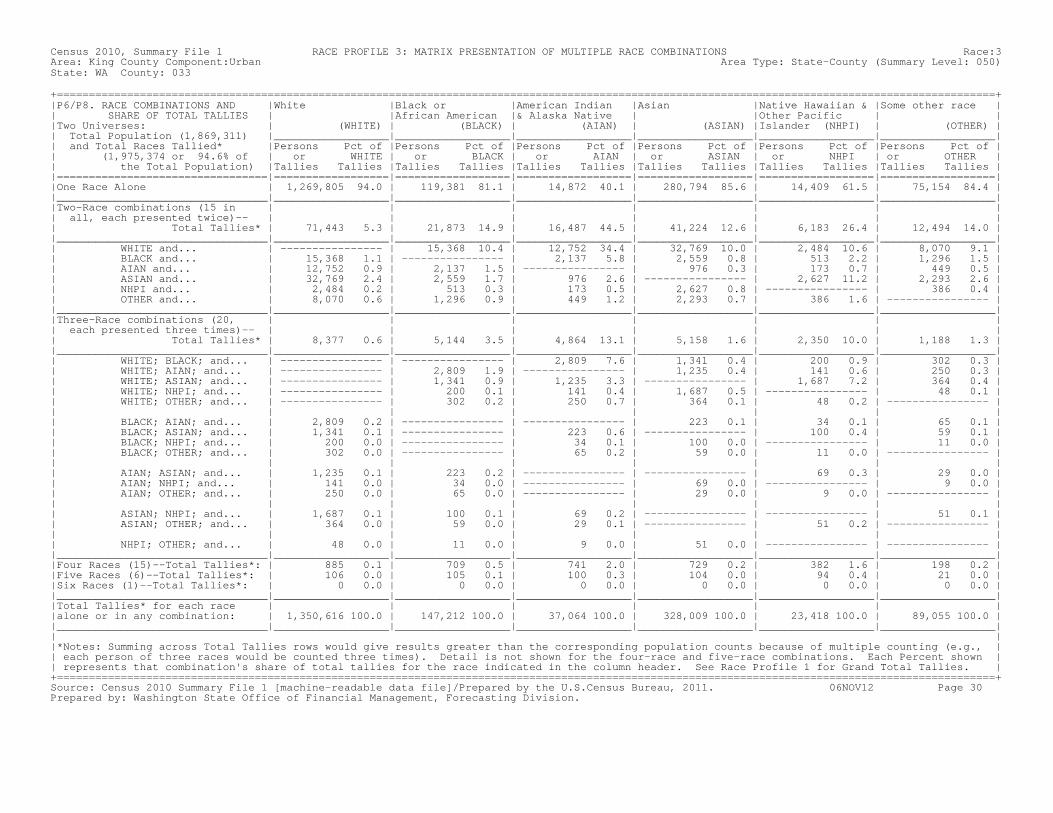
Census 2010, Summary File 1 RACE PROFILE 3: MATRIX PRESENTATION OF MULTIPLE RACE COMBINATIONS Race:3Area: King County Component:Urban Area Type: State-County (Summary Level: 050)State: WA County: 033 +===================================================================================================================================================+|P6/P8. RACE COMBINATIONS AND |White |Black or |American Indian |Asian |Native Hawaiian & |Some other race || SHARE OF TOTAL TALLIES | |African American |& Alaska Native | |Other Pacific | ||Two Universes: | (WHITE) | (BLACK) | (AIAN) | (ASIAN) |Islander (NHPI) | (OTHER) || Total Population (1,869,311) |__________________|__________________|__________________|__________________|__________________|__________________|| and Total Races Tallied* |Persons Pct of |Persons Pct of |Persons Pct of |Persons Pct of |Persons Pct of |Persons Pct of || (1,975,374 or 94.6% of | or WHITE | or BLACK | or AIAN | or ASIAN | or NHPI | or OTHER || the Total Population) |Tallies Tallies |Tallies Tallies |Tallies Tallies |Tallies Tallies |Tallies Tallies |Tallies Tallies ||=================================|==================|==================|==================|==================|==================|==================||One Race Alone | 1,269,805 94.0 | 119,381 81.1 | 14,872 40.1 | 280,794 85.6 | 14,409 61.5 | 75,154 84.4 ||_________________________________|__________________|__________________|__________________|__________________|__________________|__________________||Two-Race combinations (15 in | | | | | | || all, each presented twice)-- | | | | | | || Total Tallies* | 71,443 5.3 | 21,873 14.9 | 16,487 44.5 | 41,224 12.6 | 6,183 26.4 | 12,494 14.0 ||_________________________________|__________________|__________________|__________________|__________________|__________________|__________________|| WHITE and... | ---------------- | 15,368 10.4 | 12,752 34.4 | 32,769 10.0 | 2,484 10.6 | 8,070 9.1 || BLACK and... | 15,368 1.1 | ---------------- | 2,137 5.8 | 2,559 0.8 | 513 2.2 | 1,296 1.5 || AIAN and... | 12,752 0.9 | 2,137 1.5 | ---------------- | 976 0.3 | 173 0.7 | 449 0.5 || ASIAN and... | 32,769 2.4 | 2,559 1.7 | 976 2.6 | ---------------- | 2,627 11.2 | 2,293 2.6 || NHPI and... | 2,484 0.2 | 513 0.3 | 173 0.5 | 2,627 0.8 | ---------------- | 386 0.4 || OTHER and... | 8,070 0.6 | 1,296 0.9 | 449 1.2 | 2,293 0.7 | 386 1.6 | ---------------- ||_________________________________|__________________|__________________|__________________|__________________|__________________|__________________||Three-Race combinations (20, | | | | | | || each presented three times)-- | | | | | | || Total Tallies* | 8,377 0.6 | 5,144 3.5 | 4,864 13.1 | 5,158 1.6 | 2,350 10.0 | 1,188 1.3 ||_________________________________|__________________|__________________|__________________|__________________|__________________|__________________|| WHITE; BLACK; and... | ---------------- | ---------------- | 2,809 7.6 | 1,341 0.4 | 200 0.9 | 302 0.3 || WHITE; AIAN; and... | ---------------- | 2,809 1.9 | ---------------- | 1,235 0.4 | 141 0.6 | 250 0.3 || WHITE; ASIAN; and... | ---------------- | 1,341 0.9 | 1,235 3.3 | ---------------- | 1,687 7.2 | 364 0.4 || WHITE; NHPI; and... | ---------------- | 200 0.1 | 141 0.4 | 1,687 0.5 | ---------------- | 48 0.1 || WHITE; OTHER; and... | ---------------- | 302 0.2 | 250 0.7 | 364 0.1 | 48 0.2 | ---------------- || | | | | | | || BLACK; AIAN; and... | 2,809 0.2 | ---------------- | ---------------- | 223 0.1 | 34 0.1 | 65 0.1 || BLACK; ASIAN; and... | 1,341 0.1 | ---------------- | 223 0.6 | ---------------- | 100 0.4 | 59 0.1 || BLACK; NHPI; and... | 200 0.0 | ---------------- | 34 0.1 | 100 0.0 | ---------------- | 11 0.0 || BLACK; OTHER; and... | 302 0.0 | ---------------- | 65 0.2 | 59 0.0 | 11 0.0 | ---------------- || | | | | | | || AIAN; ASIAN; and... | 1,235 0.1 | 223 0.2 | ---------------- | ---------------- | 69 0.3 | 29 0.0 || AIAN; NHPI; and... | 141 0.0 | 34 0.0 | ---------------- | 69 0.0 | ---------------- | 9 0.0 || AIAN; OTHER; and... | 250 0.0 | 65 0.0 | ---------------- | 29 0.0 | 9 0.0 | ---------------- || | | | | | | || ASIAN; NHPI; and... | 1,687 0.1 | 100 0.1 | 69 0.2 | ---------------- | ---------------- | 51 0.1 || ASIAN; OTHER; and... | 364 0.0 | 59 0.0 | 29 0.1 | ---------------- | 51 0.2 | ---------------- || | | | | | | || NHPI; OTHER; and... | 48 0.0 | 11 0.0 | 9 0.0 | 51 0.0 | ---------------- | ---------------- ||_________________________________|__________________|__________________|__________________|__________________|__________________|__________________||Four Races (15)--Total Tallies*: | 885 0.1 | 709 0.5 | 741 2.0 | 729 0.2 | 382 1.6 | 198 0.2 ||Five Races (6)--Total Tallies*: | 106 0.0 | 105 0.1 | 100 0.3 | 104 0.0 | 94 0.4 | 21 0.0 ||Six Races (1)--Total Tallies*: | 0 0.0 | 0 0.0 | 0 0.0 | 0 0.0 | 0 0.0 | 0 0.0 ||_________________________________|__________________|__________________|__________________|__________________|__________________|__________________||Total Tallies* for each race | | | | | | ||alone or in any combination: | 1,350,616 100.0 | 147,212 100.0 | 37,064 100.0 | 328,009 100.0 | 23,418 100.0 | 89,055 100.0 ||_________________________________|__________________|__________________|__________________|__________________|__________________|__________________|| ||*Notes: Summing across Total Tallies rows would give results greater than the corresponding population counts because of multiple counting (e.g., || each person of three races would be counted three times). Detail is not shown for the four-race and five-race combinations. Each Percent shown || represents that combination's share of total tallies for the race indicated in the column header. See Race Profile 1 for Grand Total Tallies. |+===================================================================================================================================================+Source: Census 2010 Summary File 1 [machine-readable data file]/Prepared by the U.S.Census Bureau, 2011. 06NOV12 Page 30 Prepared by: Washington State Office of Financial Management, Forecasting Division.
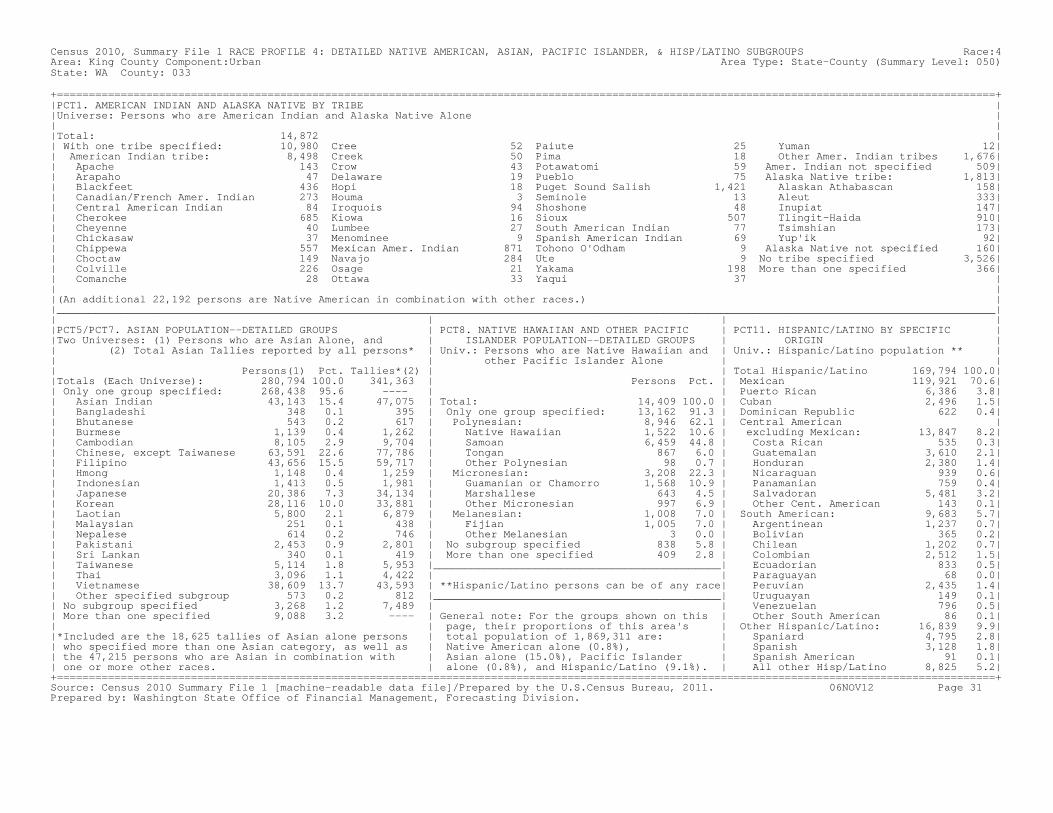
Census 2010, Summary File 1 RACE PROFILE 4: DETAILED NATIVE AMERICAN, ASIAN, PACIFIC ISLANDER, & HISP/LATINO SUBGROUPS Race:4Area: King County Component:Urban Area Type: State-County (Summary Level: 050)State: WA County: 033 +===================================================================================================================================================+|PCT1. AMERICAN INDIAN AND ALASKA NATIVE BY TRIBE ||Universe: Persons who are American Indian and Alaska Native Alone || ||Total: 14,872 || With one tribe specified: 10,980 Cree 52 Paiute 25 Yuman 12|| American Indian tribe: 8,498 Creek 50 Pima 18 Other Amer. Indian tribes 1,676|| Apache 143 Crow 43 Potawatomi 59 Amer. Indian not specified 509|| Arapaho 47 Delaware 19 Pueblo 75 Alaska Native tribe: 1,813|| Blackfeet 436 Hopi 18 Puget Sound Salish 1,421 Alaskan Athabascan 158|| Canadian/French Amer. Indian 273 Houma 3 Seminole 13 Aleut 333|| Central American Indian 84 Iroquois 94 Shoshone 48 Inupiat 147|| Cherokee 685 Kiowa 16 Sioux 507 Tlingit-Haida 910|| Cheyenne 40 Lumbee 27 South American Indian 77 Tsimshian 173|| Chickasaw 37 Menominee 9 Spanish American Indian 69 Yup'ik 92|| Chippewa 557 Mexican Amer. Indian 871 Tohono O'Odham 9 Alaska Native not specified 160|| Choctaw 149 Navajo 284 Ute 9 No tribe specified 3,526|| Colville 226 Osage 21 Yakama 198 More than one specified 366|| Comanche 28 Ottawa 33 Yaqui 37 || ||(An additional 22,192 persons are Native American in combination with other races.) ||___________________________________________________________________________________________________________________________________________________|| | | ||PCT5/PCT7. ASIAN POPULATION--DETAILED GROUPS | PCT8. NATIVE HAWAIIAN AND OTHER PACIFIC | PCT11. HISPANIC/LATINO BY SPECIFIC ||Two Universes: (1) Persons who are Asian Alone, and | ISLANDER POPULATION--DETAILED GROUPS | ORIGIN || (2) Total Asian Tallies reported by all persons* | Univ.: Persons who are Native Hawaiian and | Univ.: Hispanic/Latino population ** || | other Pacific Islander Alone | || Persons(1) Pct. Tallies*(2) | | Total Hispanic/Latino 169,794 100.0||Totals (Each Universe): 280,794 100.0 341,363 | Persons Pct. | Mexican 119,921 70.6|| Only one group specified: 268,438 95.6 ---- | | Puerto Rican 6,386 3.8|| Asian Indian 43,143 15.4 47,075 | Total: 14,409 100.0 | Cuban 2,496 1.5|| Bangladeshi 348 0.1 395 | Only one group specified: 13,162 91.3 | Dominican Republic 622 0.4|| Bhutanese 543 0.2 617 | Polynesian: 8,946 62.1 | Central American || Burmese 1,139 0.4 1,262 | Native Hawaiian 1,522 10.6 | excluding Mexican: 13,847 8.2|| Cambodian 8,105 2.9 9,704 | Samoan 6,459 44.8 | Costa Rican 535 0.3|| Chinese, except Taiwanese 63,591 22.6 77,786 | Tongan 867 6.0 | Guatemalan 3,610 2.1|| Filipino 43,656 15.5 59,717 | Other Polynesian 98 0.7 | Honduran 2,380 1.4|| Hmong 1,148 0.4 1,259 | Micronesian: 3,208 22.3 | Nicaraguan 939 0.6|| Indonesian 1,413 0.5 1,981 | Guamanian or Chamorro 1,568 10.9 | Panamanian 759 0.4|| Japanese 20,386 7.3 34,134 | Marshallese 643 4.5 | Salvadoran 5,481 3.2|| Korean 28,116 10.0 33,881 | Other Micronesian 997 6.9 | Other Cent. American 143 0.1|| Laotian 5,800 2.1 6,879 | Melanesian: 1,008 7.0 | South American: 9,683 5.7|| Malaysian 251 0.1 438 | Fijian 1,005 7.0 | Argentinean 1,237 0.7|| Nepalese 614 0.2 746 | Other Melanesian 3 0.0 | Bolivian 365 0.2|| Pakistani 2,453 0.9 2,801 | No subgroup specified 838 5.8 | Chilean 1,202 0.7|| Sri Lankan 340 0.1 419 | More than one specified 409 2.8 | Colombian 2,512 1.5|| Taiwanese 5,114 1.8 5,953 |_____________________________________________| Ecuadorian 833 0.5|| Thai 3,096 1.1 4,422 | | Paraguayan 68 0.0|| Vietnamese 38,609 13.7 43,593 | **Hispanic/Latino persons can be of any race| Peruvian 2,435 1.4|| Other specified subgroup 573 0.2 812 |_____________________________________________| Uruguayan 149 0.1|| No subgroup specified 3,268 1.2 7,489 | | Venezuelan 796 0.5|| More than one specified 9,088 3.2 ---- | General note: For the groups shown on this | Other South American 86 0.1|| | page, their proportions of this area's | Other Hispanic/Latino: 16,839 9.9||*Included are the 18,625 tallies of Asian alone persons | total population of 1,869,311 are: | Spaniard 4,795 2.8|| who specified more than one Asian category, as well as | Native American alone (0.8%), | Spanish 3,128 1.8|| the 47,215 persons who are Asian in combination with | Asian alone (15.0%), Pacific Islander | Spanish American 91 0.1|| one or more other races. | alone (0.8%), and Hispanic/Latino (9.1%). | All other Hisp/Latino 8,825 5.2|+===================================================================================================================================================+Source: Census 2010 Summary File 1 [machine-readable data file]/Prepared by the U.S.Census Bureau, 2011. 06NOV12 Page 31 Prepared by: Washington State Office of Financial Management, Forecasting Division.
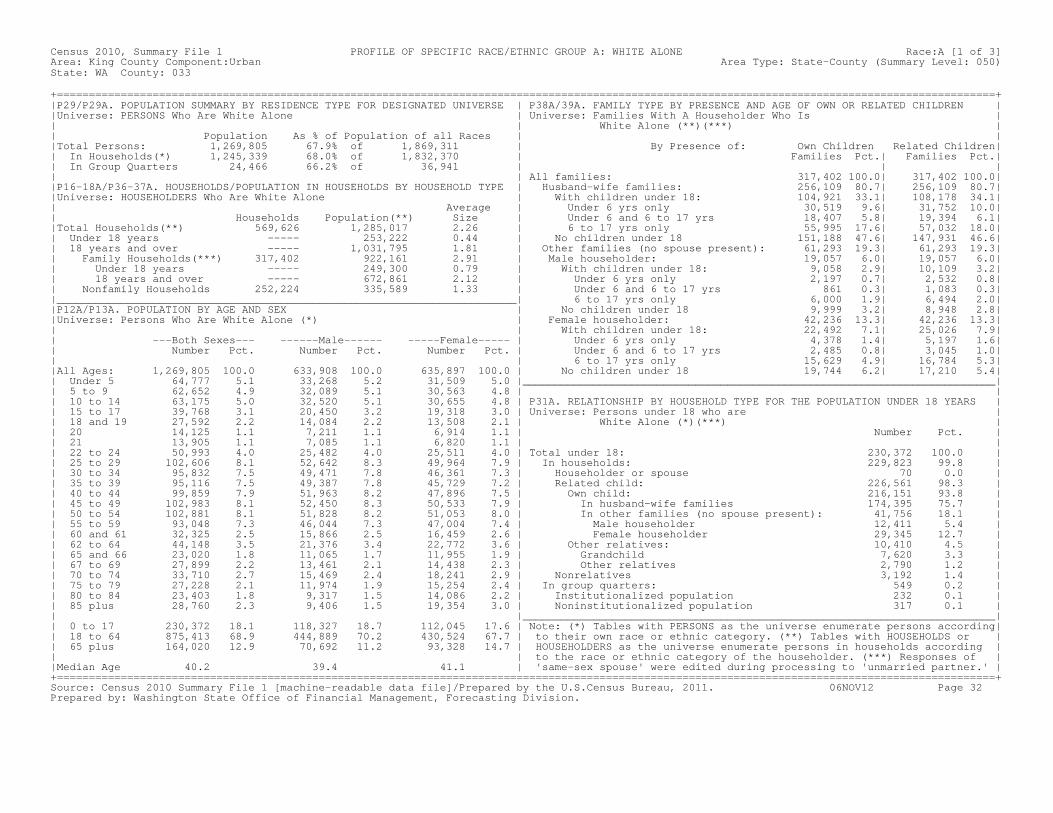
Census 2010, Summary File 1 PROFILE OF SPECIFIC RACE/ETHNIC GROUP A: WHITE ALONE Race:A [1 of 3]Area: King County Component:Urban Area Type: State-County (Summary Level: 050)State: WA County: 033 +===================================================================================================================================================+|P29/P29A. POPULATION SUMMARY BY RESIDENCE TYPE FOR DESIGNATED UNIVERSE | P38A/39A. FAMILY TYPE BY PRESENCE AND AGE OF OWN OR RELATED CHILDREN ||Universe: PERSONS Who Are White Alone | Universe: Families With A Householder Who Is || | White Alone (**)(***) || Population As % of Population of all Races | ||Total Persons: 1,269,805 67.9% of 1,869,311 | By Presence of: Own Children Related Children|| In Households(*) 1,245,339 68.0% of 1,832,370 | Families Pct.| Families Pct.|| In Group Quarters 24,466 66.2% of 36,941 | | || | All families: 317,402 100.0| 317,402 100.0||P16-18A/P36-37A. HOUSEHOLDS/POPULATION IN HOUSEHOLDS BY HOUSEHOLD TYPE | Husband-wife families: 256,109 80.7| 256,109 80.7||Universe: HOUSEHOLDERS Who Are White Alone | With children under 18: 104,921 33.1| 108,178 34.1|| Average | Under 6 yrs only 30,519 9.6| 31,752 10.0|| Households Population(**) Size | Under 6 and 6 to 17 yrs 18,407 5.8| 19,394 6.1||Total Households(**) 569,626 1,285,017 2.26 | 6 to 17 yrs only 55,995 17.6| 57,032 18.0|| Under 18 years ----- 253,222 0.44 | No children under 18 151,188 47.6| 147,931 46.6|| 18 years and over ----- 1,031,795 1.81 | Other families (no spouse present): 61,293 19.3| 61,293 19.3|| Family Households(***) 317,402 922,161 2.91 | Male householder: 19,057 6.0| 19,057 6.0|| Under 18 years ----- 249,300 0.79 | With children under 18: 9,058 2.9| 10,109 3.2|| 18 years and over ----- 672,861 2.12 | Under 6 yrs only 2,197 0.7| 2,532 0.8|| Nonfamily Households 252,224 335,589 1.33 | Under 6 and 6 to 17 yrs 861 0.3| 1,083 0.3||________________________________________________________________________| 6 to 17 yrs only 6,000 1.9| 6,494 2.0||P12A/P13A. POPULATION BY AGE AND SEX | No children under 18 9,999 3.2| 8,948 2.8||Universe: Persons Who Are White Alone (*) | Female householder: 42,236 13.3| 42,236 13.3|| | With children under 18: 22,492 7.1| 25,026 7.9|| ---Both Sexes--- ------Male------ -----Female----- | Under 6 yrs only 4,378 1.4| 5,197 1.6|| Number Pct. Number Pct. Number Pct. | Under 6 and 6 to 17 yrs 2,485 0.8| 3,045 1.0|| | 6 to 17 yrs only 15,629 4.9| 16,784 5.3||All Ages: 1,269,805 100.0 633,908 100.0 635,897 100.0 | No children under 18 19,744 6.2| 17,210 5.4|| Under 5 64,777 5.1 33,268 5.2 31,509 5.0 |__________________________________________________________________________|| 5 to 9 62,652 4.9 32,089 5.1 30,563 4.8 | || 10 to 14 63,175 5.0 32,520 5.1 30,655 4.8 | P31A. RELATIONSHIP BY HOUSEHOLD TYPE FOR THE POPULATION UNDER 18 YEARS || 15 to 17 39,768 3.1 20,450 3.2 19,318 3.0 | Universe: Persons under 18 who are || 18 and 19 27,592 2.2 14,084 2.2 13,508 2.1 | White Alone (*)(***) || 20 14,125 1.1 7,211 1.1 6,914 1.1 | Number Pct. || 21 13,905 1.1 7,085 1.1 6,820 1.1 | || 22 to 24 50,993 4.0 25,482 4.0 25,511 4.0 | Total under 18: 230,372 100.0 || 25 to 29 102,606 8.1 52,642 8.3 49,964 7.9 | In households: 229,823 99.8 || 30 to 34 95,832 7.5 49,471 7.8 46,361 7.3 | Householder or spouse 70 0.0 || 35 to 39 95,116 7.5 49,387 7.8 45,729 7.2 | Related child: 226,561 98.3 || 40 to 44 99,859 7.9 51,963 8.2 47,896 7.5 | Own child: 216,151 93.8 || 45 to 49 102,983 8.1 52,450 8.3 50,533 7.9 | In husband-wife families 174,395 75.7 || 50 to 54 102,881 8.1 51,828 8.2 51,053 8.0 | In other families (no spouse present): 41,756 18.1 || 55 to 59 93,048 7.3 46,044 7.3 47,004 7.4 | Male householder 12,411 5.4 || 60 and 61 32,325 2.5 15,866 2.5 16,459 2.6 | Female householder 29,345 12.7 || 62 to 64 44,148 3.5 21,376 3.4 22,772 3.6 | Other relatives: 10,410 4.5 || 65 and 66 23,020 1.8 11,065 1.7 11,955 1.9 | Grandchild 7,620 3.3 || 67 to 69 27,899 2.2 13,461 2.1 14,438 2.3 | Other relatives 2,790 1.2 || 70 to 74 33,710 2.7 15,469 2.4 18,241 2.9 | Nonrelatives 3,192 1.4 || 75 to 79 27,228 2.1 11,974 1.9 15,254 2.4 | In group quarters: 549 0.2 || 80 to 84 23,403 1.8 9,317 1.5 14,086 2.2 | Institutionalized population 232 0.1 || 85 plus 28,760 2.3 9,406 1.5 19,354 3.0 | Noninstitutionalized population 317 0.1 || |__________________________________________________________________________|| 0 to 17 230,372 18.1 118,327 18.7 112,045 17.6 | Note: (*) Tables with PERSONS as the universe enumerate persons according|| 18 to 64 875,413 68.9 444,889 70.2 430,524 67.7 | to their own race or ethnic category. (**) Tables with HOUSEHOLDS or || 65 plus 164,020 12.9 70,692 11.2 93,328 14.7 | HOUSEHOLDERS as the universe enumerate persons in households according || | to the race or ethnic category of the householder. (***) Responses of ||Median Age 40.2 39.4 41.1 | 'same-sex spouse' were edited during processing to 'unmarried partner.' |+===================================================================================================================================================+Source: Census 2010 Summary File 1 [machine-readable data file]/Prepared by the U.S.Census Bureau, 2011. 06NOV12 Page 32 Prepared by: Washington State Office of Financial Management, Forecasting Division.
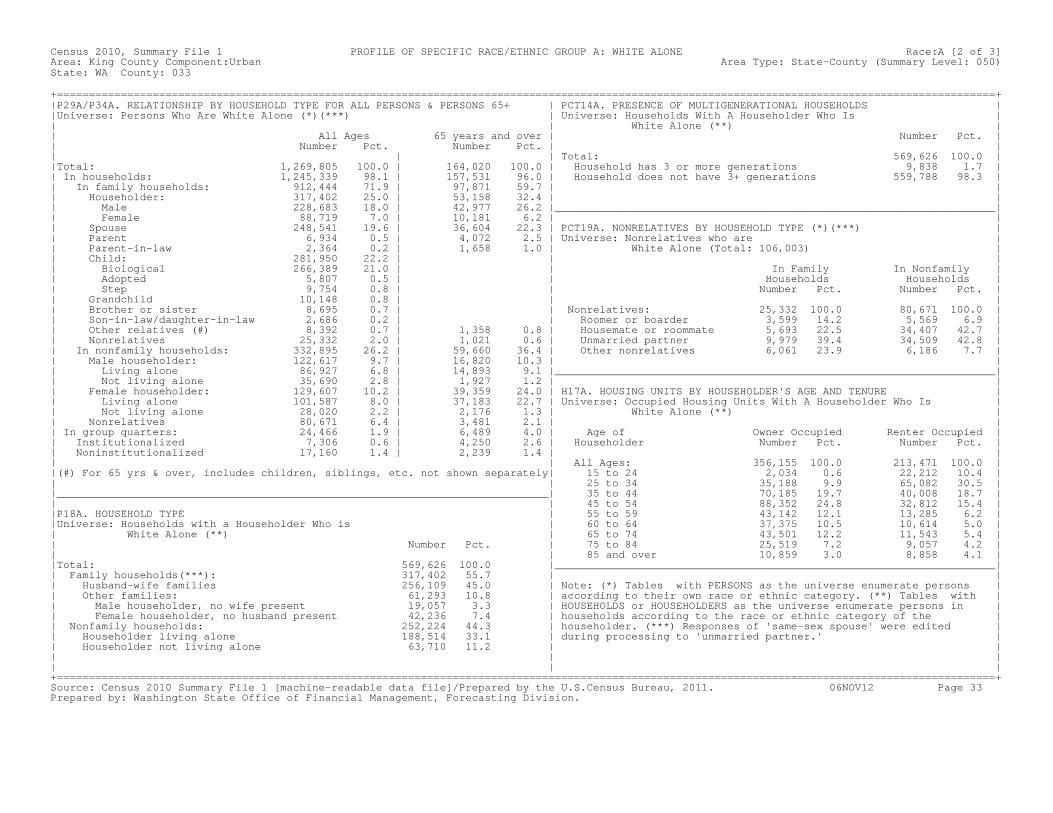
Census 2010, Summary File 1 PROFILE OF SPECIFIC RACE/ETHNIC GROUP A: WHITE ALONE Race:A [2 of 3]Area: King County Component:Urban Area Type: State-County (Summary Level: 050)State: WA County: 033 +===================================================================================================================================================+|P29A/P34A. RELATIONSHIP BY HOUSEHOLD TYPE FOR ALL PERSONS & PERSONS 65+ | PCT14A. PRESENCE OF MULTIGENERATIONAL HOUSEHOLDS ||Universe: Persons Who Are White Alone (*)(***) | Universe: Households With A Householder Who Is || | White Alone (**) || All Ages 65 years and over | Number Pct. || Number Pct. Number Pct. | || | | Total: 569,626 100.0 ||Total: 1,269,805 100.0 | 164,020 100.0 | Household has 3 or more generations 9,838 1.7 || In households: 1,245,339 98.1 | 157,531 96.0 | Household does not have 3+ generations 559,788 98.3 || In family households: 912,444 71.9 | 97,871 59.7 | || Householder: 317,402 25.0 | 53,158 32.4 | || Male 228,683 18.0 | 42,977 26.2 |_____________________________________________________________________|| Female 88,719 7.0 | 10,181 6.2 | || Spouse 248,541 19.6 | 36,604 22.3 | PCT19A. NONRELATIVES BY HOUSEHOLD TYPE (*)(***) || Parent 6,934 0.5 | 4,072 2.5 | Universe: Nonrelatives who are || Parent-in-law 2,364 0.2 | 1,658 1.0 | White Alone (Total: 106,003) || Child: 281,950 22.2 | | || Biological 266,389 21.0 | | In Family In Nonfamily || Adopted 5,807 0.5 | | Households Households || Step 9,754 0.8 | | Number Pct. Number Pct. || Grandchild 10,148 0.8 | | || Brother or sister 8,695 0.7 | | Nonrelatives: 25,332 100.0 80,671 100.0 || Son-in-law/daughter-in-law 2,686 0.2 | | Roomer or boarder 3,599 14.2 5,569 6.9 || Other relatives (#) 8,392 0.7 | 1,358 0.8 | Housemate or roommate 5,693 22.5 34,407 42.7 || Nonrelatives 25,332 2.0 | 1,021 0.6 | Unmarried partner 9,979 39.4 34,509 42.8 || In nonfamily households: 332,895 26.2 | 59,660 36.4 | Other nonrelatives 6,061 23.9 6,186 7.7 || Male householder: 122,617 9.7 | 16,820 10.3 | || Living alone 86,927 6.8 | 14,893 9.1 |_____________________________________________________________________|| Not living alone 35,690 2.8 | 1,927 1.2 | || Female householder: 129,607 10.2 | 39,359 24.0 | H17A. HOUSING UNITS BY HOUSEHOLDER'S AGE AND TENURE || Living alone 101,587 8.0 | 37,183 22.7 | Universe: Occupied Housing Units With A Householder Who Is || Not living alone 28,020 2.2 | 2,176 1.3 | White Alone (**) || Nonrelatives 80,671 6.4 | 3,481 2.1 | || In group quarters: 24,466 1.9 | 6,489 4.0 | Age of Owner Occupied Renter Occupied || Institutionalized 7,306 0.6 | 4,250 2.6 | Householder Number Pct. Number Pct. || Noninstitutionalized 17,160 1.4 | 2,239 1.4 | || | All Ages: 356,155 100.0 213,471 100.0 ||(#) For 65 yrs & over, includes children, siblings, etc. not shown separately| 15 to 24 2,034 0.6 22,212 10.4 || | 25 to 34 35,188 9.9 65,082 30.5 ||_____________________________________________________________________________| 35 to 44 70,185 19.7 40,008 18.7 || | 45 to 54 88,352 24.8 32,812 15.4 ||P18A. HOUSEHOLD TYPE | 55 to 59 43,142 12.1 13,285 6.2 ||Universe: Households with a Householder Who is | 60 to 64 37,375 10.5 10,614 5.0 || White Alone (**) | 65 to 74 43,501 12.2 11,543 5.4 || Number Pct. | 75 to 84 25,519 7.2 9,057 4.2 || | 85 and over 10,859 3.0 8,858 4.1 ||Total: 569,626 100.0 |_____________________________________________________________________|| Family households(***): 317,402 55.7 | || Husband-wife families 256,109 45.0 | Note: (*) Tables with PERSONS as the universe enumerate persons || Other families: 61,293 10.8 | according to their own race or ethnic category. (**) Tables with || Male householder, no wife present 19,057 3.3 | HOUSEHOLDS or HOUSEHOLDERS as the universe enumerate persons in || Female householder, no husband present 42,236 7.4 | households according to the race or ethnic category of the || Nonfamily households: 252,224 44.3 | householder. (***) Responses of 'same-sex spouse' were edited || Householder living alone 188,514 33.1 | during processing to 'unmarried partner.' || Householder not living alone 63,710 11.2 | || | || | |+===================================================================================================================================================+Source: Census 2010 Summary File 1 [machine-readable data file]/Prepared by the U.S.Census Bureau, 2011. 06NOV12 Page 33 Prepared by: Washington State Office of Financial Management, Forecasting Division.
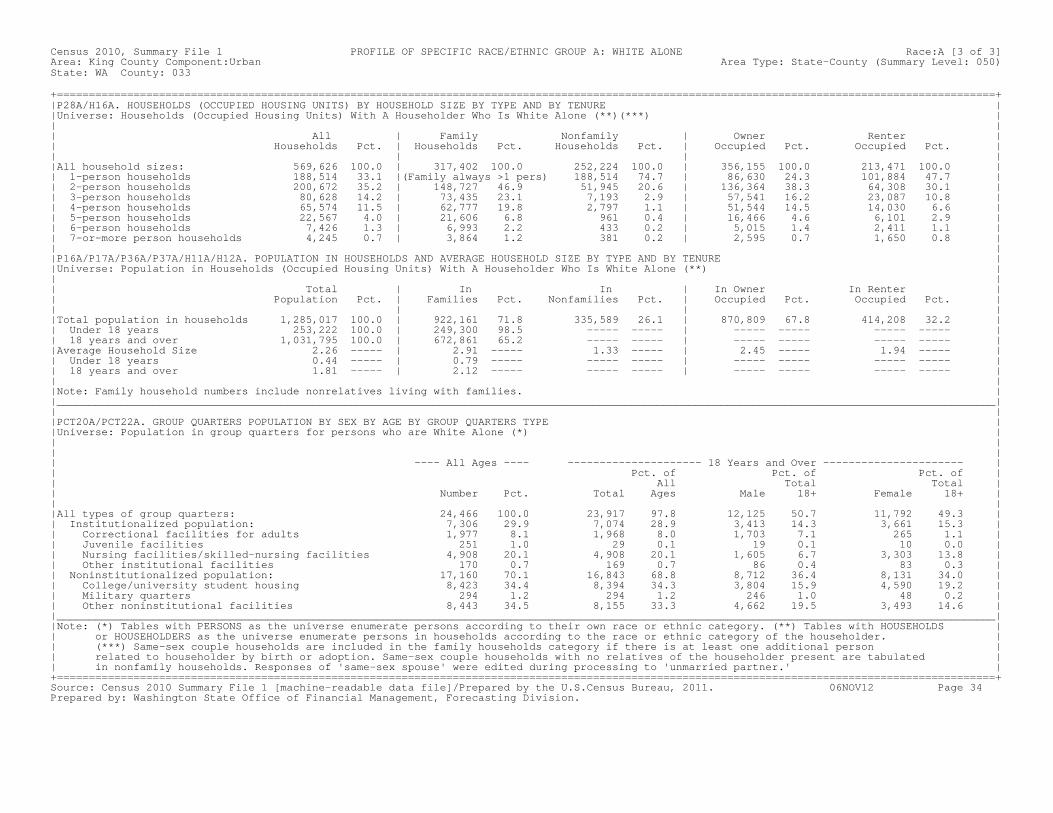
Census 2010, Summary File 1 PROFILE OF SPECIFIC RACE/ETHNIC GROUP A: WHITE ALONE Race:A [3 of 3]Area: King County Component:Urban Area Type: State-County (Summary Level: 050)State: WA County: 033 +===================================================================================================================================================+|P28A/H16A. HOUSEHOLDS (OCCUPIED HOUSING UNITS) BY HOUSEHOLD SIZE BY TYPE AND BY TENURE ||Universe: Households (Occupied Housing Units) With A Householder Who Is White Alone (**)(***) || || All | Family Nonfamily | Owner Renter || Households Pct. | Households Pct. Households Pct. | Occupied Pct. Occupied Pct. || | | ||All household sizes: 569,626 100.0 | 317,402 100.0 252,224 100.0 | 356,155 100.0 213,471 100.0 || 1-person households 188,514 33.1 |(Family always >1 pers) 188,514 74.7 | 86,630 24.3 101,884 47.7 || 2-person households 200,672 35.2 | 148,727 46.9 51,945 20.6 | 136,364 38.3 64,308 30.1 || 3-person households 80,628 14.2 | 73,435 23.1 7,193 2.9 | 57,541 16.2 23,087 10.8 || 4-person households 65,574 11.5 | 62,777 19.8 2,797 1.1 | 51,544 14.5 14,030 6.6 || 5-person households 22,567 4.0 | 21,606 6.8 961 0.4 | 16,466 4.6 6,101 2.9 || 6-person households 7,426 1.3 | 6,993 2.2 433 0.2 | 5,015 1.4 2,411 1.1 || 7-or-more person households 4,245 0.7 | 3,864 1.2 381 0.2 | 2,595 0.7 1,650 0.8 || ||P16A/P17A/P36A/P37A/H11A/H12A. POPULATION IN HOUSEHOLDS AND AVERAGE HOUSEHOLD SIZE BY TYPE AND BY TENURE ||Universe: Population in Households (Occupied Housing Units) With A Householder Who Is White Alone (**) || || Total | In In | In Owner In Renter || Population Pct. | Families Pct. Nonfamilies Pct. | Occupied Pct. Occupied Pct. || | | ||Total population in households 1,285,017 100.0 | 922,161 71.8 335,589 26.1 | 870,809 67.8 414,208 32.2 || Under 18 years 253,222 100.0 | 249,300 98.5 ----- ----- | ----- ----- ----- ----- || 18 years and over 1,031,795 100.0 | 672,861 65.2 ----- ----- | ----- ----- ----- ----- ||Average Household Size 2.26 ----- | 2.91 ----- 1.33 ----- | 2.45 ----- 1.94 ----- || Under 18 years 0.44 ----- | 0.79 ----- ----- ----- | ----- ----- ----- ----- || 18 years and over 1.81 ----- | 2.12 ----- ----- ----- | ----- ----- ----- ----- || ||Note: Family household numbers include nonrelatives living with families. ||___________________________________________________________________________________________________________________________________________________|| ||PCT20A/PCT22A. GROUP QUARTERS POPULATION BY SEX BY AGE BY GROUP QUARTERS TYPE ||Universe: Population in group quarters for persons who are White Alone (*) || || || ---- All Ages ---- --------------------- 18 Years and Over ---------------------- || Pct. of Pct. of Pct. of || All Total Total || Number Pct. Total Ages Male 18+ Female 18+ || ||All types of group quarters: 24,466 100.0 23,917 97.8 12,125 50.7 11,792 49.3 || Institutionalized population: 7,306 29.9 7,074 28.9 3,413 14.3 3,661 15.3 || Correctional facilities for adults 1,977 8.1 1,968 8.0 1,703 7.1 265 1.1 || Juvenile facilities 251 1.0 29 0.1 19 0.1 10 0.0 || Nursing facilities/skilled-nursing facilities 4,908 20.1 4,908 20.1 1,605 6.7 3,303 13.8 || Other institutional facilities 170 0.7 169 0.7 86 0.4 83 0.3 || Noninstitutionalized population: 17,160 70.1 16,843 68.8 8,712 36.4 8,131 34.0 || College/university student housing 8,423 34.4 8,394 34.3 3,804 15.9 4,590 19.2 || Military quarters 294 1.2 294 1.2 246 1.0 48 0.2 || Other noninstitutional facilities 8,443 34.5 8,155 33.3 4,662 19.5 3,493 14.6 ||___________________________________________________________________________________________________________________________________________________||Note: (*) Tables with PERSONS as the universe enumerate persons according to their own race or ethnic category. (**) Tables with HOUSEHOLDS || or HOUSEHOLDERS as the universe enumerate persons in households according to the race or ethnic category of the householder. || (***) Same-sex couple households are included in the family households category if there is at least one additional person || related to householder by birth or adoption. Same-sex couple households with no relatives of the householder present are tabulated || in nonfamily households. Responses of 'same-sex spouse' were edited during processing to 'unmarried partner.' |+===================================================================================================================================================+Source: Census 2010 Summary File 1 [machine-readable data file]/Prepared by the U.S.Census Bureau, 2011. 06NOV12 Page 34 Prepared by: Washington State Office of Financial Management, Forecasting Division.
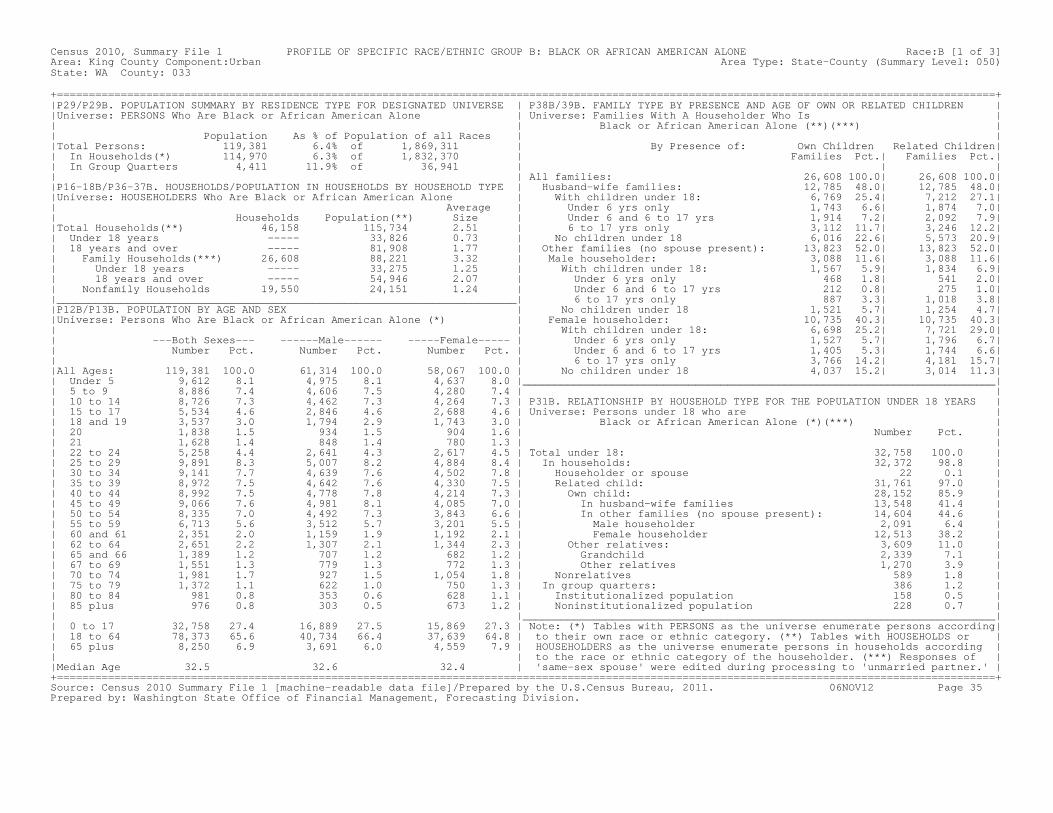
Census 2010, Summary File 1 PROFILE OF SPECIFIC RACE/ETHNIC GROUP B: BLACK OR AFRICAN AMERICAN ALONE Race:B [1 of 3]Area: King County Component:Urban Area Type: State-County (Summary Level: 050)State: WA County: 033 +===================================================================================================================================================+|P29/P29B. POPULATION SUMMARY BY RESIDENCE TYPE FOR DESIGNATED UNIVERSE | P38B/39B. FAMILY TYPE BY PRESENCE AND AGE OF OWN OR RELATED CHILDREN ||Universe: PERSONS Who Are Black or African American Alone | Universe: Families With A Householder Who Is || | Black or African American Alone (**)(***) || Population As % of Population of all Races | ||Total Persons: 119,381 6.4% of 1,869,311 | By Presence of: Own Children Related Children|| In Households(*) 114,970 6.3% of 1,832,370 | Families Pct.| Families Pct.|| In Group Quarters 4,411 11.9% of 36,941 | | || | All families: 26,608 100.0| 26,608 100.0||P16-18B/P36-37B. HOUSEHOLDS/POPULATION IN HOUSEHOLDS BY HOUSEHOLD TYPE | Husband-wife families: 12,785 48.0| 12,785 48.0||Universe: HOUSEHOLDERS Who Are Black or African American Alone | With children under 18: 6,769 25.4| 7,212 27.1|| Average | Under 6 yrs only 1,743 6.6| 1,874 7.0|| Households Population(**) Size | Under 6 and 6 to 17 yrs 1,914 7.2| 2,092 7.9||Total Households(**) 46,158 115,734 2.51 | 6 to 17 yrs only 3,112 11.7| 3,246 12.2|| Under 18 years ----- 33,826 0.73 | No children under 18 6,016 22.6| 5,573 20.9|| 18 years and over ----- 81,908 1.77 | Other families (no spouse present): 13,823 52.0| 13,823 52.0|| Family Households(***) 26,608 88,221 3.32 | Male householder: 3,088 11.6| 3,088 11.6|| Under 18 years ----- 33,275 1.25 | With children under 18: 1,567 5.9| 1,834 6.9|| 18 years and over ----- 54,946 2.07 | Under 6 yrs only 468 1.8| 541 2.0|| Nonfamily Households 19,550 24,151 1.24 | Under 6 and 6 to 17 yrs 212 0.8| 275 1.0||________________________________________________________________________| 6 to 17 yrs only 887 3.3| 1,018 3.8||P12B/P13B. POPULATION BY AGE AND SEX | No children under 18 1,521 5.7| 1,254 4.7||Universe: Persons Who Are Black or African American Alone (*) | Female householder: 10,735 40.3| 10,735 40.3|| | With children under 18: 6,698 25.2| 7,721 29.0|| ---Both Sexes--- ------Male------ -----Female----- | Under 6 yrs only 1,527 5.7| 1,796 6.7|| Number Pct. Number Pct. Number Pct. | Under 6 and 6 to 17 yrs 1,405 5.3| 1,744 6.6|| | 6 to 17 yrs only 3,766 14.2| 4,181 15.7||All Ages: 119,381 100.0 61,314 100.0 58,067 100.0 | No children under 18 4,037 15.2| 3,014 11.3|| Under 5 9,612 8.1 4,975 8.1 4,637 8.0 |__________________________________________________________________________|| 5 to 9 8,886 7.4 4,606 7.5 4,280 7.4 | || 10 to 14 8,726 7.3 4,462 7.3 4,264 7.3 | P31B. RELATIONSHIP BY HOUSEHOLD TYPE FOR THE POPULATION UNDER 18 YEARS || 15 to 17 5,534 4.6 2,846 4.6 2,688 4.6 | Universe: Persons under 18 who are || 18 and 19 3,537 3.0 1,794 2.9 1,743 3.0 | Black or African American Alone (*)(***) || 20 1,838 1.5 934 1.5 904 1.6 | Number Pct. || 21 1,628 1.4 848 1.4 780 1.3 | || 22 to 24 5,258 4.4 2,641 4.3 2,617 4.5 | Total under 18: 32,758 100.0 || 25 to 29 9,891 8.3 5,007 8.2 4,884 8.4 | In households: 32,372 98.8 || 30 to 34 9,141 7.7 4,639 7.6 4,502 7.8 | Householder or spouse 22 0.1 || 35 to 39 8,972 7.5 4,642 7.6 4,330 7.5 | Related child: 31,761 97.0 || 40 to 44 8,992 7.5 4,778 7.8 4,214 7.3 | Own child: 28,152 85.9 || 45 to 49 9,066 7.6 4,981 8.1 4,085 7.0 | In husband-wife families 13,548 41.4 || 50 to 54 8,335 7.0 4,492 7.3 3,843 6.6 | In other families (no spouse present): 14,604 44.6 || 55 to 59 6,713 5.6 3,512 5.7 3,201 5.5 | Male householder 2,091 6.4 || 60 and 61 2,351 2.0 1,159 1.9 1,192 2.1 | Female householder 12,513 38.2 || 62 to 64 2,651 2.2 1,307 2.1 1,344 2.3 | Other relatives: 3,609 11.0 || 65 and 66 1,389 1.2 707 1.2 682 1.2 | Grandchild 2,339 7.1 || 67 to 69 1,551 1.3 779 1.3 772 1.3 | Other relatives 1,270 3.9 || 70 to 74 1,981 1.7 927 1.5 1,054 1.8 | Nonrelatives 589 1.8 || 75 to 79 1,372 1.1 622 1.0 750 1.3 | In group quarters: 386 1.2 || 80 to 84 981 0.8 353 0.6 628 1.1 | Institutionalized population 158 0.5 || 85 plus 976 0.8 303 0.5 673 1.2 | Noninstitutionalized population 228 0.7 || |__________________________________________________________________________|| 0 to 17 32,758 27.4 16,889 27.5 15,869 27.3 | Note: (*) Tables with PERSONS as the universe enumerate persons according|| 18 to 64 78,373 65.6 40,734 66.4 37,639 64.8 | to their own race or ethnic category. (**) Tables with HOUSEHOLDS or || 65 plus 8,250 6.9 3,691 6.0 4,559 7.9 | HOUSEHOLDERS as the universe enumerate persons in households according || | to the race or ethnic category of the householder. (***) Responses of ||Median Age 32.5 32.6 32.4 | 'same-sex spouse' were edited during processing to 'unmarried partner.' |+===================================================================================================================================================+Source: Census 2010 Summary File 1 [machine-readable data file]/Prepared by the U.S.Census Bureau, 2011. 06NOV12 Page 35 Prepared by: Washington State Office of Financial Management, Forecasting Division.
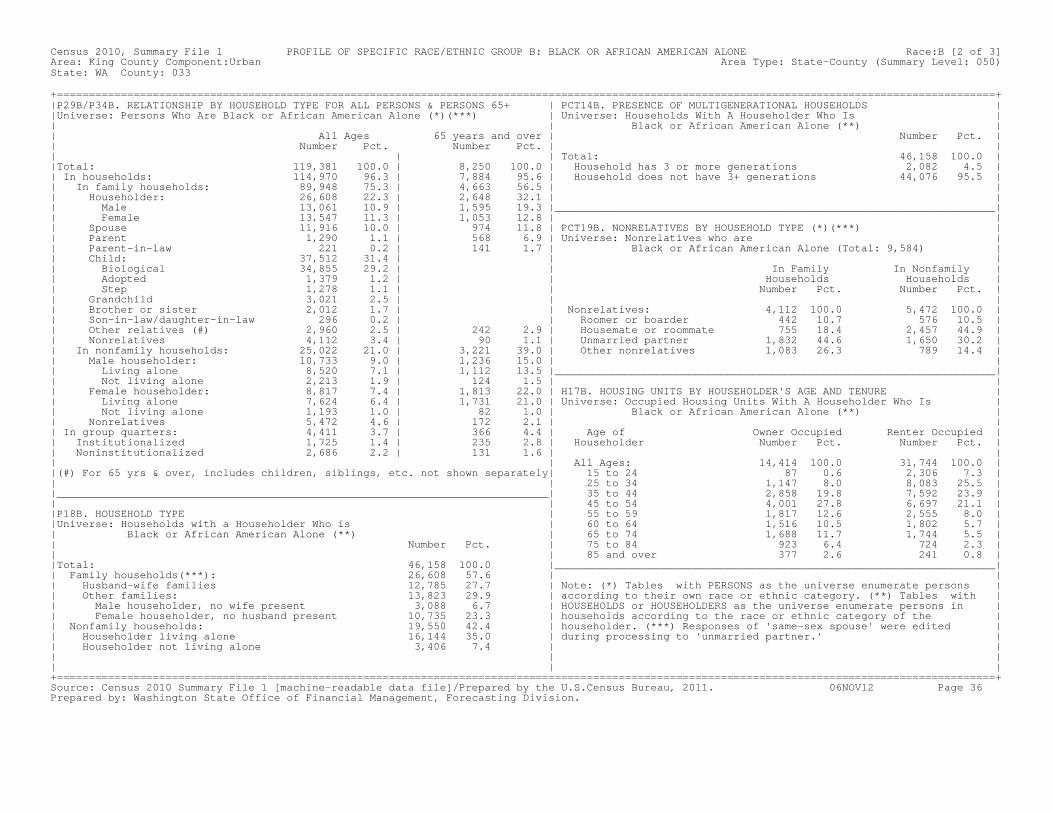
Census 2010, Summary File 1 PROFILE OF SPECIFIC RACE/ETHNIC GROUP B: BLACK OR AFRICAN AMERICAN ALONE Race:B [2 of 3]Area: King County Component:Urban Area Type: State-County (Summary Level: 050)State: WA County: 033 +===================================================================================================================================================+|P29B/P34B. RELATIONSHIP BY HOUSEHOLD TYPE FOR ALL PERSONS & PERSONS 65+ | PCT14B. PRESENCE OF MULTIGENERATIONAL HOUSEHOLDS ||Universe: Persons Who Are Black or African American Alone (*)(***) | Universe: Households With A Householder Who Is || | Black or African American Alone (**) || All Ages 65 years and over | Number Pct. || Number Pct. Number Pct. | || | | Total: 46,158 100.0 ||Total: 119,381 100.0 | 8,250 100.0 | Household has 3 or more generations 2,082 4.5 || In households: 114,970 96.3 | 7,884 95.6 | Household does not have 3+ generations 44,076 95.5 || In family households: 89,948 75.3 | 4,663 56.5 | || Householder: 26,608 22.3 | 2,648 32.1 | || Male 13,061 10.9 | 1,595 19.3 |_____________________________________________________________________|| Female 13,547 11.3 | 1,053 12.8 | || Spouse 11,916 10.0 | 974 11.8 | PCT19B. NONRELATIVES BY HOUSEHOLD TYPE (*)(***) || Parent 1,290 1.1 | 568 6.9 | Universe: Nonrelatives who are || Parent-in-law 221 0.2 | 141 1.7 | Black or African American Alone (Total: 9,584) || Child: 37,512 31.4 | | || Biological 34,855 29.2 | | In Family In Nonfamily || Adopted 1,379 1.2 | | Households Households || Step 1,278 1.1 | | Number Pct. Number Pct. || Grandchild 3,021 2.5 | | || Brother or sister 2,012 1.7 | | Nonrelatives: 4,112 100.0 5,472 100.0 || Son-in-law/daughter-in-law 296 0.2 | | Roomer or boarder 442 10.7 576 10.5 || Other relatives (#) 2,960 2.5 | 242 2.9 | Housemate or roommate 755 18.4 2,457 44.9 || Nonrelatives 4,112 3.4 | 90 1.1 | Unmarried partner 1,832 44.6 1,650 30.2 || In nonfamily households: 25,022 21.0 | 3,221 39.0 | Other nonrelatives 1,083 26.3 789 14.4 || Male householder: 10,733 9.0 | 1,236 15.0 | || Living alone 8,520 7.1 | 1,112 13.5 |_____________________________________________________________________|| Not living alone 2,213 1.9 | 124 1.5 | || Female householder: 8,817 7.4 | 1,813 22.0 | H17B. HOUSING UNITS BY HOUSEHOLDER'S AGE AND TENURE || Living alone 7,624 6.4 | 1,731 21.0 | Universe: Occupied Housing Units With A Householder Who Is || Not living alone 1,193 1.0 | 82 1.0 | Black or African American Alone (**) || Nonrelatives 5,472 4.6 | 172 2.1 | || In group quarters: 4,411 3.7 | 366 4.4 | Age of Owner Occupied Renter Occupied || Institutionalized 1,725 1.4 | 235 2.8 | Householder Number Pct. Number Pct. || Noninstitutionalized 2,686 2.2 | 131 1.6 | || | All Ages: 14,414 100.0 31,744 100.0 ||(#) For 65 yrs & over, includes children, siblings, etc. not shown separately| 15 to 24 87 0.6 2,306 7.3 || | 25 to 34 1,147 8.0 8,083 25.5 ||_____________________________________________________________________________| 35 to 44 2,858 19.8 7,592 23.9 || | 45 to 54 4,001 27.8 6,697 21.1 ||P18B. HOUSEHOLD TYPE | 55 to 59 1,817 12.6 2,555 8.0 ||Universe: Households with a Householder Who is | 60 to 64 1,516 10.5 1,802 5.7 || Black or African American Alone (**) | 65 to 74 1,688 11.7 1,744 5.5 || Number Pct. | 75 to 84 923 6.4 724 2.3 || | 85 and over 377 2.6 241 0.8 ||Total: 46,158 100.0 |_____________________________________________________________________|| Family households(***): 26,608 57.6 | || Husband-wife families 12,785 27.7 | Note: (*) Tables with PERSONS as the universe enumerate persons || Other families: 13,823 29.9 | according to their own race or ethnic category. (**) Tables with || Male householder, no wife present 3,088 6.7 | HOUSEHOLDS or HOUSEHOLDERS as the universe enumerate persons in || Female householder, no husband present 10,735 23.3 | households according to the race or ethnic category of the || Nonfamily households: 19,550 42.4 | householder. (***) Responses of 'same-sex spouse' were edited || Householder living alone 16,144 35.0 | during processing to 'unmarried partner.' || Householder not living alone 3,406 7.4 | || | || | |+===================================================================================================================================================+Source: Census 2010 Summary File 1 [machine-readable data file]/Prepared by the U.S.Census Bureau, 2011. 06NOV12 Page 36 Prepared by: Washington State Office of Financial Management, Forecasting Division.

Census 2010, Summary File 1 PROFILE OF SPECIFIC RACE/ETHNIC GROUP B: BLACK OR AFRICAN AMERICAN ALONE Race:B [3 of 3]Area: King County Component:Urban Area Type: State-County (Summary Level: 050)State: WA County: 033 +===================================================================================================================================================+|P28B/H16B. HOUSEHOLDS (OCCUPIED HOUSING UNITS) BY HOUSEHOLD SIZE BY TYPE AND BY TENURE ||Universe: Households (Occupied Housing Units) With A Householder Who Is Black or African American Alone (**)(***) || || All | Family Nonfamily | Owner Renter || Households Pct. | Households Pct. Households Pct. | Occupied Pct. Occupied Pct. || | | ||All household sizes: 46,158 100.0 | 26,608 100.0 19,550 100.0 | 14,414 100.0 31,744 100.0 || 1-person households 16,144 35.0 |(Family always >1 pers) 16,144 82.6 | 3,754 26.0 12,390 39.0 || 2-person households 11,873 25.7 | 9,150 34.4 2,723 13.9 | 4,163 28.9 7,710 24.3 || 3-person households 7,375 16.0 | 6,972 26.2 403 2.1 | 2,543 17.6 4,832 15.2 || 4-person households 5,325 11.5 | 5,171 19.4 154 0.8 | 2,086 14.5 3,239 10.2 || 5-person households 2,778 6.0 | 2,703 10.2 75 0.4 | 1,038 7.2 1,740 5.5 || 6-person households 1,360 2.9 | 1,337 5.0 23 0.1 | 472 3.3 888 2.8 || 7-or-more person households 1,303 2.8 | 1,275 4.8 28 0.1 | 358 2.5 945 3.0 || ||P16B/P17B/P36B/P37B/H11B/H12B. POPULATION IN HOUSEHOLDS AND AVERAGE HOUSEHOLD SIZE BY TYPE AND BY TENURE ||Universe: Population in Households (Occupied Housing Units) With A Householder Who Is Black or African American Alone (**) || || Total | In In | In Owner In Renter || Population Pct. | Families Pct. Nonfamilies Pct. | Occupied Pct. Occupied Pct. || | | ||Total population in households 115,734 100.0 | 88,221 76.2 24,151 20.9 | 38,832 33.6 76,902 66.4 || Under 18 years 33,826 100.0 | 33,275 98.4 ----- ----- | ----- ----- ----- ----- || 18 years and over 81,908 100.0 | 54,946 67.1 ----- ----- | ----- ----- ----- ----- ||Average Household Size 2.51 ----- | 3.32 ----- 1.24 ----- | 2.69 ----- 2.42 ----- || Under 18 years 0.73 ----- | 1.25 ----- ----- ----- | ----- ----- ----- ----- || 18 years and over 1.77 ----- | 2.07 ----- ----- ----- | ----- ----- ----- ----- || ||Note: Family household numbers include nonrelatives living with families. ||___________________________________________________________________________________________________________________________________________________|| ||PCT20B/PCT22B. GROUP QUARTERS POPULATION BY SEX BY AGE BY GROUP QUARTERS TYPE ||Universe: Population in group quarters for persons who are Black or African American Alone (*) || || || ---- All Ages ---- --------------------- 18 Years and Over ---------------------- || Pct. of Pct. of Pct. of || All Total Total || Number Pct. Total Ages Male 18+ Female 18+ || ||All types of group quarters: 4,411 100.0 4,025 91.2 2,919 72.5 1,106 27.5 || Institutionalized population: 1,725 39.1 1,567 35.5 1,231 30.6 336 8.3 || Correctional facilities for adults 1,147 26.0 1,133 25.7 1,023 25.4 110 2.7 || Juvenile facilities 155 3.5 12 0.3 6 0.1 6 0.1 || Nursing facilities/skilled-nursing facilities 398 9.0 398 9.0 182 4.5 216 5.4 || Other institutional facilities 25 0.6 24 0.5 20 0.5 4 0.1 || Noninstitutionalized population: 2,686 60.9 2,458 55.7 1,688 41.9 770 19.1 || College/university student housing 292 6.6 289 6.6 120 3.0 169 4.2 || Military quarters 24 0.5 24 0.5 22 0.5 2 0.0 || Other noninstitutional facilities 2,370 53.7 2,145 48.6 1,546 38.4 599 14.9 ||___________________________________________________________________________________________________________________________________________________||Note: (*) Tables with PERSONS as the universe enumerate persons according to their own race or ethnic category. (**) Tables with HOUSEHOLDS || or HOUSEHOLDERS as the universe enumerate persons in households according to the race or ethnic category of the householder. || (***) Same-sex couple households are included in the family households category if there is at least one additional person || related to householder by birth or adoption. Same-sex couple households with no relatives of the householder present are tabulated || in nonfamily households. Responses of 'same-sex spouse' were edited during processing to 'unmarried partner.' |+===================================================================================================================================================+Source: Census 2010 Summary File 1 [machine-readable data file]/Prepared by the U.S.Census Bureau, 2011. 06NOV12 Page 37 Prepared by: Washington State Office of Financial Management, Forecasting Division.
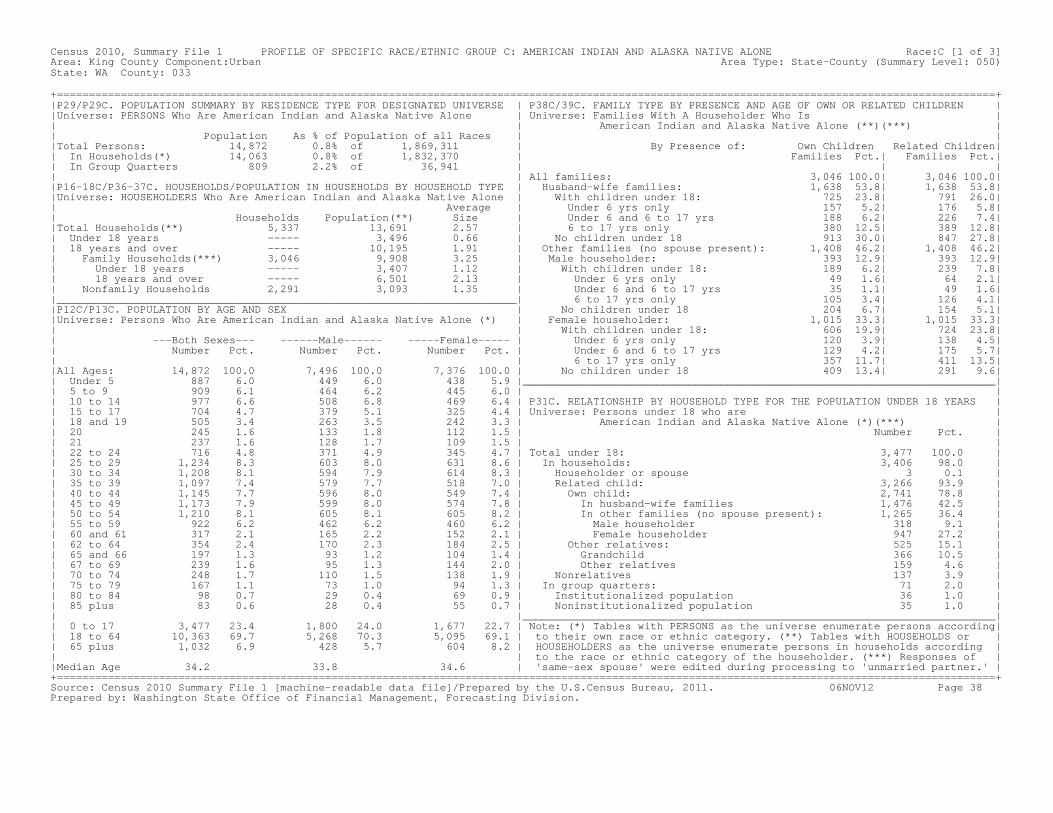
Census 2010, Summary File 1 PROFILE OF SPECIFIC RACE/ETHNIC GROUP C: AMERICAN INDIAN AND ALASKA NATIVE ALONE Race:C [1 of 3]Area: King County Component:Urban Area Type: State-County (Summary Level: 050)State: WA County: 033 +===================================================================================================================================================+|P29/P29C. POPULATION SUMMARY BY RESIDENCE TYPE FOR DESIGNATED UNIVERSE | P38C/39C. FAMILY TYPE BY PRESENCE AND AGE OF OWN OR RELATED CHILDREN ||Universe: PERSONS Who Are American Indian and Alaska Native Alone | Universe: Families With A Householder Who Is || | American Indian and Alaska Native Alone (**)(***) || Population As % of Population of all Races | ||Total Persons: 14,872 0.8% of 1,869,311 | By Presence of: Own Children Related Children|| In Households(*) 14,063 0.8% of 1,832,370 | Families Pct.| Families Pct.|| In Group Quarters 809 2.2% of 36,941 | | || | All families: 3,046 100.0| 3,046 100.0||P16-18C/P36-37C. HOUSEHOLDS/POPULATION IN HOUSEHOLDS BY HOUSEHOLD TYPE | Husband-wife families: 1,638 53.8| 1,638 53.8||Universe: HOUSEHOLDERS Who Are American Indian and Alaska Native Alone | With children under 18: 725 23.8| 791 26.0|| Average | Under 6 yrs only 157 5.2| 176 5.8|| Households Population(**) Size | Under 6 and 6 to 17 yrs 188 6.2| 226 7.4||Total Households(**) 5,337 13,691 2.57 | 6 to 17 yrs only 380 12.5| 389 12.8|| Under 18 years ----- 3,496 0.66 | No children under 18 913 30.0| 847 27.8|| 18 years and over ----- 10,195 1.91 | Other families (no spouse present): 1,408 46.2| 1,408 46.2|| Family Households(***) 3,046 9,908 3.25 | Male householder: 393 12.9| 393 12.9|| Under 18 years ----- 3,407 1.12 | With children under 18: 189 6.2| 239 7.8|| 18 years and over ----- 6,501 2.13 | Under 6 yrs only 49 1.6| 64 2.1|| Nonfamily Households 2,291 3,093 1.35 | Under 6 and 6 to 17 yrs 35 1.1| 49 1.6||________________________________________________________________________| 6 to 17 yrs only 105 3.4| 126 4.1||P12C/P13C. POPULATION BY AGE AND SEX | No children under 18 204 6.7| 154 5.1||Universe: Persons Who Are American Indian and Alaska Native Alone (*) | Female householder: 1,015 33.3| 1,015 33.3|| | With children under 18: 606 19.9| 724 23.8|| ---Both Sexes--- ------Male------ -----Female----- | Under 6 yrs only 120 3.9| 138 4.5|| Number Pct. Number Pct. Number Pct. | Under 6 and 6 to 17 yrs 129 4.2| 175 5.7|| | 6 to 17 yrs only 357 11.7| 411 13.5||All Ages: 14,872 100.0 7,496 100.0 7,376 100.0 | No children under 18 409 13.4| 291 9.6|| Under 5 887 6.0 449 6.0 438 5.9 |__________________________________________________________________________|| 5 to 9 909 6.1 464 6.2 445 6.0 | || 10 to 14 977 6.6 508 6.8 469 6.4 | P31C. RELATIONSHIP BY HOUSEHOLD TYPE FOR THE POPULATION UNDER 18 YEARS || 15 to 17 704 4.7 379 5.1 325 4.4 | Universe: Persons under 18 who are || 18 and 19 505 3.4 263 3.5 242 3.3 | American Indian and Alaska Native Alone (*)(***) || 20 245 1.6 133 1.8 112 1.5 | Number Pct. || 21 237 1.6 128 1.7 109 1.5 | || 22 to 24 716 4.8 371 4.9 345 4.7 | Total under 18: 3,477 100.0 || 25 to 29 1,234 8.3 603 8.0 631 8.6 | In households: 3,406 98.0 || 30 to 34 1,208 8.1 594 7.9 614 8.3 | Householder or spouse 3 0.1 || 35 to 39 1,097 7.4 579 7.7 518 7.0 | Related child: 3,266 93.9 || 40 to 44 1,145 7.7 596 8.0 549 7.4 | Own child: 2,741 78.8 || 45 to 49 1,173 7.9 599 8.0 574 7.8 | In husband-wife families 1,476 42.5 || 50 to 54 1,210 8.1 605 8.1 605 8.2 | In other families (no spouse present): 1,265 36.4 || 55 to 59 922 6.2 462 6.2 460 6.2 | Male householder 318 9.1 || 60 and 61 317 2.1 165 2.2 152 2.1 | Female householder 947 27.2 || 62 to 64 354 2.4 170 2.3 184 2.5 | Other relatives: 525 15.1 || 65 and 66 197 1.3 93 1.2 104 1.4 | Grandchild 366 10.5 || 67 to 69 239 1.6 95 1.3 144 2.0 | Other relatives 159 4.6 || 70 to 74 248 1.7 110 1.5 138 1.9 | Nonrelatives 137 3.9 || 75 to 79 167 1.1 73 1.0 94 1.3 | In group quarters: 71 2.0 || 80 to 84 98 0.7 29 0.4 69 0.9 | Institutionalized population 36 1.0 || 85 plus 83 0.6 28 0.4 55 0.7 | Noninstitutionalized population 35 1.0 || |__________________________________________________________________________|| 0 to 17 3,477 23.4 1,800 24.0 1,677 22.7 | Note: (*) Tables with PERSONS as the universe enumerate persons according|| 18 to 64 10,363 69.7 5,268 70.3 5,095 69.1 | to their own race or ethnic category. (**) Tables with HOUSEHOLDS or || 65 plus 1,032 6.9 428 5.7 604 8.2 | HOUSEHOLDERS as the universe enumerate persons in households according || | to the race or ethnic category of the householder. (***) Responses of ||Median Age 34.2 33.8 34.6 | 'same-sex spouse' were edited during processing to 'unmarried partner.' |+===================================================================================================================================================+Source: Census 2010 Summary File 1 [machine-readable data file]/Prepared by the U.S.Census Bureau, 2011. 06NOV12 Page 38 Prepared by: Washington State Office of Financial Management, Forecasting Division.
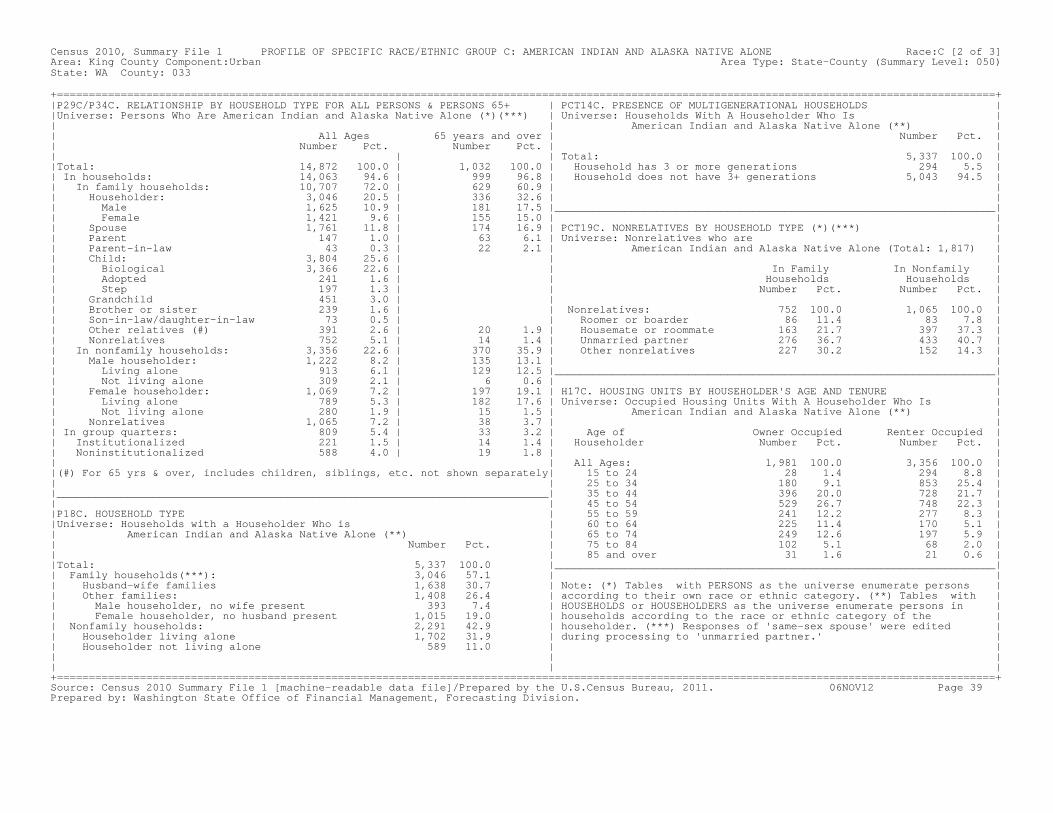
Census 2010, Summary File 1 PROFILE OF SPECIFIC RACE/ETHNIC GROUP C: AMERICAN INDIAN AND ALASKA NATIVE ALONE Race:C [2 of 3]Area: King County Component:Urban Area Type: State-County (Summary Level: 050)State: WA County: 033 +===================================================================================================================================================+|P29C/P34C. RELATIONSHIP BY HOUSEHOLD TYPE FOR ALL PERSONS & PERSONS 65+ | PCT14C. PRESENCE OF MULTIGENERATIONAL HOUSEHOLDS ||Universe: Persons Who Are American Indian and Alaska Native Alone (*)(***) | Universe: Households With A Householder Who Is || | American Indian and Alaska Native Alone (**) || All Ages 65 years and over | Number Pct. || Number Pct. Number Pct. | || | | Total: 5,337 100.0 ||Total: 14,872 100.0 | 1,032 100.0 | Household has 3 or more generations 294 5.5 || In households: 14,063 94.6 | 999 96.8 | Household does not have 3+ generations 5,043 94.5 || In family households: 10,707 72.0 | 629 60.9 | || Householder: 3,046 20.5 | 336 32.6 | || Male 1,625 10.9 | 181 17.5 |_____________________________________________________________________|| Female 1,421 9.6 | 155 15.0 | || Spouse 1,761 11.8 | 174 16.9 | PCT19C. NONRELATIVES BY HOUSEHOLD TYPE (*)(***) || Parent 147 1.0 | 63 6.1 | Universe: Nonrelatives who are || Parent-in-law 43 0.3 | 22 2.1 | American Indian and Alaska Native Alone (Total: 1,817) || Child: 3,804 25.6 | | || Biological 3,366 22.6 | | In Family In Nonfamily || Adopted 241 1.6 | | Households Households || Step 197 1.3 | | Number Pct. Number Pct. || Grandchild 451 3.0 | | || Brother or sister 239 1.6 | | Nonrelatives: 752 100.0 1,065 100.0 || Son-in-law/daughter-in-law 73 0.5 | | Roomer or boarder 86 11.4 83 7.8 || Other relatives (#) 391 2.6 | 20 1.9 | Housemate or roommate 163 21.7 397 37.3 || Nonrelatives 752 5.1 | 14 1.4 | Unmarried partner 276 36.7 433 40.7 || In nonfamily households: 3,356 22.6 | 370 35.9 | Other nonrelatives 227 30.2 152 14.3 || Male householder: 1,222 8.2 | 135 13.1 | || Living alone 913 6.1 | 129 12.5 |_____________________________________________________________________|| Not living alone 309 2.1 | 6 0.6 | || Female householder: 1,069 7.2 | 197 19.1 | H17C. HOUSING UNITS BY HOUSEHOLDER'S AGE AND TENURE || Living alone 789 5.3 | 182 17.6 | Universe: Occupied Housing Units With A Householder Who Is || Not living alone 280 1.9 | 15 1.5 | American Indian and Alaska Native Alone (**) || Nonrelatives 1,065 7.2 | 38 3.7 | || In group quarters: 809 5.4 | 33 3.2 | Age of Owner Occupied Renter Occupied || Institutionalized 221 1.5 | 14 1.4 | Householder Number Pct. Number Pct. || Noninstitutionalized 588 4.0 | 19 1.8 | || | All Ages: 1,981 100.0 3,356 100.0 ||(#) For 65 yrs & over, includes children, siblings, etc. not shown separately| 15 to 24 28 1.4 294 8.8 || | 25 to 34 180 9.1 853 25.4 ||_____________________________________________________________________________| 35 to 44 396 20.0 728 21.7 || | 45 to 54 529 26.7 748 22.3 ||P18C. HOUSEHOLD TYPE | 55 to 59 241 12.2 277 8.3 ||Universe: Households with a Householder Who is | 60 to 64 225 11.4 170 5.1 || American Indian and Alaska Native Alone (**) | 65 to 74 249 12.6 197 5.9 || Number Pct. | 75 to 84 102 5.1 68 2.0 || | 85 and over 31 1.6 21 0.6 ||Total: 5,337 100.0 |_____________________________________________________________________|| Family households(***): 3,046 57.1 | || Husband-wife families 1,638 30.7 | Note: (*) Tables with PERSONS as the universe enumerate persons || Other families: 1,408 26.4 | according to their own race or ethnic category. (**) Tables with || Male householder, no wife present 393 7.4 | HOUSEHOLDS or HOUSEHOLDERS as the universe enumerate persons in || Female householder, no husband present 1,015 19.0 | households according to the race or ethnic category of the || Nonfamily households: 2,291 42.9 | householder. (***) Responses of 'same-sex spouse' were edited || Householder living alone 1,702 31.9 | during processing to 'unmarried partner.' || Householder not living alone 589 11.0 | || | || | |+===================================================================================================================================================+Source: Census 2010 Summary File 1 [machine-readable data file]/Prepared by the U.S.Census Bureau, 2011. 06NOV12 Page 39 Prepared by: Washington State Office of Financial Management, Forecasting Division.
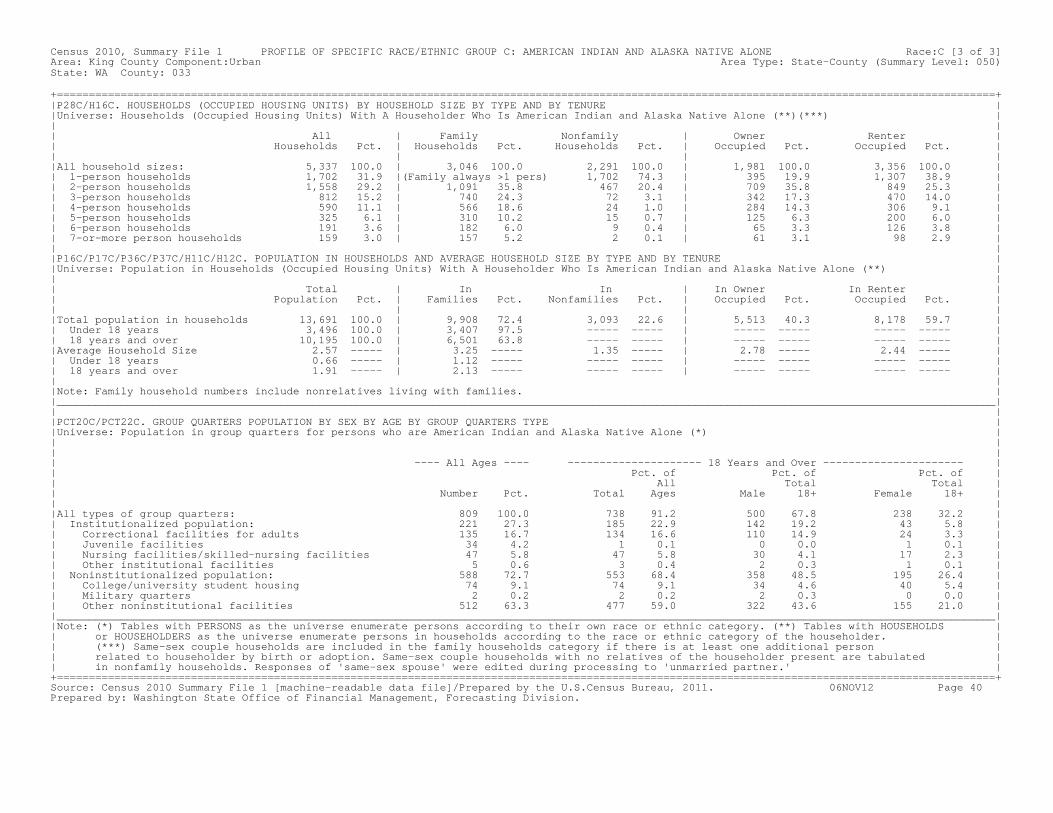
Census 2010, Summary File 1 PROFILE OF SPECIFIC RACE/ETHNIC GROUP C: AMERICAN INDIAN AND ALASKA NATIVE ALONE Race:C [3 of 3]Area: King County Component:Urban Area Type: State-County (Summary Level: 050)State: WA County: 033 +===================================================================================================================================================+|P28C/H16C. HOUSEHOLDS (OCCUPIED HOUSING UNITS) BY HOUSEHOLD SIZE BY TYPE AND BY TENURE ||Universe: Households (Occupied Housing Units) With A Householder Who Is American Indian and Alaska Native Alone (**)(***) || || All | Family Nonfamily | Owner Renter || Households Pct. | Households Pct. Households Pct. | Occupied Pct. Occupied Pct. || | | ||All household sizes: 5,337 100.0 | 3,046 100.0 2,291 100.0 | 1,981 100.0 3,356 100.0 || 1-person households 1,702 31.9 |(Family always >1 pers) 1,702 74.3 | 395 19.9 1,307 38.9 || 2-person households 1,558 29.2 | 1,091 35.8 467 20.4 | 709 35.8 849 25.3 || 3-person households 812 15.2 | 740 24.3 72 3.1 | 342 17.3 470 14.0 || 4-person households 590 11.1 | 566 18.6 24 1.0 | 284 14.3 306 9.1 || 5-person households 325 6.1 | 310 10.2 15 0.7 | 125 6.3 200 6.0 || 6-person households 191 3.6 | 182 6.0 9 0.4 | 65 3.3 126 3.8 || 7-or-more person households 159 3.0 | 157 5.2 2 0.1 | 61 3.1 98 2.9 || ||P16C/P17C/P36C/P37C/H11C/H12C. POPULATION IN HOUSEHOLDS AND AVERAGE HOUSEHOLD SIZE BY TYPE AND BY TENURE ||Universe: Population in Households (Occupied Housing Units) With A Householder Who Is American Indian and Alaska Native Alone (**) || || Total | In In | In Owner In Renter || Population Pct. | Families Pct. Nonfamilies Pct. | Occupied Pct. Occupied Pct. || | | ||Total population in households 13,691 100.0 | 9,908 72.4 3,093 22.6 | 5,513 40.3 8,178 59.7 || Under 18 years 3,496 100.0 | 3,407 97.5 ----- ----- | ----- ----- ----- ----- || 18 years and over 10,195 100.0 | 6,501 63.8 ----- ----- | ----- ----- ----- ----- ||Average Household Size 2.57 ----- | 3.25 ----- 1.35 ----- | 2.78 ----- 2.44 ----- || Under 18 years 0.66 ----- | 1.12 ----- ----- ----- | ----- ----- ----- ----- || 18 years and over 1.91 ----- | 2.13 ----- ----- ----- | ----- ----- ----- ----- || ||Note: Family household numbers include nonrelatives living with families. ||___________________________________________________________________________________________________________________________________________________|| ||PCT20C/PCT22C. GROUP QUARTERS POPULATION BY SEX BY AGE BY GROUP QUARTERS TYPE ||Universe: Population in group quarters for persons who are American Indian and Alaska Native Alone (*) || || || ---- All Ages ---- --------------------- 18 Years and Over ---------------------- || Pct. of Pct. of Pct. of || All Total Total || Number Pct. Total Ages Male 18+ Female 18+ || ||All types of group quarters: 809 100.0 738 91.2 500 67.8 238 32.2 || Institutionalized population: 221 27.3 185 22.9 142 19.2 43 5.8 || Correctional facilities for adults 135 16.7 134 16.6 110 14.9 24 3.3 || Juvenile facilities 34 4.2 1 0.1 0 0.0 1 0.1 || Nursing facilities/skilled-nursing facilities 47 5.8 47 5.8 30 4.1 17 2.3 || Other institutional facilities 5 0.6 3 0.4 2 0.3 1 0.1 || Noninstitutionalized population: 588 72.7 553 68.4 358 48.5 195 26.4 || College/university student housing 74 9.1 74 9.1 34 4.6 40 5.4 || Military quarters 2 0.2 2 0.2 2 0.3 0 0.0 || Other noninstitutional facilities 512 63.3 477 59.0 322 43.6 155 21.0 ||___________________________________________________________________________________________________________________________________________________||Note: (*) Tables with PERSONS as the universe enumerate persons according to their own race or ethnic category. (**) Tables with HOUSEHOLDS || or HOUSEHOLDERS as the universe enumerate persons in households according to the race or ethnic category of the householder. || (***) Same-sex couple households are included in the family households category if there is at least one additional person || related to householder by birth or adoption. Same-sex couple households with no relatives of the householder present are tabulated || in nonfamily households. Responses of 'same-sex spouse' were edited during processing to 'unmarried partner.' |+===================================================================================================================================================+Source: Census 2010 Summary File 1 [machine-readable data file]/Prepared by the U.S.Census Bureau, 2011. 06NOV12 Page 40 Prepared by: Washington State Office of Financial Management, Forecasting Division.

Census 2010, Summary File 1 PROFILE OF SPECIFIC RACE/ETHNIC GROUP D: ASIAN ALONE Race:D [1 of 3]Area: King County Component:Urban Area Type: State-County (Summary Level: 050)State: WA County: 033 +===================================================================================================================================================+|P29/P29D. POPULATION SUMMARY BY RESIDENCE TYPE FOR DESIGNATED UNIVERSE | P38D/39D. FAMILY TYPE BY PRESENCE AND AGE OF OWN OR RELATED CHILDREN ||Universe: PERSONS Who Are Asian Alone | Universe: Families With A Householder Who Is || | Asian Alone (**)(***) || Population As % of Population of all Races | ||Total Persons: 280,794 15.0% of 1,869,311 | By Presence of: Own Children Related Children|| In Households(*) 276,322 15.1% of 1,832,370 | Families Pct.| Families Pct.|| In Group Quarters 4,472 12.1% of 36,941 | | || | All families: 65,877 100.0| 65,877 100.0||P16-18D/P36-37D. HOUSEHOLDS/POPULATION IN HOUSEHOLDS BY HOUSEHOLD TYPE | Husband-wife families: 52,666 79.9| 52,666 79.9||Universe: HOUSEHOLDERS Who Are Asian Alone | With children under 18: 28,082 42.6| 29,347 44.5|| Average | Under 6 yrs only 9,270 14.1| 9,704 14.7|| Households Population(**) Size | Under 6 and 6 to 17 yrs 5,302 8.0| 5,782 8.8||Total Households(**) 96,433 270,170 2.80 | 6 to 17 yrs only 13,510 20.5| 13,861 21.0|| Under 18 years ----- 62,362 0.65 | No children under 18 24,584 37.3| 23,319 35.4|| 18 years and over ----- 207,808 2.15 | Other families (no spouse present): 13,211 20.1| 13,211 20.1|| Family Households(***) 65,877 222,613 3.38 | Male householder: 4,332 6.6| 4,332 6.6|| Under 18 years ----- 61,464 0.93 | With children under 18: 1,349 2.0| 1,800 2.7|| 18 years and over ----- 161,149 2.45 | Under 6 yrs only 331 0.5| 448 0.7|| Nonfamily Households 30,556 41,646 1.36 | Under 6 and 6 to 17 yrs 195 0.3| 275 0.4||________________________________________________________________________| 6 to 17 yrs only 823 1.2| 1,077 1.6||P12D/P13D. POPULATION BY AGE AND SEX | No children under 18 2,983 4.5| 2,532 3.8||Universe: Persons Who Are Asian Alone (*) | Female householder: 8,879 13.5| 8,879 13.5|| | With children under 18: 4,107 6.2| 4,863 7.4|| ---Both Sexes--- ------Male------ -----Female----- | Under 6 yrs only 683 1.0| 882 1.3|| Number Pct. Number Pct. Number Pct. | Under 6 and 6 to 17 yrs 549 0.8| 751 1.1|| | 6 to 17 yrs only 2,875 4.4| 3,230 4.9||All Ages: 280,794 100.0 133,002 100.0 147,792 100.0 | No children under 18 4,772 7.2| 4,016 6.1|| Under 5 17,698 6.3 9,009 6.8 8,689 5.9 |__________________________________________________________________________|| 5 to 9 16,820 6.0 8,475 6.4 8,345 5.6 | || 10 to 14 15,238 5.4 7,674 5.8 7,564 5.1 | P31D. RELATIONSHIP BY HOUSEHOLD TYPE FOR THE POPULATION UNDER 18 YEARS || 15 to 17 9,705 3.5 4,983 3.7 4,722 3.2 | Universe: Persons under 18 who are || 18 and 19 8,657 3.1 4,297 3.2 4,360 3.0 | Asian Alone (*)(***) || 20 4,427 1.6 2,190 1.6 2,237 1.5 | Number Pct. || 21 4,406 1.6 2,205 1.7 2,201 1.5 | || 22 to 24 12,460 4.4 6,175 4.6 6,285 4.3 | Total under 18: 59,461 100.0 || 25 to 29 26,208 9.3 12,571 9.5 13,637 9.2 | In households: 59,296 99.7 || 30 to 34 26,784 9.5 12,776 9.6 14,008 9.5 | Householder or spouse 89 0.1 || 35 to 39 26,641 9.5 12,443 9.4 14,198 9.6 | Related child: 58,189 97.9 || 40 to 44 22,059 7.9 10,246 7.7 11,813 8.0 | Own child: 53,370 89.8 || 45 to 49 19,718 7.0 9,144 6.9 10,574 7.2 | In husband-wife families 45,520 76.6 || 50 to 54 17,312 6.2 7,936 6.0 9,376 6.3 | In other families (no spouse present): 7,850 13.2 || 55 to 59 15,085 5.4 6,688 5.0 8,397 5.7 | Male householder 2,062 3.5 || 60 and 61 5,558 2.0 2,511 1.9 3,047 2.1 | Female householder 5,788 9.7 || 62 to 64 6,590 2.3 2,994 2.3 3,596 2.4 | Other relatives: 4,819 8.1 || 65 and 66 3,617 1.3 1,563 1.2 2,054 1.4 | Grandchild 2,691 4.5 || 67 to 69 4,652 1.7 2,057 1.5 2,595 1.8 | Other relatives 2,128 3.6 || 70 to 74 6,506 2.3 2,951 2.2 3,555 2.4 | Nonrelatives 1,018 1.7 || 75 to 79 4,527 1.6 1,880 1.4 2,647 1.8 | In group quarters: 165 0.3 || 80 to 84 3,241 1.2 1,196 0.9 2,045 1.4 | Institutionalized population 12 0.0 || 85 plus 2,885 1.0 1,038 0.8 1,847 1.2 | Noninstitutionalized population 153 0.3 || |__________________________________________________________________________|| 0 to 17 59,461 21.2 30,141 22.7 29,320 19.8 | Note: (*) Tables with PERSONS as the universe enumerate persons according|| 18 to 64 195,905 69.8 92,176 69.3 103,729 70.2 | to their own race or ethnic category. (**) Tables with HOUSEHOLDS or || 65 plus 25,428 9.1 10,685 8.0 14,743 10.0 | HOUSEHOLDERS as the universe enumerate persons in households according || | to the race or ethnic category of the householder. (***) Responses of ||Median Age 34.6 33.5 35.6 | 'same-sex spouse' were edited during processing to 'unmarried partner.' |+===================================================================================================================================================+Source: Census 2010 Summary File 1 [machine-readable data file]/Prepared by the U.S.Census Bureau, 2011. 06NOV12 Page 41 Prepared by: Washington State Office of Financial Management, Forecasting Division.
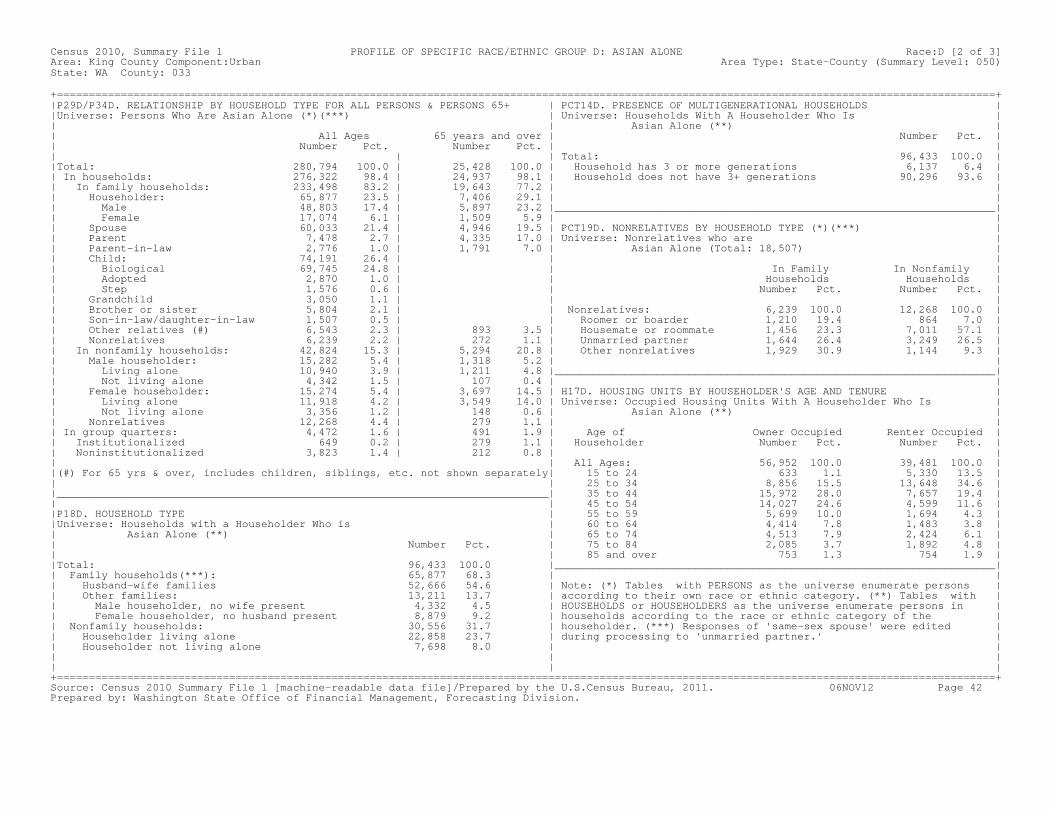
Census 2010, Summary File 1 PROFILE OF SPECIFIC RACE/ETHNIC GROUP D: ASIAN ALONE Race:D [2 of 3]Area: King County Component:Urban Area Type: State-County (Summary Level: 050)State: WA County: 033 +===================================================================================================================================================+|P29D/P34D. RELATIONSHIP BY HOUSEHOLD TYPE FOR ALL PERSONS & PERSONS 65+ | PCT14D. PRESENCE OF MULTIGENERATIONAL HOUSEHOLDS ||Universe: Persons Who Are Asian Alone (*)(***) | Universe: Households With A Householder Who Is || | Asian Alone (**) || All Ages 65 years and over | Number Pct. || Number Pct. Number Pct. | || | | Total: 96,433 100.0 ||Total: 280,794 100.0 | 25,428 100.0 | Household has 3 or more generations 6,137 6.4 || In households: 276,322 98.4 | 24,937 98.1 | Household does not have 3+ generations 90,296 93.6 || In family households: 233,498 83.2 | 19,643 77.2 | || Householder: 65,877 23.5 | 7,406 29.1 | || Male 48,803 17.4 | 5,897 23.2 |_____________________________________________________________________|| Female 17,074 6.1 | 1,509 5.9 | || Spouse 60,033 21.4 | 4,946 19.5 | PCT19D. NONRELATIVES BY HOUSEHOLD TYPE (*)(***) || Parent 7,478 2.7 | 4,335 17.0 | Universe: Nonrelatives who are || Parent-in-law 2,776 1.0 | 1,791 7.0 | Asian Alone (Total: 18,507) || Child: 74,191 26.4 | | || Biological 69,745 24.8 | | In Family In Nonfamily || Adopted 2,870 1.0 | | Households Households || Step 1,576 0.6 | | Number Pct. Number Pct. || Grandchild 3,050 1.1 | | || Brother or sister 5,804 2.1 | | Nonrelatives: 6,239 100.0 12,268 100.0 || Son-in-law/daughter-in-law 1,507 0.5 | | Roomer or boarder 1,210 19.4 864 7.0 || Other relatives (#) 6,543 2.3 | 893 3.5 | Housemate or roommate 1,456 23.3 7,011 57.1 || Nonrelatives 6,239 2.2 | 272 1.1 | Unmarried partner 1,644 26.4 3,249 26.5 || In nonfamily households: 42,824 15.3 | 5,294 20.8 | Other nonrelatives 1,929 30.9 1,144 9.3 || Male householder: 15,282 5.4 | 1,318 5.2 | || Living alone 10,940 3.9 | 1,211 4.8 |_____________________________________________________________________|| Not living alone 4,342 1.5 | 107 0.4 | || Female householder: 15,274 5.4 | 3,697 14.5 | H17D. HOUSING UNITS BY HOUSEHOLDER'S AGE AND TENURE || Living alone 11,918 4.2 | 3,549 14.0 | Universe: Occupied Housing Units With A Householder Who Is || Not living alone 3,356 1.2 | 148 0.6 | Asian Alone (**) || Nonrelatives 12,268 4.4 | 279 1.1 | || In group quarters: 4,472 1.6 | 491 1.9 | Age of Owner Occupied Renter Occupied || Institutionalized 649 0.2 | 279 1.1 | Householder Number Pct. Number Pct. || Noninstitutionalized 3,823 1.4 | 212 0.8 | || | All Ages: 56,952 100.0 39,481 100.0 ||(#) For 65 yrs & over, includes children, siblings, etc. not shown separately| 15 to 24 633 1.1 5,330 13.5 || | 25 to 34 8,856 15.5 13,648 34.6 ||_____________________________________________________________________________| 35 to 44 15,972 28.0 7,657 19.4 || | 45 to 54 14,027 24.6 4,599 11.6 ||P18D. HOUSEHOLD TYPE | 55 to 59 5,699 10.0 1,694 4.3 ||Universe: Households with a Householder Who is | 60 to 64 4,414 7.8 1,483 3.8 || Asian Alone (**) | 65 to 74 4,513 7.9 2,424 6.1 || Number Pct. | 75 to 84 2,085 3.7 1,892 4.8 || | 85 and over 753 1.3 754 1.9 ||Total: 96,433 100.0 |_____________________________________________________________________|| Family households(***): 65,877 68.3 | || Husband-wife families 52,666 54.6 | Note: (*) Tables with PERSONS as the universe enumerate persons || Other families: 13,211 13.7 | according to their own race or ethnic category. (**) Tables with || Male householder, no wife present 4,332 4.5 | HOUSEHOLDS or HOUSEHOLDERS as the universe enumerate persons in || Female householder, no husband present 8,879 9.2 | households according to the race or ethnic category of the || Nonfamily households: 30,556 31.7 | householder. (***) Responses of 'same-sex spouse' were edited || Householder living alone 22,858 23.7 | during processing to 'unmarried partner.' || Householder not living alone 7,698 8.0 | || | || | |+===================================================================================================================================================+Source: Census 2010 Summary File 1 [machine-readable data file]/Prepared by the U.S.Census Bureau, 2011. 06NOV12 Page 42 Prepared by: Washington State Office of Financial Management, Forecasting Division.

Census 2010, Summary File 1 PROFILE OF SPECIFIC RACE/ETHNIC GROUP D: ASIAN ALONE Race:D [3 of 3]Area: King County Component:Urban Area Type: State-County (Summary Level: 050)State: WA County: 033 +===================================================================================================================================================+|P28D/H16D. HOUSEHOLDS (OCCUPIED HOUSING UNITS) BY HOUSEHOLD SIZE BY TYPE AND BY TENURE ||Universe: Households (Occupied Housing Units) With A Householder Who Is Asian Alone (**)(***) || || All | Family Nonfamily | Owner Renter || Households Pct. | Households Pct. Households Pct. | Occupied Pct. Occupied Pct. || | | ||All household sizes: 96,433 100.0 | 65,877 100.0 30,556 100.0 | 56,952 100.0 39,481 100.0 || 1-person households 22,858 23.7 |(Family always >1 pers) 22,858 74.8 | 8,576 15.1 14,282 36.2 || 2-person households 26,022 27.0 | 20,382 30.9 5,640 18.5 | 14,461 25.4 11,561 29.3 || 3-person households 18,342 19.0 | 17,091 25.9 1,251 4.1 | 11,770 20.7 6,572 16.6 || 4-person households 16,650 17.3 | 16,140 24.5 510 1.7 | 12,378 21.7 4,272 10.8 || 5-person households 6,875 7.1 | 6,706 10.2 169 0.6 | 5,212 9.2 1,663 4.2 || 6-person households 3,112 3.2 | 3,035 4.6 77 0.3 | 2,460 4.3 652 1.7 || 7-or-more person households 2,574 2.7 | 2,523 3.8 51 0.2 | 2,095 3.7 479 1.2 || ||P16D/P17D/P36D/P37D/H11D/H12D. POPULATION IN HOUSEHOLDS AND AVERAGE HOUSEHOLD SIZE BY TYPE AND BY TENURE ||Universe: Population in Households (Occupied Housing Units) With A Householder Who Is Asian Alone (**) || || Total | In In | In Owner In Renter || Population Pct. | Families Pct. Nonfamilies Pct. | Occupied Pct. Occupied Pct. || | | ||Total population in households 270,170 100.0 | 222,613 82.4 41,646 15.4 | 179,919 66.6 90,251 33.4 || Under 18 years 62,362 100.0 | 61,464 98.6 ----- ----- | ----- ----- ----- ----- || 18 years and over 207,808 100.0 | 161,149 77.5 ----- ----- | ----- ----- ----- ----- ||Average Household Size 2.80 ----- | 3.38 ----- 1.36 ----- | 3.16 ----- 2.29 ----- || Under 18 years 0.65 ----- | 0.93 ----- ----- ----- | ----- ----- ----- ----- || 18 years and over 2.15 ----- | 2.45 ----- ----- ----- | ----- ----- ----- ----- || ||Note: Family household numbers include nonrelatives living with families. ||___________________________________________________________________________________________________________________________________________________|| ||PCT20D/PCT22D. GROUP QUARTERS POPULATION BY SEX BY AGE BY GROUP QUARTERS TYPE ||Universe: Population in group quarters for persons who are Asian Alone (*) || || || ---- All Ages ---- --------------------- 18 Years and Over ---------------------- || Pct. of Pct. of Pct. of || All Total Total || Number Pct. Total Ages Male 18+ Female 18+ || ||All types of group quarters: 4,472 100.0 4,307 96.3 1,980 46.0 2,327 54.0 || Institutionalized population: 649 14.5 637 14.2 297 6.9 340 7.9 || Correctional facilities for adults 188 4.2 187 4.2 147 3.4 40 0.9 || Juvenile facilities 12 0.3 1 0.0 1 0.0 0 0.0 || Nursing facilities/skilled-nursing facilities 443 9.9 443 9.9 147 3.4 296 6.9 || Other institutional facilities 6 0.1 6 0.1 2 0.0 4 0.1 || Noninstitutionalized population: 3,823 85.5 3,670 82.1 1,683 39.1 1,987 46.1 || College/university student housing 2,370 53.0 2,336 52.2 1,035 24.0 1,301 30.2 || Military quarters 16 0.4 16 0.4 15 0.3 1 0.0 || Other noninstitutional facilities 1,437 32.1 1,318 29.5 633 14.7 685 15.9 ||___________________________________________________________________________________________________________________________________________________||Note: (*) Tables with PERSONS as the universe enumerate persons according to their own race or ethnic category. (**) Tables with HOUSEHOLDS || or HOUSEHOLDERS as the universe enumerate persons in households according to the race or ethnic category of the householder. || (***) Same-sex couple households are included in the family households category if there is at least one additional person || related to householder by birth or adoption. Same-sex couple households with no relatives of the householder present are tabulated || in nonfamily households. Responses of 'same-sex spouse' were edited during processing to 'unmarried partner.' |+===================================================================================================================================================+Source: Census 2010 Summary File 1 [machine-readable data file]/Prepared by the U.S.Census Bureau, 2011. 06NOV12 Page 43 Prepared by: Washington State Office of Financial Management, Forecasting Division.

Census 2010, Summary File 1 PROFILE OF SPECIFIC RACE/ETHNIC GROUP E: NAT HAWAIIAN/OTH PACIFIC ISLANDER ALONE Race:E [1 of 3]Area: King County Component:Urban Area Type: State-County (Summary Level: 050)State: WA County: 033 +===================================================================================================================================================+|P29/P29E. POPULATION SUMMARY BY RESIDENCE TYPE FOR DESIGNATED UNIVERSE | P38E/39E. FAMILY TYPE BY PRESENCE AND AGE OF OWN OR RELATED CHILDREN ||Universe: PERSONS Who Are Nat Hawaiian/Oth Pacific Islander Alone | Universe: Families With A Householder Who Is || | Nat Hawaiian/Oth Pacific Islander Alone (**)(***) || Population As % of Population of all Races | ||Total Persons: 14,409 0.8% of 1,869,311 | By Presence of: Own Children Related Children|| In Households(*) 14,162 0.8% of 1,832,370 | Families Pct.| Families Pct.|| In Group Quarters 247 0.7% of 36,941 | | || | All families: 2,868 100.0| 2,868 100.0||P16-18E/P36-37E. HOUSEHOLDS/POPULATION IN HOUSEHOLDS BY HOUSEHOLD TYPE | Husband-wife families: 1,842 64.2| 1,842 64.2||Universe: HOUSEHOLDERS Who Are Nat Hawaiian/Oth Pacific Islander Alone | With children under 18: 1,175 41.0| 1,296 45.2|| Average | Under 6 yrs only 251 8.8| 275 9.6|| Households Population(**) Size | Under 6 and 6 to 17 yrs 328 11.4| 447 15.6||Total Households(**) 3,754 14,318 3.81 | 6 to 17 yrs only 596 20.8| 574 20.0|| Under 18 years ----- 4,996 1.33 | No children under 18 667 23.3| 546 19.0|| 18 years and over ----- 9,322 2.48 | Other families (no spouse present): 1,026 35.8| 1,026 35.8|| Family Households(***) 2,868 12,516 4.36 | Male householder: 364 12.7| 364 12.7|| Under 18 years ----- 4,934 1.72 | With children under 18: 215 7.5| 263 9.2|| 18 years and over ----- 7,582 2.64 | Under 6 yrs only 69 2.4| 76 2.6|| Nonfamily Households 886 1,278 1.44 | Under 6 and 6 to 17 yrs 48 1.7| 67 2.3||________________________________________________________________________| 6 to 17 yrs only 98 3.4| 120 4.2||P12E/P13E. POPULATION BY AGE AND SEX | No children under 18 149 5.2| 101 3.5||Universe: Persons Who Are Nat Hawaiian/Oth Pacific Islander Alone (*) | Female householder: 662 23.1| 662 23.1|| | With children under 18: 427 14.9| 528 18.4|| ---Both Sexes--- ------Male------ -----Female----- | Under 6 yrs only 99 3.5| 122 4.3|| Number Pct. Number Pct. Number Pct. | Under 6 and 6 to 17 yrs 105 3.7| 154 5.4|| | 6 to 17 yrs only 223 7.8| 252 8.8||All Ages: 14,409 100.0 7,170 100.0 7,239 100.0 | No children under 18 235 8.2| 134 4.7|| Under 5 1,350 9.4 698 9.7 652 9.0 |__________________________________________________________________________|| 5 to 9 1,181 8.2 581 8.1 600 8.3 | || 10 to 14 1,227 8.5 643 9.0 584 8.1 | P31E. RELATIONSHIP BY HOUSEHOLD TYPE FOR THE POPULATION UNDER 18 YEARS || 15 to 17 809 5.6 398 5.6 411 5.7 | Universe: Persons under 18 who are || 18 and 19 532 3.7 246 3.4 286 4.0 | Nat Hawaiian/Oth Pacific Islander Alone (*)(***) || 20 289 2.0 135 1.9 154 2.1 | Number Pct. || 21 306 2.1 161 2.2 145 2.0 | || 22 to 24 885 6.1 448 6.2 437 6.0 | Total under 18: 4,567 100.0 || 25 to 29 1,471 10.2 720 10.0 751 10.4 | In households: 4,543 99.5 || 30 to 34 1,247 8.7 637 8.9 610 8.4 | Householder or spouse 4 0.1 || 35 to 39 1,075 7.5 532 7.4 543 7.5 | Related child: 4,476 98.0 || 40 to 44 917 6.4 456 6.4 461 6.4 | Own child: 3,502 76.7 || 45 to 49 951 6.6 459 6.4 492 6.8 | In husband-wife families 2,349 51.4 || 50 to 54 787 5.5 384 5.4 403 5.6 | In other families (no spouse present): 1,153 25.2 || 55 to 59 534 3.7 274 3.8 260 3.6 | Male householder 342 7.5 || 60 and 61 166 1.2 81 1.1 85 1.2 | Female householder 811 17.8 || 62 to 64 201 1.4 108 1.5 93 1.3 | Other relatives: 974 21.3 || 65 and 66 103 0.7 55 0.8 48 0.7 | Grandchild 459 10.1 || 67 to 69 105 0.7 47 0.7 58 0.8 | Other relatives 515 11.3 || 70 to 74 118 0.8 50 0.7 68 0.9 | Nonrelatives 63 1.4 || 75 to 79 86 0.6 36 0.5 50 0.7 | In group quarters: 24 0.5 || 80 to 84 43 0.3 15 0.2 28 0.4 | Institutionalized population 2 0.0 || 85 plus 26 0.2 6 0.1 20 0.3 | Noninstitutionalized population 22 0.5 || |__________________________________________________________________________|| 0 to 17 4,567 31.7 2,320 32.4 2,247 31.0 | Note: (*) Tables with PERSONS as the universe enumerate persons according|| 18 to 64 9,361 65.0 4,641 64.7 4,720 65.2 | to their own race or ethnic category. (**) Tables with HOUSEHOLDS or || 65 plus 481 3.3 209 2.9 272 3.8 | HOUSEHOLDERS as the universe enumerate persons in households according || | to the race or ethnic category of the householder. (***) Responses of ||Median Age 27.1 27.0 27.3 | 'same-sex spouse' were edited during processing to 'unmarried partner.' |+===================================================================================================================================================+Source: Census 2010 Summary File 1 [machine-readable data file]/Prepared by the U.S.Census Bureau, 2011. 06NOV12 Page 44 Prepared by: Washington State Office of Financial Management, Forecasting Division.

Census 2010, Summary File 1 PROFILE OF SPECIFIC RACE/ETHNIC GROUP E: NAT HAWAIIAN/OTH PACIFIC ISLANDER ALONE Race:E [2 of 3]Area: King County Component:Urban Area Type: State-County (Summary Level: 050)State: WA County: 033 +===================================================================================================================================================+|P29E/P34E. RELATIONSHIP BY HOUSEHOLD TYPE FOR ALL PERSONS & PERSONS 65+ | PCT14E. PRESENCE OF MULTIGENERATIONAL HOUSEHOLDS ||Universe: Persons Who Are Nat Hawaiian/Oth Pacific Islander Alone (*)(***) | Universe: Households With A Householder Who Is || | Nat Hawaiian/Oth Pacific Islander Alone (**) || All Ages 65 years and over | Number Pct. || Number Pct. Number Pct. | || | | Total: 3,754 100.0 ||Total: 14,409 100.0 | 481 100.0 | Household has 3 or more generations 431 11.5 || In households: 14,162 98.3 | 465 96.7 | Household does not have 3+ generations 3,323 88.5 || In family households: 12,700 88.1 | 395 82.1 | || Householder: 2,868 19.9 | 143 29.7 | || Male 1,760 12.2 | 103 21.4 |_____________________________________________________________________|| Female 1,108 7.7 | 40 8.3 | || Spouse 1,892 13.1 | 62 12.9 | PCT19E. NONRELATIVES BY HOUSEHOLD TYPE (*)(***) || Parent 297 2.1 | 112 23.3 | Universe: Nonrelatives who are || Parent-in-law 91 0.6 | 42 8.7 | Nat Hawaiian/Oth Pacific Islander Alone (Total: 1,149) || Child: 4,704 32.6 | | || Biological 4,374 30.4 | | In Family In Nonfamily || Adopted 169 1.2 | | Households Households || Step 161 1.1 | | Number Pct. Number Pct. || Grandchild 497 3.4 | | || Brother or sister 501 3.5 | | Nonrelatives: 573 100.0 576 100.0 || Son-in-law/daughter-in-law 178 1.2 | | Roomer or boarder 37 6.5 26 4.5 || Other relatives (#) 1,099 7.6 | 32 6.7 | Housemate or roommate 81 14.1 231 40.1 || Nonrelatives 573 4.0 | 4 0.8 | Unmarried partner 304 53.1 224 38.9 || In nonfamily households: 1,462 10.1 | 70 14.6 | Other nonrelatives 151 26.4 95 16.5 || Male householder: 538 3.7 | 24 5.0 | || Living alone 366 2.5 | 24 5.0 |_____________________________________________________________________|| Not living alone 172 1.2 | 0 0.0 | || Female householder: 348 2.4 | 33 6.9 | H17E. HOUSING UNITS BY HOUSEHOLDER'S AGE AND TENURE || Living alone 240 1.7 | 31 6.4 | Universe: Occupied Housing Units With A Householder Who Is || Not living alone 108 0.7 | 2 0.4 | Nat Hawaiian/Oth Pacific Islander Alone (**) || Nonrelatives 576 4.0 | 13 2.7 | || In group quarters: 247 1.7 | 16 3.3 | Age of Owner Occupied Renter Occupied || Institutionalized 57 0.4 | 14 2.9 | Householder Number Pct. Number Pct. || Noninstitutionalized 190 1.3 | 2 0.4 | || | All Ages: 1,128 100.0 2,626 100.0 ||(#) For 65 yrs & over, includes children, siblings, etc. not shown separately| 15 to 24 19 1.7 266 10.1 || | 25 to 34 188 16.7 859 32.7 ||_____________________________________________________________________________| 35 to 44 284 25.2 674 25.7 || | 45 to 54 333 29.5 508 19.3 ||P18E. HOUSEHOLD TYPE | 55 to 59 127 11.3 126 4.8 ||Universe: Households with a Householder Who is | 60 to 64 79 7.0 91 3.5 || Nat Hawaiian/Oth Pacific Islander Alone (**) | 65 to 74 72 6.4 72 2.7 || Number Pct. | 75 to 84 22 2.0 28 1.1 || | 85 and over 4 0.4 2 0.1 ||Total: 3,754 100.0 |_____________________________________________________________________|| Family households(***): 2,868 76.4 | || Husband-wife families 1,842 49.1 | Note: (*) Tables with PERSONS as the universe enumerate persons || Other families: 1,026 27.3 | according to their own race or ethnic category. (**) Tables with || Male householder, no wife present 364 9.7 | HOUSEHOLDS or HOUSEHOLDERS as the universe enumerate persons in || Female householder, no husband present 662 17.6 | households according to the race or ethnic category of the || Nonfamily households: 886 23.6 | householder. (***) Responses of 'same-sex spouse' were edited || Householder living alone 606 16.1 | during processing to 'unmarried partner.' || Householder not living alone 280 7.5 | || | || | |+===================================================================================================================================================+Source: Census 2010 Summary File 1 [machine-readable data file]/Prepared by the U.S.Census Bureau, 2011. 06NOV12 Page 45 Prepared by: Washington State Office of Financial Management, Forecasting Division.
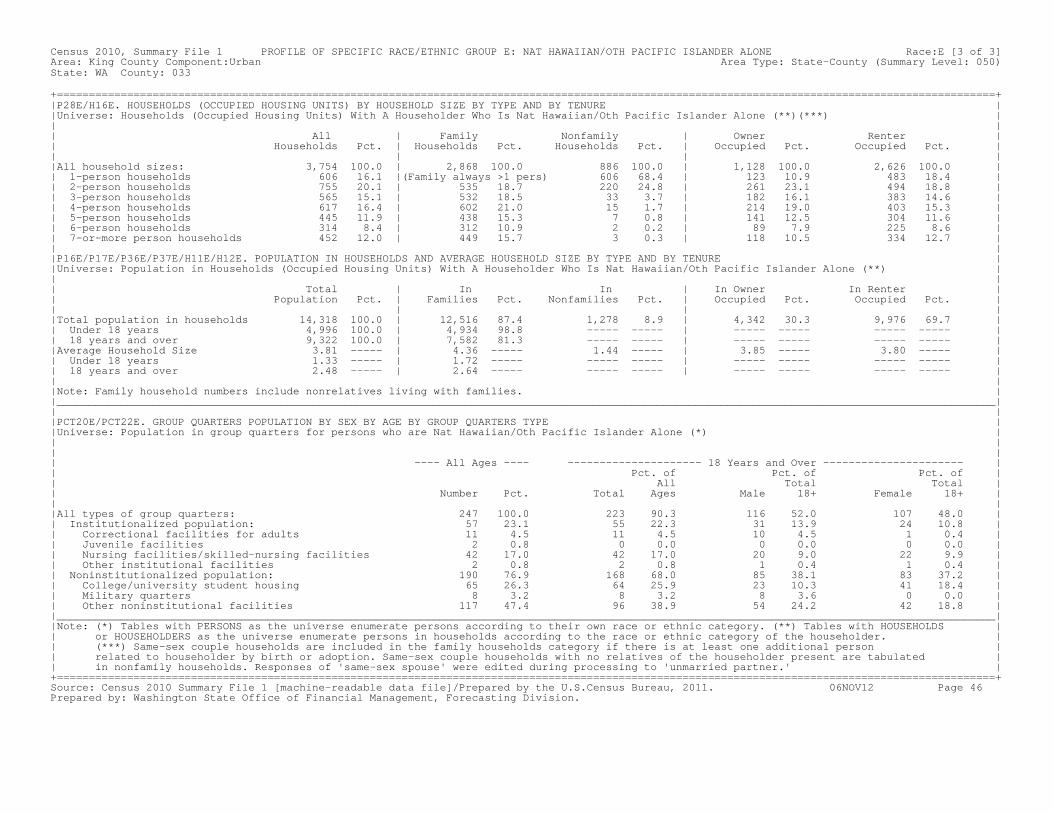
Census 2010, Summary File 1 PROFILE OF SPECIFIC RACE/ETHNIC GROUP E: NAT HAWAIIAN/OTH PACIFIC ISLANDER ALONE Race:E [3 of 3]Area: King County Component:Urban Area Type: State-County (Summary Level: 050)State: WA County: 033 +===================================================================================================================================================+|P28E/H16E. HOUSEHOLDS (OCCUPIED HOUSING UNITS) BY HOUSEHOLD SIZE BY TYPE AND BY TENURE ||Universe: Households (Occupied Housing Units) With A Householder Who Is Nat Hawaiian/Oth Pacific Islander Alone (**)(***) || || All | Family Nonfamily | Owner Renter || Households Pct. | Households Pct. Households Pct. | Occupied Pct. Occupied Pct. || | | ||All household sizes: 3,754 100.0 | 2,868 100.0 886 100.0 | 1,128 100.0 2,626 100.0 || 1-person households 606 16.1 |(Family always >1 pers) 606 68.4 | 123 10.9 483 18.4 || 2-person households 755 20.1 | 535 18.7 220 24.8 | 261 23.1 494 18.8 || 3-person households 565 15.1 | 532 18.5 33 3.7 | 182 16.1 383 14.6 || 4-person households 617 16.4 | 602 21.0 15 1.7 | 214 19.0 403 15.3 || 5-person households 445 11.9 | 438 15.3 7 0.8 | 141 12.5 304 11.6 || 6-person households 314 8.4 | 312 10.9 2 0.2 | 89 7.9 225 8.6 || 7-or-more person households 452 12.0 | 449 15.7 3 0.3 | 118 10.5 334 12.7 || ||P16E/P17E/P36E/P37E/H11E/H12E. POPULATION IN HOUSEHOLDS AND AVERAGE HOUSEHOLD SIZE BY TYPE AND BY TENURE ||Universe: Population in Households (Occupied Housing Units) With A Householder Who Is Nat Hawaiian/Oth Pacific Islander Alone (**) || || Total | In In | In Owner In Renter || Population Pct. | Families Pct. Nonfamilies Pct. | Occupied Pct. Occupied Pct. || | | ||Total population in households 14,318 100.0 | 12,516 87.4 1,278 8.9 | 4,342 30.3 9,976 69.7 || Under 18 years 4,996 100.0 | 4,934 98.8 ----- ----- | ----- ----- ----- ----- || 18 years and over 9,322 100.0 | 7,582 81.3 ----- ----- | ----- ----- ----- ----- ||Average Household Size 3.81 ----- | 4.36 ----- 1.44 ----- | 3.85 ----- 3.80 ----- || Under 18 years 1.33 ----- | 1.72 ----- ----- ----- | ----- ----- ----- ----- || 18 years and over 2.48 ----- | 2.64 ----- ----- ----- | ----- ----- ----- ----- || ||Note: Family household numbers include nonrelatives living with families. ||___________________________________________________________________________________________________________________________________________________|| ||PCT20E/PCT22E. GROUP QUARTERS POPULATION BY SEX BY AGE BY GROUP QUARTERS TYPE ||Universe: Population in group quarters for persons who are Nat Hawaiian/Oth Pacific Islander Alone (*) || || || ---- All Ages ---- --------------------- 18 Years and Over ---------------------- || Pct. of Pct. of Pct. of || All Total Total || Number Pct. Total Ages Male 18+ Female 18+ || ||All types of group quarters: 247 100.0 223 90.3 116 52.0 107 48.0 || Institutionalized population: 57 23.1 55 22.3 31 13.9 24 10.8 || Correctional facilities for adults 11 4.5 11 4.5 10 4.5 1 0.4 || Juvenile facilities 2 0.8 0 0.0 0 0.0 0 0.0 || Nursing facilities/skilled-nursing facilities 42 17.0 42 17.0 20 9.0 22 9.9 || Other institutional facilities 2 0.8 2 0.8 1 0.4 1 0.4 || Noninstitutionalized population: 190 76.9 168 68.0 85 38.1 83 37.2 || College/university student housing 65 26.3 64 25.9 23 10.3 41 18.4 || Military quarters 8 3.2 8 3.2 8 3.6 0 0.0 || Other noninstitutional facilities 117 47.4 96 38.9 54 24.2 42 18.8 ||___________________________________________________________________________________________________________________________________________________||Note: (*) Tables with PERSONS as the universe enumerate persons according to their own race or ethnic category. (**) Tables with HOUSEHOLDS || or HOUSEHOLDERS as the universe enumerate persons in households according to the race or ethnic category of the householder. || (***) Same-sex couple households are included in the family households category if there is at least one additional person || related to householder by birth or adoption. Same-sex couple households with no relatives of the householder present are tabulated || in nonfamily households. Responses of 'same-sex spouse' were edited during processing to 'unmarried partner.' |+===================================================================================================================================================+Source: Census 2010 Summary File 1 [machine-readable data file]/Prepared by the U.S.Census Bureau, 2011. 06NOV12 Page 46 Prepared by: Washington State Office of Financial Management, Forecasting Division.

Census 2010, Summary File 1 PROFILE OF SPECIFIC RACE/ETHNIC GROUP F: SOME OTHER RACE ALONE Race:F [1 of 3]Area: King County Component:Urban Area Type: State-County (Summary Level: 050)State: WA County: 033 +===================================================================================================================================================+|P29/P29F. POPULATION SUMMARY BY RESIDENCE TYPE FOR DESIGNATED UNIVERSE | P38F/39F. FAMILY TYPE BY PRESENCE AND AGE OF OWN OR RELATED CHILDREN ||Universe: PERSONS Who Are Some Other Race Alone | Universe: Families With A Householder Who Is || | Some Other Race Alone (**)(***) || Population As % of Population of all Races | ||Total Persons: 75,154 4.0% of 1,869,311 | By Presence of: Own Children Related Children|| In Households(*) 74,184 4.0% of 1,832,370 | Families Pct.| Families Pct.|| In Group Quarters 970 2.6% of 36,941 | | || | All families: 14,860 100.0| 14,860 100.0||P16-18F/P36-37F. HOUSEHOLDS/POPULATION IN HOUSEHOLDS BY HOUSEHOLD TYPE | Husband-wife families: 9,268 62.4| 9,268 62.4||Universe: HOUSEHOLDERS Who Are Some Other Race Alone | With children under 18: 6,873 46.3| 7,161 48.2|| Average | Under 6 yrs only 1,703 11.5| 1,739 11.7|| Households Population(**) Size | Under 6 and 6 to 17 yrs 2,382 16.0| 2,743 18.5||Total Households(**) 20,107 72,510 3.61 | 6 to 17 yrs only 2,788 18.8| 2,679 18.0|| Under 18 years ----- 24,914 1.24 | No children under 18 2,395 16.1| 2,107 14.2|| 18 years and over ----- 47,596 2.37 | Other families (no spouse present): 5,592 37.6| 5,592 37.6|| Family Households(***) 14,860 59,110 3.98 | Male householder: 2,477 16.7| 2,477 16.7|| Under 18 years ----- 24,262 1.63 | With children under 18: 1,228 8.3| 1,549 10.4|| 18 years and over ----- 34,848 2.35 | Under 6 yrs only 471 3.2| 553 3.7|| Nonfamily Households 5,247 8,809 1.68 | Under 6 and 6 to 17 yrs 289 1.9| 395 2.7||________________________________________________________________________| 6 to 17 yrs only 468 3.1| 601 4.0||P12F/P13F. POPULATION BY AGE AND SEX | No children under 18 1,249 8.4| 928 6.2||Universe: Persons Who Are Some Other Race Alone (*) | Female householder: 3,115 21.0| 3,115 21.0|| | With children under 18: 2,345 15.8| 2,582 17.4|| ---Both Sexes--- ------Male------ -----Female----- | Under 6 yrs only 544 3.7| 610 4.1|| Number Pct. Number Pct. Number Pct. | Under 6 and 6 to 17 yrs 644 4.3| 818 5.5|| | 6 to 17 yrs only 1,157 7.8| 1,154 7.8||All Ages: 75,154 100.0 41,182 100.0 33,972 100.0 | No children under 18 770 5.2| 533 3.6|| Under 5 7,927 10.5 4,098 10.0 3,829 11.3 |__________________________________________________________________________|| 5 to 9 7,004 9.3 3,601 8.7 3,403 10.0 | || 10 to 14 6,289 8.4 3,296 8.0 2,993 8.8 | P31F. RELATIONSHIP BY HOUSEHOLD TYPE FOR THE POPULATION UNDER 18 YEARS || 15 to 17 3,620 4.8 1,889 4.6 1,731 5.1 | Universe: Persons under 18 who are || 18 and 19 2,441 3.2 1,296 3.1 1,145 3.4 | Some Other Race Alone (*)(***) || 20 1,371 1.8 739 1.8 632 1.9 | Number Pct. || 21 1,462 1.9 835 2.0 627 1.8 | || 22 to 24 4,616 6.1 2,628 6.4 1,988 5.9 | Total under 18: 24,840 100.0 || 25 to 29 8,842 11.8 5,102 12.4 3,740 11.0 | In households: 24,716 99.5 || 30 to 34 8,591 11.4 4,919 11.9 3,672 10.8 | Householder or spouse 25 0.1 || 35 to 39 7,155 9.5 4,040 9.8 3,115 9.2 | Related child: 23,991 96.6 || 40 to 44 5,341 7.1 3,018 7.3 2,323 6.8 | Own child: 21,175 85.2 || 45 to 49 3,812 5.1 2,149 5.2 1,663 4.9 | In husband-wife families 14,740 59.3 || 50 to 54 2,631 3.5 1,493 3.6 1,138 3.3 | In other families (no spouse present): 6,435 25.9 || 55 to 59 1,654 2.2 924 2.2 730 2.1 | Male householder 2,003 8.1 || 60 and 61 433 0.6 214 0.5 219 0.6 | Female householder 4,432 17.8 || 62 to 64 595 0.8 298 0.7 297 0.9 | Other relatives: 2,816 11.3 || 65 and 66 287 0.4 149 0.4 138 0.4 | Grandchild 1,065 4.3 || 67 to 69 316 0.4 152 0.4 164 0.5 | Other relatives 1,751 7.0 || 70 to 74 335 0.4 160 0.4 175 0.5 | Nonrelatives 700 2.8 || 75 to 79 216 0.3 104 0.3 112 0.3 | In group quarters: 124 0.5 || 80 to 84 111 0.1 40 0.1 71 0.2 | Institutionalized population 31 0.1 || 85 plus 105 0.1 38 0.1 67 0.2 | Noninstitutionalized population 93 0.4 || |__________________________________________________________________________|| 0 to 17 24,840 33.1 12,884 31.3 11,956 35.2 | Note: (*) Tables with PERSONS as the universe enumerate persons according|| 18 to 64 48,944 65.1 27,655 67.2 21,289 62.7 | to their own race or ethnic category. (**) Tables with HOUSEHOLDS or || 65 plus 1,370 1.8 643 1.6 727 2.1 | HOUSEHOLDERS as the universe enumerate persons in households according || | to the race or ethnic category of the householder. (***) Responses of ||Median Age 26.6 27.2 25.9 | 'same-sex spouse' were edited during processing to 'unmarried partner.' |+===================================================================================================================================================+Source: Census 2010 Summary File 1 [machine-readable data file]/Prepared by the U.S.Census Bureau, 2011. 06NOV12 Page 47 Prepared by: Washington State Office of Financial Management, Forecasting Division.

Census 2010, Summary File 1 PROFILE OF SPECIFIC RACE/ETHNIC GROUP F: SOME OTHER RACE ALONE Race:F [2 of 3]Area: King County Component:Urban Area Type: State-County (Summary Level: 050)State: WA County: 033 +===================================================================================================================================================+|P29F/P34F. RELATIONSHIP BY HOUSEHOLD TYPE FOR ALL PERSONS & PERSONS 65+ | PCT14F. PRESENCE OF MULTIGENERATIONAL HOUSEHOLDS ||Universe: Persons Who Are Some Other Race Alone (*)(***) | Universe: Households With A Householder Who Is || | Some Other Race Alone (**) || All Ages 65 years and over | Number Pct. || Number Pct. Number Pct. | || | | Total: 20,107 100.0 ||Total: 75,154 100.0 | 1,370 100.0 | Household has 3 or more generations 1,234 6.1 || In households: 74,184 98.7 | 1,348 98.4 | Household does not have 3+ generations 18,873 93.9 || In family households: 64,812 86.2 | 1,034 75.5 | || Householder: 14,860 19.8 | 330 24.1 | || Male 9,758 13.0 | 241 17.6 |_____________________________________________________________________|| Female 5,102 6.8 | 89 6.5 | || Spouse 10,121 13.5 | 174 12.7 | PCT19F. NONRELATIVES BY HOUSEHOLD TYPE (*)(***) || Parent 969 1.3 | 286 20.9 | Universe: Nonrelatives who are || Parent-in-law 314 0.4 | 117 8.5 | Some Other Race Alone (Total: 8,969) || Child: 25,402 33.8 | | || Biological 23,823 31.7 | | In Family In Nonfamily || Adopted 505 0.7 | | Households Households || Step 1,074 1.4 | | Number Pct. Number Pct. || Grandchild 1,122 1.5 | | || Brother or sister 2,548 3.4 | | Nonrelatives: 4,844 100.0 4,125 100.0 || Son-in-law/daughter-in-law 477 0.6 | | Roomer or boarder 564 11.6 419 10.2 || Other relatives (#) 4,155 5.5 | 94 6.9 | Housemate or roommate 1,335 27.6 2,108 51.1 || Nonrelatives 4,844 6.4 | 33 2.4 | Unmarried partner 1,629 33.6 1,027 24.9 || In nonfamily households: 9,372 12.5 | 314 22.9 | Other nonrelatives 1,316 27.2 571 13.8 || Male householder: 3,512 4.7 | 109 8.0 | || Living alone 1,980 2.6 | 90 6.6 |_____________________________________________________________________|| Not living alone 1,532 2.0 | 19 1.4 | || Female householder: 1,735 2.3 | 158 11.5 | H17F. HOUSING UNITS BY HOUSEHOLDER'S AGE AND TENURE || Living alone 1,148 1.5 | 148 10.8 | Universe: Occupied Housing Units With A Householder Who Is || Not living alone 587 0.8 | 10 0.7 | Some Other Race Alone (**) || Nonrelatives 4,125 5.5 | 47 3.4 | || In group quarters: 970 1.3 | 22 1.6 | Age of Owner Occupied Renter Occupied || Institutionalized 233 0.3 | 8 0.6 | Householder Number Pct. Number Pct. || Noninstitutionalized 737 1.0 | 14 1.0 | || | All Ages: 5,995 100.0 14,112 100.0 ||(#) For 65 yrs & over, includes children, siblings, etc. not shown separately| 15 to 24 103 1.7 1,832 13.0 || | 25 to 34 1,354 22.6 5,592 39.6 ||_____________________________________________________________________________| 35 to 44 2,089 34.8 3,923 27.8 || | 45 to 54 1,487 24.8 1,808 12.8 ||P18F. HOUSEHOLD TYPE | 55 to 59 410 6.8 417 3.0 ||Universe: Households with a Householder Who is | 60 to 64 252 4.2 243 1.7 || Some Other Race Alone (**) | 65 to 74 213 3.6 199 1.4 || Number Pct. | 75 to 84 68 1.1 75 0.5 || | 85 and over 19 0.3 23 0.2 ||Total: 20,107 100.0 |_____________________________________________________________________|| Family households(***): 14,860 73.9 | || Husband-wife families 9,268 46.1 | Note: (*) Tables with PERSONS as the universe enumerate persons || Other families: 5,592 27.8 | according to their own race or ethnic category. (**) Tables with || Male householder, no wife present 2,477 12.3 | HOUSEHOLDS or HOUSEHOLDERS as the universe enumerate persons in || Female householder, no husband present 3,115 15.5 | households according to the race or ethnic category of the || Nonfamily households: 5,247 26.1 | householder. (***) Responses of 'same-sex spouse' were edited || Householder living alone 3,128 15.6 | during processing to 'unmarried partner.' || Householder not living alone 2,119 10.5 | || | || | |+===================================================================================================================================================+Source: Census 2010 Summary File 1 [machine-readable data file]/Prepared by the U.S.Census Bureau, 2011. 06NOV12 Page 48 Prepared by: Washington State Office of Financial Management, Forecasting Division.

Census 2010, Summary File 1 PROFILE OF SPECIFIC RACE/ETHNIC GROUP F: SOME OTHER RACE ALONE Race:F [3 of 3]Area: King County Component:Urban Area Type: State-County (Summary Level: 050)State: WA County: 033 +===================================================================================================================================================+|P28F/H16F. HOUSEHOLDS (OCCUPIED HOUSING UNITS) BY HOUSEHOLD SIZE BY TYPE AND BY TENURE ||Universe: Households (Occupied Housing Units) With A Householder Who Is Some Other Race Alone (**)(***) || || All | Family Nonfamily | Owner Renter || Households Pct. | Households Pct. Households Pct. | Occupied Pct. Occupied Pct. || | | ||All household sizes: 20,107 100.0 | 14,860 100.0 5,247 100.0 | 5,995 100.0 14,112 100.0 || 1-person households 3,128 15.6 |(Family always >1 pers) 3,128 59.6 | 631 10.5 2,497 17.7 || 2-person households 3,816 19.0 | 2,447 16.5 1,369 26.1 | 1,098 18.3 2,718 19.3 || 3-person households 3,431 17.1 | 3,065 20.6 366 7.0 | 957 16.0 2,474 17.5 || 4-person households 3,817 19.0 | 3,595 24.2 222 4.2 | 1,207 20.1 2,610 18.5 || 5-person households 2,812 14.0 | 2,720 18.3 92 1.8 | 879 14.7 1,933 13.7 || 6-person households 1,516 7.5 | 1,481 10.0 35 0.7 | 533 8.9 983 7.0 || 7-or-more person households 1,587 7.9 | 1,552 10.4 35 0.7 | 690 11.5 897 6.4 || ||P16F/P17F/P36F/P37F/H11F/H12F. POPULATION IN HOUSEHOLDS AND AVERAGE HOUSEHOLD SIZE BY TYPE AND BY TENURE ||Universe: Population in Households (Occupied Housing Units) With A Householder Who Is Some Other Race Alone (**) || || Total | In In | In Owner In Renter || Population Pct. | Families Pct. Nonfamilies Pct. | Occupied Pct. Occupied Pct. || | | ||Total population in households 72,510 100.0 | 59,110 81.5 8,809 12.1 | 23,919 33.0 48,591 67.0 || Under 18 years 24,914 100.0 | 24,262 97.4 ----- ----- | ----- ----- ----- ----- || 18 years and over 47,596 100.0 | 34,848 73.2 ----- ----- | ----- ----- ----- ----- ||Average Household Size 3.61 ----- | 3.98 ----- 1.68 ----- | 3.99 ----- 3.44 ----- || Under 18 years 1.24 ----- | 1.63 ----- ----- ----- | ----- ----- ----- ----- || 18 years and over 2.37 ----- | 2.35 ----- ----- ----- | ----- ----- ----- ----- || ||Note: Family household numbers include nonrelatives living with families. ||___________________________________________________________________________________________________________________________________________________|| ||PCT20F/PCT22F. GROUP QUARTERS POPULATION BY SEX BY AGE BY GROUP QUARTERS TYPE ||Universe: Population in group quarters for persons who are Some Other Race Alone (*) || || || ---- All Ages ---- --------------------- 18 Years and Over ---------------------- || Pct. of Pct. of Pct. of || All Total Total || Number Pct. Total Ages Male 18+ Female 18+ || ||All types of group quarters: 970 100.0 846 87.2 606 71.6 240 28.4 || Institutionalized population: 233 24.0 202 20.8 162 19.1 40 4.7 || Correctional facilities for adults 171 17.6 171 17.6 143 16.9 28 3.3 || Juvenile facilities 34 3.5 3 0.3 2 0.2 1 0.1 || Nursing facilities/skilled-nursing facilities 28 2.9 28 2.9 17 2.0 11 1.3 || Other institutional facilities 0 0.0 0 0.0 0 0.0 0 0.0 || Noninstitutionalized population: 737 76.0 644 66.4 444 52.5 200 23.6 || College/university student housing 215 22.2 215 22.2 99 11.7 116 13.7 || Military quarters 6 0.6 6 0.6 5 0.6 1 0.1 || Other noninstitutional facilities 516 53.2 423 43.6 340 40.2 83 9.8 ||___________________________________________________________________________________________________________________________________________________||Note: (*) Tables with PERSONS as the universe enumerate persons according to their own race or ethnic category. (**) Tables with HOUSEHOLDS || or HOUSEHOLDERS as the universe enumerate persons in households according to the race or ethnic category of the householder. || (***) Same-sex couple households are included in the family households category if there is at least one additional person || related to householder by birth or adoption. Same-sex couple households with no relatives of the householder present are tabulated || in nonfamily households. Responses of 'same-sex spouse' were edited during processing to 'unmarried partner.' |+===================================================================================================================================================+Source: Census 2010 Summary File 1 [machine-readable data file]/Prepared by the U.S.Census Bureau, 2011. 06NOV12 Page 49 Prepared by: Washington State Office of Financial Management, Forecasting Division.

Census 2010, Summary File 1 PROFILE OF SPECIFIC RACE/ETHNIC GROUP G: TWO OR MORE RACES Race:G [1 of 3]Area: King County Component:Urban Area Type: State-County (Summary Level: 050)State: WA County: 033 +===================================================================================================================================================+|P29/P29G. POPULATION SUMMARY BY RESIDENCE TYPE FOR DESIGNATED UNIVERSE | P38G/39G. FAMILY TYPE BY PRESENCE AND AGE OF OWN OR RELATED CHILDREN ||Universe: PERSONS Who Are Two or More Races | Universe: Families With A Householder Who Is || | Two or More Races (**)(***) || Population As % of Population of all Races | ||Total Persons: 94,896 5.1% of 1,869,311 | By Presence of: Own Children Related Children|| In Households(*) 93,330 5.1% of 1,832,370 | Families Pct.| Families Pct.|| In Group Quarters 1,566 4.2% of 36,941 | | || | All families: 13,344 100.0| 13,344 100.0||P16-18G/P36-37G. HOUSEHOLDS/POPULATION IN HOUSEHOLDS BY HOUSEHOLD TYPE | Husband-wife families: 8,210 61.5| 8,210 61.5||Universe: HOUSEHOLDERS Who Are Two or More Races | With children under 18: 4,612 34.6| 4,775 35.8|| Average | Under 6 yrs only 1,525 11.4| 1,595 12.0|| Households Population(**) Size | Under 6 and 6 to 17 yrs 1,027 7.7| 1,092 8.2||Total Households(**) 24,112 60,930 2.53 | 6 to 17 yrs only 2,060 15.4| 2,088 15.6|| Under 18 years ----- 15,517 0.64 | No children under 18 3,598 27.0| 3,435 25.7|| 18 years and over ----- 45,413 1.88 | Other families (no spouse present): 5,134 38.5| 5,134 38.5|| Family Households(***) 13,344 42,935 3.22 | Male householder: 1,385 10.4| 1,385 10.4|| Under 18 years ----- 15,216 1.14 | With children under 18: 735 5.5| 850 6.4|| 18 years and over ----- 27,719 2.08 | Under 6 yrs only 239 1.8| 267 2.0|| Nonfamily Households 10,768 15,742 1.46 | Under 6 and 6 to 17 yrs 119 0.9| 144 1.1||________________________________________________________________________| 6 to 17 yrs only 377 2.8| 439 3.3||P12G/P13G. POPULATION BY AGE AND SEX | No children under 18 650 4.9| 535 4.0||Universe: Persons Who Are Two or More Races (*) | Female householder: 3,749 28.1| 3,749 28.1|| | With children under 18: 2,549 19.1| 2,824 21.2|| ---Both Sexes--- ------Male------ -----Female----- | Under 6 yrs only 685 5.1| 760 5.7|| Number Pct. Number Pct. Number Pct. | Under 6 and 6 to 17 yrs 482 3.6| 576 4.3|| | 6 to 17 yrs only 1,382 10.4| 1,488 11.2||All Ages: 94,896 100.0 46,534 100.0 48,362 100.0 | No children under 18 1,200 9.0| 925 6.9|| Under 5 15,295 16.1 7,678 16.5 7,617 15.7 |__________________________________________________________________________|| 5 to 9 12,377 13.0 6,312 13.6 6,065 12.5 | || 10 to 14 10,698 11.3 5,384 11.6 5,314 11.0 | P31G. RELATIONSHIP BY HOUSEHOLD TYPE FOR THE POPULATION UNDER 18 YEARS || 15 to 17 5,951 6.3 3,011 6.5 2,940 6.1 | Universe: Persons under 18 who are || 18 and 19 3,643 3.8 1,787 3.8 1,856 3.8 | Two or More Races (*)(***) || 20 1,621 1.7 767 1.6 854 1.8 | Number Pct. || 21 1,631 1.7 799 1.7 832 1.7 | || 22 to 24 4,966 5.2 2,391 5.1 2,575 5.3 | Total under 18: 44,321 100.0 || 25 to 29 8,246 8.7 3,947 8.5 4,299 8.9 | In households: 44,177 99.7 || 30 to 34 6,853 7.2 3,308 7.1 3,545 7.3 | Householder or spouse 14 0.0 || 35 to 39 5,681 6.0 2,690 5.8 2,991 6.2 | Related child: 43,508 98.2 || 40 to 44 4,564 4.8 2,208 4.7 2,356 4.9 | Own child: 40,053 90.4 || 45 to 49 3,800 4.0 1,888 4.1 1,912 4.0 | In husband-wife families 26,867 60.6 || 50 to 54 3,221 3.4 1,564 3.4 1,657 3.4 | In other families (no spouse present): 13,186 29.8 || 55 to 59 2,333 2.5 1,059 2.3 1,274 2.6 | Male householder 2,835 6.4 || 60 and 61 697 0.7 322 0.7 375 0.8 | Female householder 10,351 23.4 || 62 to 64 902 1.0 433 0.9 469 1.0 | Other relatives: 3,455 7.8 || 65 and 66 418 0.4 173 0.4 245 0.5 | Grandchild 2,628 5.9 || 67 to 69 505 0.5 229 0.5 276 0.6 | Other relatives 827 1.9 || 70 to 74 589 0.6 246 0.5 343 0.7 | Nonrelatives 655 1.5 || 75 to 79 377 0.4 170 0.4 207 0.4 | In group quarters: 144 0.3 || 80 to 84 273 0.3 97 0.2 176 0.4 | Institutionalized population 44 0.1 || 85 plus 255 0.3 71 0.2 184 0.4 | Noninstitutionalized population 100 0.2 || |__________________________________________________________________________|| 0 to 17 44,321 46.7 22,385 48.1 21,936 45.4 | Note: (*) Tables with PERSONS as the universe enumerate persons according|| 18 to 64 48,158 50.7 23,163 49.8 24,995 51.7 | to their own race or ethnic category. (**) Tables with HOUSEHOLDS or || 65 plus 2,417 2.5 986 2.1 1,431 3.0 | HOUSEHOLDERS as the universe enumerate persons in households according || | to the race or ethnic category of the householder. (***) Responses of ||Median Age 19.7 19.0 20.5 | 'same-sex spouse' were edited during processing to 'unmarried partner.' |+===================================================================================================================================================+Source: Census 2010 Summary File 1 [machine-readable data file]/Prepared by the U.S.Census Bureau, 2011. 06NOV12 Page 50 Prepared by: Washington State Office of Financial Management, Forecasting Division.
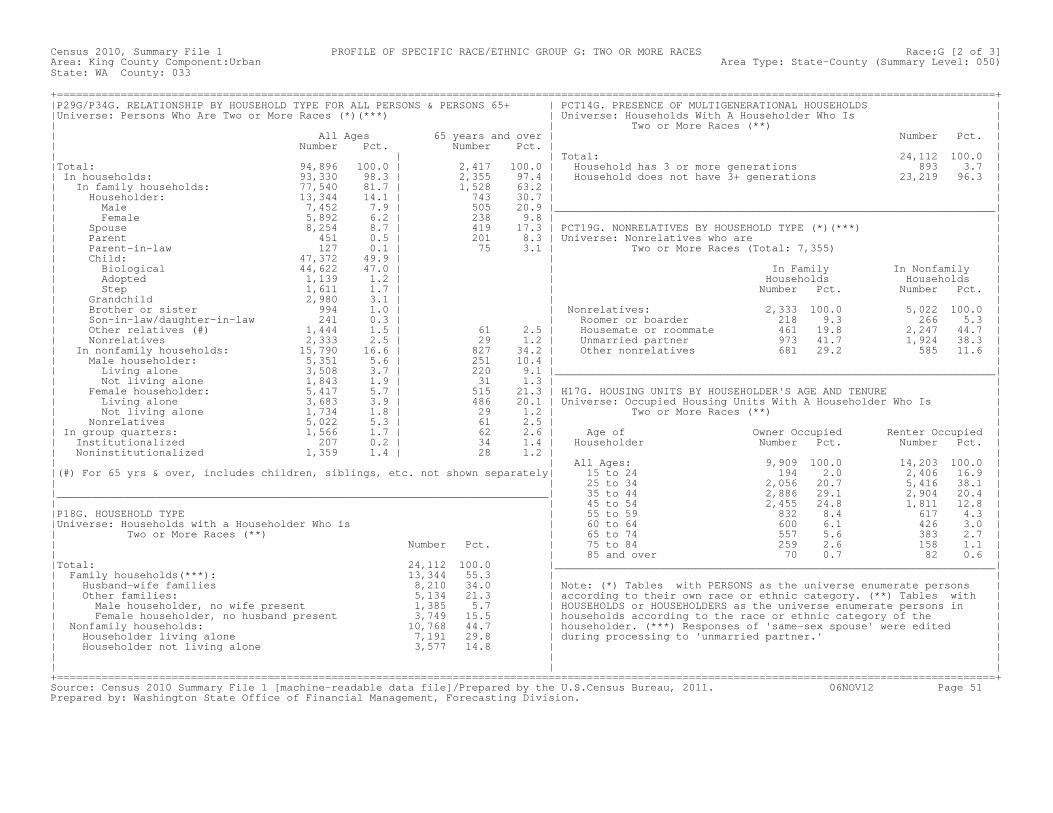
Census 2010, Summary File 1 PROFILE OF SPECIFIC RACE/ETHNIC GROUP G: TWO OR MORE RACES Race:G [2 of 3]Area: King County Component:Urban Area Type: State-County (Summary Level: 050)State: WA County: 033 +===================================================================================================================================================+|P29G/P34G. RELATIONSHIP BY HOUSEHOLD TYPE FOR ALL PERSONS & PERSONS 65+ | PCT14G. PRESENCE OF MULTIGENERATIONAL HOUSEHOLDS ||Universe: Persons Who Are Two or More Races (*)(***) | Universe: Households With A Householder Who Is || | Two or More Races (**) || All Ages 65 years and over | Number Pct. || Number Pct. Number Pct. | || | | Total: 24,112 100.0 ||Total: 94,896 100.0 | 2,417 100.0 | Household has 3 or more generations 893 3.7 || In households: 93,330 98.3 | 2,355 97.4 | Household does not have 3+ generations 23,219 96.3 || In family households: 77,540 81.7 | 1,528 63.2 | || Householder: 13,344 14.1 | 743 30.7 | || Male 7,452 7.9 | 505 20.9 |_____________________________________________________________________|| Female 5,892 6.2 | 238 9.8 | || Spouse 8,254 8.7 | 419 17.3 | PCT19G. NONRELATIVES BY HOUSEHOLD TYPE (*)(***) || Parent 451 0.5 | 201 8.3 | Universe: Nonrelatives who are || Parent-in-law 127 0.1 | 75 3.1 | Two or More Races (Total: 7,355) || Child: 47,372 49.9 | | || Biological 44,622 47.0 | | In Family In Nonfamily || Adopted 1,139 1.2 | | Households Households || Step 1,611 1.7 | | Number Pct. Number Pct. || Grandchild 2,980 3.1 | | || Brother or sister 994 1.0 | | Nonrelatives: 2,333 100.0 5,022 100.0 || Son-in-law/daughter-in-law 241 0.3 | | Roomer or boarder 218 9.3 266 5.3 || Other relatives (#) 1,444 1.5 | 61 2.5 | Housemate or roommate 461 19.8 2,247 44.7 || Nonrelatives 2,333 2.5 | 29 1.2 | Unmarried partner 973 41.7 1,924 38.3 || In nonfamily households: 15,790 16.6 | 827 34.2 | Other nonrelatives 681 29.2 585 11.6 || Male householder: 5,351 5.6 | 251 10.4 | || Living alone 3,508 3.7 | 220 9.1 |_____________________________________________________________________|| Not living alone 1,843 1.9 | 31 1.3 | || Female householder: 5,417 5.7 | 515 21.3 | H17G. HOUSING UNITS BY HOUSEHOLDER'S AGE AND TENURE || Living alone 3,683 3.9 | 486 20.1 | Universe: Occupied Housing Units With A Householder Who Is || Not living alone 1,734 1.8 | 29 1.2 | Two or More Races (**) || Nonrelatives 5,022 5.3 | 61 2.5 | || In group quarters: 1,566 1.7 | 62 2.6 | Age of Owner Occupied Renter Occupied || Institutionalized 207 0.2 | 34 1.4 | Householder Number Pct. Number Pct. || Noninstitutionalized 1,359 1.4 | 28 1.2 | || | All Ages: 9,909 100.0 14,203 100.0 ||(#) For 65 yrs & over, includes children, siblings, etc. not shown separately| 15 to 24 194 2.0 2,406 16.9 || | 25 to 34 2,056 20.7 5,416 38.1 ||_____________________________________________________________________________| 35 to 44 2,886 29.1 2,904 20.4 || | 45 to 54 2,455 24.8 1,811 12.8 ||P18G. HOUSEHOLD TYPE | 55 to 59 832 8.4 617 4.3 ||Universe: Households with a Householder Who is | 60 to 64 600 6.1 426 3.0 || Two or More Races (**) | 65 to 74 557 5.6 383 2.7 || Number Pct. | 75 to 84 259 2.6 158 1.1 || | 85 and over 70 0.7 82 0.6 ||Total: 24,112 100.0 |_____________________________________________________________________|| Family households(***): 13,344 55.3 | || Husband-wife families 8,210 34.0 | Note: (*) Tables with PERSONS as the universe enumerate persons || Other families: 5,134 21.3 | according to their own race or ethnic category. (**) Tables with || Male householder, no wife present 1,385 5.7 | HOUSEHOLDS or HOUSEHOLDERS as the universe enumerate persons in || Female householder, no husband present 3,749 15.5 | households according to the race or ethnic category of the || Nonfamily households: 10,768 44.7 | householder. (***) Responses of 'same-sex spouse' were edited || Householder living alone 7,191 29.8 | during processing to 'unmarried partner.' || Householder not living alone 3,577 14.8 | || | || | |+===================================================================================================================================================+Source: Census 2010 Summary File 1 [machine-readable data file]/Prepared by the U.S.Census Bureau, 2011. 06NOV12 Page 51 Prepared by: Washington State Office of Financial Management, Forecasting Division.
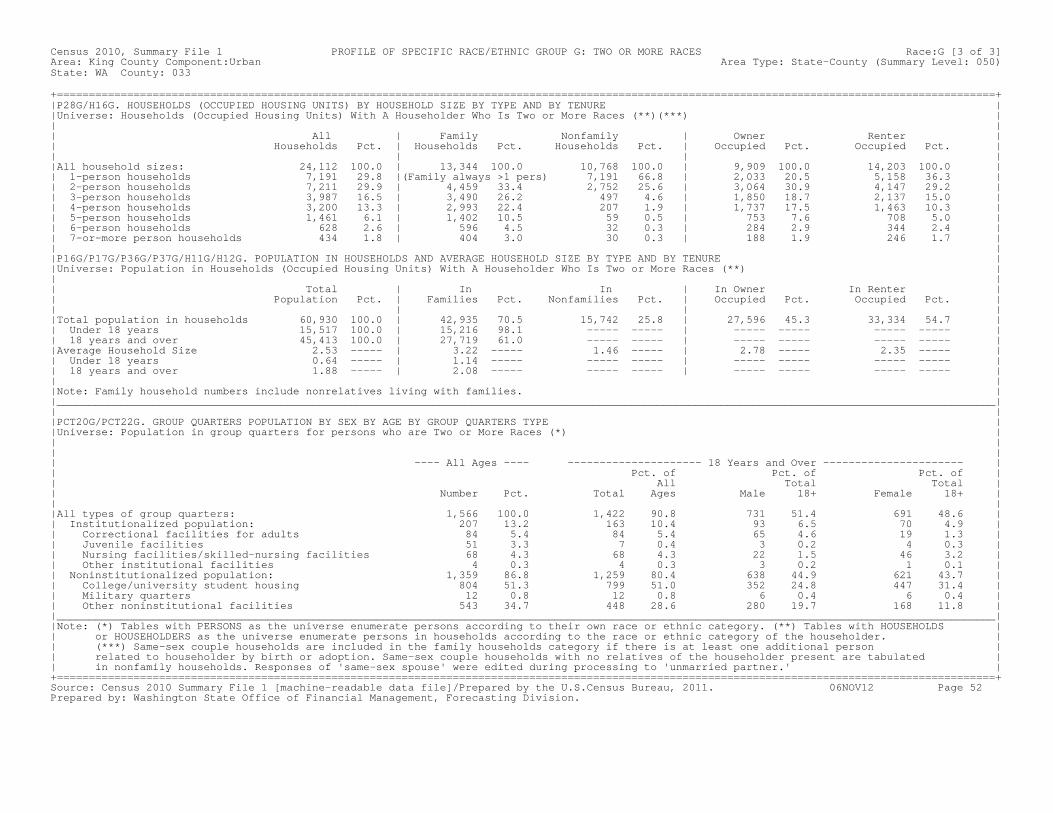
Census 2010, Summary File 1 PROFILE OF SPECIFIC RACE/ETHNIC GROUP G: TWO OR MORE RACES Race:G [3 of 3]Area: King County Component:Urban Area Type: State-County (Summary Level: 050)State: WA County: 033 +===================================================================================================================================================+|P28G/H16G. HOUSEHOLDS (OCCUPIED HOUSING UNITS) BY HOUSEHOLD SIZE BY TYPE AND BY TENURE ||Universe: Households (Occupied Housing Units) With A Householder Who Is Two or More Races (**)(***) || || All | Family Nonfamily | Owner Renter || Households Pct. | Households Pct. Households Pct. | Occupied Pct. Occupied Pct. || | | ||All household sizes: 24,112 100.0 | 13,344 100.0 10,768 100.0 | 9,909 100.0 14,203 100.0 || 1-person households 7,191 29.8 |(Family always >1 pers) 7,191 66.8 | 2,033 20.5 5,158 36.3 || 2-person households 7,211 29.9 | 4,459 33.4 2,752 25.6 | 3,064 30.9 4,147 29.2 || 3-person households 3,987 16.5 | 3,490 26.2 497 4.6 | 1,850 18.7 2,137 15.0 || 4-person households 3,200 13.3 | 2,993 22.4 207 1.9 | 1,737 17.5 1,463 10.3 || 5-person households 1,461 6.1 | 1,402 10.5 59 0.5 | 753 7.6 708 5.0 || 6-person households 628 2.6 | 596 4.5 32 0.3 | 284 2.9 344 2.4 || 7-or-more person households 434 1.8 | 404 3.0 30 0.3 | 188 1.9 246 1.7 || ||P16G/P17G/P36G/P37G/H11G/H12G. POPULATION IN HOUSEHOLDS AND AVERAGE HOUSEHOLD SIZE BY TYPE AND BY TENURE ||Universe: Population in Households (Occupied Housing Units) With A Householder Who Is Two or More Races (**) || || Total | In In | In Owner In Renter || Population Pct. | Families Pct. Nonfamilies Pct. | Occupied Pct. Occupied Pct. || | | ||Total population in households 60,930 100.0 | 42,935 70.5 15,742 25.8 | 27,596 45.3 33,334 54.7 || Under 18 years 15,517 100.0 | 15,216 98.1 ----- ----- | ----- ----- ----- ----- || 18 years and over 45,413 100.0 | 27,719 61.0 ----- ----- | ----- ----- ----- ----- ||Average Household Size 2.53 ----- | 3.22 ----- 1.46 ----- | 2.78 ----- 2.35 ----- || Under 18 years 0.64 ----- | 1.14 ----- ----- ----- | ----- ----- ----- ----- || 18 years and over 1.88 ----- | 2.08 ----- ----- ----- | ----- ----- ----- ----- || ||Note: Family household numbers include nonrelatives living with families. ||___________________________________________________________________________________________________________________________________________________|| ||PCT20G/PCT22G. GROUP QUARTERS POPULATION BY SEX BY AGE BY GROUP QUARTERS TYPE ||Universe: Population in group quarters for persons who are Two or More Races (*) || || || ---- All Ages ---- --------------------- 18 Years and Over ---------------------- || Pct. of Pct. of Pct. of || All Total Total || Number Pct. Total Ages Male 18+ Female 18+ || ||All types of group quarters: 1,566 100.0 1,422 90.8 731 51.4 691 48.6 || Institutionalized population: 207 13.2 163 10.4 93 6.5 70 4.9 || Correctional facilities for adults 84 5.4 84 5.4 65 4.6 19 1.3 || Juvenile facilities 51 3.3 7 0.4 3 0.2 4 0.3 || Nursing facilities/skilled-nursing facilities 68 4.3 68 4.3 22 1.5 46 3.2 || Other institutional facilities 4 0.3 4 0.3 3 0.2 1 0.1 || Noninstitutionalized population: 1,359 86.8 1,259 80.4 638 44.9 621 43.7 || College/university student housing 804 51.3 799 51.0 352 24.8 447 31.4 || Military quarters 12 0.8 12 0.8 6 0.4 6 0.4 || Other noninstitutional facilities 543 34.7 448 28.6 280 19.7 168 11.8 ||___________________________________________________________________________________________________________________________________________________||Note: (*) Tables with PERSONS as the universe enumerate persons according to their own race or ethnic category. (**) Tables with HOUSEHOLDS || or HOUSEHOLDERS as the universe enumerate persons in households according to the race or ethnic category of the householder. || (***) Same-sex couple households are included in the family households category if there is at least one additional person || related to householder by birth or adoption. Same-sex couple households with no relatives of the householder present are tabulated || in nonfamily households. Responses of 'same-sex spouse' were edited during processing to 'unmarried partner.' |+===================================================================================================================================================+Source: Census 2010 Summary File 1 [machine-readable data file]/Prepared by the U.S.Census Bureau, 2011. 06NOV12 Page 52 Prepared by: Washington State Office of Financial Management, Forecasting Division.

Census 2010, Summary File 1 PROFILE OF SPECIFIC RACE/ETHNIC GROUP H: HISPANIC OR LATINO OF ANY RACE Race:H [1 of 3]Area: King County Component:Urban Area Type: State-County (Summary Level: 050)State: WA County: 033 +===================================================================================================================================================+|P29/P29H. POPULATION SUMMARY BY RESIDENCE TYPE FOR DESIGNATED UNIVERSE | P38H/39H. FAMILY TYPE BY PRESENCE AND AGE OF OWN OR RELATED CHILDREN ||Universe: PERSONS Who Are Hispanic or Latino of Any Race | Universe: Families With A Householder Who Is || | Hispanic or Latino of Any Race (**)(***) || Population As % of Population of all Races | ||Total Persons: 169,794 9.1% of 1,869,311 | By Presence of: Own Children Related Children|| In Households(*) 167,080 9.1% of 1,832,370 | Families Pct.| Families Pct.|| In Group Quarters 2,714 7.3% of 36,941 | | || | All families: 32,314 100.0| 32,314 100.0||P16-18H/P36-37H. HOUSEHOLDS/POPULATION IN HOUSEHOLDS BY HOUSEHOLD TYPE | Husband-wife families: 20,947 64.8| 20,947 64.8||Universe: HOUSEHOLDERS Who Are Hispanic or Latino of Any Race | With children under 18: 14,395 44.5| 14,970 46.3|| Average | Under 6 yrs only 3,872 12.0| 3,977 12.3|| Households Population(**) Size | Under 6 and 6 to 17 yrs 4,589 14.2| 5,189 16.1||Total Households(**) 47,090 153,158 3.25 | 6 to 17 yrs only 5,934 18.4| 5,804 18.0|| Under 18 years ----- 49,018 1.04 | No children under 18 6,552 20.3| 5,977 18.5|| 18 years and over ----- 104,140 2.21 | Other families (no spouse present): 11,367 35.2| 11,367 35.2|| Family Households(***) 32,314 121,718 3.77 | Male householder: 4,579 14.2| 4,579 14.2|| Under 18 years ----- 47,922 1.48 | With children under 18: 2,327 7.2| 2,877 8.9|| 18 years and over ----- 73,796 2.28 | Under 6 yrs only 879 2.7| 1,023 3.2|| Nonfamily Households 14,776 23,001 1.56 | Under 6 and 6 to 17 yrs 497 1.5| 683 2.1||________________________________________________________________________| 6 to 17 yrs only 951 2.9| 1,171 3.6||P12H/P13H. POPULATION BY AGE AND SEX | No children under 18 2,252 7.0| 1,702 5.3||Universe: Persons Who Are Hispanic or Latino of Any Race (*) | Female householder: 6,788 21.0| 6,788 21.0|| | With children under 18: 4,926 15.2| 5,411 16.7|| ---Both Sexes--- ------Male------ -----Female----- | Under 6 yrs only 1,179 3.6| 1,322 4.1|| Number Pct. Number Pct. Number Pct. | Under 6 and 6 to 17 yrs 1,236 3.8| 1,518 4.7|| | 6 to 17 yrs only 2,511 7.8| 2,571 8.0||All Ages: 169,794 100.0 89,919 100.0 79,875 100.0 | No children under 18 1,862 5.8| 1,377 4.3|| Under 5 19,483 11.5 9,983 11.1 9,500 11.9 |__________________________________________________________________________|| 5 to 9 16,431 9.7 8,404 9.3 8,027 10.0 | || 10 to 14 14,407 8.5 7,411 8.2 6,996 8.8 | P31H. RELATIONSHIP BY HOUSEHOLD TYPE FOR THE POPULATION UNDER 18 YEARS || 15 to 17 7,969 4.7 4,099 4.6 3,870 4.8 | Universe: Persons under 18 who are || 18 and 19 5,405 3.2 2,810 3.1 2,595 3.2 | Hispanic or Latino of Any Race (*)(***) || 20 2,842 1.7 1,505 1.7 1,337 1.7 | Number Pct. || 21 2,997 1.8 1,655 1.8 1,342 1.7 | || 22 to 24 9,735 5.7 5,298 5.9 4,437 5.6 | Total under 18: 58,290 100.0 || 25 to 29 18,447 10.9 10,193 11.3 8,254 10.3 | In households: 58,039 99.6 || 30 to 34 17,600 10.4 9,588 10.7 8,012 10.0 | Householder or spouse 37 0.1 || 35 to 39 15,291 9.0 8,400 9.3 6,891 8.6 | Related child: 56,593 97.1 || 40 to 44 11,854 7.0 6,503 7.2 5,351 6.7 | Own child: 50,545 86.7 || 45 to 49 8,881 5.2 4,834 5.4 4,047 5.1 | In husband-wife families 34,526 59.2 || 50 to 54 6,447 3.8 3,465 3.9 2,982 3.7 | In other families (no spouse present): 16,019 27.5 || 55 to 59 4,396 2.6 2,266 2.5 2,130 2.7 | Male householder 4,454 7.6 || 60 and 61 1,313 0.8 632 0.7 681 0.9 | Female householder 11,565 19.8 || 62 to 64 1,715 1.0 847 0.9 868 1.1 | Other relatives: 6,048 10.4 || 65 and 66 907 0.5 458 0.5 449 0.6 | Grandchild 2,968 5.1 || 67 to 69 951 0.6 436 0.5 515 0.6 | Other relatives 3,080 5.3 || 70 to 74 1,071 0.6 482 0.5 589 0.7 | Nonrelatives 1,409 2.4 || 75 to 79 755 0.4 348 0.4 407 0.5 | In group quarters: 251 0.4 || 80 to 84 465 0.3 167 0.2 298 0.4 | Institutionalized population 96 0.2 || 85 plus 432 0.3 135 0.2 297 0.4 | Noninstitutionalized population 155 0.3 || |__________________________________________________________________________|| 0 to 17 58,290 34.3 29,897 33.2 28,393 35.5 | Note: (*) Tables with PERSONS as the universe enumerate persons according|| 18 to 64 106,923 63.0 57,996 64.5 48,927 61.3 | to their own race or ethnic category. (**) Tables with HOUSEHOLDS or || 65 plus 4,581 2.7 2,026 2.3 2,555 3.2 | HOUSEHOLDERS as the universe enumerate persons in households according || | to the race or ethnic category of the householder. (***) Responses of ||Median Age 26.5 26.9 26.1 | 'same-sex spouse' were edited during processing to 'unmarried partner.' |+===================================================================================================================================================+Source: Census 2010 Summary File 1 [machine-readable data file]/Prepared by the U.S.Census Bureau, 2011. 06NOV12 Page 53 Prepared by: Washington State Office of Financial Management, Forecasting Division.

Census 2010, Summary File 1 PROFILE OF SPECIFIC RACE/ETHNIC GROUP H: HISPANIC OR LATINO OF ANY RACE Race:H [2 of 3]Area: King County Component:Urban Area Type: State-County (Summary Level: 050)State: WA County: 033 +===================================================================================================================================================+|P29H/P34H. RELATIONSHIP BY HOUSEHOLD TYPE FOR ALL PERSONS & PERSONS 65+ | PCT14H. PRESENCE OF MULTIGENERATIONAL HOUSEHOLDS ||Universe: Persons Who Are Hispanic or Latino of Any Race (*)(***) | Universe: Households With A Householder Who Is || | Hispanic or Latino of Any Race (**) || All Ages 65 years and over | Number Pct. || Number Pct. Number Pct. | || | | Total: 47,090 100.0 ||Total: 169,794 100.0 | 4,581 100.0 | Household has 3 or more generations 2,485 5.3 || In households: 167,080 98.4 | 4,454 97.2 | Household does not have 3+ generations 44,605 94.7 || In family households: 143,143 84.3 | 3,188 69.6 | || Householder: 32,314 19.0 | 1,219 26.6 | || Male 21,147 12.5 | 900 19.6 |_____________________________________________________________________|| Female 11,167 6.6 | 319 7.0 | || Spouse 22,937 13.5 | 743 16.2 | PCT19H. NONRELATIVES BY HOUSEHOLD TYPE (*)(***) || Parent 1,868 1.1 | 668 14.6 | Universe: Nonrelatives who are || Parent-in-law 660 0.4 | 291 6.4 | Hispanic or Latino of Any Race (Total: 18,112) || Child: 60,365 35.6 | | || Biological 56,201 33.1 | | In Family In Nonfamily || Adopted 1,527 0.9 | | Households Households || Step 2,637 1.6 | | Number Pct. Number Pct. || Grandchild 3,223 1.9 | | || Brother or sister 4,636 2.7 | | Nonrelatives: 8,951 100.0 9,161 100.0 || Son-in-law/daughter-in-law 911 0.5 | | Roomer or boarder 1,050 11.7 813 8.9 || Other relatives (#) 7,278 4.3 | 189 4.1 | Housemate or roommate 2,288 25.6 4,290 46.8 || Nonrelatives 8,951 5.3 | 78 1.7 | Unmarried partner 3,101 34.6 2,860 31.2 || In nonfamily households: 23,937 14.1 | 1,266 27.6 | Other nonrelatives 2,512 28.1 1,198 13.1 || Male householder: 8,834 5.2 | 449 9.8 | || Living alone 5,321 3.1 | 384 8.4 |_____________________________________________________________________|| Not living alone 3,513 2.1 | 65 1.4 | || Female householder: 5,942 3.5 | 717 15.7 | H17H. HOUSING UNITS BY HOUSEHOLDER'S AGE AND TENURE || Living alone 4,032 2.4 | 670 14.6 | Universe: Occupied Housing Units With A Householder Who Is || Not living alone 1,910 1.1 | 47 1.0 | Hispanic or Latino of Any Race (**) || Nonrelatives 9,161 5.4 | 100 2.2 | || In group quarters: 2,714 1.6 | 127 2.8 | Age of Owner Occupied Renter Occupied || Institutionalized 768 0.5 | 66 1.4 | Householder Number Pct. Number Pct. || Noninstitutionalized 1,946 1.1 | 61 1.3 | || | All Ages: 16,468 100.0 30,622 100.0 ||(#) For 65 yrs & over, includes children, siblings, etc. not shown separately| 15 to 24 253 1.5 3,894 12.7 || | 25 to 34 3,226 19.6 11,862 38.7 ||_____________________________________________________________________________| 35 to 44 5,388 32.7 8,075 26.4 || | 45 to 54 4,013 24.4 4,063 13.3 ||P18H. HOUSEHOLD TYPE | 55 to 59 1,290 7.8 1,043 3.4 ||Universe: Households with a Householder Who is | 60 to 64 922 5.6 676 2.2 || Hispanic or Latino of Any Race (**) | 65 to 74 897 5.4 613 2.0 || Number Pct. | 75 to 84 360 2.2 288 0.9 || | 85 and over 119 0.7 108 0.4 ||Total: 47,090 100.0 |_____________________________________________________________________|| Family households(***): 32,314 68.6 | || Husband-wife families 20,947 44.5 | Note: (*) Tables with PERSONS as the universe enumerate persons || Other families: 11,367 24.1 | according to their own race or ethnic category. (**) Tables with || Male householder, no wife present 4,579 9.7 | HOUSEHOLDS or HOUSEHOLDERS as the universe enumerate persons in || Female householder, no husband present 6,788 14.4 | households according to the race or ethnic category of the || Nonfamily households: 14,776 31.4 | householder. (***) Responses of 'same-sex spouse' were edited || Householder living alone 9,353 19.9 | during processing to 'unmarried partner.' || Householder not living alone 5,423 11.5 | || | || | |+===================================================================================================================================================+Source: Census 2010 Summary File 1 [machine-readable data file]/Prepared by the U.S.Census Bureau, 2011. 06NOV12 Page 54 Prepared by: Washington State Office of Financial Management, Forecasting Division.
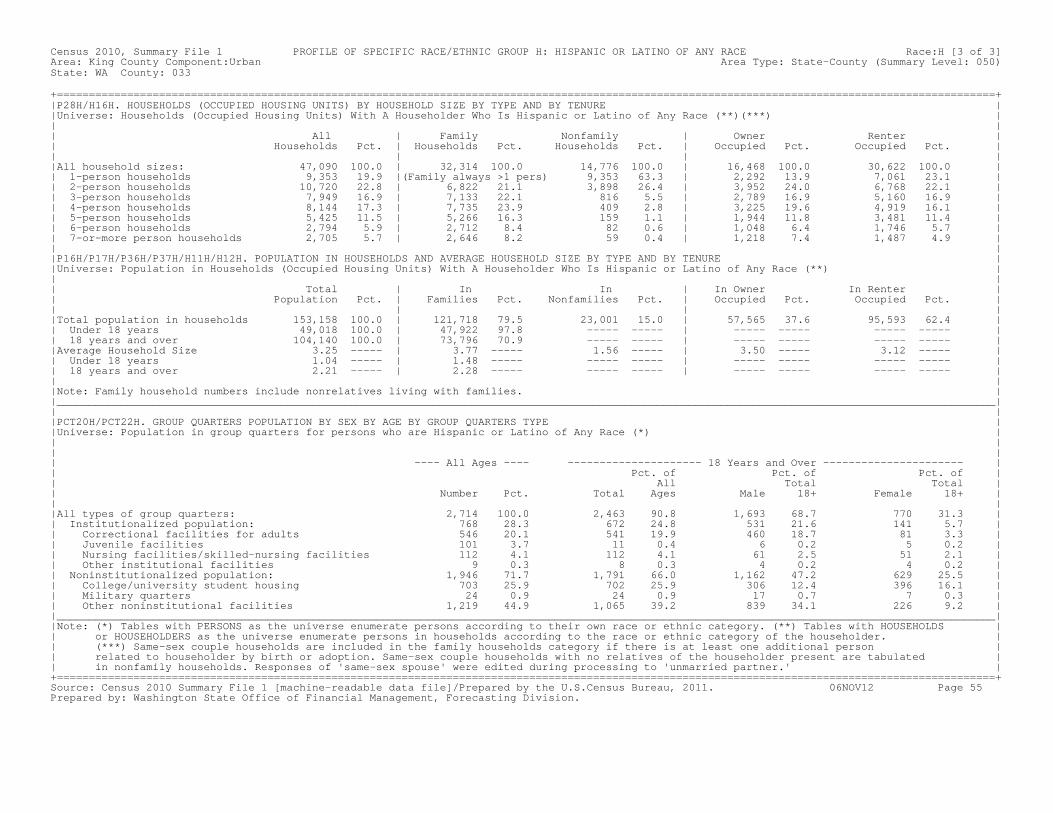
Census 2010, Summary File 1 PROFILE OF SPECIFIC RACE/ETHNIC GROUP H: HISPANIC OR LATINO OF ANY RACE Race:H [3 of 3]Area: King County Component:Urban Area Type: State-County (Summary Level: 050)State: WA County: 033 +===================================================================================================================================================+|P28H/H16H. HOUSEHOLDS (OCCUPIED HOUSING UNITS) BY HOUSEHOLD SIZE BY TYPE AND BY TENURE ||Universe: Households (Occupied Housing Units) With A Householder Who Is Hispanic or Latino of Any Race (**)(***) || || All | Family Nonfamily | Owner Renter || Households Pct. | Households Pct. Households Pct. | Occupied Pct. Occupied Pct. || | | ||All household sizes: 47,090 100.0 | 32,314 100.0 14,776 100.0 | 16,468 100.0 30,622 100.0 || 1-person households 9,353 19.9 |(Family always >1 pers) 9,353 63.3 | 2,292 13.9 7,061 23.1 || 2-person households 10,720 22.8 | 6,822 21.1 3,898 26.4 | 3,952 24.0 6,768 22.1 || 3-person households 7,949 16.9 | 7,133 22.1 816 5.5 | 2,789 16.9 5,160 16.9 || 4-person households 8,144 17.3 | 7,735 23.9 409 2.8 | 3,225 19.6 4,919 16.1 || 5-person households 5,425 11.5 | 5,266 16.3 159 1.1 | 1,944 11.8 3,481 11.4 || 6-person households 2,794 5.9 | 2,712 8.4 82 0.6 | 1,048 6.4 1,746 5.7 || 7-or-more person households 2,705 5.7 | 2,646 8.2 59 0.4 | 1,218 7.4 1,487 4.9 || ||P16H/P17H/P36H/P37H/H11H/H12H. POPULATION IN HOUSEHOLDS AND AVERAGE HOUSEHOLD SIZE BY TYPE AND BY TENURE ||Universe: Population in Households (Occupied Housing Units) With A Householder Who Is Hispanic or Latino of Any Race (**) || || Total | In In | In Owner In Renter || Population Pct. | Families Pct. Nonfamilies Pct. | Occupied Pct. Occupied Pct. || | | ||Total population in households 153,158 100.0 | 121,718 79.5 23,001 15.0 | 57,565 37.6 95,593 62.4 || Under 18 years 49,018 100.0 | 47,922 97.8 ----- ----- | ----- ----- ----- ----- || 18 years and over 104,140 100.0 | 73,796 70.9 ----- ----- | ----- ----- ----- ----- ||Average Household Size 3.25 ----- | 3.77 ----- 1.56 ----- | 3.50 ----- 3.12 ----- || Under 18 years 1.04 ----- | 1.48 ----- ----- ----- | ----- ----- ----- ----- || 18 years and over 2.21 ----- | 2.28 ----- ----- ----- | ----- ----- ----- ----- || ||Note: Family household numbers include nonrelatives living with families. ||___________________________________________________________________________________________________________________________________________________|| ||PCT20H/PCT22H. GROUP QUARTERS POPULATION BY SEX BY AGE BY GROUP QUARTERS TYPE ||Universe: Population in group quarters for persons who are Hispanic or Latino of Any Race (*) || || || ---- All Ages ---- --------------------- 18 Years and Over ---------------------- || Pct. of Pct. of Pct. of || All Total Total || Number Pct. Total Ages Male 18+ Female 18+ || ||All types of group quarters: 2,714 100.0 2,463 90.8 1,693 68.7 770 31.3 || Institutionalized population: 768 28.3 672 24.8 531 21.6 141 5.7 || Correctional facilities for adults 546 20.1 541 19.9 460 18.7 81 3.3 || Juvenile facilities 101 3.7 11 0.4 6 0.2 5 0.2 || Nursing facilities/skilled-nursing facilities 112 4.1 112 4.1 61 2.5 51 2.1 || Other institutional facilities 9 0.3 8 0.3 4 0.2 4 0.2 || Noninstitutionalized population: 1,946 71.7 1,791 66.0 1,162 47.2 629 25.5 || College/university student housing 703 25.9 702 25.9 306 12.4 396 16.1 || Military quarters 24 0.9 24 0.9 17 0.7 7 0.3 || Other noninstitutional facilities 1,219 44.9 1,065 39.2 839 34.1 226 9.2 ||___________________________________________________________________________________________________________________________________________________||Note: (*) Tables with PERSONS as the universe enumerate persons according to their own race or ethnic category. (**) Tables with HOUSEHOLDS || or HOUSEHOLDERS as the universe enumerate persons in households according to the race or ethnic category of the householder. || (***) Same-sex couple households are included in the family households category if there is at least one additional person || related to householder by birth or adoption. Same-sex couple households with no relatives of the householder present are tabulated || in nonfamily households. Responses of 'same-sex spouse' were edited during processing to 'unmarried partner.' |+===================================================================================================================================================+Source: Census 2010 Summary File 1 [machine-readable data file]/Prepared by the U.S.Census Bureau, 2011. 06NOV12 Page 55 Prepared by: Washington State Office of Financial Management, Forecasting Division.
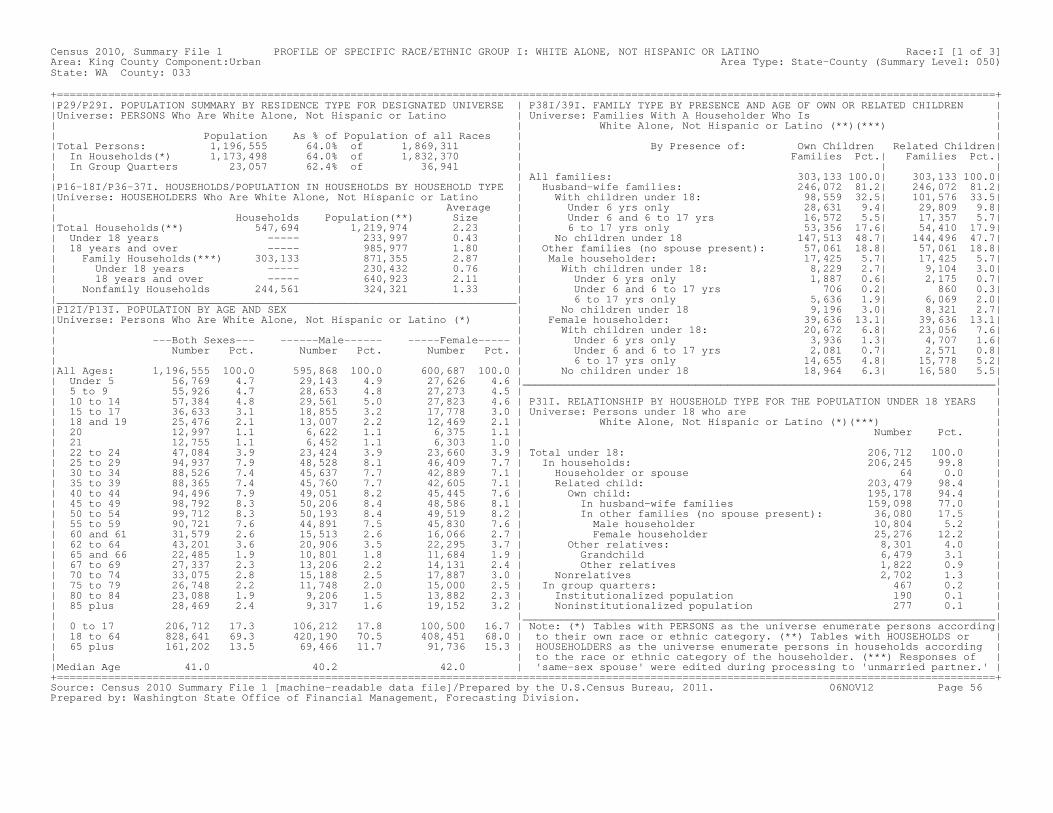
Census 2010, Summary File 1 PROFILE OF SPECIFIC RACE/ETHNIC GROUP I: WHITE ALONE, NOT HISPANIC OR LATINO Race:I [1 of 3]Area: King County Component:Urban Area Type: State-County (Summary Level: 050)State: WA County: 033 +===================================================================================================================================================+|P29/P29I. POPULATION SUMMARY BY RESIDENCE TYPE FOR DESIGNATED UNIVERSE | P38I/39I. FAMILY TYPE BY PRESENCE AND AGE OF OWN OR RELATED CHILDREN ||Universe: PERSONS Who Are White Alone, Not Hispanic or Latino | Universe: Families With A Householder Who Is || | White Alone, Not Hispanic or Latino (**)(***) || Population As % of Population of all Races | ||Total Persons: 1,196,555 64.0% of 1,869,311 | By Presence of: Own Children Related Children|| In Households(*) 1,173,498 64.0% of 1,832,370 | Families Pct.| Families Pct.|| In Group Quarters 23,057 62.4% of 36,941 | | || | All families: 303,133 100.0| 303,133 100.0||P16-18I/P36-37I. HOUSEHOLDS/POPULATION IN HOUSEHOLDS BY HOUSEHOLD TYPE | Husband-wife families: 246,072 81.2| 246,072 81.2||Universe: HOUSEHOLDERS Who Are White Alone, Not Hispanic or Latino | With children under 18: 98,559 32.5| 101,576 33.5|| Average | Under 6 yrs only 28,631 9.4| 29,809 9.8|| Households Population(**) Size | Under 6 and 6 to 17 yrs 16,572 5.5| 17,357 5.7||Total Households(**) 547,694 1,219,974 2.23 | 6 to 17 yrs only 53,356 17.6| 54,410 17.9|| Under 18 years ----- 233,997 0.43 | No children under 18 147,513 48.7| 144,496 47.7|| 18 years and over ----- 985,977 1.80 | Other families (no spouse present): 57,061 18.8| 57,061 18.8|| Family Households(***) 303,133 871,355 2.87 | Male householder: 17,425 5.7| 17,425 5.7|| Under 18 years ----- 230,432 0.76 | With children under 18: 8,229 2.7| 9,104 3.0|| 18 years and over ----- 640,923 2.11 | Under 6 yrs only 1,887 0.6| 2,175 0.7|| Nonfamily Households 244,561 324,321 1.33 | Under 6 and 6 to 17 yrs 706 0.2| 860 0.3||________________________________________________________________________| 6 to 17 yrs only 5,636 1.9| 6,069 2.0||P12I/P13I. POPULATION BY AGE AND SEX | No children under 18 9,196 3.0| 8,321 2.7||Universe: Persons Who Are White Alone, Not Hispanic or Latino (*) | Female householder: 39,636 13.1| 39,636 13.1|| | With children under 18: 20,672 6.8| 23,056 7.6|| ---Both Sexes--- ------Male------ -----Female----- | Under 6 yrs only 3,936 1.3| 4,707 1.6|| Number Pct. Number Pct. Number Pct. | Under 6 and 6 to 17 yrs 2,081 0.7| 2,571 0.8|| | 6 to 17 yrs only 14,655 4.8| 15,778 5.2||All Ages: 1,196,555 100.0 595,868 100.0 600,687 100.0 | No children under 18 18,964 6.3| 16,580 5.5|| Under 5 56,769 4.7 29,143 4.9 27,626 4.6 |__________________________________________________________________________|| 5 to 9 55,926 4.7 28,653 4.8 27,273 4.5 | || 10 to 14 57,384 4.8 29,561 5.0 27,823 4.6 | P31I. RELATIONSHIP BY HOUSEHOLD TYPE FOR THE POPULATION UNDER 18 YEARS || 15 to 17 36,633 3.1 18,855 3.2 17,778 3.0 | Universe: Persons under 18 who are || 18 and 19 25,476 2.1 13,007 2.2 12,469 2.1 | White Alone, Not Hispanic or Latino (*)(***) || 20 12,997 1.1 6,622 1.1 6,375 1.1 | Number Pct. || 21 12,755 1.1 6,452 1.1 6,303 1.0 | || 22 to 24 47,084 3.9 23,424 3.9 23,660 3.9 | Total under 18: 206,712 100.0 || 25 to 29 94,937 7.9 48,528 8.1 46,409 7.7 | In households: 206,245 99.8 || 30 to 34 88,526 7.4 45,637 7.7 42,889 7.1 | Householder or spouse 64 0.0 || 35 to 39 88,365 7.4 45,760 7.7 42,605 7.1 | Related child: 203,479 98.4 || 40 to 44 94,496 7.9 49,051 8.2 45,445 7.6 | Own child: 195,178 94.4 || 45 to 49 98,792 8.3 50,206 8.4 48,586 8.1 | In husband-wife families 159,098 77.0 || 50 to 54 99,712 8.3 50,193 8.4 49,519 8.2 | In other families (no spouse present): 36,080 17.5 || 55 to 59 90,721 7.6 44,891 7.5 45,830 7.6 | Male householder 10,804 5.2 || 60 and 61 31,579 2.6 15,513 2.6 16,066 2.7 | Female householder 25,276 12.2 || 62 to 64 43,201 3.6 20,906 3.5 22,295 3.7 | Other relatives: 8,301 4.0 || 65 and 66 22,485 1.9 10,801 1.8 11,684 1.9 | Grandchild 6,479 3.1 || 67 to 69 27,337 2.3 13,206 2.2 14,131 2.4 | Other relatives 1,822 0.9 || 70 to 74 33,075 2.8 15,188 2.5 17,887 3.0 | Nonrelatives 2,702 1.3 || 75 to 79 26,748 2.2 11,748 2.0 15,000 2.5 | In group quarters: 467 0.2 || 80 to 84 23,088 1.9 9,206 1.5 13,882 2.3 | Institutionalized population 190 0.1 || 85 plus 28,469 2.4 9,317 1.6 19,152 3.2 | Noninstitutionalized population 277 0.1 || |__________________________________________________________________________|| 0 to 17 206,712 17.3 106,212 17.8 100,500 16.7 | Note: (*) Tables with PERSONS as the universe enumerate persons according|| 18 to 64 828,641 69.3 420,190 70.5 408,451 68.0 | to their own race or ethnic category. (**) Tables with HOUSEHOLDS or || 65 plus 161,202 13.5 69,466 11.7 91,736 15.3 | HOUSEHOLDERS as the universe enumerate persons in households according || | to the race or ethnic category of the householder. (***) Responses of ||Median Age 41.0 40.2 42.0 | 'same-sex spouse' were edited during processing to 'unmarried partner.' |+===================================================================================================================================================+Source: Census 2010 Summary File 1 [machine-readable data file]/Prepared by the U.S.Census Bureau, 2011. 06NOV12 Page 56 Prepared by: Washington State Office of Financial Management, Forecasting Division.

Census 2010, Summary File 1 PROFILE OF SPECIFIC RACE/ETHNIC GROUP I: WHITE ALONE, NOT HISPANIC OR LATINO Race:I [2 of 3]Area: King County Component:Urban Area Type: State-County (Summary Level: 050)State: WA County: 033 +===================================================================================================================================================+|P29I/P34I. RELATIONSHIP BY HOUSEHOLD TYPE FOR ALL PERSONS & PERSONS 65+ | PCT14I. PRESENCE OF MULTIGENERATIONAL HOUSEHOLDS ||Universe: Persons Who Are White Alone, Not Hispanic or Latino (*)(***) | Universe: Households With A Householder Who Is || | White Alone, Not Hispanic or Latino (**) || All Ages 65 years and over | Number Pct. || Number Pct. Number Pct. | || | | Total: 547,694 100.0 ||Total: 1,196,555 100.0 | 161,202 100.0 | Household has 3 or more generations 8,920 1.6 || In households: 1,173,498 98.1 | 154,807 96.0 | Household does not have 3+ generations 538,774 98.4 || In family households: 852,237 71.2 | 95,950 59.5 | || Householder: 303,133 25.3 | 52,348 32.5 | || Male 219,008 18.3 | 42,354 26.3 |_____________________________________________________________________|| Female 84,125 7.0 | 9,994 6.2 | || Spouse 237,477 19.8 | 36,072 22.4 | PCT19I. NONRELATIVES BY HOUSEHOLD TYPE (*)(***) || Parent 6,191 0.5 | 3,740 2.3 | Universe: Nonrelatives who are || Parent-in-law 2,085 0.2 | 1,524 0.9 | White Alone, Not Hispanic or Latino (Total: 98,871) || Child: 256,894 21.5 | | || Biological 243,097 20.3 | | In Family In Nonfamily || Adopted 5,125 0.4 | | Households Households || Step 8,672 0.7 | | Number Pct. Number Pct. || Grandchild 8,887 0.7 | | || Brother or sister 7,019 0.6 | | Nonrelatives: 22,171 100.0 76,700 100.0 || Son-in-law/daughter-in-law 2,347 0.2 | | Roomer or boarder 3,223 14.5 5,264 6.9 || Other relatives (#) 6,033 0.5 | 1,283 0.8 | Housemate or roommate 4,935 22.3 32,628 42.5 || Nonrelatives 22,171 1.9 | 983 0.6 | Unmarried partner 8,884 40.1 33,099 43.2 || In nonfamily households: 321,261 26.8 | 58,857 36.5 | Other nonrelatives 5,129 23.1 5,709 7.4 || Male householder: 118,223 9.9 | 16,541 10.3 | || Living alone 84,134 7.0 | 14,651 9.1 |_____________________________________________________________________|| Not living alone 34,089 2.8 | 1,890 1.2 | || Female householder: 126,338 10.6 | 38,874 24.1 | H17I. HOUSING UNITS BY HOUSEHOLDER'S AGE AND TENURE || Living alone 99,289 8.3 | 36,731 22.8 | Universe: Occupied Housing Units With A Householder Who Is || Not living alone 27,049 2.3 | 2,143 1.3 | White Alone, Not Hispanic or Latino (**) || Nonrelatives 76,700 6.4 | 3,442 2.1 | || In group quarters: 23,057 1.9 | 6,395 4.0 | Age of Owner Occupied Renter Occupied || Institutionalized 6,865 0.6 | 4,195 2.6 | Householder Number Pct. Number Pct. || Noninstitutionalized 16,192 1.4 | 2,200 1.4 | || | All Ages: 347,140 100.0 200,554 100.0 ||(#) For 65 yrs & over, includes children, siblings, etc. not shown separately| 15 to 24 1,932 0.6 20,660 10.3 || | 25 to 34 33,596 9.7 60,194 30.0 ||_____________________________________________________________________________| 35 to 44 67,374 19.4 36,693 18.3 || | 45 to 54 86,174 24.8 31,078 15.5 ||P18I. HOUSEHOLD TYPE | 55 to 59 42,382 12.2 12,787 6.4 ||Universe: Households with a Householder Who is | 60 to 64 36,794 10.6 10,267 5.1 || White Alone, Not Hispanic or Latino (**) | 65 to 74 42,883 12.4 11,217 5.6 || Number Pct. | 75 to 84 25,243 7.3 8,875 4.4 || | 85 and over 10,762 3.1 8,783 4.4 ||Total: 547,694 100.0 |_____________________________________________________________________|| Family households(***): 303,133 55.3 | || Husband-wife families 246,072 44.9 | Note: (*) Tables with PERSONS as the universe enumerate persons || Other families: 57,061 10.4 | according to their own race or ethnic category. (**) Tables with || Male householder, no wife present 17,425 3.2 | HOUSEHOLDS or HOUSEHOLDERS as the universe enumerate persons in || Female householder, no husband present 39,636 7.2 | households according to the race or ethnic category of the || Nonfamily households: 244,561 44.7 | householder. (***) Responses of 'same-sex spouse' were edited || Householder living alone 183,423 33.5 | during processing to 'unmarried partner.' || Householder not living alone 61,138 11.2 | || | || | |+===================================================================================================================================================+Source: Census 2010 Summary File 1 [machine-readable data file]/Prepared by the U.S.Census Bureau, 2011. 06NOV12 Page 57 Prepared by: Washington State Office of Financial Management, Forecasting Division.
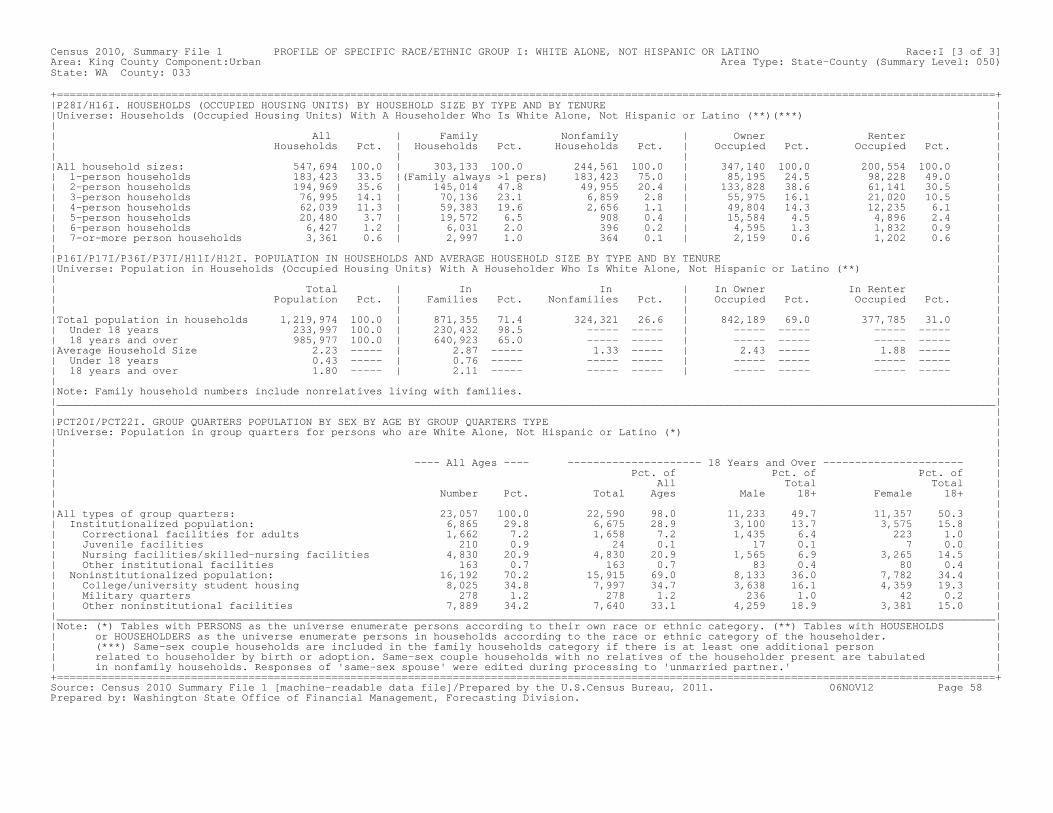
Census 2010, Summary File 1 PROFILE OF SPECIFIC RACE/ETHNIC GROUP I: WHITE ALONE, NOT HISPANIC OR LATINO Race:I [3 of 3]Area: King County Component:Urban Area Type: State-County (Summary Level: 050)State: WA County: 033 +===================================================================================================================================================+|P28I/H16I. HOUSEHOLDS (OCCUPIED HOUSING UNITS) BY HOUSEHOLD SIZE BY TYPE AND BY TENURE ||Universe: Households (Occupied Housing Units) With A Householder Who Is White Alone, Not Hispanic or Latino (**)(***) || || All | Family Nonfamily | Owner Renter || Households Pct. | Households Pct. Households Pct. | Occupied Pct. Occupied Pct. || | | ||All household sizes: 547,694 100.0 | 303,133 100.0 244,561 100.0 | 347,140 100.0 200,554 100.0 || 1-person households 183,423 33.5 |(Family always >1 pers) 183,423 75.0 | 85,195 24.5 98,228 49.0 || 2-person households 194,969 35.6 | 145,014 47.8 49,955 20.4 | 133,828 38.6 61,141 30.5 || 3-person households 76,995 14.1 | 70,136 23.1 6,859 2.8 | 55,975 16.1 21,020 10.5 || 4-person households 62,039 11.3 | 59,383 19.6 2,656 1.1 | 49,804 14.3 12,235 6.1 || 5-person households 20,480 3.7 | 19,572 6.5 908 0.4 | 15,584 4.5 4,896 2.4 || 6-person households 6,427 1.2 | 6,031 2.0 396 0.2 | 4,595 1.3 1,832 0.9 || 7-or-more person households 3,361 0.6 | 2,997 1.0 364 0.1 | 2,159 0.6 1,202 0.6 || ||P16I/P17I/P36I/P37I/H11I/H12I. POPULATION IN HOUSEHOLDS AND AVERAGE HOUSEHOLD SIZE BY TYPE AND BY TENURE ||Universe: Population in Households (Occupied Housing Units) With A Householder Who Is White Alone, Not Hispanic or Latino (**) || || Total | In In | In Owner In Renter || Population Pct. | Families Pct. Nonfamilies Pct. | Occupied Pct. Occupied Pct. || | | ||Total population in households 1,219,974 100.0 | 871,355 71.4 324,321 26.6 | 842,189 69.0 377,785 31.0 || Under 18 years 233,997 100.0 | 230,432 98.5 ----- ----- | ----- ----- ----- ----- || 18 years and over 985,977 100.0 | 640,923 65.0 ----- ----- | ----- ----- ----- ----- ||Average Household Size 2.23 ----- | 2.87 ----- 1.33 ----- | 2.43 ----- 1.88 ----- || Under 18 years 0.43 ----- | 0.76 ----- ----- ----- | ----- ----- ----- ----- || 18 years and over 1.80 ----- | 2.11 ----- ----- ----- | ----- ----- ----- ----- || ||Note: Family household numbers include nonrelatives living with families. ||___________________________________________________________________________________________________________________________________________________|| ||PCT20I/PCT22I. GROUP QUARTERS POPULATION BY SEX BY AGE BY GROUP QUARTERS TYPE ||Universe: Population in group quarters for persons who are White Alone, Not Hispanic or Latino (*) || || || ---- All Ages ---- --------------------- 18 Years and Over ---------------------- || Pct. of Pct. of Pct. of || All Total Total || Number Pct. Total Ages Male 18+ Female 18+ || ||All types of group quarters: 23,057 100.0 22,590 98.0 11,233 49.7 11,357 50.3 || Institutionalized population: 6,865 29.8 6,675 28.9 3,100 13.7 3,575 15.8 || Correctional facilities for adults 1,662 7.2 1,658 7.2 1,435 6.4 223 1.0 || Juvenile facilities 210 0.9 24 0.1 17 0.1 7 0.0 || Nursing facilities/skilled-nursing facilities 4,830 20.9 4,830 20.9 1,565 6.9 3,265 14.5 || Other institutional facilities 163 0.7 163 0.7 83 0.4 80 0.4 || Noninstitutionalized population: 16,192 70.2 15,915 69.0 8,133 36.0 7,782 34.4 || College/university student housing 8,025 34.8 7,997 34.7 3,638 16.1 4,359 19.3 || Military quarters 278 1.2 278 1.2 236 1.0 42 0.2 || Other noninstitutional facilities 7,889 34.2 7,640 33.1 4,259 18.9 3,381 15.0 ||___________________________________________________________________________________________________________________________________________________||Note: (*) Tables with PERSONS as the universe enumerate persons according to their own race or ethnic category. (**) Tables with HOUSEHOLDS || or HOUSEHOLDERS as the universe enumerate persons in households according to the race or ethnic category of the householder. || (***) Same-sex couple households are included in the family households category if there is at least one additional person || related to householder by birth or adoption. Same-sex couple households with no relatives of the householder present are tabulated || in nonfamily households. Responses of 'same-sex spouse' were edited during processing to 'unmarried partner.' |+===================================================================================================================================================+Source: Census 2010 Summary File 1 [machine-readable data file]/Prepared by the U.S.Census Bureau, 2011. 06NOV12 Page 58 Prepared by: Washington State Office of Financial Management, Forecasting Division.