census trends in north carolina diane cherry environments policy manager institute for emerging...
TRANSCRIPT

Census Trends in North Carolina
Diane CherryEnvironments Policy ManagerInstitute for Emerging Issues

As the N.C. Census continues to be released, we can begin look at things such
as:
Population & MigrationEthnicity
Age & GenderIncome & Poverty
Family Structure & Living Arrangements

Population & Migration
Source: US Census Bureau

Population & Migration
Source: News & Observer

http://www.forbes.com/2010/06/04/migration-moving-wealthy-interactive-counties-map.html
Population & Migration

Population & Migration

Ethnicity

Age & Gender

Age & Gender
2009 20300
10
20
30
40
50
60
70
80
63
29
37
71
NC County Population Comparison: 0-17 vs. 60+
Counties With More 0-17 than 60+ Counties With More 60+ than 0-17Source: US Census Bureau

Age & Gender
Source: US Census Bureau

Age & Gender

Income & Poverty
3.30%8.50%
14.60%
23.40%
50.20%
Share of Household Income by Quintile: 2010
Lowest Second Middle Fourth HighestSource: US Census Bureau

Income & Poverty
Source: USDA

2000 20100.00%
10.00%20.00%30.00%40.00%50.00%60.00%70.00%80.00%90.00%
100.00%88.90%
66.70%
11.10%
33.30%
North Carolina Housing Type
Owner Occupied Housing Renter Occupied Housing
North Carolina saw a 33% decrease in homeownership from 2000 to 2010 while renting increased by 200%.
Family Structure & Living Arrangements

Family Structure & Living Arrangements

What Will NC Look Like in 2020?


2011 Redistricting:What it Means to Municipalities
Chris NidaResearch Analyst, N.C. League of Municipalities
NCLM Annual ConferenceOctober 24, 2011

Agenda
• What the Census Showed
• Redistricting Basics
• Implications of Redistricting for Municipalities

N.C. Becoming More Urban2000 2010
Municipal Population Municipalities Population
% of State Pop
Municipal Population Municipalities Population
% of State Pop
100,000+ 6 1,534,638 19% 100,000+ 9 2,409,574 25%
50,000-99,999 9 630,440 8% 50,000-99,999 7 503,609 5%
10,000-49,999 47 964,761 12% 10,000-49,999 66 1,382,568 14%
5,000-9,999 44 327,993 4% 5,000-9,999 50 351,597 4%
1,000-4,999 200 487,321 6% 1000-4,999 201 501,889 5%
<1000 234 108,688 1% <1,000 219 100,821 1%
Municipal total 540 4,053,841 50% Municipal total 552 5,250,058 55%
Unincorporated 0 3,995,472 50% Unincorporated 0 4,285,425 45%
TOTAL 540 8,049,313 100% TOTAL 552 9,535,483 100%

Redistricting
• Legally required after completion of decennial census
• Maps drawn and approved by legislature; no gubernatorial veto
• Must be approved by U.S. Justice Department or federal courts before going into effect
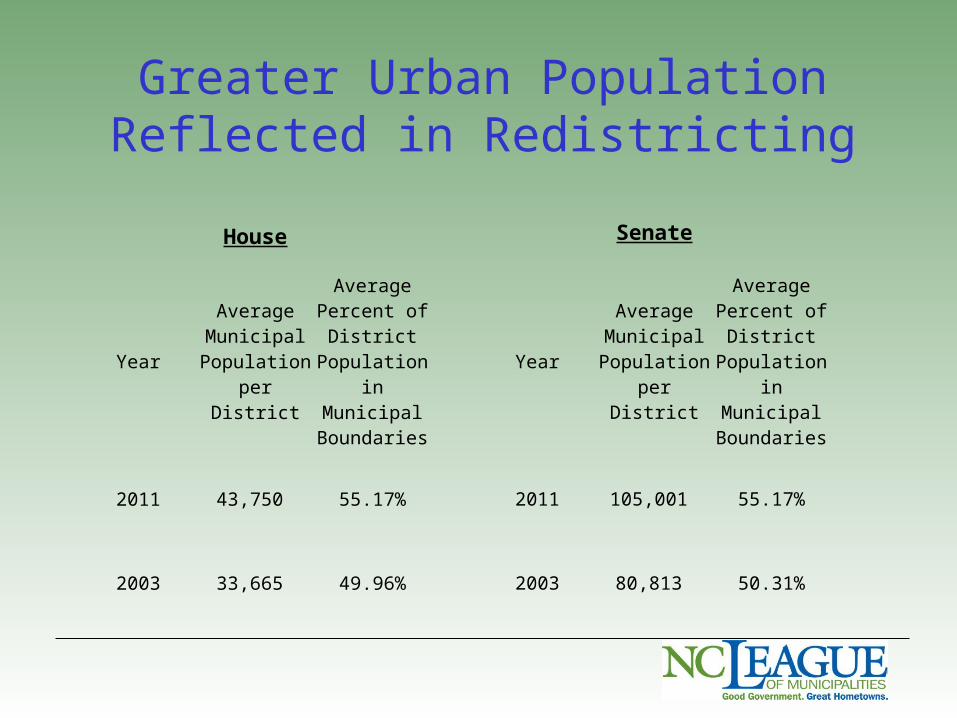
Greater Urban Population Reflected in Redistricting
House
YearAverage
Municipal Population per
District
Average Percent of
District Population in
Municipal Boundaries
2011 43,750 55.17%
2003 33,665 49.96%
Senate
YearAverage
Municipal Population per
District
Average Percent of
District Population in
Municipal Boundaries
2011 105,001 55.17%
2003 80,813 50.31%

Population Shifts Leading to Greater Municipal Influence?
• Mecklenburg and Wake counties added two House seats and one Senate seat each
• Greater representation in largest urban areas not necessarily signaling greater overall influence of cities and towns

Municipalities Split Between Districts Increasing
House
YearAverage Number of Municipalities
Per District
Number of Municipalities
in Multiple Districts
2011 6.22 123
2003 5.55 77
Senate
YearAverage
Number of Municipalities
Per District
Number of Municipalities
in Multiple Districts
2011 13.24 81
2003 11.74 43

House Districts2011
Percent of District Population in Municipal BoundariesNumber of Municipalities in District >80 50-80 20-50 <20
1 11 - 1 -
2 or 3 14 5 3 2
4 or 5 3 10 13 3
6 or more 2 17 25 11
Total 30 32 42 16
2003Percent of District Population in Municipal Boundaries
Number of Municipalities in District >80 50-80 20-50 <20
1 8 3 - 1
2 or 3 12 6 12 1
4 or 5 4 7 14 3
6 or more - 8 30 11
Total 24 24 56 16

Senate Districts2011
Percent of District Population in Municipal BoundariesNumber of Municipalities in District >80 50-80 20-50 <20
1 to 5 8 2 - -
6 to 10 1 6 7 -
11 or more - 9 14 3
Total 9 17 21 3
2003Percent of District Population in Municipal Boundaries
Number of Municipalities in District >80 50-80 20-50 <20
1 to 5 7 6 2 -
6 to 10 - 5 3 1
11 or more - 5 17 4
Total 7 16 22 5

Example: House District 74Percent of District Populationin Municipalities' Boundaries
Municipality 2011 2003
Winston-Salem 31.7% 56.8%
Walkertown 5.16% 4.3%
Rural Hall 3.7% 3.9%
Tobaccoville 3.0% 3.5%
King 0.8% 1.0%
Bethania 0.4% 0.2%
Kernersville 14.0% -
Lewisville 2.5% -
Total 61.1% 69.6%

Example: Senate District 5Percent of District Populationin Municipalities' Boundaries
Municipality 2011 2003
Goldsboro 15.7% 23.3%
Greenville 22.6% 22.1%
Winterville 2.1% 3.0%
Mount Olive 1.4% 2.8%
Farmville 2.6% 2.7%
Ayden 2.7% 1.8%
Snow Hill 0.9% 0.9%
Walnut Creek - 0.5%
Hookerton 0.2% 0.3%
Eureka - 0.2%
Walstonburg 0.1% 0.1%
Seven Springs - 0.1%
Kinston 9.9% -
La Grange 1.6% -
Bethel 0.9% -
Grifton 0.8% -
Fountain 0.2% -
Falkland 0.1% -
Grimesland 0.0% -
Total 61.7% 57.9%

Select Municipalities’ Senate Representation
2011 2003
Number of Districts/Population as % of District
Number of Districts/Population as % of District
Municipality 1 2 3 4 5 Municipality 1 2 3 4
Goldsboro 16% 4% Goldsboro 23% 1%
High Point 33% 18% 3% 0% 0% High Point 41% 13% 0% 0%
Rocky Mount 16% 10% 5% Rocky Mount 24% 11%
Wilson 15% 12% Wilson 28%

Select Municipalities’ House Representation
2011 2003
Number of Districts/Population as % of District
Number of Districts/Population as % of District
Municipality 1 2 3 4 Municipality 1 2 3 4
Burlington 34% 31% 1% Burlington 55% 14%
Chapel Hill 47% 19% 4% Chapel Hill 72% 3% 1% 0%
Kernersville 15% 14% 0% 0% Kernersville 27% 0%
New Bern 16% 14% 6% New Bern 24% 13%
Rocky Mount 47% 22% 5% Rocky Mount 32% 28% 26% 1%
Salisbury 30% 13% Salisbury 41%
Sanford 18% 18% Sanford 33%
Shelby 15% 12% Shelby 29% 0%
Wilson 31% 28% Wilson 54% 15%

Select Municipalities’ Legislative Representation
2011 2003
Number of Districts/Population as % of District Number of Districts/Population as % of District
House
Municipality 1 2 3 4 1 2 3 4
Asheville 79.8% 15.6% 6.8% 44.5% 38.6% 17.5%
Fayetteville 90.3% 70.9% 69.7% 22.5% 73.1% 55.7% 32.7% 19.1%
Senate
Greensboro 78.0% 31.7% 27.9% 95.2% 36.2% 6.0%
Durham 63.8% 53.3% 0.0% 0.0% 80.0% 38.3% 0.0% 0.0%

Conclusions
• Mixed bag for municipalities – some benefit, while some see influence potentially diluted
• Working together crucial for many municipalities sharing districts
• Subject to change pending final approval


Municipal Estimates: Methods, Data and Changes
Jennifer Song, State Demographer, Office of State Budget and Management
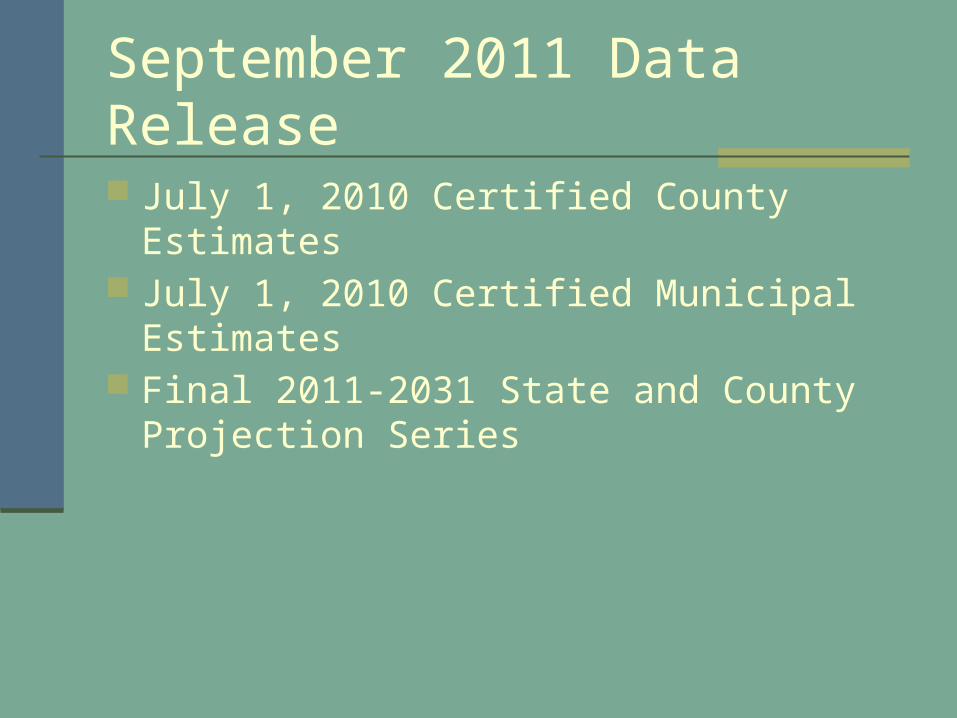
September 2011 Data Release
July 1, 2010 Certified County Estimates July 1, 2010 Certified Municipal Estimates Final 2011-2031 State and County Projection
Series

2011 Data Release Highlights
July 1, 2010 County and Municipal Estimates incorporate Census 2010 data as the new base.
CQR challenges accepted by the Census Bureau will be used as the base in subsequent estimates.

Guidelines on Data Usage
DO NOT COMPARE:
Last year’s 2009 municipal estimates with the current July 1, 2010 municipal estimates.
DO COMPARE: July 1, 2010 municipal estimates to Census
2010 and previous Census counts. Smoothed county estimates from 2000-2009
which are consistent with both Census 2000 and Census 2010.

Why the difference?
2009 estimates used 2000 Census as base; 2010 estimates use 2010 Census as base
Input data – annexation data, housing unit counts
The ‘smoothing’ nature of estimates and changing patterns of growth

The Municipal Estimates Model
Will use Census 2010 as the base Uses data on annexations, group
quarters and housing submitted by the municipalities
Is a 3-method model

Method 1: Municipality Grows Like the County Assumes the non-group quarters population
of the municipality grows at the same rate as the county population
This was the only method used this year (for the July 1, 2010 estimates)
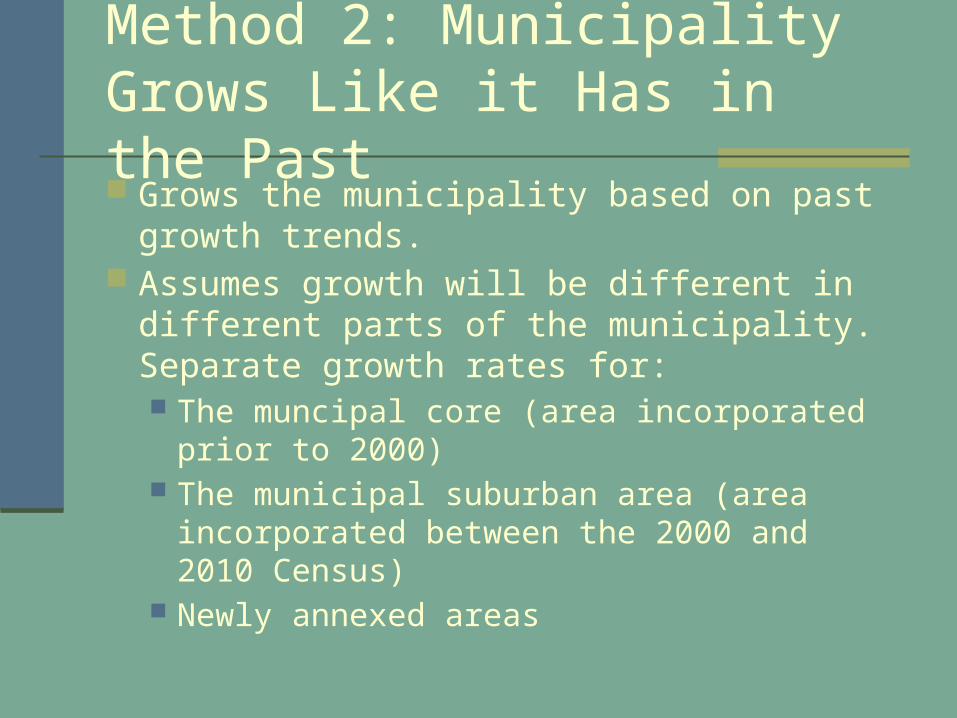
Method 2: Municipality Grows Like it Has in the Past Grows the municipality based on past growth
trends. Assumes growth will be different in different
parts of the municipality. Separate growth rates for: The muncipal core (area incorporated prior to
2000) The municipal suburban area (area incorporated
between the 2000 and 2010 Census) Newly annexed areas

Method 3: Population Grows Like Housing Grows the municipality’s population at the
same rate as it’s housing unit share As the municipality’s share of the county’s
housing stock changes, its share of the county’s population is changed at the same rate
Most similar to the Census Bureau’s estimates method

Putting it all together
Traditionally the 3 methods have been weighted equally (i.e., averaged)
After testing with Census 2010, we will be introducing 3 alternative weighting approaches: Equal weights – i.e, all three methods predicted
equally well for the muncipality 50%, 25%, 25% - one method predicted
particularly well for the municipality 40%, 40%, 20% - two methods predicted about
equally well

Our Annual Surveys – Boundary and Annexation Survey Asks for annexation data, occupied housing
units and land areas This is our main source of data about
annexations – if they aren’t reported, they don’t get counted.
Important to update occupied housing unit counts to get the most accurate estimate
Report all annexations – we also estimate land area, so even commercial annexations should be included

Our Annual Surveys – Group Quarters Verify that group quarters facilities are
correctly located Inform us about new facilities or missing
facilities In a few cases (such as orphanages or
monasteries) provides us population counts Only track facilities with 20 or more long-term
residents Assisted living facilities and jails are not
considered group quarters

Our Annual Surveys – Housing Unit Data Effort to improve on Census Bureau housing
estimates – will still serve as default The main data that is used for Method 3 Working with the Census Bureau to submit
the data to them as well

Keep in Touch!
Even if you have no changes, return the surveys
If your contact information changes, let our office know
If you submit a CQR challenge, let us know Our surveys are separate from those sent out
by the Census Bureau

More Information
Website with estimates and projection data:
http://demog.state.nc.us
OR
http://www.osbm.state.nc.us/ncosbm/facts_and_figures/ socioeconomic_data/population_estimates.shtm
Contact information: [email protected] 919-807-4756