centaur media plc annual report and financial …
TRANSCRIPT

CENTAUR MEDIA PLCANNUAL REPORT AND FINANCIAL STATEMENTS FOR THE YEAR ENDED 31 DECEMBER 2015
WE CREATE
THAT INSPIRES AND ENABLES PEOPLE TO EXCEL AT
WHAT THEY DO

3
CENTAUR MEDIA: INSPIRES AND ENABLES
CENTAUR MEDIA:INSPIRES AND ENABLESExpert content and insight, engaging events, smart digital technology
Centaur Media is a UK-based multi-platform content group that inspires and enables people to excel at what they do, setting the standard for market insight, interaction and impact.Centaur Media creates expert insight and content, engaging events and smart digital technology.
We provide information, intelligence, events and marketing solutions - from our digital media and iconic print brands to our award-winning events and cutting-edge data products.
We create products and services that make content valuable, combining the deepest knowledge with the best user experience in whatever format and at whatever frequency best suits our customers.
We understand our customers and their needs. We enable and inspire the very best performance in our core markets.
Collaboration is at the heart of everything we do: our content creators, data experts, event organisers and digital specialists work together to connect our customers with the best information and experiences.
Centaur Media is a content business with a relentless focus on the customer, continually redefining what content means in the 21st century and seeking new ways of communicating to our customers.
CONTENTS
INTRODUCTION04 Reporting Period
04 Highlights
04 Outlook
05 Financial Highlights
PART 1 - PERFORMANCE REPORT06 Chairman’s Statement
07 Chief Executive’s Review
10 Strategic Report
10 Strategy
11 Business Model
12 Key Performance Indicators
13 Risk Management
16 Operating Review
26 Financial Review
34 Corporate Responsibility
PART 2 - GOVERNANCE36 Board of Directors
38 Executive Committee
40 Directors’ Report
44 Directors’ Statement on Corporate Governance
50 Audit Committee Report
56 Nomination Committee Report
58 Remuneration Committee Report
77 Statement of Directors’ Responsibilities
PART 3 – INDEPENDENT AUDITORS’ REPORT78 Independent Auditors’ Report
PART 4 - FINANCIAL STATEMENTS88 Consolidated Statement of Comprehensive Income
89 Consolidated Statement of Changes in Equity
90 Company Statement of Changes in Equity
91 Consolidated Statement of Financial Position
92 Company Statement of Financial Position
93 Consolidated Cash Flow Statement
94 Company Cash Flow Statement
95 Notes to the Financial Statements
OTHER INFORMATION141 Five Year Record
142 Directors, Advisors and Other Corporate Information

REASONS TO INVEST IN CENTAUR MEDIAINTRODUCTION
4 5
1 Underlying growth rates exclude the impact of the disposal of Perfect Information (H1 2014 revenue contribution of £2.6m), Aidex (H2 2014 revenue contribution of £0.8m) and discontinued events (H1 2014 revenue contribution of £1.3m). Excluding the impact of discontinued events, underlying revenues grew by 2%.
2 The reported operating loss and loss before tax in 2015 include a charge of £11.9m (2014: £nil) relating to the non-cash impairment of goodwill in the Professional segment.
3Adjusted results exclude adjusting items as detailed in note 1 to the Financial Statements.
FINANCIAL HIGHLIGHTS
Year ended Year ended 18 months ended 31 December 31 December 31 December Reported Underlying 2015 2014 2014 growth growth1
Audited Unaudited Audited Revenue (£m) 70.5 72.8 105.6 (3%) 4%
Operating (loss) / profit (£m)2 (4.7) 3.0 1.1 (256%)
Adjusted operating profit (£m)3 10.5 10.2 11.7 3% 14%
Adjusted operating profit margin3 14.9% 14.0% 11.1%
Adjusted profit before tax (£m)3 9.8 9.2 10.1
(Loss) / profit before tax (£m) (5.6) 14.2 11.3
Fully diluted EPS (pence) (4.6) 9.1 7.2
Adjusted fully diluted EPS (pence)3 5.3 5.0 5.5 6%
Dividend per share (pence) 3.0 3.0 3.85
Adjusted operating cash flow (£m)3 3.3 12.5 12.9
Cash conversion 31% 123% 110%
REPORTING PERIOD
This annual report covers the statutory reporting period which is the year to 31 December 2015 (‘the reporting period’). Due to the change in year end from 30 June to 31 December during 2014, resulting in an 18-month reporting period for 2014, we have considered it beneficial to include additional information in respect of the calendar year ended 31 December 2014 (which is unaudited) to enhance comparison with the 2015 reporting period. References to underlying or reported growth refer to comparative 12 month periods throughout.
HIGHLIGHTS
OUTLOOK
Underlying revenues1 increased 4% at £70.5m Quality of mix continuing to improve: digital revenues +20%
Adjusted operating profits3 up 14% on an underlying basis at £10.5mAdjusted operating margins increase to 14.9% (2014: 14.0%)
Final dividend of 1.5p (2014: 1.3p) in line with guidance
Adjusted fully diluted EPS increases by 6% to 5.3p (2014: 5.0p)
Encouraging start to 2016
Non cash impairment charge of £11.9m (2014: £nil) resulting in reported loss before tax of £5.6m (2014: PBT £11.3m)
5% revenue growth and modest improvement over 15% adjusted operating margin targeted for current year
Net debt at £17.9m (2014: £14.7m) with leverage (net debt/adjusted EBITDA) of 1.3 times
Leverage (net debt / adjusted EBITDA) targeted at less than 1 times by end 2016Cash conversion rates returning to +100% in 2016

6 7
PERFORMANCE REPORT
CHIEF EXECUTIVE’S REVIEWOverview
Centaur made steady progress against its strategic priorities during the year. 2015 was the second year of our programme to re-energise and to build a platform that can support stronger growth in the future. We are focused on improving our brands and products for both audiences and customers through innovation, platform improvements and specific product changes.
We have improved the overall quality of our revenue streams and earnings, with total digital and live events revenues now accounting for almost 80% of Group revenues and with adjusted operating profit margins up to 15%.
Across the Group we are gradually transitioning away from less visible transactional revenues dependent on scale – such as advertising – to those that can deliver significantly more value to our customers. Our investment and focus on the customer is critical if we want to improve the quality of our paid-for content. We must create content that adds value to their business and that they are willing to pay for. However whilst advertising revenues still contribute just under one third of the Group’s total revenues, we have successfully reshaped our relationship with our audiences and clients to be more digitally-focused, and digital advertising now accounts for almost 60% of total advertising revenues.
In my 2014 review, I set out the vision for Centaur Media as a multi-platform content group. The four strategic priorities which were set out at that time remain central to everything we do.
To be the most knowledgeable, connected and authoritative experts in our markets, totally focussed on our customers’ needs
To generate sustainable growth in profits and cash flow with high-quality revenue streams and an efficient and scalable operating model
To create products and services that are both innovative and market-leading, backed by strong digital and events expertise
To be a united team of entrepreneurial, multi-skilled professionals
2015 saw many achievements. We re-launched 9 magazines, 12 of our websites and 2 other annual events and launched 6 new annual events and one bi-annual event as well as 3 new subscription products. Improving the engagement with our digital audiences is a critical ingredient to re-energise our well-established brands and we are delighted to report that we have seen numerous examples of improved digital engagement.
The Home Interest portfolio has performed exceptionally well, with underlying revenue growth of 9%, demonstrating the importance of a market-led strategy. I am also encouraged to see that the Financial Services portfolio, which reported a 12% underlying decline in revenues in 2014, saw underlying revenues grow by 3% in 2015.
The Marketing portfolio grew underlying revenues by 4%, which was lower than the 7% growth achieved in 2014, but we are confident that the rate of growth will improve in 2016. Across the Professional portfolio, total underlying revenues grew by 1%, helped by a particularly strong performance from the Legal portfolio. This was offset by declining HR revenues and modest underlying growth from across the Engineering and Travel portfolios. Reflecting a more moderate growth outlook across the Professional segment, including HR and Engineering, and specifically reflecting weaker print and advertising trends, the Group has recognised a non-cash impairment of £11.9m against goodwill in the Professional segment (2014: £nil).
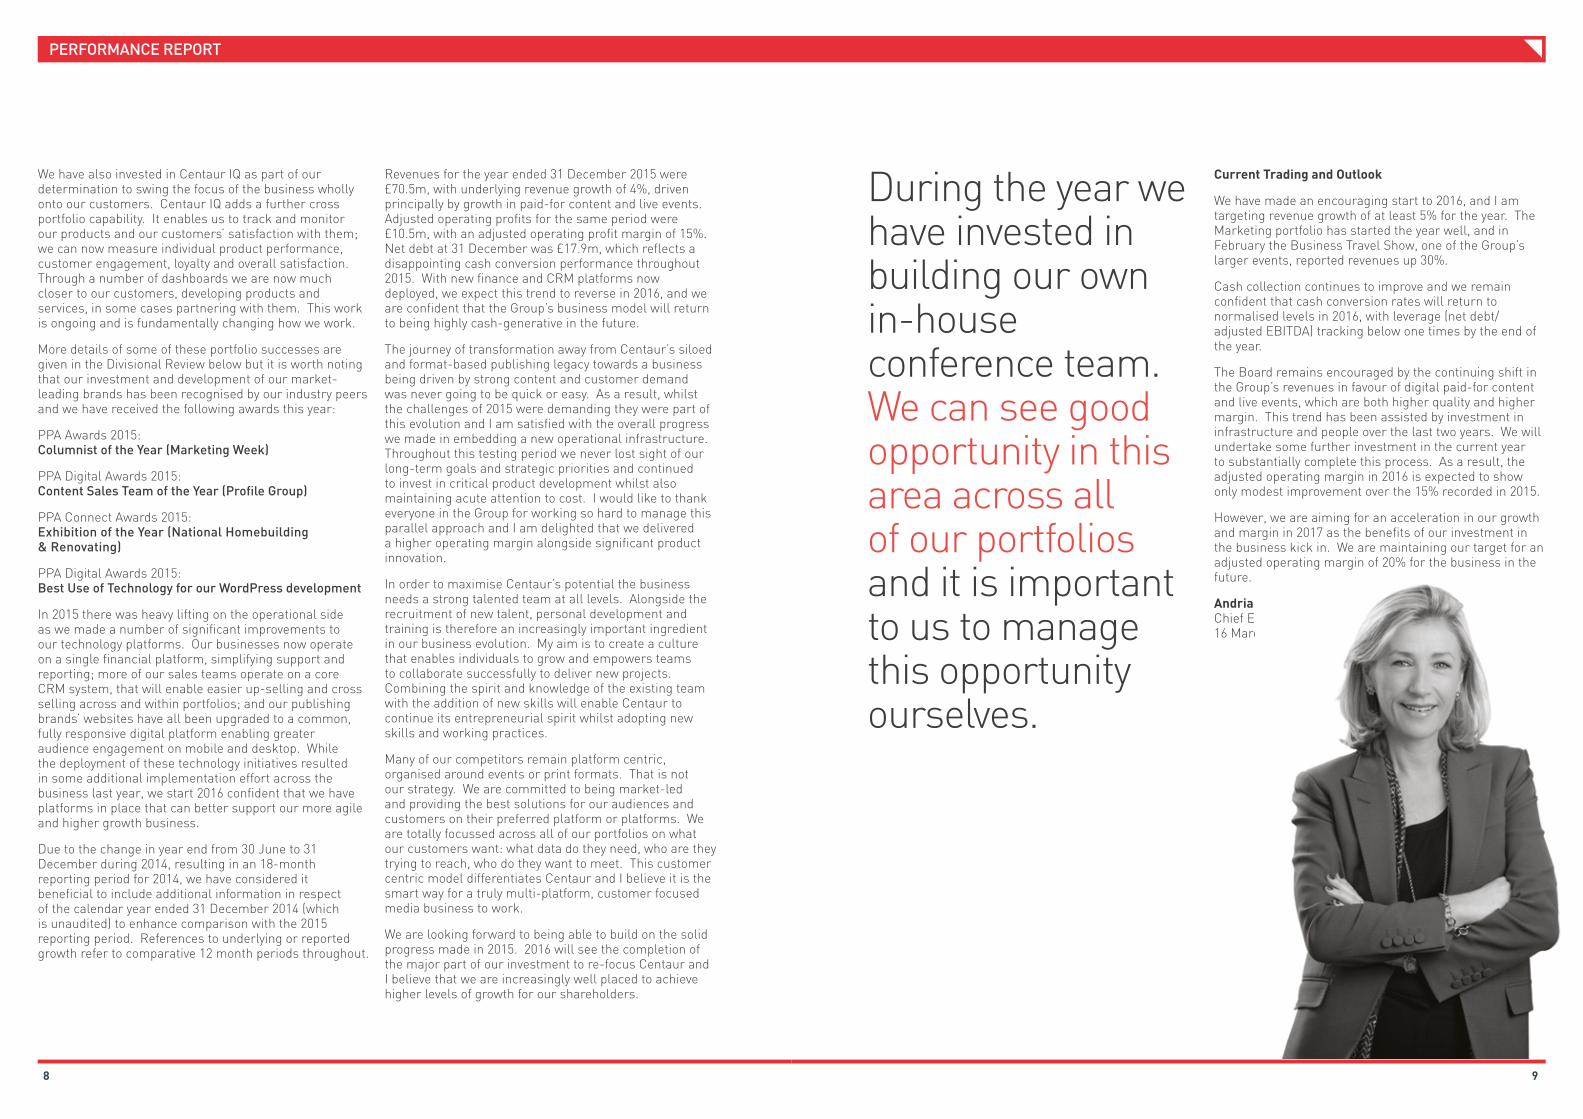
During the year we have invested in building our own in-house conference team. We can see good opportunity in this area across all of our portfolios and it is important to us to manage this opportunity ourselves.
CHAIRMAN’S STATEMENTDear Shareholder
This is my first review as Chairman of Centaur Media, having been appointed in May 2015. In the intervening time, I have come to understand a great deal about the inherent strengths and attractiveness of the Group, together with an appreciation of some of the challenges that we face in rapidly changing markets.
The world of B2B media is highly competitive, and the creation of sustainably differentiated offerings to customers across multiple platforms is far from straightforward. Ultimately, success hinges upon an in-depth understanding of customer requirements and how these are evolving, coupled with sufficient organisational agility to deliver the desired mix of insightful products and services. It is this market-led approach, built upon understanding and meeting customer needs, that characterises the Centaur strategy.
Under the leadership of Andria Vidler and her team, Centaur has embarked upon a programme of transformation. A disparate collection of independent brands is being melded into a focused set of vertical market portfolios, where customer understanding and relationship can be leveraged. A print heritage is gradually being replaced by a truly multi-platform approach, with a clear focus on paid-for digital content and live events. Innovation is a crucial ingredient in the mix.
The Centaur transformation is not easy; it brings with it a degree of organisational complexity and the requirement to foster new behaviours and ways of doing business within the Group. It is also not yet complete; whilst the core elements are in place, much remains to be done. And the transformation is taking place against a backdrop of a continuing decline in print advertising spend, particularly in relation to recruitment advertising. But I am confident that the chosen strategic direction is sound and that Andria and her executive team have the talent, ambition and commitment to deliver it. A platform is being created at Centaur that should provide the foundations for superior growth, both organically and through selective acquisition, in revenues, profits and ultimately, shareholder value.
Results and Dividend
In 2015, Centaur’s underlying revenues grew by 4% to £70.5m. Adjusted operating profit grew by 3% to £10.5m, and adjusted diluted earnings per share rose by 6% to 5.3 pence.
In light of this performance, the Board is recommending a final dividend of 1.5 pence per share, to give a total dividend for the year of 3.0 pence per share. This compares to 3.85p per share for the 18 months ended 31 December 2014.
2015 has been a year of good progress across many fronts at Centaur. This reflects the commitment and dedication of colleagues at all levels in the Group, and I would like to extend my thanks to all for their hard work.
Governance
Centaur remains fully committed to the highest standards of corporate governance, and the Board takes very seriously its duties to operate with integrity, transparency and clear accountability. It also pays close attention to understanding and managing risk. Detail of what this means in practice, for the Board and its Committees, is contained within the governance section of the Annual Report.
During the year, I succeeded Patrick Taylor as Chairman of Centaur. On behalf of the Board, I am keen to extend my thanks to Patrick for his leadership and his very considerable contribution over many years.
Our Senior Independent Director, Chris Satterthwaite, has informed the Board of his intention to step down during 2016 after 9 years as a Non-Executive Director of the Group. He will only do so once a new Non-Executive Director has been appointed, and we have now started a process to identify and appoint a suitable candidate. Chris’s commitment and contribution to Centaur has been outstanding, and he will be much missed when he leaves later this year.
Ronald SandlerChairman16 March 2016
8 9
PERFORMANCE REPORT
Current Trading and Outlook
We have made an encouraging start to 2016, and I am targeting revenue growth of at least 5% for the year. The Marketing portfolio has started the year well, and in February the Business Travel Show, one of the Group’s larger events, reported revenues up 30%.
Cash collection continues to improve and we remain confident that cash conversion rates will return to normalised levels in 2016, with leverage (net debt/adjusted EBITDA) tracking below one times by the end of the year.
The Board remains encouraged by the continuing shift in the Group’s revenues in favour of digital paid-for content and live events, which are both higher quality and higher margin. This trend has been assisted by investment in infrastructure and people over the last two years. We will undertake some further investment in the current year to substantially complete this process. As a result, the adjusted operating margin in 2016 is expected to show only modest improvement over the 15% recorded in 2015.
However, we are aiming for an acceleration in our growth and margin in 2017 as the benefits of our investment in the business kick in. We are maintaining our target for an adjusted operating margin of 20% for the business in the future.
Andria VidlerChief Executive Officer16 March 2016
We have also invested in Centaur IQ as part of our determination to swing the focus of the business wholly onto our customers. Centaur IQ adds a further cross portfolio capability. It enables us to track and monitor our products and our customers’ satisfaction with them; we can now measure individual product performance, customer engagement, loyalty and overall satisfaction. Through a number of dashboards we are now much closer to our customers, developing products and services, in some cases partnering with them. This work is ongoing and is fundamentally changing how we work.
More details of some of these portfolio successes are given in the Divisional Review below but it is worth noting that our investment and development of our market-leading brands has been recognised by our industry peers and we have received the following awards this year:
PPA Awards 2015: Columnist of the Year (Marketing Week)
PPA Digital Awards 2015: Content Sales Team of the Year (Profile Group)
PPA Connect Awards 2015: Exhibition of the Year (National Homebuilding & Renovating)
PPA Digital Awards 2015: Best Use of Technology for our WordPress development
In 2015 there was heavy lifting on the operational side as we made a number of significant improvements to our technology platforms. Our businesses now operate on a single financial platform, simplifying support and reporting; more of our sales teams operate on a core CRM system, that will enable easier up-selling and cross selling across and within portfolios; and our publishing brands’ websites have all been upgraded to a common, fully responsive digital platform enabling greater audience engagement on mobile and desktop. While the deployment of these technology initiatives resulted in some additional implementation effort across the business last year, we start 2016 confident that we have platforms in place that can better support our more agile and higher growth business.
Due to the change in year end from 30 June to 31 December during 2014, resulting in an 18-month reporting period for 2014, we have considered it beneficial to include additional information in respect of the calendar year ended 31 December 2014 (which is unaudited) to enhance comparison with the 2015 reporting period. References to underlying or reported growth refer to comparative 12 month periods throughout.
Revenues for the year ended 31 December 2015 were £70.5m, with underlying revenue growth of 4%, driven principally by growth in paid-for content and live events. Adjusted operating profits for the same period were £10.5m, with an adjusted operating profit margin of 15%. Net debt at 31 December was £17.9m, which reflects a disappointing cash conversion performance throughout 2015. With new finance and CRM platforms now deployed, we expect this trend to reverse in 2016, and we are confident that the Group’s business model will return to being highly cash-generative in the future.
The journey of transformation away from Centaur’s siloed and format-based publishing legacy towards a business being driven by strong content and customer demand was never going to be quick or easy. As a result, whilst the challenges of 2015 were demanding they were part of this evolution and I am satisfied with the overall progress we made in embedding a new operational infrastructure. Throughout this testing period we never lost sight of our long-term goals and strategic priorities and continued to invest in critical product development whilst also maintaining acute attention to cost. I would like to thank everyone in the Group for working so hard to manage this parallel approach and I am delighted that we delivered a higher operating margin alongside significant product innovation.
In order to maximise Centaur’s potential the business needs a strong talented team at all levels. Alongside the recruitment of new talent, personal development and training is therefore an increasingly important ingredient in our business evolution. My aim is to create a culture that enables individuals to grow and empowers teams to collaborate successfully to deliver new projects. Combining the spirit and knowledge of the existing team with the addition of new skills will enable Centaur to continue its entrepreneurial spirit whilst adopting new skills and working practices.
Many of our competitors remain platform centric, organised around events or print formats. That is not our strategy. We are committed to being market-led and providing the best solutions for our audiences and customers on their preferred platform or platforms. We are totally focussed across all of our portfolios on what our customers want: what data do they need, who are they trying to reach, who do they want to meet. This customer centric model differentiates Centaur and I believe it is the smart way for a truly multi-platform, customer focused media business to work.
We are looking forward to being able to build on the solid progress made in 2015. 2016 will see the completion of the major part of our investment to re-focus Centaur and I believe that we are increasingly well placed to achieve higher levels of growth for our shareholders.
During the year we have invested in building our own in-house conference team. We can see good opportunity in this area across all of our portfolios and it is important to us to manage this opportunity ourselves.

10 11
PERFORMANCE REPORT
BUSINESS MODEL The Group’s activities are categorised across four market segments: Marketing, Financial Services, Professional and Home Interest. These activities are supported by expert teams across digital product development, IQ (marketing and research), production, live events and exhibition operations.
The Group generates revenues from three primary revenue sources: paid-for content, live events and advertising.
Paid-for content revenues include:
Subscriptions: These are the fees that customers pay to receive access to the Group’s information, through online access to various databases or through regular delivery of soft copy research or hard copy magazines. Subscription revenue is recognised over the period of the subscription.
Copy sales: These are generated primarily across the Group’s Home Interest print titles, Homebuilding & Renovating, Real Homes and Period Living, and selectively across the Group’s business magazines, including Creative Review and Marketing Week. This area also covers the sale of market reports from the Platforum business and other one-off sales of products and services. Revenues are recognised in line with the publishing schedule for these products.
Live events revenues are all recognised when the event is held and are typically paid in advance of the event. These include:
Exhibitor revenues: This represents space sold at our live events that enable our customers to raise awareness and sell their products and services. It is an ideal way for our customers to forge new relationships through face-to-face meetings and sell or showcase their products.
Sponsorship revenues: Across all of our live events, we have partners that want to be associated with the event. Through their participation they can create, develop and increase brand awareness, furthering their credibility within a target audience to develop contacts and exposure for their business.
Attendee revenues: Our consumer-focused exhibitions, The Festival of Marketing and our meetings and awards events all charge a fee for attendees to access the event. The Group also generates revenues from sales of tables for companies and individuals attending the various industry awards evenings the Group organises, as well as the paid-for entries to these awards.
Training revenues: The Group provides digital marketing training services to customers in the UK and overseas through the Econsultancy business. These services are delivered through public training courses and through the delivery of bespoke services to clients. The revenues are recognised when the training is delivered.
Advertising revenues represent the fees that customers pay to place an advertisement in one or more of the Group’s publications, either in print, online or on mobile. There are products where advertising is the main driver and others where advertising is simply a supplemental earnings stream. This includes display, classified and recruitment advertising whatever the delivery platform. The Group also classifies as advertising, revenues generated from sponsored content, content marketing, native advertising and other publication-based marketing solutions, whether print or digital. Revenue is recognised on publication.
We build a deeper understanding of the commercial opportunities across each market through an unremitting focus on our markets and audience. We know that our customers want flexible content that works seamlessly across multiple platforms. By leveraging this market insight and an understanding of our customer requirements we are able to offer a higher-value customer proposition. This is delivered in whatever format our clients want, whether that is in print, digital or as a live event. Each market segment has clear growth plans focused on new digital products, new revenues streams, multi-platform content and clear competitor differentials.
Supporting each of these markets, we have centralised expert teams across digital product development, IQ (marketing and research), production, live events and exhibition operations.
These teams provide the expertise and scale that allows us to support effectively and efficiently the delivery of commercial opportunities across each market. The creation of these expert teams also enables us to manage our cost base effectively and to prioritise investment across the business.
The commercial activities of the business, including the market-facing portfolios and the expert teams, are supported by Group functions including finance, HR, property, legal, risk management and IT.
All costs across the business are tightly managed with a rigorous focus on margin and return on investment. We seek to maintain as flexible and scalable a cost base as possible, outsourcing or consolidating shared activities where possible. All of our London activities are now consolidated within one building.
This structure creates the potential to scale opportunities that alongside underlying revenue growth enables good progression in adjusted operating margins. It also creates the opportunity to effectively bolt on acquisitions where these can accelerate revenue and margin growth.
While our business remains primarily UK-focused, we have a growing presence in North America and Asia, and we continue to explore opportunities across these markets. To underline Centaur’s outward-looking strategy, an experienced general manager to oversee our US businesses was appointed in February 2015 and is based in our New York office.
STRATEGIC REPORT
STRATEGYCentaur Media is a content business that predominantly offers professionals products and services that accelerate their marketing and business performance. Our core objective is to deliver sustainable growth in revenues, profits and cash flow, and in turn to increase shareholder value. To achieve this we have set out four strategic priorities. These are set out below alongside the initiatives we are taking to deliver these, the associated risks and the KPIs against which we measure progress internally. See page 13 for a detailed explanation of the Group’s principal risks and uncertainties.
PRIORITY ACTIONS KEY RISKS METRICS
To be the most knowledgeable, connected and authoritative experts in our markets
The Group has refocused across its core market segments, and has created expert teams to support the commercial activity across each market.
Competitive threat and loss of key staff
Industry recognition
Client engagement
Market share
To generate sustainable growth in profits and cash flows with high quality, recurring revenue streams and an efficient and scalable operating model
The Group is leveraging its expertise across live events and digital paid-for content to grow these recurring revenue streams. The restructure around expert teams and Group functions creates the scale that can support good margin growth.
Downturn in economy or market sectors
Failure in digital or live events strategy
Increasing share of live events and paid-for content revenues
Growth in subscription invoiced contract values
Adjusted operating margin
Revenue per employee
To create products and services that are both innovative and market-leading, backed by strong digital and events expertise
The focus across our core markets and the creation of expert teams in digital and live events enable the Group to prioritise investment and to maintain a strong pipeline of new product development.
Competitive threat
Downturn in market sector
Failure to respond fast enough to market requirements or technological change
Successful launches measured against return on investment, revenues and operating margin
Market share
To be a united team of entrepreneurial, multi-skilled professionals
Creation of a ‘One Centaur Media’ culture. Alignment of incentive plans and link to portfolio and Group metrics.
Loss of key staff
Failure to recruit and retain talented new employees
Staff retention and engagement

12 13
PERFORMANCE REPORT
RISK MANAGEMENTRISK MANAGEMENT APPROACH
The Board has overall responsibility for the effectiveness of the Group’s system of risk management and internal controls and these are regularly monitored by the Audit Committee.
Details of the activities of the Audit Committee in this financial year can be found in the Audit Committee Report on page 50.
The Executive Committee is responsible for identifying, managing and monitoring material risks in each area of the business and is responsible for regularly reviewing and updating the risk register as well as reporting to the Audit Committee in relation to risks, mitigations and controls. As the Group operates principally from one office and with relatively short management reporting lines, members of the Executive Committee are closely involved in day-to-day matters and able to identify areas of increasing risk quickly and respond accordingly. Each risk identified is assigned to a member of the Executive Committee or senior management. The Audit Committee considers risk management and controls regularly and the Board formally considers risks to the Group’s strategy and plans as well as the risk management process as part of its strategic review.
The risk register is the core element of the Group’s risk management process. The register is maintained by the Company Secretary with input from the Executive Committee which initially identifies the material risks facing the Group and then collectively assesses the severity of each risk (by ranking both the likelihood of occurrence of the risk and its potential impact on the business) and the mitigating controls in place in respect of the risk.
As part of its risk management processes, the Board considers both strategic and operational risks and its risk appetite in terms of the tolerance level it is willing to accept in relation to each principal risk. This approach recognises that risk cannot always be eliminated at an acceptable cost and that there are some risks which the Board will, after due and careful consideration, choose to accept. The Group’s risk register, its method of preparation and the operation of the key controls in the Group’s system of internal control are regularly reviewed and overseen by the Audit Committee with reference to the Group’s strategic aims and its operating environment. The register is also reviewed and considered by the Board.
In response to the 2014 revision to the UK Corporate Governance Code, the Group has reviewed its procedures to ensure that the necessary monitoring of risks and controls were carried out throughout the reporting period and going forward.
The Group’s risk register currently includes operational and strategic risks. The principal risks faced by the Group in 2015, taken from the register, together with the potential effects and mitigating factors, are set out below.
PRINCIPAL RISKS
The Directors confirm that they have undertaken a robust assessment of the principal risks facing the Group.
Trends in print advertising and direct sales of print products mean that revenues from these sources continue to shrink and are not replaced like-for-like with online or digital products. The non-print media sector has high levels of competition from a wider group and low barriers to entry. This leads to different pressures on audience and customer retention as well as pricing.
The strategy of identifying the type of content our audiences want and how they want to consume the content means that we are not simply putting print products online to try to replace diminishing print revenues for traditional brands. In 2015, we launched 3 new subscription products, 6 new annual events and one bi-annual event, and relaunched 9 magazines, 12 websites and 2 annual events with the specific aim of meeting current and future demand from audience and advertisers. We support our product innovation, by hiring people with experiences and skills in new areas of the market where appropriate. The role of our Executive Committee includes anticipating future changes in the market and ensuring that our business reacts accordingly.
Movement in risk: >The Board considers this risk to be broadly the same as for the previous reporting period.
High levels of attrition amongst staff in some parts of the business and loss of key senior staff lead to recruitment and training costs, loss of productivity, potential loss of clients and potential inability to maintain content quality and deliver our specific plans.
All employees of the Group have regular performance reviews at which personal and career development opportunities are discussed. All employees have access to training, share schemes and other benefits and the Group benchmarks its approach against best practice within the sector. The Group conducted its annual staff engagement and satisfaction survey in 2015 and the survey will be repeated in 2016 to ensure further progress in this area is made and measured. Addressing levels of attrition is a KPI for managers’ performance targets in 2016 and the Group is prioritising the setting of appropriate remuneration across the Group to ensure we remain competitive within the market. It is a focus of Portfolio Directors to ensure that client relationships and content quality are maintained as a team rather than by
KEY PERFORMANCE INDICATORS
The Group has set out the following core financial metrics to measure our performance going forward.
KPI DESCRIPTION PERFORMANCE4
Underlying revenue growth Total revenues adjusted for the impact of acquisitions and disposals
2015: + 4% (2014: +3%)
Adjusted operating margin Adjusted operating profits as a percentage of revenues
2015: 15% (2014:14%)
Adjusted diluted EPS Adjusted earnings attributable to each share, calculated on a fully diluted basis, as set out in more detail in note 8 to the Financial Statements
2015: 5.3 pence (2014: 5.0 pence)
Cash conversion The percentage by which cash generated from operations covers adjusted operating profit, as set out in the financial review
2015: 31% (2014: 123%)
Development of recurring revenue streams
The percentage of total revenues derived from live events and paid-for content
Live events and paid-for content revenues accounted for 67% of total 2015 revenues (2014: 68%)
Return on investment on acquisitions and new product development
The incremental cash flows generated from an investment relative to the total cash investment to acquire or develop the asset
Return on investment on new product development in 2015 exceeds internal benchmarks
The key performance indicators are within the Board’s expectations and the ongoing focus on these measures will support its successful strategy. These indicators are discussed in more detail in the Chief Executive’s Review and in the Operating and Financial Reviews.
4 Performance measures compare the reporting period to the calendar year ended 31 December 2014 (unaudited).

14 15
PERFORMANCE REPORT
major events and exhibitions venue providers and we continue to review and explore alternative options for venues to mitigate this risk. We have also reviewed and revised our disaster recovery plan to ensure that, in the event of the unavailability of any venue or part of a venue, our reaction is quick and well-planned. In addition our Group policy is to contract with suppliers and customers under our standard terms where possible, which seek to protect us from costs and loss of revenue in the event of force majeure or cancellation of events.
Movement in risk: The Board considers this risk to have increased since last year due to increased competition for venues caused by a higher number of events taking place in the market, meaning that this risk has been included as a principal risk facing the Group for the first time.
The Group’s products could be vulnerable to replication by competitors in the UK or other markets including, potentially, those offering content under a different revenue model that reduces or eliminates costs for users.
The Group has continued to invest in its expert hub, entirely focused on digital product development. The team is led by experienced digital product experts and adequately resourced in terms of product expertise and personnel. The product pipeline is planned up to 12 months ahead, and progress against this schedule is reviewed (fortnightly) to take into account changes in customer requirements and business priorities as well as activities of our competitors. In addition we have invested in our registered intellectual property and we seek to enforce our legal rights to protect our brands and intellectual property where necessary.
Movement in risk: >The Board considers this risk to be broadly the same as for the previous reporting period.
Changes to regulations and legal requirements, including in relation to areas such as data protection and direct marketing, restrict or burden the Group’s activities.
Legal and regulatory matters are dealt with by our legally-qualified Company Secretary supported by our panel of respected law firms. Our Company Secretary, supported by internal experts in employment and health and safety matters, is tasked with updating and advising the Board on changes to law and regulation that may affect the Group’s interests and require alterations to our business practices.
Movement in risk: > The Board considers this risk to be broadly the same as for the previous reporting period.
Key to movement in risk from last year
Increase in risk
> Risk unchanged
Decrease in risk
VIABILITY STATEMENT
In accordance with provision C.2.2 of the 2014 revision of the UK Corporate Governance Code, the Directors have assessed the viability of the Group over a three-year period to December 2018, taking account of the Group’s current position, the Group’s strategy, the Board’s risk appetite and, as documented above, the principal risks facing the Group and how these are managed. Based on the results of this analysis, the Directors have a reasonable expectation that the Company will be able to continue in operation and meet its liabilities as they fall due over the period to December 2018.
The Board has determined that the three year period to December 2018 is an appropriate period over which to provide its viability statement. In making their assessment, the Directors have taken account of the Group’s existing financing arrangements to 2019, cash flows, dividend cover and other key financial ratios over the period. These metrics are subject to stress testing which involves sensitising a number of the main assumptions underlying the forecasts both individually and in unison. The assumptions sensitised include forecasted adjusted operating profit, cash conversion and capital expenditure. Where appropriate, this analysis is carried out to evaluate the potential impact of the Group’s principal risks actually occurring.
GOING CONCERN BASIS OF ACCOUNTING
In accordance with provision C.1.3 of the 2014 revision of the UK Corporate Governance Code (the ‘Code’), the Directors’ statement as to whether they consider it appropriate to adopt the going concern basis of accounting in preparing the financial statements and their identification of any material uncertainties to the Group’s ability to continue to do so over a period of at least twelve months from the date of approval of the financial statements can be found on page 43.
an individual, where possible. In addition, most senior employees enter into restrictive covenants upon starting employment with the Group.
Movement in risk: > The Board considers this risk to be broadly the same as for the previous reporting period.
Serious systems failure or breach of network security controls (as a result of a deliberate cyber-attack or unintentional event) results in misappropriation of financial assets, proprietary or sensitive information or operational disruption, such as unavailability of our websites and of our digital products to users or unavailability of support platforms, thereby directly affecting our revenues or collection activities and damaging our reputation with customers and audiences.
The Group has invested significantly in its IT systems and several key IT system upgrades were completed during 2015, including the implementation of new CRM and finance systems. Progress and performance is closely monitored by the Board and further IT system upgrades will take place during 2016. We engaged a new IT Director in 2015 and continue to invest in other new roles in these areas. Where possible, implementation of IT system upgrades is supported by internal teams to reduce the risk of relying on third parties and, where services are outsourced to suppliers, contingency planning is carried out to mitigate risk of supplier failure. During 2015, websites which were hosted on a legacy platform were migrated onto a new and more secure platform which is cloud hosted. Migration of our websites has reduced our vulnerability to a serious breach of network security controls but we consider the external environment a key factor in this risk so the Board has not reduced our assessment of likelihood.
Movement in risk: >The Board considers this risk to be broadly the same as for the previous reporting period.
Fraudulent or accidental breach of our security, or ineffective operation of IT and data management systems leads to loss, theft or misuse of confidential information or personal data or breach of data protection requirements resulting in increased regulatory supervision, damage to our reputation and / or direct financial impact.
The central Group IT support function monitors and assists our IT systems, including data management. Appropriate IT security is undertaken for all key processes to keep the IT environment safe. Websites are hosted by specialist third-party providers who provide warranties relating to security standards. All of our websites have been migrated onto a new and more secure platform which is cloud hosted and databases have been cleansed and upgraded during 2015. External access to data is protected and staff are instructed to minimise access to internal data and the sending of data lists, which are password protected or encrypted where appropriate. In
2015, the Group appointed a Data Director whose remit includes building on the existing controls around the use and processing of sensitive data. The Group has a disaster recovery plan which includes its IT systems and there is regular back-up of data, stored off-site. All privacy policies and website terms of use for the Group’s websites were updated and standardised during 2015.
Movement in risk: > The Board considers this risk to be broadly the same as for the previous reporting period.
The Group runs events that gather large numbers of people in single venues and locations, often in large cities in the UK and elsewhere. This results in operational health and safety risks including fire safety, food hygiene, crowd control, security and failure of equipment. As the Group operates events in locations hired from third parties including hotels as well as venue operators it is generally not in control of safety policies for the locations and depends upon the third party venue operator to have adequate safety policies, processes and equipment in place and to comply with health and safety regulations. If a serious physical incident occurred at an event, physical injury, death and other significant damage could occur.
Events are the responsibility of a specific team within the Group which has experience and training in health and safety risks and responses. The Group’s own employees are always in attendance at all our events and, at our major events, we engage third party floor managers with specialist health and safety expertise. Our Events teams risk assess every event venue in conjunction with the venue operator and key contractors. Wherever possible we ensure that contracts provide for liability to remain with venue operators who are best placed to manage the risks and we maintain insurance to cover our public liability.
Movement in risk: > The Board considers this risk to be broadly the same as for the previous reporting period.
For the Group’s larger events and exhibitions, there are only a small number of venues available for hire in the market from third parties such as hotels. If a venue or part of a venue becomes unavailable for reasons which could include a force majeure event (such as a flood or security lock-down due to a terrorist attack), it is unlikely that the Group would be able to transfer an event to a different venue at short notice, resulting in damage to our reputation and direct financial impact from revenues we would be unable to collect, costs already incurred, refunds due to customers or legal claims from customers and suppliers.
Given the lack of venues available for hire and the demand for those venues from our competitors in the market, it is impossible to have a plan in place to deal with all potential situations which could cause unavailability of a venue or part of a venue. Where possible, however, we are now securing longer-term (3 year) contracts with

16 17
PERFORMANCE REPORT
Year ended 31 December 2015
Revenues for the reporting period were £70.5m. Adjusted operating profits for the reporting period were £10.5m, with an adjusted operating profit margin of 15%. In the previous statutory reporting period for the 18 month period ended 31 December 2014, reported revenues were £105.6m. Adjusted operating profits for the same period were £11.7m with an adjusted operating profit margin of 11.1%.
Reflecting a more moderate growth outlook across portfolios reported within the Professional segment, including HR and Engineering, and specifically reflecting weaker print and advertising trends, the Group has recognised a non-cash impairment of £11.9m against goodwill in the Professional segment (2014: £nil).
Live events and paid-for content revenues contributed £47.1m (67%) to revenues in the reporting period compared to £70.5m (68%) in the previous statutory reporting period for the 18 month period ended 31 December 2014. Advertising revenues accounted for 32% of revenues in the reporting period, consistent with the contribution reported in the previous statutory reporting period for the 18 month period ended 31 December 2014.
Additional Information (year ended 31 December 2014 unaudited)
Revenues and adjusted operating profits for the year ended 31 December 2014 were £72.8m and £10.2m respectively. While our reported revenues for the year ended 31 December 2015 are 3% lower than reported in the year ended 31 December 2014, underlying revenue growth, when adjusted for the disposal of Perfect Information, Aidex and event rationalisation was 4%.
Across the Group’s core revenue categories, paid-for content revenues (£19.9m, 28% of total revenues) continued to grow well and advertising revenues (£22.5m, 32% of total revenues) were stable following a 9% underlying revenue decline reported in 2014. Digital advertising revenues, which account for 58% of total advertising revenues, grew by 16%. Live events revenues (£27.2m, 39% of total revenues) grew modestly on an underlying basis, with good growth across the exhibitions portfolio being offset by revenue declines across training, awards and other smaller event formats. Other revenues primarily include rental income.
5Underlying growth rates exclude the impact of the disposal of Perfect Information (H1 2014 revenue contribution of £2.6m), Aidex (H2 2014 revenue contribution of £0.8m) and discontinued events (H1 2014 revenue contribution of £1.3m). Excluding the impact of discontinued events, underlying revenues grew by 2%.
6Adjusted results exclude adjusting items as detailed in note 1 to the Financial Statements.
OPERATING REVIEWThis Annual Report covers the statutory reporting period which is the year to 31 December 2015 (‘the reporting period’). Due to the change in year end from 30 June to 31 December during 2014, resulting in an 18-month reporting period for 2014, we have considered it beneficial to include additional information in respect of the calendar year ended 31 December 2014 (which is unaudited) to enhance comparison with the 2015 reporting period. References to underlying or reported growth refer to comparative 12 month periods throughout.
Revenues and adjusted operating profits for the year ended 31 December 2015, the previous statutory period for the 18 month period from 1 July 2013 to 31 December 2014, and the year ended 31 December 2014 are set out below.
Year ended 18 months ended Year ended Reported Underlying 31 December 2015 31 December 2014 31 December 2014 growth growth5
Audited Audited Unaudited £m £m £m % %
Revenue 70.5 105.6 72.8 -3% 4%Adjusted operating profit 6 10.5 11.7 10.2 3% Adjusted operating margin6 14.9% 11.1% 14.0%
Also summarised on the same basis as above are the trends across the Group’s three core revenue categories: paid-for content, live events and advertising.
Year ended 18 months ended Year ended Reported Underlying 31 December 2015 31 December 2014 31 December 2014 growth growth Audited Audited Unaudited £m £m £m % %
Paid-for content 19.9 31.2 20.6 -3% 11%Live events 27.2 39.3 28.9 -6% 1%Advertising 22.5 33.7 22.4 0% 0%Other 0.9 1.4 0.9 0% 0%
Total revenues 70.5 105.6 72.8 -3% 4%

18 19
PERFORMANCE REPORT
The outlook across the Marketing segment remains encouraging. While the live events performance in the year ended 31 December 2015 was disappointing, we anticipate a return to growth in 2016 across all live events formats, and further growth in digital paid-for content revenues.
HIGHLIGHTS - MARKETING PORTFOLIO
Fashion and Beauty Monitor
Fashion and Beauty Monitor is the only digital resource to provide media, PR and brand contacts and industry events, news and intelligence for the fashion, beauty and lifestyle industries, all in one place. With professional details on more than 50,000 fashion, beauty and lifestyle contacts, Fashion and Beauty Monitor is relied upon by almost 900 subscribing companies worldwide. In 2015, the team developed a ground-breaking new curated database on influencers which is scheduled to launch in early 2016. Building upon 20 years of experience in the UK, Fashion and Beauty Monitor launched in the US in late 2014. As a result, in 2015 Fashion and Beauty Monitor’s global revenue growth was led by its US product which grew at 63%. The US launch was met with commercial acclaim and, in 2015, attracted leading brands including Kate Spade, DKNY, Abercrombie & Fitch, Hugo Boss, Vivienne Westwood and Time Inc as corporate subscribers.
Econsultancy
Econsultancy enables businesses and professionals to succeed in digital, marketing and ecommerce through a range of resources, including best practice reports, trends briefings, training, online resources, events and digital transformation consulting. In 2015, Econsultancy introduced a new Commercial Director and focused its strategy on driving its subscription business, concentrating on corporate ‘enterprise’ subscriptions. Key new enterprise clients included leading brands such as Matalan, Just Eat and Lego. In 2015, Econsultancy won a UK Blog Award for Digital and Tech, reflecting the strength of its content and its position at the very heart of the digital industry.
Festival of Marketing
Launched in 2013, the Festival of Marketing is the largest gathering of senior marketing professionals in the UK. In 2015, the Festival delivered a phenomenal 160 hours of content to an audience of discerning practitioners over two days with 12 stages and 257 speakers. Speakers included entrepreneur and celebrity Lord Sugar and astronaut Chris Hadfield alongside marketing and business leaders from brands such as Estee Lauder and BT. The 2015 Festival featured ‘The Masters of Marketing’, an innovative new awards scheme for marketeers and the Festival broke a Guinness World Record for the largest marketing lesson ever given. This event won multiple awards, including ‘Event of the Year’ at the British Media Awards and ‘Best Live Event’ at the Association of Event Organisers Awards.
Design Week
Design Week is the leading B2B title for the UK design industry launched in 1986 and has been exclusively online since 2011. In 2015, Design Week launched a new responsive website. Built using extensive reader consultation, the new website reflects Design Week’s content strategy focusing on readers’ key interests: ‘People’, ‘Projects’, ‘Insight’ and ‘Resources’. The new website has been well-received and, in the first six months following its launch, Design Week acquired 40,000 new registered users. User engagement has also increased (readers now view an average of 3 pages a session compared with 2.7 before), and this has enabled Design Week to adapt its commercial model, resulting in commercial deals with market leaders including IBM and Workfront.
DIVISIONAL REVIEW
Across our four market segments, revenues are weighted towards the Marketing and Professional segments, with the Financial Services and Home Interest segments accounting for approximately 34% of total Group revenues.
MARKETING
This segment includes all of the Group’s brands that serve Marketing and Creative professions, including Econsultancy, Marketing Week, Festival of Marketing, Celebrity Intelligence, Fashion Monitor, Design Week and Creative Review.
Year ended 18 months ended Year ended Reported Underlying 31 December 2015 31 December 2014 31 December 2014 growth growth Audited Audited Unaudited £m £m £m % %
Revenue 27.0 37.6 26.8 1% 4%Adjusted operating profit 4.1 4.0 3.9 5% Adjusted operating margin 15.2% 10.6% 14.6%
Year ended 31 December 2015
Revenues for the reporting period were £27.0m. Adjusted operating profits for the same period were £4.1m, with an adjusted operating profit margin of 15.2%. In the previous statutory reporting period for the 18 month period ended 31 December 2014, reported revenues were £37.6m. Adjusted operating profits for the same period were £4.0m with an adjusted operating profit margin of 10.6%.
Additional Information (year ended 31 December 2014 unaudited)
Revenues and adjusted operating profits for the year ended 31 December 2014 were £26.8m and £3.9m respectively. Reported revenues for the year ended 31 December 2015 grew by 1% compared to the year ended 31 December 2014. Adjusted for the impact of a repositioned Marketing Week Live, which increased profitability across a more targeted, smaller event proposition, underlying revenue growth for the same period was 4%.
Momentum across this segment’s paid-for content revenues remains strong, with digital paid-for content revenues for the year ended 31 December 2015 of £11.0m growing by 22%, and with excellent growth from the Celebrity Intelligence and Fashion Monitor platforms. Live events revenues for the year ended 31 December 2015 of £8.2m were on an underlying basis, 7% lower than in the year ended 31 December 2014, and this reflects disappointing training revenues and the impact of consolidating the Marketing Week Engage Awards into the Festival of Marketing. This awards event will run on a stand-alone basis in 2016. The Festival of Marketing ran in November 2015 and reported revenues of £2.0m, 14% up on the 2014 edition of this event. In aggregate, paid-for content and live events revenues for the year ended 31 December 2015 contributed 73% (year ended 31 December 2014: 72%) to this segment’s revenues.
The increase in digital investment across the Marketing segment, which includes the migration of all branded web sites onto the WordPress platform and investment into the digital paid-for content platforms, supported total digital revenues in the year ended 31 December 2015 of £16.0m, 17% higher than in the year ended 31 December 2014. The increase in digital investment resulted in an increase in the depreciation charge from £1.4m in the year ended 31 December 2014 to £1.9m in the year ended 31 December 2015. Despite the impact of the increase in digital investment, adjusted operating profits increased from £3.9m in the year ended 31 December 2014 to £4.1m in the year ended 31 December 2015, with adjusted operating margins increasing from 14.6% to 15.2%.

20 21
PERFORMANCE REPORT
HIGHLIGHTS - FINANCIAL SERVICES PORTFOLIO
Platforum
2015 was a significant year for Platforum, which offers objective research and trusted insight from industry experts to fund management firms, life companies and platforms, informing their products, propositions and distribution strategy. New research areas for Platforum in 2015 included robo-advice, the influence of discretionary fund management and retirement. These were supported by a new online platform for delivering reports and analyst briefings offering ‘deep dives’ for customers. In 2015, Platforum’s business model evolved from sales of single copy reports to annual subscriptions providing online access to all research areas. Platforum also launched a new direct to consumer conference covering the shifts in the fund distribution landscape, and the Platforum’s annual conference, now in its ninth year, remained a key event in the retail investment distribution calendar. Following the appointment of its new management team, Platforum now has a new team of industry experts in place across the following key research areas: UK and European fund distribution; the advisory market; direct to consumer; and retirement.
Money Marketing
Against a backdrop of the biggest shake-up to UK pensions in a generation and the prospect of yet another overhaul to the financial advice profession, Money Marketing continues to be firmly established as the leading publication for financial advisers. Building upon its well-received magazine redesign in 2014, in 2015 Money Marketing re-launched its website on a fully responsive mobile-friendly platform, earning it ‘Best Financial Trade Website’ at the Santander Media Awards. Money Marketing also won other awards in 2015 including ‘Trade Title of the Year, ’Journalist of the Year’ and ‘Article of the Year’. 2015 was Money Marketing’s 30th anniversary and the celebratory event gathered together luminaries from across the financial services industry including representatives from the FCA, Ernst & Young and Lansons.
FINANCIAL SERVICES
Serving the retail financial services industry, this portfolio includes Money Marketing, Fund Strategy, Mortgage Strategy, Corporate Advisor, Tax Briefs, Headline Money and Platforum. Year ended 18 months ended Year ended Reported Underlying 31 December 2015 31 December 2014 31 December 2014 growth growth Audited Audited Unaudited £m £m £m % %
Revenue 12.0 17.6 12.0 0% 3%Adjusted operating profit 2.1 2.6 2.0 5% Adjusted operating margin 17.5% 14.8% 16.7%
Year ended 31 December 2015
Revenues for the reporting period were £12.0m. Adjusted operating profits for the same period were £2.1m, with an adjusted operating profit margin of 17.5%. In the previous statutory reporting period for the 18 month period ended 31 December 2014, reported revenues were £17.6m. Adjusted operating profits for the same period were £2.6m with an adjusted operating profit margin of 14.8%.
Additional Information (year ended 31 December 2014 unaudited)
Revenues and adjusted operating profits for the year ended 31 December 2014 were £12.0m and £2.0m respectively. Reported revenues for the year ended 31 December 2015 were flat compared to the year ended 31 December 2014. Adjusted for the impact of discontinued events, underlying revenue growth for the same period was 3%, a significant improvement on the 12% decline in revenues reported in the year ended 31 December 2014.
Paid-for content and live events revenues for the year ended 31 December 2015 contributed 51% (year ended 31 December 2014: 57%) to this segment’s revenues. While paid-for content revenues grew modestly, the performance across this segment’s live events revenues was disappointing with reported revenues of £2.4m, £0.7m lower than reported in the year ended 31 December 2014, although live events revenues trends stabilised in the second half of the year. The Financial Services segment continues to have the highest exposure to advertising revenues, which accounted for 49% of 2015 revenues (year ended 31 December 2014: 42%), and which grew by 11%. Digital advertising revenues, which now account for just over half of total advertising revenues, grew by 57%.
Adjusted operating profits for the year ended 31 December 2015 of £2.1m were 5% higher than the £2.0m reported in the year ended 31 December 2014, with adjusted operating margins at 17.5% (year ended 31 December 2014: 16.7%).
The introduction of new commercial and editorial leadership in 2014 is reflected in a stronger underlying performance in 2015. With further initiatives deployed in 2015 to ensure that the commercial, marketing and events teams are more closely aligned with a strategy that is focused on delivering trusted insight and routes to market for the retail financial services industry, the outlook across this portfolio remains encouraging. Initiatives across the live events team are expected to see a return to growth in 2016 revenues, digital advertising revenues continue to grow well, and we see good opportunity to build a higher value paid-for content proposition in the medium-term.

22 23
PERFORMANCE REPORT
Across each of the four subsidiary market portfolios:
The Legal portfolio reported revenues of £7.5m in 2015, a 7% increase compared to 2014. Growth across this portfolio was driven through increases in digital paid-for content and live events revenues, offset by weaker advertising revenues. Lawyer Marketing Intelligence was launched towards the end of 2015.
Underlying revenues across the HR portfolio of £4.5m were 6% lower than in 2014, reflecting, with the exception of Employee Benefits Live, continued weakness across this portfolio’s advertising and live events activities.
The Engineering portfolio reported revenues of £3.6m, up 20% on a reported basis. Adjusting for the impact of the biennial Advanced Manufacturing Show and a discontinued event, underlying revenues grew by 5%. .
The Travel & Meetings portfolio includes The Business Travel Show and The Meetings Show. Revenues across this portfolio of £4.1m were up 6% on an underlying basis reflecting good growth across The Business Travel Show offset by flat revenues for The Meetings Show.
There are encouraging areas for growth within the Professional segment, with the Legal and Travel & Meetings portfolios offering the greatest opportunity to accelerate growth.
HIGHLIGHTS - PROFESSIONAL PORTFOLIO
Lawyer Market Intelligence
In late 2015, The Lawyer launched its new subscription product, The Lawyer Market Intelligence (‘LMI’), coinciding with the relaunch of The Lawyer’s website and print magazine. LMI is a real-time digital intelligence tool that aims to give subscribers valuable insights into the relationships between thousands of legal advisers and their global clients. LMI identifies these relationships at both an organisational and individual level and its data, which builds upon the content and information-gathering expertise of The Lawyer, spans over three years’ worth of corporate deals, disputes and other legal advisory work. LMI is primarily aimed at law firms, who can use it to track competitor activity and identify gaps in client coverage, and in-house legal teams, who can use it to make informed decisions about the legal advisors and partners they instruct. Initial sales in late 2015 to customers including some of the UK’s top 20 law firms demonstrate LMI’s strong potential for growth during 2016.
PROFESSIONAL
The Professional segment includes four subsidiary markets: Legal, Engineering, HR and Travel & Meetings. The Legal portfolio includes the print, digital and live events activities associated with The Lawyer and VB Research. The principal assets within the Engineering portfolio are The Engineer and Subcon, an exhibition that serves the sub-contractor industry. The HR portfolio includes FEM, Employee Benefits and Employee Benefits Live, and Travel & Meetings includes two exhibitions serving the Business Travel and Meetings markets. Year ended 18 months ended Year ended Reported Underlying 31 December 2015 31 December 2014 31 December 2014 growth growth Audited Audited Unaudited £m £m £m % %
Revenue 19.7 34.6 22.9 -14% 1%Adjusted operating profit 2.2 3.2 2.6 -15% Adjusted operating margin 11.2% 9.2% 11.4%
Year ended 31 December 2015
Revenues for the reporting period were £19.7m. Adjusted operating profits for the same period were £2.2m, with an adjusted operating profit margin of 11.2%. In the previous statutory reporting period for the 18 month period ended 31 December 2014, reported revenues were £34.6m. Adjusted operating profits for the same period were £3.2m with an adjusted operating profit margin of 9.2%.
Additional Information (year ended 31 December 2014 unaudited)
Revenues and adjusted operating profits for the year ended 31 December 2014 were £22.9m and £2.6m respectively. Reported revenues for the year ended 31 December 2015 declined by 14% compared to the year ended 31 December 2014. Adjusted for the impact of the disposal of Perfect Information, Aidex and events rationalisation, underlying revenue growth for the same period was 1%.
Paid-for content and live events revenues for the year ended 31 December 2015 contributed 66% to this segment’s revenues (year ended 31 December 2014: 64%).
Adjusted operating profits fell from £2.6m in the year ended 31 December 2014 to £2.2m in the year ended 31 December 2015, with adjusted operating margins of 11.2% (year ended 31 December 2014: 11.4%).

24 25
PERFORMANCE REPORT
HIGHLIGHTS – HOME INTEREST PORTFOLIO
Homebuilding & Renovating
Now in its 25th year, Homebuilding & Renovating enjoyed a record year in 2015 with 14% revenue growth driven by events and digital services. Homebuilding & Renovating has a high-spending consumer audience that shares many of its characteristics with Centaur’s B2B brands. The business comprises a subscriptions-driven monthly magazine, responsive website, data service, seven national exhibitions, specialist books and an annual awards event in association with The Daily Telegraph.
Homebuilding & Renovating Show London
In 2015 the Home Interest team successfully converted the Home Improvement Show into The Homebuilding & Renovating Show London and relocated it from London’s Olympia to the expansive Excel exhibition venue. The exhibition had a 10% increase in exhibitors, 19% increase in high quality visitors and 19% growth in revenue year-on-year. At the centre of the Homebuilding & Renovating Show London was a series of live seminars and one-on-one ‘advice zones’ with our own trusted experts and additional industry leaders including TV’s Charlie Luxton and Gabrielle Blackman. Centaur’s investment and focus on quality at the Show has meant the London event won the prestigious ‘PPA Consumer Exhibition of the Year’ award for 2015.
HOME INTEREST
The Home Interest segment includes the live events and publishing assets focusing on homebuilding and home renovation. These include Homebuilding & Renovating, Real Homes and Period Living: Year ended 18 months ended Year ended Reported Underlying 31 December 2015 31 December 2014 31 December 2014 growth growth Audited Audited Unaudited £m £m £m % %
Revenue 11.8 15.8 11.1 6% 9%Adjusted operating profit 2.1 1.9 1.7 24% Adjusted operating margin 17.8% 12.0% 15.3%
Year ended 31 December 2015
Revenues for the reporting period were £11.8m. Adjusted operating profits for the same period were £2.1m, with an adjusted operating profit margin of 17.8%. In the previous statutory reporting period for the 18 month period ended 31 December 2014, reported revenues were £15.8m. Adjusted operating profits for the same period were £1.9m with an adjusted operating profit margin of 12.0%.
Additional Information (year ended 31 December 2014 unaudited)
Revenues and adjusted operating profits for the year ended 31 December 2014 were £11.1m and £1.7m respectively. Reported revenues for the year ended 31 December 2015 grew by 6% compared to the year ended 31 December 2014. Adjusted for the impact of one discontinued event, underlying revenue growth for the same period was 9%.
Paid-for content and live events revenues for the year ended 31 December 2015 contributed 69% (year ended 31 December 2014: 71%) to this segment’s revenues. Paid-for content revenues, which are predominantly print based copy sales, declined by 10% in the year ended 31 December 2015. Live events revenues, which have been consolidated around the Homebuilding & Renovating brand, and which account for almost half of this segment’s revenues, grew on an underlying basis by 13%. Advertising revenues, which accounted for 31% of this segment’s revenues for the year ended 31 December 2015, grew by 11%.
Adjusted operating profits for the year ended 31 December 2015 of £2.1m were 24% higher than the £1.7m reported in the year ended 31 December 2014, with adjusted operating margins at 17.8% (year ended 31 December 2014: 15.3%). The strong increase in adjusted operating profits reflects the impact of excellent underlying revenue growth across the live events portfolio, strong growth in digital advertising revenues, and tight cost control.
The outlook across this segment is extremely encouraging. The consolidation of the content, commercial, marketing and digital development teams in 2014 has underpinned good growth in 2015, and we have a clear focus on building a high growth, high value professional portfolio. Alongside what we regard as a positive underlying market, we believe we can continue to deliver strong growth this portfolio and higher quality mix of live events and digital revenues.

26 27
PERFORMANCE REPORT
Adjusted operating profit reconciles to (loss) / profit before tax as follows:
18 months Year ended ended 31 December 31 December 2015 2014 Note £m £mAdjusted operating profit 10.5 11.7Finance costs 5 (0.7) (1.6)
Adjusted profit before tax 9.8 10.1Adjusting items Exceptional operating costs (excluding impairment and profit on disposal) 4 (0.8) (6.7) Exceptional impairment of goodwill 9 (11.9) - Exceptional profit on disposal of subsidiary 33 - 14.7 Exceptional profit on disposal of trade and assets 4 0.4 - Amortisation of acquired intangibles 4 (2.2) (3.4) Share-based payments 24 (0.7) (0.5) Exceptional finance costs 4 (0.2) (2.9)
(Loss) / profit before tax (5.6) 11.3
SUMMARY
Commentary on revenues and adjusted operating profits for the reporting period, the previous statutory reporting period for the 18 month period ended 31 December 2014, and the year ended 31 December 2014 are set out within the operating review.
The business has made steady progress against its strategic priorities during 2015, and in this context, the results are encouraging, with adjusted operating profit margins up to 15%. Cash conversion was disappointing throughout 2015, but working capital trends are expected to improve into 2016. Net debt at 31 December 2015 was £17.9m compared to £14.7m at 31 December 2014.
Reflecting a more moderate growth outlook across portfolios reported within the Professional segment, including HR and Engineering, and specifically reflecting weaker print and advertising trends, the Group has recognised a non-cash impairment of £11.9m against goodwill in the Professional segment (2014: £nil).
The Group’s KPI measures are underlying revenue growth, adjusted operating profit margin, adjusted EPS and cash conversion. Aside from 2015 cash conversion, we are making steady progress against each, and further detail is set out in this Financial Review and in the Operating Review.
REVENUES
Revenues for the reporting period were £70.5m (2014: £105.6m). Further information on the divisional revenue performance and the mix of revenues across paid-for content, live events and advertising is included in the Operating Review.
FINANCIAL REVIEW REPORTING PERIOD
This Annual Report covers the statutory reporting period which is the year ended 31 December 2015 (‘the reporting period’). Due to the change in year end from 30 June to 31 December during 2014, resulting in an 18-month reporting period for 2014, we have considered it beneficial to include additional information in respect of the calendar year ended 31 December 2014 (which is unaudited) to enhance comparison with the 2015 reporting period. References to underlying or reported growth refer to comparative 12 month periods throughout.
ADJUSTED AND STATUTORY RESULTS
In these results we refer to adjusted and statutory results. Adjusted results are prepared to provide a more comparable indication of the Group’s underlying business performance. Adjusted results exclude adjusting items as set out in the Consolidated Income Statement and below.
The Group’s activities are predominantly UK based and therefore currency movements have negligible impact on the Group’s adjusted or statutory results.
The business has made steady progress against its strategic priorities during 2015, and in this context, the results are encouraging, with adjusted operating profit margins up to 15%.

28 29
PERFORMANCE REPORT
TAXATION
A tax charge of £1.3m (2014: £0.8m) has been recognised for the reporting period. The adjusted tax charge was £1.9m (2014: £2.1m) giving an effective tax rate (compared to adjusted profit before tax) of 19% (2014: 21%). The fall in tax rate is due to the Finance Act 2013 which included legislation to reduce the main rate of corporation tax from 21% to 20% from 1 April 2015, which meant that the Company’s profits were taxed in the UK at a blended rate of 20.25% (2014: 22.00%). Furthermore, as the Finance Act 2013 had been substantively enacted at the balance sheet date, the Group’s deferred tax balances arising the UK are recorded at 20%.
EARNINGS PER SHARE
The Group has reported adjusted fully diluted earnings per share for the reporting period of 5.3p (2014: 5.5p). Fully diluted earnings per share for the reporting period were (4.8)p (2014: 7.2p). Full details of the earnings per share calculations can be found in note 8 to the Financial Statements.
DIVIDEND
An interim dividend of 1.5p per share was paid in respect of the period January to June 2015 (January to June 2014: 1.7p). A final dividend in respect of the period July to December 2015 of 1.5p per share (July to December 2014: 1.3p) is proposed by the Directors, giving a total dividend for the year ended 31 December 2015 of 3.0p (2014: 3.85p), a decrease of 22%.
The final dividend in respect of the reporting period is subject to shareholder approval at the annual general meeting and will be paid on 27 May 2016 to all ordinary shareholders on the register at close of business on 6 May 2016.
The Group has adopted a progressive dividend strategy. Adjusted dividend cover in the reporting period was 1.8 times and it is intended to move above 2 times in the medium term.
OPERATING PROFIT
Adjusted operating profits for the reporting period were £10.5m (2014: £11.7m), with an adjusted operating profit margin of 14.9% (2014: 11.1%). Further information on the divisional adjusted operating profit performance is included in the Operating Review.
Net adjusted operating expenses were £60.0m (2014: £93.9m). Employee related expenses in the reporting period were £30.2m (2014: £40.5m), with the average number of permanent employees during the reporting period of 564 (2014: 584).
Reported operating losses for the reporting period of £4.7m (2014: profits of £1.1m) include an impairment charge against goodwill of £11.9m (2014: £nil), a £2.2m charge for amortisation of intangible assets (2014: £3.4m), exceptional costs of £0.8m (2014: £6.7m), share-based payment costs of £0.7m (2014: £0.5m) and a gain on disposal of the trade and assets of Aidex of £0.4m (2014: £nil).
ADJUSTING ITEMS
Adjusting items in the reporting period generated a loss before tax of £15.4m (2014: profit before tax of £1.2m), which includes an exceptional impairment charge of £11.9m (2014: £nil), relating to the write down of goodwill in the Professional segment.
Exceptional restructuring costs in the reporting period of £0.6m (2014: £1.2m) include redundancy costs of £0.6m (2014: £0.9m) which principally relate to changes in senior management. Other exceptional items include IFRS 3 earn-out charges of £0.1m (2014: £5.0m) and a gain on the disposal of the trade and assets of Aidex of £0.4m (2014: £nil). Other exceptional items during 2014 included a profit on the disposal of Perfect Information of £14.7m, charges of £0.5m relating to property consolidation, acquisition related costs and other exceptional items. A charge was recognised during 2014 relating to the unwinding of the remaining discount on the Econsultancy.com Limited deferred contingent consideration provision of £2.9m.
Other adjusting items include amortisation of acquired intangibles of £2.2m (2014: £3.4m) and share-based payments of £0.7m (2014: £0.5m).
Further analysis on these costs is included in the Basis of Preparation section of notes 1 and 4 to the Financial Statements.
NET FINANCE COSTS
Adjusted net finance costs for the reporting period were £0.7m (2014: £1.6m). Net finance costs for the reporting period were £0.9m (2014: £4.5m), which includes unamortised facility costs (£0.1m) and legal fees (£0.1m) associated with the re-financing of the Group’s revolving credit facility. During 2014 a charge of £2.9m was recognised in relation to the unwinding of the remaining discount on the Econsultancy.com Limited deferred contingent consideration provision of £2.9m, which was accelerated as part of its early settlement in June 2014.

30 31
PERFORMANCE REPORT
FINANCING AND BANK COVENANTS
On 8 June 2015, the Group agreed a four year £25.0m multi-currency revolving credit facility, provided by RBS and Lloyds. This facility runs to 31 August 2019. The principal financial covenants under the facility are: the ratio of net debt to adjusted EBITDA shall not exceed 2.5:1, and the ratio of EBITDA to net finance charges shall not be less than 4:1. All covenants under the facility at 31 December 2015 and throughout the reporting period have been met.
BALANCE SHEET
A summary of the Group’s balance sheet as at 31 December 2015 and 2014 is set out below.
18 months ended Year ended 31 December 31 December 2015 2014 Audited Audited £m £m Goodwill and other intangible assets 96.4 109.9Property, plant and equipment 2.3 2.5Deferred consideration on acquisitions - (1.1)Deferred income (17.0) (15.3)Other current assets and liabilities 12.7 6.4Deferred taxation (0.1) (0.9)
Net assets before net debt 94.3 101.5Net debt (17.9) (14.7)
Net assets 76.4 86.8
Reflecting a more moderate growth outlook across portfolios reported within the Professional segment, including HR and Engineering, and specifically reflecting weaker print and advertising trends, the Group has recognised a non-cash impairment of £11.9m against goodwill in the Professional segment (2014: £nil).
ADDITIONAL INFORMATION (UNAUDITED)
Due to the change in the year end from 30 June to 31 December during 2014, resulting in an 18 month reporting period for 2014, we have considered it beneficial to include additional information in respect of the calendar year ended 31 December 2014 (which is unaudited) to enhance comparison with the 2015 reporting period. References to underlying or reported growth refer to comparative 12 month periods throughout. Further commentary is set out below.
Revenue and Adjusted Operating Profit
Revenues and adjusted operating profits in 2015 were £70.5m (2014: £72.8m) and £10.5m (2014: £10.2m). Lower reported revenues during 2015 reflect the disposal of Perfect Information during in June 2014. Underlying trends, adjusting for the sale of Perfect Information, Aidex and event rationalisation, show growth of 4% and 14% in revenue and adjusted operating profit respectively.
CASH FLOW
A summary of the Group’s cash flow in the reporting period, in the 18 month period to 31 December 2014 and in the year ended 31 December 2014 is set out below. The Group generated free cash flow in the reporting period of £0.5m (2014: £6.7m). This reflects disappointing working capital trends during 2015, which are expected to partially reverse into 2016, and the Directors remain confident that the Group’s business model will return to being highly cash generative in the future. Movements in working capital in 2014 also benefited from a rent free period on the Group’s London office space until November 2014 (increased cash outflow in 2015 of £1.3m). Cash conversion, measuring the ratio of operating cash flow to adjusted operating profits, was 31% in the reporting period (2014: 110%).
18 months ended Year ended Year ended 31 December 31 December 31 December 2015 2014 2014 Audited Audited Unaudited £m £m £m
Adjusted cash flow Adjusted operating profit 10.5 11.7 10.2Depreciation and amortisation 3.0 4.5 3.2Movement in working capital (6.9) 3.2 2.6Capital expenditure (3.3) (6.5) (3.5)
Operating cash flow Adjusted operating cash flow 3.3 12.9 12.5Cash impact of exceptional items (0.5) (1.9) (0.9)Taxation (1.4) (2.5) (1.2)Interest and finance leases (0.9) (1.8) (1.2)
Free cash flow Free cash flow 0.5 6.7 9.2Acquisitions (0.1) (19.6) (16.8)Disposals 0.4 23.5 23.5Dividends (4.0) (5.8) (3.6)
Net cash flow (3.2) 4.8 12.3Opening net debt (14.7) (19.5) (27.0)
Closing net debt (17.9) (14.7) (14.7)
The cash impact of exceptional items primarily related to redundancy costs during 2015, and included costs relating to an onerous lease in 2014.
Acquisitions net of disposals generated a cash inflow of £0.3m in the reporting period (2014: cash inflow of £3.9m).
NET DEBT
Net debt at 31 December 2015 was £17.9m, £3.2m higher than the £14.7m reported as at 31 December 2014.

32 33
PERFORMANCE REPORT
CONCLUSION
2015 has been a challenging year. While revenue trends have been weaker than anticipated, the Group has worked hard to manage its cost base, with adjusted operating margins increasing to 15%. With a more moderate growth outlook across the Professional segment, the Group has recognised a non-cash impairment of £11.9m against goodwill.
The deployment of new finance and CRM systems during 2015 provides a strong platform to support revenue and margin growth in the medium term. However, the operational and commercial disruption associated with the deployment of these technology platforms has had a material impact on the collection of trade receivables during the year, and the increase in net debt to £17.9m at 31 December 2015 reflects the disappointing cash conversion throughout 2015. I am pleased to see trends in cash collections improve since November 2015, and the Group’s business model, with a high proportion of live events and subscription revenues, should remain cash generative.
I am encouraged by the continuing shift in favour of digital paid-for content and events, and the opportunity in the medium term to translate growing revenues to progressively improving adjusted operating margins.
Mark KerswellGroup Finance Director16 March 2016
Adjusting Items
Adjusting items before tax in 2015 totalled an expense of £3.5m (2014: credit of £5.0m). In 2014, a non-core business, Perfect Information, was disposed of generating a profit of £14.7m, which was offset by deferred contingent consideration costs of £5.0m relating to Econsultancy.com Limited.
Net Finance Costs
Adjusted finance costs for 2015 were £0.6m (2014: £1.0m). The reduction in finance costs reflects lower net debt during 2015 compared to 2014 following the sale of Perfect Information in June 2014, as well as more favourable interest rates following the Group’s refinancing in June 2015. Net finance costs for 2015 of £0.8m (2014: £3.5m) include unamortised facility costs (£0.1m) and legal fees (£0.1m) associated with the re-financing of the Group’s revolving credit facility, and in 2014 included a charge of £2.5m for unwinding the remaining discount on the Econsultancy.com Limited deferred contingent consideration provision which was accelerated as part of its early settlement in June 2014.
Share-Based Payments
Share-based payments in 2015 increased to £0.7m (2014: £0.4m), reflecting increased participation in the award schemes among senior management.
Tax
A tax charge of £1.3m has been recognised in 2015 (2014: £1.0m). The adjusted tax charge was £1.9m (2014: £1.9m) giving an effective tax rate (compared to adjusted profit before tax) of 19% (2014: 21%).
Adjusted Earnings Per Share
Fully diluted adjusted earnings per share in the year ended 31 December 2015 were 5.3p (2014: 5.0p), an increase of 6%.
Cash Flow
The Group generated free cash flows in 2015 of £0.5m (2014: £9.2m). This reflects disappointing working capital trends during 2015, which are expected to reverse into 2016, and the Directors remain confident that the Group’s business model will return to being highly cash generative in the future. Movements in working capital in 2014 benefited from a rent free period on the Group’s London office space until November 2014. Cash conversion, measuring the ratio of operating cash flow to adjusted operating profits, was 31% in the reporting period (2014: 123%).
Dividend
An interim dividend of 1.5p per share was paid in respect of the period January to June 2015 (January to June 2014: 1.7p). A final dividend in respect of the period July to December 2015 of 1.5p per share (July to December 2014: 1.3p) is proposed by the Directors, giving a total dividend for 2015 of 3.0p (2014: 3.0p).
Adjusted dividend cover in 2015 was 1.8 times (2014: 1.7 times).

34 35
PERFORMANCE REPORT
CORPORATE RESPONSIBILITY Centaur Media is committed to developing a culture of environmental awareness and social responsibility and we seek where appropriate to incorporate environmentally and socially responsible practices into the way we deliver services and products and procure goods and services from third parties.
ENVIRONMENT
Operating in the media sector, our impact on the environment is less significant than that of companies operating in many other sectors. As our products are increasingly delivered digitally the use of consumable items such as paper and plastic is reducing over time. The move of all our London-based employees to a single location in Wells Street has meant that the Group has been able to take advantage of consolidating building-related environmental impacts and benefitting from Group sharing of items such as photocopiers. Centaur Media actively seeks to minimise adverse environmental impacts and to promote good environmental practices wherever possible. We do not have a company car policy or provide parking at our London office, but parking for bicycles is provided. Some of our other initiatives have included:
adopting a policy of turning off equipment at the end of the day rather than leaving it on standby;
use of energy-efficient lighting, including a programme of replacing existing light fittings with energy efficient LED light fittings in the Wells Street building;
installation of motion sensors in offices to control lighting;
analysing and adjusting the timing of boilers and chillers for the office air conditioning to increase energy efficiency;
buying paper that is Forest Stewardship Council (FSC) accredited which means that the paper has been sourced in an environmentally-friendly, socially responsible and economically viable manner;
active engagement in the recycling of cans, tins, plastic, glass, cardboard and paper, including the replacement of traditional waste bins with recycling bins throughout the Wells Street building as part of a new centralised recycling system rolled out in 2015, together with a monthly report showing the percentage of waste collected that was recycled;
recycling of printer cartridges where possible;
increasing the use of aqueous inks, which limit the release of volatile organic compounds;
increasingly validating the environmental credentials of suppliers (ISO14001);
use of eco-friendly taxis and courier vehicles that are less than 3 years old;
use of cyclist couriers where possible;
a cycle to work scheme; and
encouraging staff to use public transport by provision of season ticket loans.
CHARITABLE DONATIONS
The Group supports local communities and charitable organisations through direct fundraising, donation and pro-bono work. During the reporting period, a total of £111,242 (comprising employee contributions of £11,512, a Group contribution of £10,000 and £89,730 in third party contributions raised through out events) was donated to Mind, a UK-wide mental health charity and our chosen charity partner for 2015. We used
our events to raise money from third parties for Mind including requesting donations in return for entry for awards and taking collections at the events. Every year, the Group offers each employee a paid day off to spend volunteering for the non-for-profit cause or charity of their choice. We also operate a Give As You Earn scheme through the payroll. In 2015, contributions amounting to £6,723 (consisting of employee contributions of £6,198 plus a matching contribution of £525 from the Group) were made through this.
The Group is in the FTSE4Good Index, an independent body which measures the performance of all FTSE companies against a number of stringent social and environmental criteria.
HEALTH AND SAFETY
We are committed to the safety of our staff. Due to the nature of the business, risk of work-based accidents is relatively low but the Group takes its responsibilities for the health and safety of its employees seriously. Our office manager is responsible for maintaining a safe environment for employees and an Accident Book is available to all staff in Reception. Where work-related activities take place which have a higher risk attached – such as travel, marketing events and outdoor activities – additional planning is undertaken which includes a risk assessment and mitigation plan.
EMISSIONS
We continue to measure our carbon footprint by monitoring our Energy Usage and we are pleased to confirm that we are compliant with the new EU Energy Efficiency Directive ‘Energy Saving Opportunity Scheme’ (ESOS).
The greenhouse gas ‘GHG’ emission from our operations in the reporting period are set out below:
Year ended 31 December 2015 global GHG emissions data (tonnes of CO2e)
Emissions from: Tonnes CO2
Scope 1 (Gas, Fuel and Car Mileage) 157.04Scope 2 (Electricity and Steam) 580.90
Total GHG emissions: 737.94Average number of employees 564Emissions per employee 1.31
DIVERSITY
Centaur Media is committed to recruiting and promoting the most talented people from the widest pool and providing equal opportunities for all employees and prospective employees. To support this aim, the Group has an Equal Opportunities policy which covers recruitment and selection, promotion, training and development and standard contract terms for all staff. We also support apprenticeships which increase our talent pool and demonstrates the Company’s commitment to reaching out to young people from a variety of backgrounds. We also offer internships, and work experience opportunities for people from a variety of backgrounds.
Two out of our six (33%) Board members are female and, as at 31 December 2015, our workforce overall was 60% female and 40% male.
Approved by the Board of Directors and signed by order of the Board.
Grainne BrankinCompany Secretary16 March 2016

GOVERNANCE
36 37
BOARD OF DIRECTORS1 Ronald Sandler Chairman
Ron joined Centaur as Chairman in May 2015. He is also currently Chairman of Towry and is a member of the advisory board of Palamon Capital Partners. His early career was with the Boston Consulting Group. He was Chief Executive Officer of Lloyd’s of London from 1995 until 1999, playing a key role in Lloyd’s Reconstruction and Renewal, and subsequently Chief Operating Officer of NatWest Group. Ron is a past-president of the Chartered Institute of Bankers and in 2002 he led an independent review of the UK Long Term Savings Industry. He has been chairman of numerous companies, including Northern Rock, Phoenix Group and Paternoster.
2 Christopher Satterthwaite Senior Non-Executive Director
Chris began his commercial career as a graduate trainee at H.J Heinz. Since then, he has been part of three different kinds of marketing communication agencies: IMP (1981-1993) - then the UK’s largest Sales Promotion and Direct Marketing agency; HHCL & Partners (1993-2000) - Campaign’s Advertising Agency of the Decade; Bell Pottinger (2000-2002) - the UK’s leading Public Relations agency. He became Chief Executive of Chime Communications Plc in 2003. He is Chairman of The Roundhouse and a member of the Government’s Professional and Business Services Council. He is a former Chairman of the Marketing Society.
3 Robert Boyle Non-Executive Director
Robert, a qualified Chartered Accountant, was a partner of PricewaterhouseCoopers LLP, where he was Chairman of the PwC European Entertainment and Media Practice for twelve years, retiring in 2006. He is a Non-Executive Director, and Chairman of the Audit Committee, of Maxis Berhad (in Malaysia) and Witan Investment Trust Plc.
4 Rebecca Miskin Non-Executive Director
Rebecca is Founder and CEO of Gloo Networks Plc, a digital transformation company. She began her career in media at Reed Elsevier launching telecom-based information services across Europe. She has since worked across the USA and UK at Time Inc., NBC Universal and most recently at Hearst Corporation. Rebecca helps re-align media organisations through a data driven, customer-centric and collaborative operational approach.
5 Andria Vidler Chief Executive Officer
Andria joined Centaur Media as Chief Executive in November 2013. From August 2009 to July 2013, Andria was Chief Executive Officer of EMI Music UK & Ireland during which time she successfully transformed the business into a high margin global rights management enterprise by driving consumer focus and digital innovation. Between April 2008 and August 2009, she was Chief Marketing Officer of Bauer Media. As part of the UK management team she was responsible for building the Bauer Media brands to generate greater profitability across the portfolio of 53 magazines, 23 radio stations and all online products. Andria was Managing Director of Magic FM & National Radio from June 2005 to April 2008. Prior to that, she held a number of managerial, operational and marketing roles at Capital Radio and the BBC.
6 Mark Kerswell Group Finance Director
Mark joined Centaur Media in 2011 as Group Finance Director. Mark has held international financial and operational roles in a range of business information, publishing, conferences and exhibitions groups. From 2005 he worked initially as Deputy Finance Director and subsequently as Chief Operating Officer at Informa Plc, with responsibilities including corporate finance, investor relations, strategy and business integration. From 1996 to 2005 he worked at IIR, an international conferences and exhibitions business, and was appointed Group Finance Director in 2000. Between May and October 2013 Mark served as Centaur Media’s interim Chief Executive. Mark is a qualified Chartered Accountant.
2
3
41
5
6

GOVERNANCE
38 39
EXECUTIVE COMMITTEEIn addition to the Chief Executive and Group Finance Director, the Executive Committee (formerly known as the Operating Board) comprises the Chief Operating Officer, three Divisional Managing Directors, Group HR Director and Company Secretary (formally known as the Operating Board. The biographies of the Executive Committee are set out below:
1 Linda Smith Chief Operating Officer
Linda was appointed Chief Operating Officer in February 2016 and manages Centaur’s centralised expert hubs of digital product development, IQ (marketing and research) and production as well as IT and client delivery operations. Linda has worked at a number of media companies including ITV, StarcomMediaVest, Capital Radio, RadioCentre and most recently Bauer Media. She was a commercial consultant to Centaur Media in 2014. Through her previous roles Linda has developed operational experience in a number of different areas including M&A, sales and general management and across a broad spectrum of broadcasting, publishing and digital platforms.
2 Andrew Evans Divisional Managing Director
Andrew has 28 years’ exhibition and event experience working in trade and consumer fields. During this time, he has been responsible for the development of some of the UK’s largest trade fairs as well as numerous event launches into new markets. Andrew has worked across both UK and international platforms, having developed his career through Montgomery Exhibitions, Brintex, Reed Exhibitions, Fresh RM and Brand Events. Andrew Joined Centaur Media in September 2011 from Brand Events where as Chief Operating Officer he helped to build a global business in eight countries with leading brands such as Taste Festivals and Top Gear Live. He was appointed Divisional Managing Director of Centaur Live in February 2014.
3 Steve Newbold Divisional Managing Director
Steve was appointed Divisional Managing Director in September 2015, overseeing the Home Interest, Legal, Engineering, Financial, Business Travel and Recruitment markets.
Prior to joining Centaur Media Steve held Managing Director roles at WGSN, i2i Events, Emap Communications (now Ascential) and Emap Plc. He has experience of running multi-media businesses in key sectors including homes, legal, retail, and fashion. He has also led and supported key acquisitions including WGSN, Stylesight, Futuros Events, Broadcast Video Expo and Pure London.
4 Jane Turner Divisional Managing Director
Jane’s early career began with publishers Maclean Hunter, Thomas Telford and Argus Press Group, moving on to Mintel International and Claritas Nielsen and helping drive both companies into the age of digital distribution. Following this foundation, her time with agency groups Havas and WPP focused on delivering insight, sales, marketing and digital solutions for major enterprise clients. In 2005 Jane joined Chorion PLC, as Managing Director. Latterly, she has run her own digital applications business whilst also supporting a range of classic digital creative agencies, digital content and SaaS technology businesses in growing new audiences and developing new channels. Jane joined Centaur as Divisional Managing Director with responsibility for the Marketing Portfolio in March 2016.
5 Kathleen Jones Group HR Director
Kathleen was appointed as Group HR Director in November 2012. Her early career in branch banking with TSB led to Kathleen specialising in training and development and in turn management development. She then went on to undertake various Head of HR roles for multiple businesses and functions with Lloyds TSB. Kathleen broadened her HR and commercial experience through a number of senior positions including Head of HR for the Multinational division and Global Placement practice within Marsh, a global insurance broker. She subsequently undertook organisational change consultancy work in DEFRA before returning to financial services in 2010, ultimately as the Senior HR business partner for the Retail Consumer Distribution division of RBS and NatWest.
6 Grainne Brankin General Counsel and Company Secretary
Grainne has been with Centaur Media since July 2014 and is General Counsel as well as Company Secretary. Prior to joining Centaur Media, Grainne was General Counsel at CBS Outdoor International where she was part of the management team delivering a successful sale of the division by CBS Corp. to Platinum Equity. Grainne had previously worked for 8 years at Yahoo!’s EMEA HQ in London and then Switzerland for 8 years and held various roles in the legal team including responsibility for M&A, restructures and employment. Grainne qualified at Clifford Chance in London and worked at law firm Bird & Bird before joining Yahoo!. She has undertaken a broad range of corporate and commercial work in Europe and the USA within media, telecoms and technology industries.
2
41
3
5
6

40 41
GOVERNANCE
At 16 March 2016 6,472,990 (31 December 2014: 6,535,973) 10p ordinary shares are held in treasury, representing 4.31% (2014: 4.35%) of the issued share capital of the Company as at 31 December 2015. 800,000 (2014: 800,000) deferred shares of 10p each carry restricted voting rights and carry no right to receive a dividend payment. The movement in treasury shares during the period is due to the exercise of share options.
DIRECTORS AND DIRECTORS’ INTERESTS
The Directors of the Company during the period and up to the date of this report are detailed below. All Directors served from 1 January 2015 unless otherwise stated. The Board have decided to continue observing best practice by offering themselves for re-election annually.
Number of Number of ordinary ordinary shares Shares Shares shares held at acquired disposed of held at 1 July during during 31 December 2015 the year the year 20157
Ronald Sandler (appointed 13 May 2015)8 - - - -Patrick Taylor (resigned 13 May 2015) 800,000 36,000 - 836,000Christopher Satterthwaite 95,942 - - 95,942Robert Boyle 80,000 37,037 - 117,037Rebecca Miskin - 14,800 - 14,800Andria Vidler 91,849 46,725 - 138,574Mark Kerswell 333,108 - - 333,108
The Directors’ interests in long-term incentive plans are disclosed in the Remuneration Committee Report on page 72.
QUALIFYING THIRD PARTY INDEMNITY PROVISIONS
By virtue of article 217 of the Articles of Association of the Company, a qualifying third party indemnity provision (within the meaning given by section 234 of the Companies Act 2006) is in force at the date of this report in respect of each Director of the Company and was in force throughout the reporting period.
The Company has purchased appropriate insurance in respect of legal actions against Directors and officers.
PAYMENT OF CREDITORS
It is the Group’s policy to agree credit arrangements with suppliers as part of the general terms of supply. Payment is then made in accordance with these terms provided the goods and services have been delivered in accordance with the agreed terms and conditions. The number and diversity of supply relationships means that the Group pursues no formal code or policy beyond this. Trade creditors of the Group at 31 December 2015 were equivalent to 33 days’ purchases (2014: 6 days). The Company had no trade payables at 31 December 2015 or 31 December 2014.
7 Or date of resignation if earlier.
8 R Sandler has been authorised at his request to purchase ordinary shares following the announcement of the Company’s preliminary results on 17 March 2016.
DIRECTORS’ REPORT The Directors of Centaur Media Plc (‘the Company’ or ‘the Group’), a company incorporated and domiciled in the England and Wales, present their report on the affairs of the Group and Company together with the audited consolidated financial statements for the year ended 31 December 2015 (‘the reporting period’).
Details of significant events since the balance sheet date are contained in note 32 to the Financial Statements.
PRINCIPAL ACTIVITIES
The principal activities of the Group are the provision of business information, events and marketing solutions to selected professional and commercial markets. The principal activities of the Company are those of a holding company.
BUSINESS REVIEW
The Chief Executive’s Review is set out on pages 7 to 9. The Strategic Report on pages 10 to 35 sets out a summary of the Group strategic objectives, business model, key performance measures, operating and financial reviews, future developments, principal risks and uncertainties and the corporate responsibility statement.
GREENHOUSE GAS EMISSIONS
Details of the Groups’ greenhouse gas emissions are included in the Corporate Responsibility section on page 35.
RESEARCH AND DEVELOPMENT ACTIVITIES
The Group invests in systems and website development activities. Further details are set out in note 10 to the Financial Statements.
DIVIDENDS
A final dividend in respect of the period July to December 2015 of 1.5p per share (July to December 2014: 1.3p) is proposed by the Directors, and subject to shareholder approval at the Annual General Meeting, will be paid on 27 May 2016 to ordinary shareholders on the register at the close of business on 6 May 2016. With the interim dividend of 1.5p per share, the total dividend for the reporting period will be 3.0p per share (18 months ended 31 December 2014: 3.85p).
SHARE CAPITAL AND SUBSTANTIAL SHAREHOLDINGS
Details of the share capital of the Company are set out in note 23 to the Financial Statements. As at 31 December 2015, notifications of interests at or above 3% in the issued voting share capital of the Company had been received from the following:
31 December 30 June 2015 2014
Aberforth Partners LLP† 23.91% 23.99%Artemis Investment Management 15.22% 13.88%Standard Life Investments 8.27% 5.32%Ibis Capital Partners 7.58% 6.39%Old Mutual Global Investors 6.54% 7.80%Graham Sherren (inc. spouse) 5.76% 5.76%Chelverton Asset Management 4.62% 3.93%River & Mercantile Asset Management LLP 3.52% 4.30%Legal & General Investment Management 3.00% 2.64%Individuals 1.58% 2.06%†This includes the Wellcome Trust Limited which is managed by Aberforth Partners LLP
During the period between 31 December 2015 and 16 March 2016 the Company did not receive any notifications under Chapter 5 of the Disclosure and Transparency Rules.

42 43
GOVERNANCE
FINANCIAL INSTRUMENTS
A statement in relation to the use of financial instruments by the Group is presented in note 17 to the Financial Statements.
INFORMATION REQUIRED UNDER THE LISTING RULES
In accordance with the UK Financial Conduct Authority’s Listing Rules (LR 9.8.4C), the information to be included in the Annual Report and Financial Statements, where applicable, under LR 9.8.4, is set out in this Directors’ Report, with the exception of details of transactions with controlling shareholders which is set out on page 71.
GOING CONCERN
The Directors have carefully assessed the Company’s ability to continue trading and have a reasonable expectation that the Company has adequate resources to continue in operational existence for at least 12 months from the date of this report. See note 1 of the financial statements for further details.
DISCLOSURE OF INFORMATION TO THE AUDITORS
The Directors confirm that, so far as the Directors are aware, there is no relevant audit information of which the Company’s auditors are unaware, and the Directors have taken all the steps that they ought to have taken as Directors in order to make themselves aware of any relevant audit information and to establish that the Company’s auditors are aware of that information.
This confirmation is given and should be interpreted in accordance with the provisions of s418 of the Companies Act 2006.
Approved by the Board of Directors and signed by order of the Board.
Grainne BrankinCompany Secretary16 March 2016
CHARITABLE AND POLITICAL DONATIONS
During the reporting period the Group made a donation to its nominated charity Mind of £111,242 (18 months ended 31 December 2014: £nil).
No political donations were made during the year (2014: £nil).
EMPLOYMENT POLICY
The Group is an equal opportunities employer and appoints employees without reference to age, sex, ethnic group or religious beliefs.
It is the Group’s policy to give full consideration to suitable applications for employment by disabled persons. Opportunities also exist for employees of the Group who become disabled to continue in their employment or to be trained for other positions in the Group.
The Group actively encourages employee involvement at all levels, both through monthly employee briefings and by direct access to managers and the Executive Committee. In addition, the Share Incentive Plan as described in note 24 encourages employees’ participation in the Group’s performance.
All employees are regularly briefed on the financial and economic factors affecting the Group’s performance and new initiatives through monthly town hall meetings and management cascade communication.
SIGNIFICANT AGREEMENTS
The Group’s bank facility agreement, referred to in note 27 to the Financial Statements, is a significant agreement that is terminable on a change of control of the Company. In addition awards under certain of the long-term incentive plans, details of which are set out in note 24, will vest or may be exchanged for awards of a purchaser’s shares upon a change of control of the Company.
CONFLICTS OF INTEREST
Following the implementation of legislation on conflict of interest, reflected in the changes to the Company’s Articles of Association in 2008, procedures are in place to deal with such conflicts and they have operated effectively.

44 45
GOVERNANCE
BOARD MEETINGS
During the reporting period, the membership of the Board and of each Committee was as follows:
Board Role Audit Remuneration Nomination Committee Committee Committee
Patrick Taylor (resigned 13 May 2015) Chairman Member - Chairman
Ronald Sandler (appointed 13 May 2015) Chairman Member Member Chairman
Christopher Satterthwaite Senior Independent Director - Member Member
Robert Boyle Non-Executive Director Chairman Member -
Rebecca Miskin Non-Executive Director Member Chairman Member
Andria Vidler9 Chief Executive - - -
Mark Kerswell Group Finance Director - - -
The number of scheduled full Board meetings and Committee meetings during the reporting period along with attendance of Directors was as follows:
Audit Remuneration Nomination Board Committee Committee Committee
Number of meetings held: 6 4 2 2
Meetings Meetings Meetings Meetings Meetings Meetings Meetings Meetings attended eligible to attended eligible to attended eligible to attended eligible to attend attend attend attend
Patrick Taylor 3 3 1 2 - - 1 1 (resigned 13 May 2015)
Ronald Sandler 3 3 2 2 2 2 1 1 (appointed 13 May 2015)
Christopher Satterthwaite 6 6 - - 2 2 2 2
Robert Boyle 6 6 4 4 2 2 - -
Rebecca Miskin 6 6 4 4 2 2 2 2
Andria Vidler 6 6 - - - - - -
Mark Kerswell 6 6 - - - - - -
9 Andria Vidler’s married surname is Gibb and she appears as Andria Gibb on records kept by Companies House.
DIRECTORS’ STATEMENT ON CORPORATE GOVERNANCEThe Board is committed to high standards of corporate governance and supports the UK Corporate Governance Code (September 2012). The Board sets out its report below on how the Group has applied the principles of, and complied with, the UK Corporate Governance Code during the reporting period.
COMPLIANCE STATEMENT
The Company has applied the provisions set out in the UK Corporate Governance Code throughout the reporting period. The Board is committed to maintaining a structure, which establishes a sound corporate governance framework on behalf of the Company’s shareholders. Throughout the reporting period, the Group has complied with all the provisions of the UK Corporate Governance Code.
THE BOARD
As at 31 December 2015 the Board had four Non-Executive Directors and two Executive Directors (Chief Executive and Group Finance Director). Biographies for each currently serving Director are shown on page 36. The Board endeavours to maintain diversity in its composition with respect to gender, skills, knowledge and length of service in order to ensure the balanced and effective running of the Company. During the first part of the reporting period (from January 2015 to 13 May 2015) the Chairman of the Board was Patrick Taylor, an independent Non-Executive Director. From 13 May 2015, Ron Sandler was appointed Chairman of the Board, replacing Patrick Taylor. Ron Sandler is an independent Non-Executive Director, who leads the Board and ensures that both Executive and Non-Executive Directors make available sufficient time to carry out their duties in an appropriate manner, that all Directors receive sufficient financial and operational information and that there is proper debate at Board meetings.
The Board is responsible for the leadership of the Company and the Group, and in discharging that responsibility it makes decisions objectively and in the best interests of the Group. The Board sets the vision, values and standards for the Group. The balance of the Board, together with the advice sought from the Executive Committee members and the Company’s external advisors, ensures that no one individual has unfettered powers of decision. The Board delegates day-to-day responsibility for the running of the Company to the Chief Executive.
The Chairman is responsible for the effective performance of the Board through a schedule of matters reserved for approval by the Board (comprising issues considered most significant to the group in terms of financial impact and risk) and control of the Board agenda. The Chairman conducts Board and shareholder meetings and ensures that all directors are properly briefed. The Chief Executive, supported by the Group Finance Director and Executive Committee, is responsible to the Board for running the business and implementing strategy. The Board reviews the performance of the Executive Directors and the Group against agreed budgets and against the Group’s objectives, strategy and values.
The Senior Independent Director is Christopher Satterthwaite who is also a member of the Remuneration and Nomination Committees. The Company Secretary is Grainne Brankin, who is also General Counsel. The Company Secretary assists the Chairman in ensuring there is efficient communication between all Directors, the Committees and senior management, as well as the professional development of Directors. Independent advisors including lawyers, remuneration specialists and external auditors are available to advise the Non-Executive Directors at the Company’s expense. All the Non-Executive Directors are independent. Committee meetings are held independently of Board meetings and invitations to attend are extended by the Committee Chairman to other directors, the Group’s advisors and management as appropriate. The terms of reference of the Audit Committee, the Nomination Committee and the Remuneration Committee, including their roles and the authority delegated to them by the Board, are available on request from the Company Secretary and will be available at the AGM.

46 47
GOVERNANCE
The biographies of the members of the Executive Committee are set out on page 38. Supporting the Executive Committee are the Portfolio Directors who are responsible for specific market segments and the expert leaders who lead the teams delivering functional expertise. The focus on our markets and audience enables us to build a deeper understanding of the commercial opportunities across each market. We know that our customers want flexible content that works seamlessly across multiple platforms. By leveraging this market insight and an understanding of our customer requirements we are able to offer a higher value customer proposition. The expert teams provide the expertise and scale that allows us to effectively and efficiently support the delivery of commercial opportunities across each market. The creation of these expert teams also enables us to effectively manage our cost base and to prioritise investment across the business.
RELATIONS WITH SHAREHOLDERS
The Company encourages meaningful dialogue with all shareholders. Shareholder communication centres primarily on the publication of annual reports, periodic press releases, investor presentations and trading updates. The Chairman and Executive Directors are available for discussions with shareholders throughout the year and particularly at the time of results announcements. The Senior Independent Director is also available should any shareholder wish to draw any matters to his attention. The Directors are available for comment throughout the year and at all General Meetings of the Company. Centaur Media values the views of its shareholders and recognises their interest in the Company’s strategy and performance, Board membership and quality of management. The Group therefore has an active programme to meet and make presentations to its current and potential shareholders to discuss its objectives. The AGM is used to communicate with investors and they are encouraged to attend the AGM and to participate in proceedings formally or sharing their views with Board members informally after the meeting. The Chairmen of the Audit, Remuneration and Nomination Committees are available to answer questions. Separate resolutions are proposed on each issue so that they can be given proper consideration and there is a resolution to approve the annual report and financial statements. The Company counts all proxy votes and indicates the level of proxies lodged on each resolution, after it has been voted on by a show of hands. All shareholders can gain access to the annual reports, trading updates, announcements, press releases and other information about the Company through the Company’s website, www.centaurmedia.com.
RISK ASSESSMENT
Risks that affect or may affect the business are identified and assessed, and appropriate controls and systems implemented to ensure that the risk is managed. The Group’s risk register is kept by the Company Secretary with the input of the Executive Committee and is reviewed by the Audit Committee every six months with appropriate mitigation actions also being reported to and overseen by the Committee.
The principal risks facing the Group, with associated mitigating controls are detailed on page 13 within the Strategic Report.
If a Director is unable to attend a meeting he or she is provided with the same level of information as the other directors in advance of the meeting and given the opportunity to express views, which will then be shared at the meeting.
In addition to the key items identified for discussion by the Committees above, the Board discussed the following matters at the Board meetings during the reporting period:
Review of financial performance against budget and prior year;
Review of Group strategy and objectives for the Executive Directors;
Review and approval of budgets;
Review of Group key performance indicators;
Review of acquisition targets;
Approval of financial reports and communication to shareholders and investors; and
Approval of the Group‘s internal control policy, including an assessment of the risk and corporate governance environment.
BOARD ASSESSMENT AND DIRECTORS’ PERFORMANCE EVALUATION
The Board undertakes a formal evaluation of its own performance and that of its Committees and individual Directors. Individual evaluation aims to show whether each Director continues to contribute effectively and to demonstrate commitment to the role (including commitment of time for Board and Committee meetings and other duties). Evaluations are undertaken annually by self-assessment and the Chairman’s performance is also evaluated by the other Non-Executive Directors at a separate meeting for this purpose each year. In addition the Chief Executive is subject to an annual performance review with the Chairman. New directors receive an induction programme and all the Directors are encouraged to undertake continuous professional development programmes as appropriate. The Group offered training presentations in relation to directors’ duties to the Board during 2015 and maintains insurance cover in respect of legal action against its Directors.
MANAGEMENT STRUCTURE
The Board delegates the day-to-day running of the Company to the Executive Directors, who in turn share the operational running of the Group with the Executive Committee. Throughout the reporting period, the Executive Committee was the primary body implementing operational management across the Group. The role of the Executive Committee is to review:
Financial performance and budget (at operational level);
Human capital management;
Operational efficiency and developments (including Group IT, procurement and facilities);
Product development;
Market development;
Business planning;
Acquisition needs;
Internal and external communications;
Business transformation and change management.

48 49
GOVERNANCE
BRIBERY ACT 2010
In response to the Bribery Act 2010, the Board performed a risk assessment across the Group and formalised its policy to prevent bribery. The Board has in place processes to prevent corruption or unethical behaviour. The policy explains what is considered a bribe or facilitation payment, which are prohibited, and provides guidance over the levels of gifts, entertainment and hospitality that are considered reasonable. This documentation has been circulated to all staff. Training has been mandatory for those groups of employees identified and is available as required to new joiners. The Group’s policy was communicated to all appropriate third parties. It is re-communicated to staff on an annual basis. The more rigorous processes around declaring directors’ interests and identifying potential conflicts have improved the regular monitoring of the Group’s policy.
WHISTLEBLOWING
The Company is committed to the highest standards of integrity and honesty. Along with other policies, which encourage this behaviour, a whistleblowing policy is annually re-communicated to all staff. This allows all employees to disclose openly, in confidence or anonymously, any concerns they may have about possible improper practices, in financial or other matters. An escalation process has been communicated to employees. Any matters raised will be investigated and resolved. The Audit Committee will be notified of any issues raised through this process and appropriate action taken. However, no incidents were noted during the period.
CAPITAL STRUCTURE
Information on the share capital structure is included in the Directors’ Report on page 40.
Approved by the Board of Directors and signed by order of the Board.
Grainne BrankinCompany Secretary16 March 2016
ETHICS
The Group carries out its business in a fair, honest and open manner, ensuring that it complies with all relevant laws and regulations. The Company has specific policies on fraud, director conflict, bribery and whistleblowing, which are widely distributed and compliance with these policies is monitored. The Board has oversight of the Group’s actions. The HR team ensures that new job opportunities are made available to existing employees as well as to outside applicants and that all employees are able to benefit from training, career development and promotion opportunities where appropriate. The recruitment of new personnel is made without prejudice and the Group believes in equal opportunity and encourages diversity. The analysis of the Group’s workforce and Board by gender is set out in the Corporate Responsibility Report on page 35.
Through all our interaction with our customers and partners we ensure that we treat them fairly and openly whilst abiding by the terms of contracts and relevant law. Equally, we treat our suppliers fairly and do not exploit them or their employees.
MONITORING OF CONTROLS
The Board has overall responsibility for the effectiveness of the Group’s system of risk management and internal controls and these are regularly monitored by the Audit Committee.
Details of the activities of the Audit Committee in this financial year can be found in the Audit Committee Report on page 50.
GREENHOUSE GAS EMISSIONS
The disclosure in respect of the greenhouse gas emissions of the Group that are attributable to human activity in tonnes of carbon dioxide is set out in the Corporate Responsibility Report on page 35.
FRAUD
Whilst the Group cannot guarantee to prevent fraud, the internal control framework is in place to reduce the likelihood of fraud arising. The Group also ensures that all employees are aware of the whistleblowing policy should any individual become aware of any incidence of fraud.
DIRECTORS’ CONFLICTS
Group and subsidiary directors have to notify their employing company of all directorships they hold. Annual conflict of interest disclosures require them to disclose such directorships or other relationships, which they or a person connected to them may hold. These are reviewed by the Board to assess the impact on the Company and whether it would impair the Group’s objectives.

50 51
GOVERNANCE
FINANCIAL STATEMENTS
During the reporting period and up until the date of this report, the Audit Committee undertook the following activities to ensure the integrity of the Group’s financial statements and formal announcements:
Regularly met with management and the Group Finance Director to discuss the results and performance of the business;
Received reports from management on the internal controls covering the financial reporting process;
Reviewed and agreed the external auditors’ audit strategy in advance of their audit for the reporting period;
Reviewed compliance with requirements under the newly issued UK Corporate Governance Code, and in particular its impact on the Strategic Report and Viability Statement;
Discussed the report received from the external auditors regarding their audit in respect of the previous reporting period, which included comments on significant financial reporting judgements and their findings on internal controls; and
Reviewed and discussed with management and the Group Finance Director each formal announcement made by the Group.
The most significant financial reporting judgements considered by the Audit Committee and discussed with the external auditors during the reporting period were as follows:
Carrying value of goodwill and intangible assets
The Audit Committee has reviewed management’s assessment of the recoverability of the Group’s goodwill and intangible assets and whether there is a need for any resulting impairment. The recoverable amount of goodwill has been determined through value in use calculations of each cash-generating unit (‘CGU’) based on formally approved forecasts for the first three years of the value-in-use calculation, and applying a terminal growth rate of 2.25%.
Management’s assessment of the recoverability of the Group’s goodwill and intangible assets resulted in an impairment of £11.9m being recognised against the goodwill in the Professional segment. This was triggered by a more moderate growth outlook across portfolios reported within the Professional segment, including HR and Engineering, and specifically reflects weaker print and advertising trends. The Committee has paid particular attention to the judgements and assumptions used to forecast cash flows, particularly around revenue and EBITDA growth rates. The Committee was satisfied that the forecasts reflect the CGUs’ historic budgeting performance and sensitivities performed, and that the value-in-use calculation reflects management’s best estimate, and that the impairment recognised against goodwill of £11.9m is appropriate. As a result the Audit Committee was satisfied with the carrying value of goodwill and intangible assets in the Group balance sheet.
Further details on goodwill and the impairment testing are included in note 9 to the Financial Statements.
AUDIT COMMITTEE REPORT Dear Shareholder,
I am pleased to present the report of the Audit Committee (‘the Committee’) for the year ended 31 December 2015 (‘the reporting period’). This report details the Audit Committee’s on-going responsibilities and key activities over the period. The role of the Committee is to review and report to the Board on the Group’s financial reporting, internal controls and risk management processes and the performance, independence and effectiveness of the external auditors, PricewaterhouseCoopers LLP. The Committee receives regular reports from management on performance and risk management as well as input from the external auditors. The Executive Directors, representatives of the auditors and other Group executives, including the General Counsel, regularly attend meetings at the invitation of the Committee. At least once during the year, the Committee meets separately with the external auditors and with management and as Chairman I am in regular direct contact with the external auditors and with the Group Finance Director.
During the reporting period, the Audit Committee composition changed as a result of Patrick Taylor stepping down from Centaur Media Plc’s Board at the last AGM in May 2015, at which time Ron Sandler joined. For the remainder of the reporting period, the Committee comprised Robert Boyle (Chairman), Ron Sandler and Rebecca Miskin.
ROLES AND RESPONSIBILITIES
The main roles and responsibilities of the Audit Committee are to:
Monitor the integrity of the financial statements of the Group and any public announcements relating to the Group’s financial performance, reviewing (and approving) significant financial reporting judgements contained in them;
Review and monitor the external auditors’ independence and objectivity and the effectiveness of the audit process, taking into consideration relevant UK professional and regulatory requirements;
Review and assess the annual report in order to determine that it can advise the Board that, taken as a whole, the annual report is fair, balanced and understandable, and provides shareholders with the information they need to assess the Company’s performance, business model and strategy as required by provision C.1.1 of the Code;
Make recommendations to the Board in relation to the appointment and terms of engagement of the external auditors and to review and approve levels of audit and non-audit the remuneration;
Develop and implement policy on the engagement of the external auditors to supply non-audit services;
Review the effectiveness of the Group’s internal financial control and risk management systems;
Review the Group’s finance and operational policies and procedures to ensure they remain effective and relevant;
Oversee the whistleblowing arrangements of the Group and to ensure they are operating effectively; and
Report to the Board on how it has discharged its responsibilities.

52 53
GOVERNANCE
RISK MANAGEMENT
The Group’s management is responsible for the identification, assessment and management of risk, as well as for designing and operating the system of internal control. The Audit Committee has worked closely with management and received detailed information to assess the effectiveness of internal financial control and risk assessment and management systems and report on them to the Board (which retains ultimate responsibility). A new finance system was implemented during the reporting period which is expected to deliver significant benefits, and the Committee is confident that, together with a centralised finance team, it will contribute to further enhancement of the system of internal control in future periods.
Having monitored the Group’s risk management and internal control system, and having reviewed the effectiveness of material controls, including financial, operational and compliance controls, the Audit Committee confirms on behalf of the Board that it has not identified any significant control failings or weaknesses at any time during the reporting period.
RISK OF FRAUD
The Audit Committee considered the risk of fraudulent financial reporting in the business, and through its review of the effectiveness of internal controls and reporting from management has concluded that adequate controls were in place during the reporting period.
WHISTLEBLOWING
The Committee reviewed the Group’s whistleblowing policy and is satisfied that this has met FCA rules and good standards of corporate governance. Further details of the whistleblowing policy are set out within the Directors’ Statement on Corporate Governance on page 49.
Adjusting items
The Audit Committee has challenged management strongly over recent financial reporting periods with regard to the presentation of exceptional items. Exceptional items disclosed in the reporting period relate to the impairment of goodwill, further restructuring activities, the profit on disposal of trade and assets, the refinancing of the Group’s banking facilities, and the settlement of an earn-out agreement. The Committee is satisfied that it is appropriate to present these exceptional items as adjusting items.
The Committee assesses the appropriateness of all items disclosed as adjusting and the impact these have on the quality of the Group’s underlying earnings.
Further details on adjusting items are included in note 1 to the Financial Statements.
Recoverability of trade receivables
As set out in the Financial Review, the introduction of new finance and CRM systems during 2015 led to operational and commercial disruption, and this had a material impact on subsequent collection of trade receivables during the second half of the year. At 31 December 2015, trade receivables greater than 90 days overdue was £5.0m compared to £0.5m at 31 December 2014.
The Committee notes that the collectability of trade receivables is a judgemental area. The Audit Committee has reviewed management’s detailed assessment of the recoverability of the trade receivables balance, which considered amounts not collected since the year end and the appropriateness of the provision for impairment recorded of £0.9m in this context. This assessment sets out the measures which have been taken by management to address the cash collection issues on aged balances, and has considered the trends in cash collections throughout 2015 and in January and February 2016. The Committee concurred with management’s judgement that the level of provision recorded is adequate and concluded that appropriate measures had been taken to address the related systems issues.
GOING CONCERN
The Audit Committee received a report setting out the going concern review undertaken by management which forms the basis of the Board’s going concern conclusion. The Group agreed a four year £25.0m multi-currency revolving bank facility during the period. The Committee has considered the negative working capital trends during the reporting period, and is satisfied that these are temporary in nature. There is significant headroom on all of the financing covenants. On this basis the Committee has concluded that the adoption of the going concern basis is appropriate.

54 55
GOVERNANCE
SELF-ASSESSMENT
During the period the Audit Committee performed a formal, questionnaire based, self-assessment with satisfactory results.
REPORT TO THE BOARD
The Board has requested the Committee to confirm that in its opinion the Board can make the required statement that the Annual Report taken as a whole is fair, balanced and understandable and provides the information necessary for shareholders to assess the Company’s performance, business model and strategy. The Committee has given this confirmation on the basis of its review of the whole Annual Report, underpinned by involvement in the planning for its preparation, review of the processes to ensure the accuracy of factual content and by assurances from the Remuneration Committee.
INDEPENDENT AUDITORS
A resolution is to be proposed at the Annual General Meeting for the re-appointment as auditors of PricewaterhouseCoopers LLP.
Robert BoyleChairman of the Audit Committee16 March 2016
KEY ISSUES
Other significant issues monitored and approved by the Committee following appropriate presentations during the reporting period were:
Review of data protection policies and compliance;
Review of business continuity plans and the results of related testing;
Review of authority framework;
Review of internal procedures for managing security of banking administration;
Monitoring the roll out of anti-bribery training;
Review of the final VBR earn-out calculations; and
Review of the deployment plans for the new finance system.
INTERNAL AUDIT
The Committee considered whether it was appropriate to appoint internal auditors and concluded that this is not currently required given the size of the business, its relatively centralised operations and the risks identified together with the mitigating controls.
EXTERNAL AUDIT
The external auditors, PricewaterhouseCoopers LLP, were appointed in 2004 and no formal retender process has been conducted since this time.
The Audit Committee monitors the external audit process to ensure high standards of quality and effectiveness. This was assessed throughout the reporting period using a number of measures, including:
Reviewing the quality and scope of planning of the audit and the level of fees;
Monitoring the independence and transparency of the audit; and
Obtaining feedback from management and the Directors on the quality of the audit team, their business understanding and audit approach and approving reappointment.
The Audit Committee considered the independence and objectivity of the external auditors through a careful review of their terms of engagement, scope of work and level of fees. This included reviewing the nature and extent of non-audit services supplied by the external auditors to the Group, seeking to balance objectivity and value for money.
The external auditors are excluded from providing services where there could be a threat to their independence. Prior approval from the Audit Committee has been required where non-audit fees exceed twice the annual audit fee. This policy will be brought into line with new regulations in 2016.
During the reporting period, PricewaterhouseCoopers LLP provided non-audit services to the Group in respect of taxation compliance and advisory. The Board is satisfied that there has been no impairment of their objectivity and independence, and anticipates the level of non-audit fees will fall further in 2016. Refer to note 3 of the financial statements for fees paid to PricewaterhouseCoopers LLP during the reporting period. The external auditors’ report to the Directors and the Audit Committee also confirmed their independence in accordance with auditing standards.
The Group is required to put the audit out to tender for the year ended 31 December 2017. It is intended that the audit for the year ended 31 December 2017 be placed out to a formal tender in autumn 2016.

HEADING
56 57
ACTIVITIES IN 2016
After nearly 9 years as a Non-Executive member of the Board, our Senior Independent Director Chris Satterthwaite has informed the Board of his intention to step down during 2016, once a replacement Non-Executive Director has been recruited. We have started a process to identify a successor Non-Executive Director to join the Board and in the meantime Chris will offer himself for re-election at the 2016 AGM and continues to be an active and valued member of the Board as well as the Senior Independent Director.
Ronald SandlerChairman of the Nomination Committee16 March 2016
NOMINATION COMMITTEE REPORTDear Shareholder,
I am pleased to present the report of the Nomination Committee for the year ended 31 December 2015. This report details the Committee’s ongoing responsibilities and key activities over the period.
In May 2015, the Nomination Committee composition changed when Patrick Taylor stepped down from the Board and I became Chairman of the Committee as well as the Board. For the rest of the reporting period the Committee comprised Ron Sandler, Chris Satterthwaite and Rebecca Miskin, ensuring that there is a majority of independent Non-Executive Directors on the Committee.
NOMINATION COMMITTEE RESPONSIBILITIES
The Committee’s key responsibilities include:
Reviewing the Board’s structure, size and composition;
Reviewing the composition of Board Committees;
Defining the role and competencies required for appointments to the Board;
Identifying, nominating and reviewing candidates for appointment to the Board;
Putting in place plans for succession for the Chairman and other members of the Board, the Chief Executive and the Group Finance Director; and
Reviewing the leadership needs of the organisation, both Executive and Non-Executive.
The appointment of directors is a matter for the Board, which considers recommendations of the Nomination Committee. The Committee is responsible for ensuring that the Board and the Board Committees are properly constituted and balanced in terms of skills, experience and diversity. Our policy on Board diversity is set out in the Directors’ Report above and during the reporting period we had two female Board members, comprising 33% of the Board.
ACTIVITIES DURING THE REPORTING PERIOD
The main focus of the Committee during the first part of the reporting period was to identify and appoint a new Non-Executive Director who would join the Board as Chairman following the AGM when Patrick Taylor stepped down. The Committee was led by Chris Satterthwaite for this purpose and followed a rigorous process that was approved by the Board. The search was supported by executive search consultants and following a comprehensive short list and interview exercise my own appointment was recommended to the Board by the Committee and I was confirmed as a Non-Executive Director, Chairman of the Board, Chairman of the Nomination Committee and member of each of the Remuneration and Audit Committees immediately following the AGM on 13 May 2015. For the remainder of the reporting period the Committee focused on the responsibilities set out above, including in particular undertaking a review of the Board’s structure, size and composition, as well as the effectiveness of the Board and its Committees.

58 59
GOVERNANCE
SHARE SCHEMES
Centaur Media’s LTIP is now the Company’s only executive share scheme and is due to reach the end of its 10 year life in 2016. At our forthcoming AGM we will therefore seek approval for a replacement share scheme. The terms of the 2016 LTIP will be broadly similar to the 2006 LTIP and are set out in more detail in the Notice of AGM. Given the timing of adoption of the 2016 LTIP and the absence of significant changes to the terms of the awards, the existing LTIP will be used for the final time in March 2016 to grant the 2016 LTIP awards.
We take the views of our shareholders seriously and seek to maintain a dialogue on remuneration matters. For this reason, I contacted major shareholders and representative bodies in January to set out the key terms of the 2016 LTIP and consider feedback received.
REMUNERATION FOR 2016
We believe the Directors’ Remuneration Policy remains fit for purpose and therefore no changes will be made for 2016 other than a limited consequential amendment to accommodate the addition of an exceptional grant limit in the 2016 LTIP which was not in the 2006 LTIP.
The budgeted average salary increase for annual pay reviews in April 2016 for management and staff across the Group will be 3% (2% in 2015).
The Executives’ base salaries will be increased by 3% with effect from 1 April 2016. The fees paid to Non-Executive Directors (other than the Chairman who joined in May 2015) were last reviewed in December 2013 and will also be increased by 3% from 1 April 2016.
At the AGM on 11 May 2016, a resolution will be proposed to adopt the new LTIP and in addition, shareholder approval will be sought for the consequential amendment to the Directors’ Remuneration Policy. In addition to these binding shareholder votes, the Annual Statement and the Annual Report on Remuneration will be subject to an advisory vote.
I hope that shareholders will vote in favour of these resolutions and I will of course be happy to answer any questions that shareholders may have before or at the AGM.
Rebecca MiskinChair of the Remuneration Committee16 March 2016
REMUNERATION COMMITTEE REPORT ANNUAL STATEMENT
Dear Shareholder,
On behalf of the Board I am pleased to present to you the report of the Remuneration Committee for the year ended 31 December 2015 (‘the reporting period’). This is in three parts: this Annual Statement, the Directors’ Remuneration Policy and the Annual Report on Remuneration. At the Annual General Meeting on 11 May 2016 we will be seeking approval for the Annual Statement, the Annual Report on Remuneration, a new Long Term Incentive Plan (‘LTIP’) to replace the current plan which is reaching the end of its 10 year life and minor changes to the Directors’ Remuneration Policy to accommodate the new LTIP.
COMMITTEE MEMBERSHIP
During the reporting period Centaur Media‘s Remuneration Committee was joined by Ron Sandler, from 13 May 2015, as a member of the Committee as well as Chairman of the Board. For the remainder of the reporting period the Committee comprised myself (Chair), Ron Sandler, Chris Satterthwaite and Robert Boyle.
CONTEXT FOR EXECUTIVE REMUNERATION AT CENTAUR MEDIA
The Company’s broader remuneration strategies remain unchanged from those outlined in last year’s report; we are committed to simplification, performance-related remuneration and long-term share-based incentives. During the reporting period, we implemented a new cycle of reviewing pay in the first quarter of each financial year, to take effect from 1 April. This happened for the first time in 2015 across the Company at the same time for all employees and the process is underway for 2016.
In the reporting period, we have seen some turnover in senior management and other positions, in part reflecting the continuing high levels of change in the business as we execute the business strategy set out by Andria Vidler in 2014. Retention of our key people is a focus of the Remuneration Committee going forward, reflecting a priority of the Executive Committee and the Company generally.
EXECUTIVE REMUNERATION
A review of Centaur Media’s executive remuneration was last undertaken in February 2013 by the Committee, and we believe it continues to reflect our remuneration strategy, with no major changes proposed. As disclosed in last year’s Remuneration Report, Andria Vidler’s base salary was increased by 4.5% in April 2015 and Mark Kerswell’s base salary was increased by 1.46% at the same time. Executive remuneration has been unchanged since that date. Based on Company performance the Executives will receive a bonus for the financial year 2015 of £7,106 in the case of Andria Vidler and £4,870 in the case of Mark Kerswell. No LTIP or other share awards to the Executives vested in the reporting period and the Annual Report on Remuneration provides details of LTIP awards granted to Andria Vidler and Mark Kerswell in March 2015, which are due to vest in March 2018.

60 61
GOVERNANCE
PURPOSE AND LINK TO STRATEGY
ELEM
ENT
BAS
E SA
LAR
Y
OPERATION MAXIMUM PERFORMANCE TARGETS & RECOVERY PROVISIONS
ANN
UAL
BO
NU
S
Reflects the value of the individual and their role
Reflects skills and experience over time
Provides an appropriate level of basic fixed income avoiding excessive risk arising from over reliance on variable income
Reviewed annually, normally effective 1 April
Paid in cash on a monthly basis.
Pensionable
Takes periodic account against companies with similar characteristics and sector comparators
The Committee has not set a maximum level of salary. Increases will be set in the context of salary increases amongst the wider work force
The Committee retains the discretion to make increases above this level in certain circumstances, for example, but not limited to: - An increase in the
individual’s scope and responsibilities
- Alignment to the external market
- An increase to reflect an individual’s performance and development in the role, e.g. where a new appointment is recruited at a lower salary level and is awarded stepped increases
Not applicable
Incentivises annual delivery of financial and strategic goals
Maximum bonus only payable for achieving demanding targets
Targets reviewed annually
Not pensionable
Mandatory deferral of any bonus over 75% of base salary into shares for 3 years
Dividend equivalents may be payable on deferred share awards
100% of salary Normally measured over a one year performance period
Primarily based on Group’s annual financial performance (majority, if not all)
Personal and/or strategic objectives (minority)
Measures for the following years will be set out in the Annual Report on Remuneration of the relevant year
Clawback provisions apply
DIRECTORS’ REMUNERATION POLICY
Centaur Media recognises the need to attract, retain and incentivise executives with the appropriate skills and talent to manage and develop the Group’s businesses in such a way as to drive the Group’s strategy and deliver shareholder value. The main principles of the Directors’ Remuneration Policy are:
To achieve total remuneration packages that are competitive in the sector within which the Group operates and with the market in general;
To provide an appropriate balance between fixed and variable remuneration which rewards high levels of performance; and
To incentivise and retain management and to align their interests with those of shareholders.
CONSIDERATIONS OF EMPLOYMENT CONDITIONS ELSEWHERE IN THE GROUP
The Committee considers the general base salary increase for all employees when determining the annual salary increases for the Executive Directors. Employees have not been consulted in respect of the design of the Directors’ Remuneration Policy, although the Committee will keep this under review.
CONSIDERATION OF SHAREHOLDER VIEWS
The Committee considers shareholder feedback received in relation to the AGM each year. This feedback, plus any additional feedback received during the course of the year is then considered as part of the Company’s annual review of remuneration policy. In addition, the Committee will seek to engage directly with major shareholders and their representative bodies should any material changes be made to the Directors’ Remuneration Policy. Details of votes for and against the resolution to approve last year’s Remuneration Report are set out in the Annual Report on Remuneration.
DIRECTORS’ REMUNERATION POLICY – SUMMARY TABLE
The table below sets out the remuneration policy that will, subject to shareholder approval, be formally effective from the date of the 2016 AGM. The only change as compared to the remuneration policy disclosed in the 2014 Annual Report on Remuneration is in relation to the Centaur Media Long Term Incentive Plan 2006 (‘2006 LTIP’) which will shortly reach the end of its 10-year life. It is intended that under the proposed 2016 LTIP, to be approved at the 2016 AGM, the normal maximum award permitted in any financial year will continue to be 100% of salary. However, in exceptional circumstances (e.g. recruitment or retention), awards up to 200% of salary may be granted.
Note that payments may be made under arrangements in place prior to this policy becoming effective (including pension, other benefits and incentives).
The remuneration policy offered to employees of the Group will be adapted to reflect local market practice and seniority.

62 63
GOVERNANCE
NOTES
1. The Annual Report on Remuneration sets out how the Company intends to implement the policy presented above.
2. Not all employees have a bonus opportunity, and below Executive Director level bonus opportunities are generally lower. Participation in the LTIP is limited to Executive Directors and certain selected senior management. Other employees are eligible to participate in the Company’s all employee share plans. In general these differences arise from the development of remuneration arrangements that are market competitive for the various categories of individuals, together with the fact that remuneration of the Executive Directors and Senior Executives typically has a greater emphasis on performance related pay. All bonus schemes are discretionary.
3. The choice of performance metrics applicable to the annual bonus plan reflect the Committee’s belief that any incentive compensation should be appropriately challenging and primarily tied to financial measures.
4. The TSR and EPS performance conditions applicable to the LTIP were selected by the Committee on the basis that they reward the delivery of long-term returns to shareholders and the Group’s financial growth, and are consistent with the Company’s objective of delivering long-term value to shareholders.
5. Executive Directors may participate in any all-employee share plan, in line with HMRC limits, and to the extent offered.
PURPOSE AND LINK TO STRATEGY
OPERATION MAXIMUM PERFORMANCE TARGETS & RECOVERY PROVISIONS
ELEM
ENT
Aligns to main strategic objectives of delivering profit growth and shareholder return
Annual grant of conditional awards or nil cost options granted
Dividend equivalents may be payable on shares to the extent awards vest
Awards capped at 100% of salary (200% in exceptional circumstances)
Normally a three year performance period
Performance is based on financial and/or share price based measures (e.g. relative Total Shareholder Return and EPS)
The Committee may alter the weighting and targets annually if it determines that it is appropriate to do so
Targets for the following years will be set out in the Annual Report on Remuneration
Awards vest as follows:
- Threshold performance: 25% of award
- Maximum performance: 100% of award
- Clawback provisions apply
Provides competitive retirement benefits
Provides an opportunity for Executive Directors to contribute to their own retirement plan
Defined contributions made to Executive Directors’ own pension plans. Cash supplements may also be paid
Up to 15% of base salary
Not applicable
Aids retention and recruitment
Executive Directors are provided with private medical insurance
Other benefits including company car allowance may be provided if considered appropriate by the Committee
There is no maximum. Set at a level which the Committee considers is appropriate in the context of the circumstances of the role/individual and local market practice
Not applicable
To provide alignment of interests between Executive Directors and shareholders
50% of the net of tax vested LTIP shares required to be retained until the guideline is met
100% of salary Not applicable
LON
G T
ERM
INC
ENTI
VES
PEN
SIO
NO
THER
BEN
EFIT
SSH
ARE
OW
NER
SHIP

64 65
GOVERNANCE
EXECUTIVE DIRECTOR SERVICE CONTRACTS AND LOSS OF OFFICE PAYMENTS
The current Executive Directors have service contracts which have a twelve month notice period.
In respect of Andria Vidler’s service contract (dated 30 October 2013), at the Board’s discretion, a payment in lieu of any unexpired notice may be paid, comprising an amount for base salary, pension and any accrued holiday entitlement. The amount may be paid in one lump sum or in two instalments and mitigation will be applied to the second instalment. If termination is within six months of a change of control, a payment equal to 12 months’ salary, pension and accrued holiday pay is payable. Where the Company terminates the contract in any other manner, any damages shall be calculated in accordance with common law principles including those relating to mitigation of loss. Notwithstanding the above, the Company is entitled to terminate employment without compensation, damages or payment in lieu of notice in specified circumstances (e.g. serious misconduct).
In respect of Mark Kerswell’s service contract (dated 11 October 2011), at the Board’s discretion, a payment in lieu of any unexpired notice may be paid, comprising an amount for base salary, pension, bonus and any accrued holiday entitlement. Where the Company terminates the contract in any other manner, any damages shall be calculated in accordance with common law principles including those relating to mitigation of loss. Notwithstanding the above, the Company is entitled to terminate employment without compensation, damages or payment in lieu of notice in specified circumstances (e.g. serious misconduct).
In respect of incentives, an annual bonus will normally be payable with respect to the period of the financial year served, although it will be pro-rated and paid at the normal pay-out date. Any share-based entitlements granted to an Executive Director under the Company’s share plans will be determined based on the relevant plan rules. However, in certain prescribed circumstances, such as death, disability, retirement or other circumstances at the discretion of the Committee, ‘good leaver’ status may be applied. For good leavers, awards will normally vest at the normal vesting date, subject to the satisfaction of the relevant performance conditions at the time, and reduced pro-rata to reflect the proportion of the performance period actually served. However, the Committee has discretion to determine that awards vest at cessation of employment or to not apply time pro-rating.
In addition to the above, outplacement support may be provided and legal fees or any other minor incidental costs which are considered appropriate may be payable.
REWARD SCENARIOS
The chart below shows how the composition of each Executive Director’s remuneration package varies at different levels of performance under the policy set out above, as a percentage of total remuneration opportunity and as a total value:
FIXED PAY
ANNUAL BONUS
LTIP
£429
£704
Andria Vidler
MIN MAXTARGET
£1,1611,200
1,000
800
600
400
200
-
26%
13% 32%
32%
£279
£467
£780
MIN MAXTARGET
Mark Kerswell
800700600500400300200100
-
27%13% 32%
32%
NOTES
1. Fixed pay consists of salary from 1 April 2016. The value of benefits and pension have been estimated for 2016.
2. Target performance is the level of performance required to deliver 50% of the maximum bonus and 25% of the maximum LTIP value (see below).
3. Maximum performance would result in a maximum bonus payment of 100% of salary and full vesting of the normal maximum LTIP award (100% of salary).
4. No share price appreciation has been assumed.
APPROACH TO RECRUITMENT AND PROMOTIONS
The remuneration package for a new Executive Director would be set in accordance with the terms of the Company’s prevailing approved remuneration policy at the time of appointment and would take into account the skills and experience of the individual, the market rate for a candidate of that experience and the importance of securing the relevant individual.
On recruitment, salary may (but need not necessarily) be set below the normal market rate, with phased increases as the executive gains experience. The maximum annual bonus would be no more than 100% of salary and grants under the LTIP would be limited to a maximum of 100% of salary (200% in exceptional circumstances). In addition, on recruitment the Company may compensate for amounts foregone from a previous employer (using Listing Rule 9.4.2 if necessary) taking into account the quantum foregone and, as far as reasonably practicable, the extent to which performance conditions apply, the form of award and the time left to vesting.
For an internal appointment, any variable pay element awarded in respect of their prior role should be allowed to pay out according to its terms. Any other on-going remuneration obligations existing prior to appointment may continue, provided that they are put to shareholders for approval at the earliest opportunity.
The Committee may agree that the Company will meet relocation, legal fees or incidental costs where appropriate.

66 67
GOVERNANCE
LETTERS OF APPOINTMENT
The Chairman and Non-Executive Directors have letters of appointment with the Company, which are for an initial three-year period with an extension for a further three-year period, and provide for a notice period of one month. All existing Directors have chosen to submit to annual re-election at each AGM.
First appointed Current letter of appointment Current letter of as a Director commencement date appointment expiry date
Ronald Sandler 13 May 2015 13 May 2015 13 May 2021
Christopher Satterthwaite 1 July 2007 1 July 2007 1 July 2016
Robert Boyle 8 January 2010 8 January 2016 8 January 201910
Rebecca Miskin 13 January 2011 13 January 2011 13 January 2017
APPROACH TO RECRUITMENT
For the appointment of a new Chairman or Non-Executive Director, the fee arrangement would be set in accordance with the approved remuneration policy in force at that time.
10 Robert Boyle’s previous letter of appointment commenced on 8 January 2010 and expired on 8 January 2016.
REMUNERATION POLICY FOR THE CHAIRMAN AND NON-EXECUTIVE DIRECTORS
The Company Chairman’s fee is determined by the Remuneration Committee (other than the Company Chairman, if he sits on the Committee). The fees for the Non-Executive Directors are reviewed by the Board, excluding the Non-Executive Directors. The table summarises the key aspects of the remuneration policy for the Chairman and Non-Executive Directors:
ELEMENT PURPOSE AND LINK TO STRATEGY
OPERATION MAXIMUM PERFORMANCE TARGETS & RECOVERY PROVISIONS
Non-Executive Directors fees
Provides fees reflecting time commitments and responsibilities of each role, in line with those provided by similarly sized companies
Cash fee normally paid on a monthly basis
Reimbursement of incidental expenses where appropriate
Fees are reviewed periodically
There is no prescribed maximum annual fee or fee increase.
The Committee and Board are guided by the general increase in the Non-Executive market, but may decide to award a lower or higher fee increase to recognise, for example, an increase in the scale, scope or responsibility of the role or take account of relevant market movements.
Not applicable

GOVERNANCE
68 69
FEES FOR THE CHAIRMAN AND NON-EXECUTIVE DIRECTORS
The Company Chairman’s fee and those of the Non-Executive Directors are determined as described on page 60. The fees for the Chairman and Non-Executive Directors’ fees (excluding the Chairman) were reviewed in December 2015, and it is proposed that Non-Executive Directors fees will be increased by 3% effective from 1 April 2016. The current and proposed fees are as follows:
From 1 April 2016 As at 1 April 2015 % change
Ronald Sandler (Chairman) 125,000 125,000 0%Christopher Satterthwaite 43,775 42,500 3%Robert Boyle 43,775 42,500 3%Rebecca Miskin 43,775 42,500 3%
REMUNERATION RECEIVED BY DIRECTORS FOR THE REPORTING PERIOD (AUDITED)
Directors’ remuneration for the year ended 31 December 2015 (and for the 18 months ended 31 December 2014) was as follows:
Salary Taxable Bonus Long-term Pension11 Total and fees benefits incentives
Executive
Andria Vidler 2015 351,475 16,056 7,106 - 41,070 415,707 2014 394,487 14,802 221,340 - 39,448 670,077Mark Kerswell 2015 242,625 2,634 4,870 - 24,263 274,392 2014 372,750 3,886 178,920 103,591 39,552 698,778Non-Executive
Ronald Sandler12 2015 79,167 - - - - 79,167 2014 - - - - - -Christopher Satterthwaite 2015 42,500 - - - - 42,500 2014 62,708 - - - - 62,708Robert Boyle 2015 42,500 - - - - 42,500 2014 60,625 - - - - 60,625Rebecca Miskin 2015 42,500 - - - - 42,500 2014 62,708 - - - - 62,708Former Directors
Patrick Taylor13 2015 31,276 - - - - 31,276 2014 125,417 - - - - 125,417Colin Morrison14 2015 - - - - - - 2014 16,667 - - - - 16,677
11 Mark Kerswell received a balancing payment of £6,954 in pension contributions in November 2014 which was due to a correction of past payments.
12 Ronald Sandler was appointed Chairman with effect from 13 May 2015.
13 Patrick Taylor stepped down from the Board with effect from 13 May 2015.
14 Colin Morrison stepped down from the Board on 13 November 2013.
ANNUAL REPORT ON REMUNERATION
IMPLEMENTATION OF THE DIRECTORS’ REMUNERATION POLICY FOR THE YEAR ENDING 31 DECEMBER 2016
A summary of how the Directors’ Remuneration Policy will be applied during the year ending 31 December 2016 is set out below:
BASE SALARY
The Executive Directors’ salaries were reviewed in December 2015, and will be increased by 3% from 1 April 2016. The current and proposed salaries are as follows:
From 1 April 2016 As at 1 April 2015 % change
Andria Vidler £365,959 £355,300 3%Mark Kerswell £250,805 £243,500 3%
PENSION AND BENEFITS
The Committee intends that the implementation of its policy in relation to pension and benefits will be in line with the disclosed policy on page 62 of this report.
ANNUAL BONUS
The Committee will operate an annual bonus plan for Executive Directors during 2016 in line with 2015. The maximum bonus will remain at 100% of salary, with performance measured against revenue and PBTA (profit before tax and amortisation) targets. Any annual bonus greater than 75% of basic salary will be awarded in Centaur Media Plc shares and deferred for three years.
LONG-TERM INCENTIVES
It is intended that LTIP awards granted to Executive Directors in March 2016 will be made under the Centaur Media Long Term Incentive Plan 2006 (‘2006 LTIP’), equal to 100% of salary and subject to EPS and TSR conditions as follows:
50% of the 2016 LTIP award will be based on absolute earnings per share (‘EPS’) targets. 25% of this part of the award will vest for a threshold EPS of 6.5p increasing pro-rata to 100% vesting for a maximum EPS of 10.5p for the year ending 31 December 2018. The EPS target range for these awards has been set in line with the Company’s long-term plan and the Committee is satisfied that this represents an appropiate stretch on current forecasts.
50% of the 2016 LTIP award will be based on relative total shareholder return (‘TSR’) measured against the constituents of the FTSE SmallCap (excluding investment trusts). 25% of this part of the award will vest for median TSR increasing pro-rata to 100% vesting for upper quartile TSR over the three years ending 31 December 2018. In addition to the TSR performance condition, the Committee will need to be satisfied that the Company’s TSR performance reflects the underlying financial performance of the Company for this part of an award to vest.
Any awards granted after the 2016 AGM will, subject to shareholder approval, be granted under the 2016 LTIP (as explained in the Directors’ Remuneration Policy and Notice of AGM).

GOVERNANCE
70 71
EPS will be measured over the financial year ending 31 December 2017. The TSR element will only vest if there has been sustained improvement in the Company’s underlying financial performance over the performance period.
Details of the Chief Executive and Group Finance Director’s awards in November 2013 under the LTIP are detailed in the remuneration table on page 72.
Further, Andria Vidler purchased 2,430 shares during the period under the Share Incentive Plan. The Company matched these shares on a 1 for 2 basis, resulting in 1,215 matching shares being awarded in the period.
BOARD CHANGES AND PAYMENTS FOR LOSS OF OFFICE (AUDITED)
Patrick Taylor stepped down from the Board as Non-Executive Director and Chairman with effect from 13 May 2015. No compensation for loss of office was paid.
No Executive Directors left office in the reporting period and accordingly no compensation for loss of office was paid.
PAYMENTS TO PAST DIRECTORS (AUDITED)
Consistent with a long-standing arrangement, Graham Sherren, former Chief Executive and Chairman, was paid £3,000 during the reporting period for advisory services performed.
ANNUAL BONUS FOR THE REPORTING PERIOD (AUDITED)
The maximum annual bonus opportunity in the reporting period for Executive Directors was 100% of salary.
The actual bonus paid to Andria Vidler in respect of the reporting period was £7,106. This represented 2% of the potential opportunity over the period from 1 January 2015 to 31 December 2015. Andria Vidler’s bonus was calculated based on actual performance in the 12 months to 31 December 2015, measured against budgeted annual revenue and PBTA targets.
The actual bonus paid to Mark Kerswell in respect of the reporting period was £4,870. This represented 2% of the maximum opportunity over the period from 1 January 2015 to 31 December 2015. Mark Kerswell’s bonus was calculated based on actual performance in the 12 months to 31 December 2015, measured against budgeted annual revenue and PBTA targets.
SCHEME INTERESTS AWARDED DURING THE REPORTING PERIOD
On 26 March 2015 the Chief Executive and Group Finance Director received awards under the LTIP. These awards were in line with the policy table set out in the Policy Report and details of these awards are set out below.
Vesting will be determined by
absolute earnings per share (‘EPS’) and
total shareholder return (‘TSR’) over the
performance period.
Executive Number of awards Basis Face value of awards Performance condition Performance period
Andria Vidler 493,129 100% of £355,300 1 January 2015 to base salary 31 December 2017
Mark Kerswell 337,959 100% of £243,500 1 January 2015 to base salary 31 December 2017
The LTIP awards were structured as nil-cost options and the quantum of shares awarded was calculated using a share price of 72.05p. The performance conditions for these awards are set out below:
Performance condition % of award Targets % of award subject to condition which will vest
Absolute earnings per share (EPS) 50% EPS of 6.5p 25% EPS of 10.5p or more 100% Between 6.5p and 10.5p Straight line between 25% and 100%
Total shareholder return (TSR) 50% Median 25% against the constituents of Upper quartile 100% the FTSE SmallCap (excluding Between median Straight line between investment trusts) at 1 January 2015 and upper quartile 25% and 100%

GOVERNANCE
72 73
PERFORMANCE GRAPH
The graph below shows the total shareholder return (‘TSR’) of Centaur Media Plc compared to the performance of the FTSE SmallCap (excluding Investment Trusts) over the last five and a half years. This comparator has been chosen on the basis that it is the group against which the LTIP performance is assessed.
Total Shareholder Return. Source: Thomson Reuters Datastream
300
250
200
150
100
501-Jul-09 30-Jun-10 30-Jun-11 30-Jun-12 30-Jun-13 31-Dec-14 31-Dec-15
VALU
E
This graph shows the value, by 31 December 2015, of £100 invested in Centuar Media plc on 1 July 2009 compared with the value of £100 invested in the FTSE SmallCap Index (excluding Investment Trusts). The other points plotted represent intervening financial period ends.
Centaur Media PLC
FTSE SmallCap (Excluding Investment Trusts)
DIRECTORS’ SHAREHOLDING AND SHARE INTERESTS (AUDITED)
Share ownership plays a key role in the alignment of our executives with the interests of shareholders. The Executive Directors are expected to build up and maintain a shareholding in the Company equal to 100% of salary. Where an executive does not meet this guideline, they are required to retain at least 50% of the vested shares net of tax under the Company’s LTIP until the guideline is met.
The tables below set out details of Executive Directors’ outstanding share awards (which will vest in future years subject to performance and continued service). Under each scheme the exercise price is £nil.
Executive Scheme At 31 Granted At 31 Date of Performance Exercise Share price December during December award period period on date of 2014 period 2015 grant
Andria Vidler LTIP 618,182 - 618,182 08/11/13 01/07/13 13/03/17 £0.55 31/12/16 12/09/17 LTIP - 493,129 493,129 26/03/15 01/01/15 26/03/18 £0.72 31/12/17 25/09/18
618,182 493,129 1,111,311
Mark Kerswell LTIP 436,364 - 436,364 08/11/13 01/07/13 13/03/17 £0.55 31/12/16 12/09/17 LTIP - 337,959 337,959 26/03/15 01/01/15 26/03/18 £0.72 31/12/17 25/09/18
436,364 337,959 774,323
The table below sets out the number of shares held or potentially held by Directors (including their connected persons where relevant) as at 31 December 2015.
Director Interests in ordinary shares Shareholding Interests Total guideline in share achieved schemes
31 December 31 December LTIP 2014 2015
Executive
Andria Vidler 91,849 138,574 No 1,111,311 1,249,885Mark Kerswell 333,108 333,108 No 774,323 1,107,431
Non-Executive
Ronald Sandler - - N/A - -Christopher Satterthwaite 95,942 95,942 N/A - 95,942Robert Boyle 80,000 117,037 N/A - 117,037Rebecca Miskin - 14,800 N/A - 14,800

GOVERNANCE
74 75
RELATIVE IMPORTANCE ON THE SPEND ON PAY
The following table sets out the percentage change in distributions to shareholders and employee remuneration costs. Given the previous reporting period was for the 18 months ended 31 December 2014, the employee remuneration costs and dividend paid presented below are based on consistent 12 month period ended 31 December 2015 and 2014.
2015 2014 % Change
Employee remuneration costs £30.2m £26.2m 15%Dividends paid £4.0m £3.6m 11%
EXTERNAL DIRECTORSHIPS
The Executive Directors did not hold any external directorships in the reporting period.
THE REMUNERATION COMMITTEE
The Remuneration Committee is responsible for monitoring, reviewing and making recommendations to the Board at least annually on the broad policy for the remuneration of the Executive Directors, the Chairman and Company Secretary. It also determines their individual remuneration packages, including pension arrangements, bonuses and all incentive schemes and the determination of targets for any performance-related pay schemes operated by the Group. The Committee asks the Board, when appropriate, to seek shareholder approval for any long-term incentive arrangements, bonuses, incentive payments and any compensation payments and share option entitlements. In addition the Committee monitors and recommends the level and structure of remuneration for senior management.
During the reporting period, the Committee consisted of the following Non-Executive Directors: Rebecca Miskin (Chair), Robert Boyle, Chris Satterthwaite and Ron Sandler (from 13 May 2015). The Remuneration Committee meets at least twice each year and met three times during the reporting period. Minutes of the Committee are circulated to the Board once they have been approved by the Committee.
EXTERNAL ADVISORS
The Remuneration Committee has access to independent advice where it considers it appropriate. The Committee seeks advice relating to executive remuneration from New Bridge Street (‘NBS’), part of Aon Plc.
The Committee is satisfied that the advice received by NBS in relation to executive remuneration matters during the reporting period under review was objective and independent. NBS is a member of the Remuneration Consultants Group and abides by the Remuneration Consultants Group Code of Conduct, which requires its advice to be objective and impartial. The fees paid to NBS for providing advice in relation to executive remuneration over the reporting period were £20,188.
CHANGE IN CHIEF EXECUTIVE REMUNERATION
The table below sets out the Chief Executive single figure total remuneration over the past six and a half years.
Period Ending Chief Executive Total Annual bonus Long-term incentives remuneration (% of max) (% of max)
31 December 2015 Andria Vidler £415,707 2 N/A 31 December 201415 Andria Vidler £670,077 56 N/A (from 14/11/13)30 June 2013 Geoff Wilmot £514,92016 0 030 June 2012 Geoff Wilmot £363,321 7 030 June 2011 Geoff Wilmot £568,673 58 0 30 June 2010 Geoff Wilmot £450,180 45 0
PERCENTAGE INCREASE IN THE REMUNERATION OF THE CHIEF EXECUTIVE
The table below shows the movement in salary, benefits and annual bonus for the Chief Executive between the current and previous financial year compared to all employees of the Company. Given the previous reporting period was for the 18 months ended 31 December 2014, the information presented below is based on consistent 12 month periods ended 31 December 2015 and 2014.
Element of remuneration % Change
Salary Chief Executive 3% Employees 2%Taxable benefits Chief Executive 26% Employees 19%Annual bonus Chief Executive -97% Employees 3%
15 18 month period.
16 Excludes £384,704 termination and contractual notice payment as detailed in 30 June 2013 Report and Accounts.

GOVERNANCE
76 77
STATEMENT OF DIRECTORS’ RESPONSIBILITIES
The Directors are responsible for preparing the Annual Report, the Remuneration Report and the Financial Statements in accordance with applicable law and regulations.
Company law requires the Directors to prepare financial statements for each financial year. Under that law the Directors have prepared the Group and parent company financial statements in accordance with International Financial Reporting Standards (‘IFRSs’) as adopted by the European Union. Under company law the Directors must not approve the financial statements unless they are satisfied that they give a true and fair view of the state of affairs of the Group and the Company and of the profit or loss of the Group for that period. In preparing these financial statements, the Directors are required to:
Select suitable accounting policies and then apply them consistently;
Make judgements and accounting estimates that are reasonable and prudent;
State whether applicable IFRSs as adopted by the European Union have been followed, subject to any material departures disclosed and explained in the financial statements;
Prepare the financial statements on the going concern basis unless it is inappropriate to presume that the Company will continue in business.
The Directors are responsible for keeping adequate accounting records that are sufficient to show and explain the Company’s transactions and disclose with reasonable accuracy at any time the financial position of the Company and the Group and enable them to ensure that the financial statements and the Remuneration Committee Report comply with the Companies Act 2006 and, as regards the Group financial statements, Article 4 of the IAS Regulation. They are also responsible for safeguarding the assets of the Company and the Group and hence for taking reasonable steps for the prevention and detection of fraud and other irregularities.
The Directors are responsible for the maintenance and integrity of the Company’s website. Legislation in the United Kingdom governing the preparation and dissemination of financial statements may differ from legislation in other jurisdictions.
The Directors consider that the Annual Report and Financial Statements, taken as a whole, is fair, balanced and understandable and provides the information necessary for shareholders to assess a company’s performance, business model and strategy.
Each of the Directors, whose names and functions are listed in the Board of Directors summary on page 36, confirms that, to the best of their knowledge:
The Group financial statements, which have been prepared in accordance with IFRSs as adopted by the EU, give a true and fair view of the assets, liabilities, financial position and profit of the Group; and
The Operational Review and Financial Review, contained in the Strategic Report and the Directors’ Report contained in the Governance Report, include a fair review of the development and performance of the business and the position of the Group, together with a description of the principal risks and uncertainties that it faces.
By order of the Board
Grainne BrankinCompany Secretary 16 March 2016
STATEMENT OF SHAREHOLDER VOTING
At last year’s AGM, the Directors’ Remuneration Policy and the Remuneration Report received the following votes from shareholders:
Resolution Number of votes for Number of votes against Number of votes cast Number of votes withheld (and percentage of votes cast) (and percentage of votes cast)
Approval of Directors’ Remuneration Policy 107,719,907 (97.74%) 2,493,822 (2.26%) 110,213,729 29,838Approval of Remuneration Report 104,411,342 (94.71%) 5,830,625 (5.29%) 110,241,967 1,600
APPROVAL
The Board of Directors has approved this Remuneration Report, including both the Directors’ Remuneration Policy and Annual Report on Remuneration.
Signed on behalf of the Board of Directors
Rebecca Miskin
Chair of the Remuneration Committee 16 March 2016

INDEPENDENT AUDITORS’ REPORT
78 79
OUR AUDIT APPROACH
Overview
Overall Group materiality: £0.5 million which represents 5% of Adjusted profit before tax (as presented on the face of the Consolidated Statement of Comprehensive Income).
The Group has a centralised function in the UK which is responsible for the accounting and financial reporting of the whole Group and our audit was carried out there, covering all Group entities and the consolidation.
Goodwill and intangible assets impairment assessment; Classification and measurement of adjusting items; and Recoverability of Trade receivables.
The scope of our audit and our areas of focus
We conducted our audit in accordance with International Standards on Auditing (UK and Ireland) (‘ISAs (UK & Ireland)’).
We designed our audit by determining materiality and assessing the risks of material misstatement in the financial statements. In particular, we looked at where the directors made subjective judgements, for example in respect of significant accounting estimates that involved making assumptions and considering future events that are inherently uncertain. As in all of our audits we also addressed the risk of management override of internal controls, including evaluating whether there was evidence of bias by the directors that represented a risk of material misstatement due to fraud.
The risks of material misstatement that had the greatest effect on our audit, including the allocation of our resources and effort, are identified as “areas of focus” in the table below. We have also set out how we tailored our audit to address these specific areas in order to provide an opinion on the financial statements as a whole, and any comments we make on the results of our procedures should be read in this context. This is not a complete list of all risks identified by our audit.
INDEPENDENT AUDITORS’ REPORT TO THE MEMBERS OF CENTAUR MEDIA PLC
REPORT ON THE FINANCIAL STATEMENTSOUR OPINION
In our opinion:
Centaur Media Plc’s Group financial statements and Company financial statements (the ‘financial statements’) give a true and fair view of the state of the Group’s and of the Company’s affairs as at 31 December 2015 and of the Group’s loss and the Group’s and the Company’s cash flows for the year then ended;
the Group financial statements have been properly prepared in accordance with International Financial Reporting Standards (‘IFRSs’) as adopted by the European Union;
the Company financial statements have been properly prepared in accordance with IFRSs as adopted by the European Union and as applied in accordance with the provisions of the Companies Act 2006; and
the financial statements have been prepared in accordance with the requirements of the Companies Act 2006 and, as regards the Group financial statements, Article 4 of the IAS Regulation.
WHAT WE HAVE AUDITED
The financial statements, included within the Annual Report and Financial Statements (the ‘Annual Report’), comprise:
the Consolidated and Company Statements of Financial Position as at 31 December 2015;
the Consolidated Statement of Comprehensive Income for the year then ended;
the Consolidated and Company Cash Flow Statements for the year then ended;
the Consolidated and Company Statements of Changes in Equity for the year then ended; and
the notes to the financial statements, which include other explanatory information.
Certain required disclosures have been presented elsewhere in the Annual Report, rather than in the notes to the financial statements. These are cross-referenced from the financial statements and are identified as audited.
The financial reporting framework that has been applied in the preparation of the financial statements is applicable law and IFRSs as adopted by the European Union and, as regards the Company financial statements, as applied in accordance with the provisions of the Companies Act 2006.
MATERIALITY
AUDIT SCOPE
AREA OF FOCUS

INDEPENDENT AUDITORS’ REPORT
80 81
We found that the key assumptions were reasonable and the discount rate was within our expected range. With regard to the above procedures, including the reflection of historical levels of variance from budget into the future forecasts, we determined that the inputs to the base case Value in Use model were appropriate. This provided sufficient evidence for the impairment charge in the Professional segment. All other segments showed headroom above the carrying value of the net assets including Goodwill.
We evaluated the results and disclosure of the sensitivity analyses performed by management (as set out in Note 9). As the carrying value of the Professional segment was impaired down to the Value in Use there was no further headroom, and any unfavourable change in assumptions used in the additional sensitivities showed further impairments to Goodwill. We determined the results of these sensitivities are appropriately disclosed and the sensitivities present a fair reflection of reasonably possible changes to assumptions used in the Value in Use model. For the other segments, the sensitivities showed remaining headroom in all scenarios.
From the above procedures, we found that the evidence supported the impairment charge recognised against Goodwill and Intangible assets in the Professional segment and that the other segments are not impaired. Appropriate disclosure of management’s assumptions and sensitivity scenarios have been included in the financial statements.
AREA OF FOCUS - CLASSIFICATION AND MEASUREMENT OF ADJUSTING ITEMS
Refer to page 52 (Audit Committee Report), page 106 (Key accounting assumptions, estimates and judgements) and page 113 (Note 4).
Adjusting items are presented on the face of the Consolidated Statement of Comprehensive Income. These include ‘exceptional items’ and a number of other adjusting items which recur. Together, these items are not regarded by management as relevant to the assessment of the quality of the Group’s underlying earnings.
The Group’s accounting policy is to separate items of income and expenses as exceptional items where the nature of the item, or its size, is likely to be material and non-recurring in nature so as to provide a better understanding of the results of the operations of the Group.
The exceptional items related mainly to the Goodwill impairment charge of £11.9 million (see section above), redundancy costs of £0.6 million as part of the Group’s ongoing restructuring, a residual earn-out adjustment on settlement (£0.1 million) and accelerated amortisation charges due to early renegotiation of the Group’s financing facilities of £0.3 million. A non-recurring profit on disposal of the trade and assets of the Aidex Exhibition brand of £0.4 million is also classified as exceptional. Determining whether such items satisfy the Group’s policy for exceptional items requires a degree of management judgement and so we focused on the application of policy in this area and the appropriateness of disclosures.
Other adjusting items include amortisation charges on acquired intangible assets of £2.2 million and the annual share based payments charge of £0.7 million. These items have been historically separated from underlying profit mainly due to their non-cash nature and this is consistent with the presentation used by a number of other industry peers. Therefore there was less judgement required by management this year in determining the treatment for these items.
AREA OF FOCUS - GOODWILL AND INTANGIBLE ASSETS IMPAIRMENT ASSESSMENT
Refer to page 51 (Audit Committee Report), page 106 (Key accounting assumptions, estimates and judgements) and page 120 (Note 9).
Determining if an impairment charge is required for Goodwill and Intangible assets involves significant judgements about the future results and cash flows of the business, including forecast growth in future revenues and operating profit margins, as well as determining an appropriate Weighted Average Cost of Capital (‘WACC’) discount factor and long term growth rate. Management used a Value in Use model to compute the present value of forecast future cash flows for each segment which was then compared to the carrying value of the net assets of each segment (including Goodwill and Intangible assets) to determine if there was an impairment.
Management aggregates cash generating units (‘CGUs’) into segments which represent the level at which the cash flows of the businesses (and Goodwill) are monitored and therefore this is the level at which management performs its impairment assessment.
Market conditions remain challenging and performance has varied compared to expectations in certain parts of the business. This has been particularly the case within the Professional segment where EBITDA performance was 28% below budget. Management’s impairment assessment showed a £11.9 million impairment of Goodwill in the Professional segment which has been recognised in the financial statements.
We therefore focused on this area and the judgements applied to the revised forecasts to ensure that they appropriately factored in historical variances and market conditions. We also focused on the amount of the impairment charge recognised and checked that appropriate sensitivity disclosures were provided in the financial statements to explain any additional impairment amounts which would arise from reasonably possible changes to the model’s key assumptions.
How our audit addressed the area of focus
We checked that the allocation of CGUs to segments was consistent with internal management reporting and the prior year.
We evaluated the directors’ future cash flow forecasts for each segment, and the process by which they were drawn up. Where historical variances to budget had been unfavourable, management applied a ‘reduction factor’ to the latest Board forecast to reflect the risk of forecasting inaccuracy and any stretch in the Board forecast. The resulting forecast after application of management’s reduction factor was used in the Value in Use model.
We checked the approval of the Board’s forecast and checked that management’s additional reduction factor to this was reasonably aligned with the historical levels of budgeting inaccuracy.
We considered:
– the directors’ key assumptions including revenue and EBITDA growth rates used in the cash flow forecasts by comparing them to historical results, and economic and industry forecasts;
– the WACC discount rate by assessing the cost of capital for the group and comparable organisations; and
– the long term growth rate by comparing management’s rate to forecast long term GDP growth in the UK and industry growth reports and then sensitising management’s Value in Use model for reductions in this rate.

INDEPENDENT AUDITORS’ REPORT
82 83
AREA OF FOCUS - RECOVERABILITY OF TRADE RECEIVABLES
Refer to page 52 (Audit Committee Report), page 106 (Key accounting assumptions, estimates and judgements) and page 125 (Note 14).
As set out in the Financial Review on page 33 and the Audit Committee Report on page 52, the launch of a new financial system in the second half of the year caused operational disruption and led to an extended period of weaker cash collections and ledger control. As a result of this the ageing of trade receivables increased, and at the year end a significant portion of older invoices remained uncollected. At 31 December 2015, trade receivables over 90 days past due date was £5.0 million (2014: £0.5 million) and the associated provision for impairment of trade receivables was £0.9 million (2014: £0.2 million) and a further £1.4 million (2014: £0.3 million) was in the 61-90 day category with no provision (2014: £0.1 million).
The determination of whether trade receivables are collectable involves management judgement. Accordingly, with regard to the amount of aged trade receivables at the year end, we considered whether management’s judgements were appropriate and reflected the latest available evidence.
We also considered the application of management’s policy for providing against aged trade receivables and whether this had been consistently applied year on year. Management recognise provisions for impairment of trade receivables based on specific known facts or circumstances surrounding the invoice or customers’ abilities to pay. For example, certain trade receivables may be being pursued through legal avenues and these are wholly provided against. An additional provision is then recognised based on the general history of write-offs.
How our audit addressed the area of focus
We were able to confirm that the policy for providing against trade receivables had been implemented consistently year on year.
For the year end balance, we tested:
The ageing of trade receivables and that this was accurately determined;
The accuracy of management’s computations of general provisions reflecting history of bad debt write-offs. This included checking that amounts excluded from this computation were appropriate, such as amounts invoiced in advance of exhibitions (where there is an associated liability held within deferred revenue);
A sample of aged trade receivables where no provision was recognised to check management’s evidence for these being deemed collectable; and
The levels of post year end cash received and allocated against aged trade receivables at the year end.
We discussed with management their view that operational disruptions following the implementation of the new financial system were a specific driver of the extended ageing of trade receivables at the year end. We understood the measures management have taken since year end to address this issue, which included increasing the resource headcount within the credit control team who are focused on collecting cash.
Based on post year end cash collections, there still remained a portion of the trade receivables balance which was over 60 days overdue at year end and not provided, and not yet collected. At the end of February 2016 this amounted to £2.0 million (excluding VAT). We considered this residual exposure against the circumstances giving rise to the ageing, the ongoing actions taken and in place to collect the aged debt (and what has been achieved to date), together with the history of write-offs in the business. As noted, determining an appropriate level of provision at the year end is a judgemental area. We concluded that, whilst there remains a residual exposure, the evidence obtained supports the level of provision at the year end of £0.9 million.
How our audit addressed the area of focus
We considered whether the exceptional items recorded were non-recurring in nature and recognised and presented in accordance with the Group’s disclosed accounting policy.
Our work in relation to each type of exceptional item is summarised below.
Goodwill impairment charge – refer to our work described in the section above ‘Goodwill and Intangible assets impairment assessment’. With regard to the quantum of this charge and the expectation that it is not a recurring item each year, we agreed it is appropriate to separate this item as exceptional.
Redundancy costs – these include redundancy payments made to certain members of senior management as part of the Group’s restructuring of certain segment reporting lines and roles. We tested the accuracy and completeness of the costs incurred, including checking the actual payments made to those employees. We also checked that these positions were removed from the Group’s structure permanently, checking that these costs did not just relate to replacing specific individuals.
Residual earn-out charge – the costs of acquisition related earn-out provisions, including any subsequent adjustments to these estimates, have been treated as exceptional items historically. This year’s charge relates to a final adjustment to the VBR earn-out provided on final settlement. We agreed the final settlement amount to the agreement and concluded that classifying this item as exceptional is appropriate and consistent with prior years’ treatments of such items.
Finance facility renegotiation costs – we tested the accuracy of this accelerated amortisation charge. The amortisation charge has historically been recorded within underlying earnings and therefore we challenged management as to whether separating this cost as an exceptional item this year was appropriate. In management’s view the quantum of this cost was significantly higher this year due to it being accelerated following early renegotiation of financing facilities. A normal level of amortisation for the new facility fees is included within underlying earnings, and the incremental portion this year was therefore in management’s view non-recurring. We accepted this position and assessed the disclosures to check this was clearly explained in the financial statements.
Aidex disposal - we checked the accuracy of the gain on disposal and agreed with the separation of the gain on disposal of Aidex as exceptional due to its non-recurring nature.
Redundancy costs had been incurred in both the current year and in prior years so we challenged management as to whether such costs were therefore non-recurring in nature. Management’s view was that the redundancy decisions in 2015 were particularly significant, as evidenced by the high cost per individual, and that they formed part of the restructuring that had occurred over recent years, the costs of which were exceptional. On this basis we accepted this treatment for the current year.
In respect of other adjusting items, including the amortisation of acquired intangibles and the share based payments charge, we checked management’s computations of the costs.
We also assessed whether the disclosures within the financial statements provide sufficient detail to understand the nature of these items and found these are appropriate. From the evidence obtained, we concurred with management’s assessment to classify and disclose these items as exceptional or other adjusting items, in line with the disclosed accounting policy.

INDEPENDENT AUDITORS’ REPORT
84 85
OTHER REQUIRED REPORTINGCONSISTENCY OF OTHER INFORMATION
Companies Act 2006 opinion
In our opinion, the information given in the Strategic Report and the Directors’ Report sections of the Performance Report and Governance sections of the Annual Report for the financial year for which the financial statements are prepared, is consistent with the financial statements.
ISAs (UK & Ireland) reporting
Under ISAs (UK & Ireland) we are required to report to you if, in our opinion:
information in the Annual Report is: - materially inconsistent with the information in the audited financial statements; or - apparently materially incorrect based on, or materially inconsistent with, our knowledge of the Group
and Company acquired in the course of performing our audit; or - otherwise misleading.
the statement given by the directors on page 55, in accordance with provision C.1.1 of the UK Corporate Governance Code (the ‘Code’), that they consider the Annual Report taken as a whole to be fair, balanced and understandable and provides the information necessary for members to assess the Group’s and Company’s position and performance, business model and strategy is materially inconsistent with our knowledge of the Group and Company acquired in the course of performing our audit.
the section of the Annual Report on page 51, as required by provision C.3.8 of the Code, describing the work of the Audit Committee does not appropriately address matters communicated by us to the Audit Committee.
THE DIRECTORS’ ASSESSMENT OF THE PROSPECTS OF THE GROUP AND OF THE PRINCIPAL RISKS THAT WOULD THREATEN THE SOLVENCY OR LIQUIDITY OF THE GROUP
Under ISAs (UK & Ireland) we are required to report to you if we have anything material to add or to draw attention to in relation to:
the directors’ confirmation on page 13 of the Annual Report, in accordance with provision C.2.1 of the Code, that they have carried out a robust assessment of the principal risks facing the Group, including those that would threaten its business model, future performance, solvency or liquidity.
the disclosures in the Annual Report that describe those risks and explain how they are being managed or mitigated.
the directors’ explanation on page 15 of the Annual Report, in accordance with provision C.2.2 of the Code, as to how they have assessed the prospects of the Group, over what period they have done so and why they consider that period to be appropriate, and their statement as to whether they have a reasonable expectation that the Group will be able to continue in operation and meet its liabilities as they fall due over the period of their assessment, including any related disclosures drawing attention to any necessary qualifications or assumptions.
Under the Listing Rules we are required to review the directors’ statement that they have carried out a robust assessment of the principal risks facing the Group and the directors’ statement in relation to the longer-term viability of the Group. Our review was substantially less in scope than an audit and only consisted of making inquiries and considering the directors’ process supporting their statements; checking that the statements are in alignment with the relevant provisions of the Code; and considering whether the statements are consistent with the knowledge acquired by us in the course of performing our audit. We have nothing to report having performed our review.
How we tailored the audit scope
We tailored the scope of our audit to ensure that we performed enough work to be able to give an opinion on the financial statements as a whole, taking into account the geographic structure of the Group, the accounting processes and controls, and the industry in which the Group operates.
The Group operates a centralised accounting function in the UK that is responsible for processing transactions for all entities within the Group, and for consolidated financial reporting.
The whole Group was audited by the UK audit team at the centralised accounting function which is based in London.
Materiality
The scope of our audit was influenced by our application of materiality. We set certain quantitative thresholds for materiality. These, together with qualitative considerations, helped us to determine the scope of our audit and the nature, timing and extent of our audit procedures on the individual financial statement line items and disclosures and in evaluating the effect of misstatements, both individually and on the financial statements as a whole.
Based on our professional judgement, we determined materiality for the financial statements as a whole as follows:
Overall Group materiality £0.5 million (2014: £0.5 million).
How we determined it 5% of Adjusted profit before tax (as presented on the face of the Consolidated Statement of Comprehensive Income).
Rationale for benchmark applied We believe that Adjusted profit before tax provides us with a consistent period on period basis for determining materiality and eliminates the disproportionate effect of a small number of items on the benchmark, which was also used last year.
We agreed with the Audit Committee that we would report to them misstatements identified during our audit above £24,500 (2014: £24,000) as well as misstatements below that amount that, in our view, warranted reporting for qualitative reasons.
Going concern
Under the Listing Rules we are required to review the directors’ statement, set out on page 43, in relation to going concern. We have nothing to report having performed our review.
Under ISAs (UK & Ireland) we are required to report to you if we have anything material to add or to draw attention to in relation to the directors’ statement about whether they considered it appropriate to adopt the going concern basis in preparing the financial statements. We have nothing material to add or to draw attention to.
As noted in the directors’ statement, the directors have concluded that it is appropriate to adopt the going concern basis in preparing the financial statements. The going concern basis presumes that the Group and Company have adequate resources to remain in operation, and that the directors intend them to do so, for at least one year from the date the financial statements were signed. As part of our audit we have concluded that the directors’ use of the going concern basis is appropriate. However, because not all future events or conditions can be predicted, these statements are not a guarantee as to the Group’s and Company’s ability to continue as a going concern.
We have no exceptions to report.
We have nothing material to add or to draw attention to.
We have nothing material to add or to draw attention to.
We have nothing material to add or to draw attention to.
We have no exceptions to report.
We have no exceptions to report.

INDEPENDENT AUDITORS’ REPORT
86 87
WHAT AN AUDIT OF FINANCIAL STATEMENTS INVOLVES
An audit involves obtaining evidence about the amounts and disclosures in the financial statements sufficient to give reasonable assurance that the financial statements are free from material misstatement, whether caused by fraud or error. This includes an assessment of:
whether the accounting policies are appropriate to the Group’s and the Company’s circumstances and have been consistently applied and adequately disclosed;
the reasonableness of significant accounting estimates made by the directors; and
the overall presentation of the financial statements.
We primarily focus our work in these areas by assessing the directors’ judgements against available evidence, forming our own judgements, and evaluating the disclosures in the financial statements.
We test and examine information, using sampling and other auditing techniques, to the extent we consider necessary to provide a reasonable basis for us to draw conclusions. We obtain audit evidence through testing the effectiveness of controls, substantive procedures or a combination of both.
In addition, we read all the financial and non-financial information in the Annual Report to identify material inconsistencies with the audited financial statements and to identify any information that is apparently materially incorrect based on, or materially inconsistent with, the knowledge acquired by us in the course of performing the audit. If we become aware of any apparent material misstatements or inconsistencies we consider the implications for our report.
Philip Stokes (Senior Statutory Auditor)
for and on behalf of PricewaterhouseCoopers LLP Chartered Accountants and Statutory Auditors London
16 March 2016
Other matters:
The maintenance and integrity of the Centaur Media Plc website is the responsibility of the directors; the work carried out by the auditors does not involve consideration of these matters and, accordingly, the auditors accept no responsibility for any changes that may have occurred to the financial statements since they were initially presented on the website.
Legislation in the United Kingdom governing the preparation and dissemination of financial statements may differ from legislation in other jurisdictions.
ADEQUACY OF ACCOUNTING RECORDS AND INFORMATION AND EXPLANATIONS RECEIVED
Under the Companies Act 2006 we are required to report to you if, in our opinion:
we have not received all the information and explanations we require for our audit; or
adequate accounting records have not been kept by the Company, or returns adequate for our audit have not been received from branches not visited by us; or
the Company financial statements and the part of the Remuneration Committee Report to be audited are not in agreement with the accounting records and returns.
We have no exceptions to report arising from this responsibility.
DIRECTORS’ REMUNERATION
Remuneration Committee Report - Companies Act 2006 opinion
In our opinion, the part of the Remuneration Committee Report to be audited has been properly prepared in accordance with the Companies Act 2006.
Other Companies Act 2006 reporting
Under the Companies Act 2006 we are required to report to you if, in our opinion, certain disclosures of directors’ remuneration specified by law are not made. We have no exceptions to report arising from this responsibility.
CORPORATE GOVERNANCE STATEMENT
Under the Listing Rules we are required to review the part of the Corporate Governance Statement relating to ten further provisions of the Code. We have nothing to report having performed our review.
RESPONSIBILITIES FOR THE FINANCIAL STATEMENTS AND THE AUDITOUR RESPONSIBILITIES AND THOSE OF THE DIRECTORS
As explained more fully in the Statement of Directors’ Responsibilities set out on page 77, the directors are responsible for the preparation of the financial statements and for being satisfied that they give a true and fair view.
Our responsibility is to audit and express an opinion on the financial statements in accordance with applicable law and ISAs (UK & Ireland). Those standards require us to comply with the Auditing Practices Board’s Ethical Standards for Auditors.
This report, including the opinions, has been prepared for and only for the Company’s members as a body in accordance with Chapter 3 of Part 16 of the Companies Act 2006 and for no other purpose. We do not, in giving these opinions, accept or assume responsibility for any other purpose or to any other person to whom this report is shown or into whose hands it may come save where expressly agreed by our prior consent in writing.

FINANCIAL STATEMENTS
88 89
FINANCIAL STATEMENTS
88 89
CONSOLIDATED STATEMENT OF CHANGES IN EQUITY FOR THE YEAR ENDED 31 DECEMBER 2015
ATTRIBUTABLE TO OWNERS OF THE PARENT COMPANY
Reserve for shares Share Own Share to be Deferred Retained Total capital shares premium issued shares earnings equity £m £m £m £m £m £m £m
Balance at 30 June 2013 15.0 (10.1) 0.7 3.9 0.1 72.0 81.6 Profit for the period and other comprehensive income - - - - - 10.5 10.5 Transactions with owners: Dividends (note 25) - - - - - (5.8) (5.8)Employee Benefit Trust - (0.2) - - - - (0.2)Shares options exercised - 0.2 - - - - 0.2 Fair value of employee services (note 24) - - - 0.5 - - 0.5
As at 31 December 2014 15.0 (10.1) 0.7 4.4 0.1 76.7 86.8 Loss for the year and other comprehensive loss - - - - - (6.9) (6.9)Transactions with owners: Dividends (note 25) - - - - - (4.0) (4.0)Fair value of employee services (note 24) - - - 0.5 - 0.5
As at 31 December 2015 15.0 (10.1) 0.7 4.9 0.1 65.8 76.4
At 31 December 2015, 6,472,990 (2014: 6,535,973) 10p ordinary shares are held in treasury and 473,859 (2014: 616,373) 10p ordinary shares are held in an employee benefit trust.
The 800,000 deferred shares of 10p each carry restricted voting rights and carry no right to receive a dividend payment in respect of any financial year.
The changes to the reserve for shares to be issued represent the total charges for the period relating to equity-settled share-based payment transactions with employees as accounted for under IFRS 2.
CONSOLIDATED STATEMENT OF COMPREHENSIVE INCOME FOR THE YEAR ENDED 31 DECEMBER 2015
Adjusted Adjusting Statutory Adjusted Adjusting Statutory Results Items Results Results Items Results Year ended Year ended Year ended 18 months 18 months 18 months 31 December 31 December 31 December ended 30 June ended 30 June ended 30 June 2015 2015 2015 2014 2014 2014 Note £m £m £m £m £m £m Revenue 2 70.5 - 70.5 105.6 - 105.6 Net operating expenses 3 (60.0) (15.2) (75.2) (93.9) (10.6) (104.5)
Operating profit / (loss) 10.5 (15.2) (4.7) 11.7 (10.6) 1.1 Profit on disposal of subsidiary 33 - - - - 14.7 14.7 Finance costs 5 (0.7) (0.2) (0.9) (1.6) (2.9) (4.5)
Profit / (loss) before tax 9.8 (15.4) (5.6) 10.1 1.2 11.3 Taxation (expense) / credit 7 (1.9) 0.6 (1.3) (2.1) 1.3 (0.8)
Profit / (loss) for the period attributable to owners of the parent 7.9 (14.8) (6.9) 8.0 2.5 10.5
Total comprehensive income / (loss) attributable to owners of the parent 7.9 (14.8) (6.9) 8.0 2.5 10.5 Earnings per share attributable to owners of the parent 8 Basic 5.5p (4.8)p 5.6p 7.4p Fully diluted 5.3p (4.8)p 5.5p 7.2p

FINANCIAL STATEMENTS
90 91
COMPANY STATEMENT OF CHANGES IN EQUITY FOR THE YEAR ENDED 31 DECEMBER 2015
ATTRIBUTABLE TO OWNERS OF THE COMPANY
Reserve Share Own Share for shares Deferred Retained Total capital shares premium to be issued shares earnings equity £m £m £m £m £m £m £m Balance at 30 June 2013 15.0 (8.4) 0.7 3.9 0.1 109.1 120.4 Total comprehensive loss for the period - - - - - (2.5) (2.5)Transactions with owners: Dividends (note 25) - - - - - (5.8) (5.8)Shares options exercised - 0.2 - - - - 0.2 Fair value of employee services (note 24) - - - 0.5 - - 0.5 As at 31 December 2014 15.0 (8.2) 0.7 4.4 0.1 100.8 112.8 Total comprehensive loss for the year - - - - - (2.0) (2.0)Transactions with owners: Dividends (note 25) - - - - - (4.0) (4.0)Fair value of employee services (note 24) - - - 0.5 - - 0.5 As at 31 December 2015 15.0 (8.2) 0.7 4.9 0.1 94.8 107.3
The Company has taken advantage of the exemption available under section 408 of the Companies Act 2006 and has not presented its own statement of comprehensive income in these financial statements. The parent company’s loss for the year amounted to £2.0m (2014: loss of £2.5m).
CONSOLIDATED STATEMENT OF FINANCIAL POSITION AS AT 31 DECEMBER 2015
REGISTERED NUMBER 04948078
31 December 31 December 2015 2014 Note £m £m Non-current assets Goodwill 9 78.1 90.0 Other intangible assets 10 18.3 19.9 Property, plant and equipment 11 2.3 2.5 Deferred income tax assets 22 0.6 0.8 99.3 113.2 Current assets Inventories 13 2.0 1.8 Trade and other receivables 14 25.0 15.7 Cash and cash equivalents 15 3.1 3.4 30.1 20.9 Total assets 129.4 134.1 Current liabilities Trade and other payables 18 (12.4) (11.0)Deferred income 19 (17.0) (15.3)Current income tax liabilities 20 (0.9) (0.2)Borrowings 16 (1.1) 0.1 Provisions 21 - (1.1) (31.4) (27.5) Net current liabilities (1.3) (6.6) Non-current liabilities Borrowings 16 (20.9) (18.1)Deferred income tax liabilities 22 (0.7) (1.7) (21.6) (19.8) Net assets 76.4 86.8 Capital and reserves attributable to owners of the parent Share capital 23 15.0 15.0 Own shares (10.1) (10.1)Share premium 0.7 0.7 Other reserves 5.0 4.5 Retained earnings 65.8 76.7 Total equity 76.4 86.8 The financial statements on pages 88 to 140 were approved by the Board of Directors on 16 March 2015 and were signed on its behalf by:
Mark Kerswell Group Finance Director

FINANCIAL STATEMENTS
92 93
COMPANY STATEMENT OF FINANCIAL POSITION AS AT 31 DECEMBER 2015
REGISTERED NUMBER 04948078
31 December 31 December 2015 2014 Note £m £m Non-current assets Investments 12 134.0 134.0 134.0 134.0 Current assets Trade and other receivables 14 2.7 2.1 Cash and cash equivalents 15 - - 2.7 2.1 Total assets 136.7 136.1 Current liabilities Trade and other payables 18 (8.5) (5.3)Borrowings 16 - 0.1 (8.5) (5.2) Net current (liabilities) / assets (5.8) (3.1) Non-current liabilities Borrowings 16 (20.9) (18.1) (20.9) (18.1) Net assets 107.3 112.8 Capital and reserves attributable to owners of the parent Share capital 23 15.0 15.0 Own shares (8.2) (8.2)Share premium 0.7 0.7 Other reserves 5.0 4.5 Retained earnings 94.8 100.8 Total equity 107.3 112.8
The financial statements on pages 90 to 140 were approved by the Board of Directors on 16 March 2015 and were signed on its behalf by:
Mark Kerswell Group Finance Director
CONSOLIDATED CASH FLOW STATEMENT FOR THE YEAR ENDED 31 DECEMBER 2015
Year ended 18 months ended 31 December 31 December 2015 2014 Note £m £m Cash flows from operating activities Cash generated from operations 26 6.1 17.5 Tax paid (1.4) (2.5) Net cash generated from operating activities 4.7 15.0 Cash flows from investing activities Other acquisitions - settlement of deferred consideration 21 (0.1) (19.6)Disposal of subsidiary 33 - 23.2 Disposal of trade and other assets 4 0.4 -Other disposals - deferred consideration received - 0.3 Purchase of property, plant and equipment 11 (0.5) (1.7)Purchase of intangible assets 10 (2.8) (4.8) Net cash flows used in investing activities (3.0) (2.6) Cash flows from financing activities Purchase of own shares - employee benefit trust - (0.2)Exercise of share options settled through treasury shares - 0.2 Interest paid (0.9) (1.5)Repayment of obligations under finance lease - (0.3)Dividends paid 25 (4.0) (5.8)Proceeds of borrowings 26 21.0 -Repayment of borrowings 26 (18.1) (4.7) Net cash flows used in financing activities (2.0) (12.3) Net (decrease) / increase in cash and cash equivalents (0.3) 0.1 Cash and cash equivalents at 31 December / 1 July 3.4 3.3 Cash and cash equivalents at 31 December 15 3.1 3.4

FINANCIAL STATEMENTS
94 95
COMPANY CASH FLOW STATEMENT FOR THE YEAR ENDED 31 DECEMBER 2015
18 months Year Ended ended 31 December 31 December 2015 2014 Note £m £m Cash flows from operating activities Cash generated from operating activities 26 2.0 10.2 Cash flows from financing activities Interest paid (0.9) -Exercise of share options settled through treasury shares - 0.2 Dividends paid 25 (4.0) (5.8)Proceeds of borrowings 26 21.0 -Repayment of borrowings 26 (18.1) (4.7) Net cash flows used in financing activities (2.0) (10.3) Net (decrease) / increase in cash and cash equivalents - (0.1) Cash and cash equivalents at 31 December / 1 July - 0.1 Cash and cash equivalents at 31 December 15 - -
NOTES TO THE FINANCIAL STATEMENTS
1 SUMMARY OF SIGNIFICANT ACCOUNTING POLICIES
This principal accounting policies adopted in the preparation of these consolidated and Company financial statements are set out below, to the extent they have not already been disclosed in the other notes below. These policies have been consistently applied to all the periods presented, unless otherwise stated. The financial statements are for the Group consisting of Centaur Media Plc and its subsidiaries. Centaur Media Plc is a public company limited by shares and incorporated in England and Wales.
(A) BASIS OF PREPARATION
The consolidated and Company financial statements have been prepared in accordance with International Financial Reporting Standards (‘IFRS’) as adopted by the European Union and IFRS Interpretations Committee (‘IFRS IC’) and with those parts of the Companies Act 2006 applicable to companies reporting under IFRS. The financial statements have been prepared on the historical cost basis.
Going concern
The financial statements have been prepared on a going concern basis. The Directors have carefully assessed the Group’s ability to continue trading, and have a reasonable expectation that the Group and Company have adequate resources to continue in operational existence for at least twelve months from the date of approval of these financial statements
Net debt at 31 December 2015 amounted to £17.9m (31 December 2014: £14.7m). In June 2015, the Group agreed a four year £25m multi-currency revolving credit facility with the Royal Bank of Scotland and Lloyds, which runs to 31 August 2019. While cash conversion during 2015 was disappointing, the Directors consider this to be short term in nature, and working capital trends are expected to improve into 2016. The business model is expected to return to being highly cash-generative in the future.
The Group has net current liabilities which arise from its normal high levels of deferred income relating to events in the future rather than an inability to service its liabilities. An assessment of cash flows for the next three financial years, which has taken into account the factors described above, has indicated an expected level of cash generation which would be sufficient to allow the Group to fully satisfy its working capital requirements, to cover all principal areas of expenditure, including maintenance, capital expenditure and taxation during this period, and to meet the financial covenants under the revolving credit facility.
The preparation of financial statements in accordance with IFRS requires the use of estimates and assumptions that affect the reported amounts of assets and liabilities at the date of the financial statements and the reported amounts of revenues and expenses during the reporting period. Although these estimates are based on management’s best knowledge of the amount, events or actions, the actual results may ultimately differ from those estimates.
The Company has taken advantage of the exemption available under section 408 of the Companies Act 2006 and has not presented its own statement of comprehensive income in these financial statements.
FINANCIAL STATEMENTS
96 97
1 SUMMARY OF SIGNIFICANT ACCOUNTING POLICIES (CONTINUED)
(A) BASIS OF PREPARATION (CONTINUED)
(i) New and amended standards adopted by the Group
None of the new standards and amendments to standards that are mandatory for the first time for the financial year commencing 1 January 2015 affected any of the amounts recognised in the current period or any prior period, and is not likely to affect future periods.
(ii) New standards and interpretations not yet adopted
The following new accounting standards and interpretations have been published that are not mandatory for 31 December 2015 reporting periods and have not been early adopted by the Group:
• IFRS 9: Financial Instruments is a new standard which enhances the ability of investors and other users of financial information to understand the accounting for financial assets and reduces complexity. The standard uses a single approach to determine whether a financial asset is measured at amortised cost or fair value, replacing the various rules in IAS 39. This standard is effective for accounting periods commencing on or after 1 January 2018.
• IFRS 15: Revenue from Contracts with Customers is a new standard based on a five-step model framework, which replaces all existing revenue recognition standards. The standard requires revenue to depict the transfer of promised goods or services to customers in an amount that reflects the consideration to which the entity expects to be entitled in exchange for those goods or services. This standard is effective for accounting periods commencing on or after 1 January 2018.
• IFRS 16: Leases – is a new standard which sets out the principles for the recognition, measurement, presentation and disclosure of leases for both parties to a contract. The standard eliminates the classification of leases as either operating leases or finance leases as required by IAS 17 and, instead, introduces a single lessee accounting model. A lessee will be required to recognise assets and liabilities for all leases with a term of more than 12 months and depreciate lease assets separately from interest on lease liabilities in the income statement. This standard is effective for accounting periods commencing on or after 1 January 2019.
The Directors anticipate that the adoption of these standards and interpretations in future periods may have a significant impact on the financial statements of the Group.
There are no other standards that are not yet effective and that would be expected to have a material impact on the entity in the current or future reporting periods and on foreseeable future transactions.
(B) PRESENTATION OF NON-STATUTORY MEASURES
The Directors believe that adjusted results and adjusted earnings per share provide additional useful information on the on-going operations of the Group to shareholders. The term ‘adjusted’ is not a defined term under IFRS and may not therefore be comparable with similarly titled profit measurements reported by other companies. It is not intended to be a substitute for, or superior to, IFRS measurements of profit.
The principal adjustments are made in respect of:
• Exceptional costs - the Group considers items of income and expenses as exceptional items and excludes them from the adjusted results where the nature of the item, or its size, is likely to be material and non-recurring in nature so as to assist the user of the financial statements to better understand the results of the operations of the Group. Details of exceptional items are shown in note 4.
• Amortisation of acquired intangibles – the Group amortises all intangible assets. The amortisation charge for those intangible assets recognised on the acquisition of a subsidiary is excluded from the adjusted results of the Group so as to assist the user of the financial statements to better understand the results of the underlying trading of the Group. The amortisation of intangible software assets acquired other than through the acquisition of a subsidiary is included in the adjusted results. Details of amortisation of intangibles are shown in note 10.
• Share-based payments – share-based payment expenses are excluded from the adjusted results of the Group, so as to assist the user of the financial statements to better understand the results of the underlying trading of the Group.
• Profit on disposal of subsidiaries or other lines of business - the profit on disposal of subsidiary in the 18 months ended 31 December 2014 related to Perfect Information Limited. Economic control was transferred on 31 May 2014. On 6 February 2015, the Group sold the trade and assets of the Aidex Exhibition brand sitting within the Professional segment for total consideration of £0.4m generating a profit on disposal of £0.4m.
• Exceptional finance costs – exceptional finance costs in 2015 relate to the Group’s refinancing in June 2015. In the prior period the Group discounted provisions to the net present value where the effects of such discounting were material. The discounting on provisions relating to deferred contingent considerations deriving from acquisitions is excluded from adjusted results of the Group so as to assist the user of the financial statements to better understand the results of the operations of the Group. Details of the exceptional finance costs are shown in note 4.
• Impairment – any charge resulting from the impairment of goodwill is excluded from the adjusted results of the Group in order to assist the user of the financial statements to better understand the results of the underlying trading of the Group.
The tax related to adjusting items is the tax effect of the items above that are allowable deductions for tax purposes, calculated using the standard rate of corporation tax.
Further details of adjusting items are included in note 4.

FINANCIAL STATEMENTS
98 99
1 SUMMARY OF SIGNIFICANT ACCOUNTING POLICIES (CONTINUED)
(B) PRESENTATION OF NON-STATUTORY MEASURES (CONTINUED)
Adjusting operating profit reconciles to (loss) / profit before tax as follows:
Year ended 18 months ended 31 December 31 December 2015 2014 Note £m £mAdjusted operating profit 10.5 11.7 Finance costs 5 (0.7) (1.6) Adjusted profit before tax 9.8 10.1 Adjusting items Exceptional operating costs (excluding impairment and profit on disposal) 4 (0.8) (6.7) Exceptional impairment of goodwill 9 (11.9) - Exceptional profit on disposal of subsidiary 33 - 14.7 Exceptional profit on disposal of trade and assets 4 0.4 - Amortisation of acquired intangibles 4 (2.2) (3.4) Share-based payments 24 (0.7) (0.5) Exceptional finance costs 4 (0.2) (2.9) (Loss) / profit before tax (5.6) 11.3
(C) PRINCIPLES OF CONSOLIDATION
The consolidated financial statements incorporate the financial statements of Centaur Media Plc and all of its subsidiaries after elimination of intercompany transactions.
(i) Subsidiaries
Subsidiaries are all entities controlled by the Group. The Group controls an entity when the Group is exposed to, or has rights to, variable returns from its involvement with the entity and has the ability to affect those returns through its power to direct the activities of the entity. Subsidiaries are fully consolidated from the date on which control is transferred to the Group. They are deconsolidated from the date that control ceases.
Intercompany transactions, balances and unrealised gains on transactions between Group companies are eliminated. The accounting policies of subsidiaries are consistent with the policies adopted by the Group.
Non-controlling interests in the results and equity of subsidiaries are shown separately in the consolidated statement of profit or loss, statement of comprehensive income, statement of changes in equity and balance sheet respectively.
(ii) Business Combinations
The acquisition method of accounting is used to account for all business combinations. The consideration transferred for acquisition of a subsidiary is measured at the aggregate of fair values of assets transferred, liabilities incurred or assumed to the former owners of the acquired business and equity interests issued by the Group in exchange for control of the subsidiary. Acquisition-related costs incurred are expensed as incurred and included in the Consolidated Statement of Comprehensive Income.
Any deferred consideration to be transferred by the acquirer is recognised at fair value. If the conditions attached to the consideration indicate that the payment forms part of the acquisition, a provision is made for the future liability at the acquisition date. Where the deferred consideration is contingent on the continued employment of the vendors, such arrangements are recognised in the Consolidated Statement of Comprehensive Income on a straight line basis over the life of the earn-out. Subsequent changes to the fair value of the contingent consideration are recognised in accordance with IAS 39 through the Consolidated Statement of Comprehensive Income.
The excess of the aggregate consideration transferred, amount of any non-controlling interest in the acquired entity, and acquisition date fair value of any previous equity interest in the acquired entity over the fair value of the assets acquired is recorded as goodwill.
(D) FOREIGN CURRENCY TRANSLATION
(i) Functional and presentation currency
Items included in the financial statements of each of the Group’s entities are measured using the currency of the primary economic environment in which the entity operates (‘the functional currency’). The consolidated financial statements are presented in Great British Pounds, which is the Group and Company’s functional and presentation currency.
(ii) Transactions and balances
Foreign currency transactions are translated into the functional currency using the exchange rates at the dates of the transactions. Foreign exchange gains and losses resulting from the settlement of such transactions and from the translation of monetary assets and liabilities denominated in foreign currencies at year end exchange rates are recognised in profit or loss.
(iii) Group Companies
The results and financial position of the Group entities that have a functional currency different from the presentation currency are translated into the presentation currency as follows:
• assets and liabilities for each balance sheet presented are translated at the closing rate at the date of that balance sheet;
• income and expenses for each income statement are translated at average exchange rates (unless this average is not a reasonable approximation of the cumulative effect of the rates prevailing on the transaction dates, in which case income and expenses are translated at the rate on the dates of the transactions); and
• all resulting exchange differences are recognised in other comprehensive income.
On consolidation, exchange differences arising from the translation of the net investment in foreign operations, and of borrowings, are recognised in other comprehensive income. When a foreign operation is sold, exchange differences that were recorded in equity are recognised in the income statement as part of the gain or loss on sale.
Goodwill and fair value adjustments arising on the acquisition of a foreign entity are treated as assets and liabilities of the foreign entity and translated at the closing rate.
FINANCIAL STATEMENTS
100 101
1 SUMMARY OF SIGNIFICANT ACCOUNTING POLICIES (CONTINUED)
(E) REVENUE RECOGNITION
Revenue is measured at the fair value of the consideration received or receivable and represents amounts recoverable by the Group for the sales of advertising space, subscriptions and individual publications and revenue from events provided in the normal course of business, net of discounts and value added tax.
The Group recognises revenue when the amount of revenue can be reliably measured, it is probable that future economic benefits will flow to the entity and specific criteria have been met for each of the Group’s activities as described below.
Sales of advertising space are recognised in the period in which publication occurs. Sales of publications are recognised in the period in which the sale is made. Sales of online advertising are recognised in the period in which the advertisements are placed. Revenue received in advance for events is deferred and recognised in the period in which the event takes place.
Revenue from subscriptions to publications and digital services is deferred and recognised on a straight-line basis over the subscription period.
(F) INVESTMENTS
In the Company’s financial statements, investments in subsidiaries are stated at cost less provision for impairment in value.
(G) INCOME TAX
The tax expense represents the sum of current and deferred tax.
Current tax is based on the taxable profit for the period. Taxable profit differs from profit as reported in the statement of comprehensive income because it excludes items of income or expense that are taxable or deductible in other years, and it further includes items that are never taxable or deductible. The Group and Company’s liability for current tax is calculated using tax rates that have been enacted or substantively enacted by the balance sheet date.
Deferred tax is provided in full, using the liability method, on temporary differences between the carrying amounts of assets and liabilities in the consolidated financial statements and the corresponding tax bases used in the computation of taxable profit. Deferred tax liabilities are generally recognised for all taxable temporary differences and deferred tax assets are recognised to the extent that it is probable that taxable profits will be available to utilise those temporary differences and losses. Such assets and liabilities are not recognised if the temporary difference arises from goodwill or the initial recognition (other than in a business combination) of other assets and liabilities in a transaction that affects neither the tax profit nor the accounting profit.
Deferred tax is calculated at the enacted or substantively enacted tax rates that are expected to apply in the period when the liability is settled or the asset is realised. Deferred tax is charged or credited to the statement of comprehensive income, except when it relates to items charged or credited directly to equity, in which case the deferred tax is recognised in other comprehensive income.
(H) LEASES
Agreements under which payments are made to owners in return for the right to use an asset for a period are accounted for as leases. Leases that transfer substantially all of the risks and rewards of ownership are recognised at the commencement of the lease term as finance leases within property, plant and equipment and debt at the fair value of the leased asset or, if lower, at the present value of the minimum lease payments. Finance lease payments are apportioned between interest expense and repayments of debt. All other leases are classified as operating leases and the cost is recognised in income on a straight-line basis.
(I) IMPAIRMENT OF ASSET
Assets that are subject to depreciation or amortisation are reviewed for impairment whenever events indicate that the carrying value may not be recoverable. An impairment loss is recognised to the extent that the carrying value exceeds the higher of the asset’s fair value less cost to sell and its value in use. An asset’s value in use is calculated by discounting an estimate of future cash flows by the Group’s pre-tax weighted average cost of capital.
(J) INVENTORIES
Inventories are stated at the lower of cost and net realisable value. Cost is calculated using the first in, first out method. Work in progress comprises costs incurred relating to publications, exhibitions and conferences prior to the publication date or the date of the event.
(K) PROPERTY, PLANT AND EQUIPMENT
Property, plant and equipment is stated at historical cost less accumulated depreciation and impairment losses. The historical cost of property, plant and equipment is the purchase cost together with any incidental direct costs of acquisition. Depreciation is calculated to write off the cost, less estimated residual value, of assets, on a straight line-basis over the expected useful economic lives to the Group over the following periods:
Leasehold improvements - 10 years or the expected length of the lease if shorter
Fixtures and fittings - 10 years
Computer equipment - 3 - 5 years
Residual values, where applicable, are reviewed annually against prevailing market rates at the balance sheet date for equivalent aged assets and depreciation rates adjusted accordingly on a prospective basis. An asset’s carrying amount is written down immediately to its recoverable amount if the asset’s carrying amount is greater than its estimated recoverable amount. Each year, a review of the estimated useful economic life of each asset is carried out to ensure depreciation rates are adequate.

FINANCIAL STATEMENTS
102 103
1 SUMMARY OF SIGNIFICANT ACCOUNTING POLICIES (CONTINUED)
(L) INTANGIBLE ASSETS
(i) Goodwill
Where the cost of a business acquisition exceeds the fair values attributable to the separable net assets acquired, the resulting goodwill is capitalised and allocated to the cash-generating unit (‘CGU’) or groups of CGUs that are expected to benefit from the synergies of the business combination. Goodwill has an indefinite useful life and is tested for impairment annually on a Group level or whenever events or changes in circumstances indicate that the carrying amount may not be recoverable.
Each brand is deemed to be a CGU. Goodwill is attributed to groups of CGUs but is reviewed at the segment level for the purposes of the Group’s annual impairment review as this is the level that management monitors goodwill. Goodwill and acquired intangible assets are tested for impairment in accordance with IAS 36. In assessing whether a write-down of goodwill and acquired intangible assets is required, the carrying value of the segment is compared with its recoverable amount. Recoverable amount is measured based on value-in-use. Any impairment is recognised in the statement of comprehensive income and is classified as an exceptional item. Impairment of goodwill is not subsequently reversed.
On the disposal of a CGU, the attributable amount of goodwill is included in the determination of the profit and loss on disposal.
(ii) Brands and publishing rights, customer relationships and non-compete arrangements
Separately acquired brands and publishing rights are shown at historical cost. Brands and publishing rights, customer relationships and non-compete arrangements acquired in a business combination are recognised at fair value at the acquisition date. They have a finite useful life and are subsequently carried at cost less accumulated amortisation and impairment losses.
(iii) Software
Computer software that is not integral to the operation of the related hardware is carried at cost less accumulated amortisation. Costs associated with the development of identifiable and unique software products controlled by the Group that will generate probable future economic benefits in excess of costs are recognised as intangible assets when the criteria of IAS 38 ‘Intangible Assets’ are met. They are carried at cost less accumulated amortisation and impairment losses.
(iv) Amortisation methods and periods
Amortisation is calculated to write off the cost or fair value of assets on a straight-line basis over the expected useful economic lives to the Group over the following periods:
Computer software - 3 - 5 years
Brands and publishing rights - 20 years
Customer relationships - 10 years or the length of the contract if shorter
Websites and content - 3 - 5 years
Non-compete arrangements - Over the term of the arrangement
(M) EMPLOYEE BENEFITS
(i) Post-employment obligations
The Group and Company contribute to a defined contribution pension scheme for the benefit of employees. The assets of the scheme are held separately from those of the Group in an independently administered fund. Contributions to defined contribution schemes are charged to the statement of comprehensive income when employer contributions become payable.
(ii) Share-based payments
The Group operates a number of equity-settled share-based compensation plans for its employees. The fair value of the share-based compensation expense is estimated using a Monte Carlo option pricing model and is recognised in the statement of comprehensive income over the vesting period with a corresponding increase in equity. The total amount to be expensed is determined by reference to the fair value of the awards granted:
• including any market performance conditions;
• excluding the impact of any service and non-market performance vesting conditions (for example, profitability, sales growth targets and remaining an employee of the entity over a specified time period); and
• including the impact of any non-vesting conditions (for example, the requirement for employees to save).
The total expense is recognised over the vesting period, which is the period over which all of the specified vesting conditions are to be satisfied. At the end of each reporting period, the Group revises its estimates of the number of options that are expected to vest based on the non-market vesting and service conditions. It recognises the impact of the revision to original estimates, if any, in the statement of comprehensive income, with a corresponding adjustment to equity.
The Company issues new shares or transfers shares from treasury to settle share-based compensation awards.
The award by the Company of share-based compensation awards over its equity instruments to the employees of subsidiary undertakings in the Group is treated as a capital contribution. The fair value of employee services received, measured by reference to the grant date fair value, is recognised over the vesting period as an increase to investment in subsidiary undertakings, with a corresponding credit to equity.

FINANCIAL STATEMENTS
104 105
1 SUMMARY OF SIGNIFICANT ACCOUNTING POLICIES (CONTINUED)
(N) PROVISIONS
Provisions are recognised when the Group has a present obligation (legal or constructive) as a result of a past event; it is probable that an outflow of resources will be required to settle the obligation can be reliably estimated.
Provisions for deferred contingent consideration are based on the Directors’ best estimate of the future liability. Where the deferred consideration is contingent on the continued employment of the vendors, such arrangements are recognised in the Consolidated Statement of Comprehensive Income on a straight line basis over the period of the arrangement.
(O) SHARE CAPITAL AND SHARE PREMIUM
Ordinary and deferred shares are classified as equity. The excess of consideration received in respect of shares issued over the nominal value of those shares is recognised in the share premium account.
The Company also holds a non-distributable reserve representing the fair value of unvested share-based compensations plans.
(P) DIVIDENDS
Dividends are recognised as a liability in the period in which they are paid or approved by the shareholders in the annual general meeting.
(Q) SEGMENTAL REPORTING
Operating segments are reported in a manner consistent with the internal reporting provided to the chief operating decision-maker. The Executive Committee has been identified as the chief operating decision-maker, responsible for allocating resources and assessing performance of the operating segments. The Group operates in four market-facing divisions: Marketing, Financial Services, Professional, and Home Interest.
(R) FINANCIAL INSTRUMENTS
The Group has applied IFRS 7, Financial Instruments: Disclosures, and IAS 39, Financial Instruments: Recognition and Measurement, as outlined below:
(i) Financial assets
The Group classifies its financial assets in the following categories where relevant: at fair value through profit or loss; loans and receivables; and available-for-sale. The classification depends on the purpose for which the financial assets were acquired. Management determines the classification of its financial assets at initial recognition.
All of the Group’s financial assets have been classified as loans and receivables. Loans and receivables are non-derivative financial assets with fixed or determinable payments that are not quoted in an active market. They are included in current assets, except for maturities greater than 12 months after the balance sheet date. These are classified as non-current assets. The Group’s loans and receivables comprise trade and other receivables and cash and cash equivalents in the balance sheet. Loans and receivables are carried at amortised cost using the effective interest method.
(ii) Trade receivables
Trade receivables are recognised initially at fair value and subsequently measured at amortised cost using the effective interest method, less provision for impairment.
A provision for impairment of trade receivables is established when there is objective evidence that the Group will not be able to collect all amounts due according to the original terms of the receivables. Significant financial difficulties of the debtor, probability that the debtor will enter bankruptcy or financial reorganisation and default or delinquency in payments (more than 90 days overdue) are considered indicators that the trade receivable is impaired. The amount of the provision is the difference between the asset’s carrying amount and the present value of estimated future cash flows, discounted at the original effective interest rate. The carrying amount of the asset is reduced through the use of an allowance account, and the amount of the loss is recognised in the statement of comprehensive income within net operating expenses. When a trade receivable is uncollectible, it is written off against the allowance account for trade receivables. Subsequent recoveries of amounts previously written off are credited against net operating expenses in the statement of comprehensive income.
(iii) Cash and cash equivalents
Cash and cash equivalents includes cash in hand and deposits repayable on demand or maturing within three months of the balance sheet date
(iv) Financial liabilities
Debt and trade payables are recognised initially at fair value based on amounts exchanged, net of transaction costs, and subsequently at amortised cost.
Interest expense on debt is accounted for using the effective interest method and, is recognised in income.
(v) Trade payables
Trade payables are recognised initially at fair value and subsequently measured at amortised cost using the effective interest method.
(vi) Borrowings
Borrowings are recognised at fair value, net of transaction costs incurred and carried subsequently at amortised cost. Costs of borrowings are recognised in the statement of comprehensive income as incurred or, where appropriate, across the term of the related borrowing.
(vii) Derivative financial instruments
The Group does not hold any derivative financial instruments either for trading purposes or designated as hedges.

FINANCIAL STATEMENTS
106 107
1 SUMMARY OF SIGNIFICANT ACCOUNTING POLICIES (CONTINUED)
(S) KEY ACCOUNTING ASSUMPTIONS, ESTIMATES AND JUDGEMENTS
The preparation of financial statements under IFRS requires the use of certain key accounting assumptions and requires management to exercise its judgement and to make estimates. The areas where assumptions and estimates are significant to the consolidated financial statements are as follows:
i) Carrying value of goodwill and other intangible assets
In assessing whether goodwill and other intangible fixed assets are impaired, the Group uses a discounted cash flow model which includes forecast cash flows and estimates of future growth. If the results of operations in future periods are lower than included in the cash flow model, impairments may be triggered. Further details of the assumptions and sensitivities in the discounted cash flow model are included in note 9.
Intangible assets arising on the acquisition of subsidiaries are identified based on the Group’s understanding of the acquired subsidiary and previous experience of similar businesses. Consistent methods of valuation for similar types of intangible asset are applied where possible and appropriate, using information reviewed at Board level where available. Discount rates applied in calculating the values of intangible assets arising on the acquisition of subsidiaries are calculated specifically for each acquisition, and adjusted to reflect the respective risk profile of each individual asset based on the Group’s past experience of similar assets.
ii) Recoverability of trade receivables
The recoverability of trade receivables requires judgement. The Group uses all available evidence to determine the appropriate level of provision to record for impairment of trade receivables, including known disputes, historical trends in write-offs, collections post year end and the ageing of the receivables balance. Further details about trade receivables are included in note 14.
iii) Adjusting items
The term ‘adjusted’ is not a defined term under IFRS. Judgement is required to ensure that the classification and presentation of certain items as adjusting, including exceptional items, is appropriate and consistent with the Group’s accounting policy. Further details about the amounts classified as adjusting are included in note 4.
2 SEGMENTAL REPORTING
The Executive Committee has been identified as the chief operating decision-maker, reviewing the Group’s internal reporting on a monthly basis in order to assess performance and allocate resources.
The Group is organised around four market-facing segments: Marketing, Financial Services, Home Interest and Professional. Corporate costs are allocated to these segments on an appropriate basis depending on the nature of the cost.
Segment assets consist primarily of property, plant and equipment, intangible assets including goodwill, inventories and trade receivables. Segment liabilities comprise trade payables, accruals and deferred income.
Corporate assets and liabilities comprise current and deferred tax balances, cash and cash equivalents and borrowings.
Capital expenditure comprises additions to property, plant and equipment, intangible assets and includes additions resulting from acquisitions through business combinations.

FINANCIAL STATEMENTS
108 109
2 SEGMENTAL REPORTING (CONTINUED)
Marketing Financial Services Home Interest Professional Group £m £m £m £m £mYear ended 31 December 2015 Revenue 27.0 12.0 11.8 19.7 70.5 Adjusted operating profit 4.1 2.1 2.1 2.2 10.5 Amortisation of acquired intangibles (1.5) (0.3) (0.3) (0.1) (2.2)Impairment of goodwill - - - (11.9) (11.9)Exceptional costs (0.1) (0.2) (0.2) (0.3) (0.8) Segment result 2.5 1.6 1.6 (10.1) (4.4) Profit on disposal of trade and assets 0.4Share-based payments (0.7) Operating loss (4.7) Finance costs (0.9) Loss before tax (5.6) Taxation (1.3) Loss for the year from continuing operations (6.9) Segment assets 57.1 17.9 15.2 30.6 120.8Corporate assets 8.6 Consolidated total assets 129.4 Segment liabilities (17.5) (3.3) (1.6) (4.3) (26.7)Corporate liabilities (26.3) Consolidated total liabilities (53.0) Other items Capital expenditure (tangibles and intangibles) 1.4 0.5 0.6 0.9 3.4
Marketing Financial Services Home Interest Professional Group £m £m £m £m £m18 months ended 31 December 2014 Revenue 37.6 17.6 15.8 34.6 105.6 Adjusted operating profit 4.0 2.6 1.9 3.2 11.7 Amortisation of acquired intangibles (2.6) (0.3) (0.2) (0.3) (3.4)Exceptional costs (2.5) (3.3) (0.2) (0.7) (6.7) Segment result (1.1) (1.0) 1.5 2.2 1.6 Share-based payments (0.5) Operating profit 1.1 Profit on disposal of subsidiary 14.7 Finance costs (4.5) Profit before tax 11.3 Taxation (0.8) Profit for the period from continuing operations 10.5 Segment assets 56.9 17.4 13.2 42.5 130.0 Corporate assets 4.1 Consolidated total assets 134.1 Segment liabilities (12.5) (1.7) (3.7) (9.6) (27.5)Corporate liabilities (19.8) Consolidated total liabilities (47.3) Other items Capital expenditure (tangibles and intangibles) 3.2 0.7 0.6 2.0 6.5

FINANCIAL STATEMENTS
110 111
2 SEGMENTAL REPORTING (CONTINUED)
Revenue by Geographical Location The Group’s revenues from external customers by geographical location are detailed below.
Year ended 18 months ended 31 December 31 December 2015 2014 £m £m United Kingdom 64.1 90.7Europe (excluding United Kingdom) 2.4 4.1North America 2.5 7.7Rest of world 1.5 3.1 70.5 105.6
Substantially all of the Group’s net assets are located in the United Kingdom. The Directors therefore consider that the Group currently operates in a single geographical segment, being the United Kingdom.
The Group’s revenue by type is as follows:
Year ended 18 months ended 31 December 31 December 2015 2014 £m £mSale of goods: Paid-for content 19.9 31.2 Live events 27.2 39.3 Advertising 22.5 33.7 Other 0.9 1.4 70.5 105.6
3 NET OPERATING EXPENSES
Operating profit / (loss) is stated after charging / (crediting):
Adjusted Adjusting Statutory Adjusted Adjusting Statutory Results Items Results Results Items Results Year ended Year ended Year ended 18 months 18 months 18 months 31 31 31 ended 31 ended 31 ended 31 December December December December December December 2015 2015 2015 2014 2014 2014 Note £m £m £m £m £m £m Net foreign exchange gains - - - (0.1) - (0.1)Employee benefits expense 6 30.2 - 30.2 40.5 - 40.5Depreciation of property, plant and equipment 11 0.9 - 0.9 1.2 - 1.2 Amortisation of intangible assets 10 2.1 2.2 4.3 3.3 3.4 6.7 Exceptional impairment of goodwill 9 - 11.9 11.9 - - - Other exceptional operating costs 4 - 0.8 0.8 - 6.7 6.7 Operating lease rentals 1.8 - 1.8 3.2 - 3.2 Repairs and maintenance expenditure - - - 0.1 - 0.1 Trade receivables impairment 14 0.2 - 0.2 0.8 - 0.8Share-based payment expense 24 - 0.7 0.7 - 0.5 0.5 Exceptional profit on disposal of trade 4 - (0.4) (0.4) - - -and assets Other operating expenses* 24.8 - 24.8 44.9 - 44.9 60.0 15.2 75.2 93.9 10.6 104.5 Cost of sales 33.2 - 33.2 56.3 - 56.3 Distribution costs 1.3 - 1.3 2.6 - 2.6 Administrative expenses 25.5 15.2 40.7 35.0 10.6 45.6 60.0 15.2 75.2 93.9 10.6 104.5
* Within the other operating expenses category, rental income for the sub-lease of properties under leases totalled £0.6m (2014: £0.6m).

FINANCIAL STATEMENTS
112 113
3 NET OPERATING EXPENSES (CONTINUED)
Services provided by the Company’s auditor
18 months Year ended ended 31 December 31 December 2015 2014 £’000 £’000 Fees payable to the Company’s auditors for the audit of parent company and consolidated financial statements 139 126 Fees payable to the Company’s auditors and its associates for other services: The audit of the Company’s subsidiaries pursuant to legislation 30 40 Total audit fees 169 166 Audit related assurance services 28 54 Taxation compliance services 131 78 Other taxation advisory services 104 138 Other assurance services 10 51 Corporate finance services - 153 Total non-audit fees 273 474 442 640
The corporate finance fees in 2014 related to the provision of reporting accountant services in the shareholder circular prepared for the disposal of Perfect Information Limited.
4 ADJUSTING ITEMS
As discussed in note 1, certain items are presented as adjusting. These are detailed below.
18 months Year ended ended 31 December 31 December 2015 2014 £m £mRestructuring costs Redundancies 0.6 0.9 Post closure costs - 0.3 0.6 1.2 Acquisition-related costs - 0.2 Deferred contingent consideration 0.1 5.0 Other 0.1 0.3 Exceptional operating costs (excluding impairment and profit on disposal) 0.8 6.7 Exceptional impairment of goodwill 11.9 - Exceptional profit on disposal of trade and assets (0.4) - Amortisation of acquired intangibles 2.2 3.4 Share-based payments 0.7 0.5 Adjusting items to operating profit 15.2 10.6Exceptional profit on disposal of subsidiary - (14.7) Exceptional finance costs 0.2 2.9 Adjusting items to profit before tax 15.4 (1.2)Tax relating to adjusting items (0.6) (1.3) Total adjusting items after tax 14.8 (2.5)

FINANCIAL STATEMENTS
114 115
4 ADJUSTING ITEMS (CONTINUED)
EXCEPTIONAL COSTS
Restructuring costs
In 2015 these comprise redundancy costs of £0.6m as a result of further specific restructuring activities. In 2014, costs comprised of redundancy costs of £0.9m and product closure costs.
Goodwill impairment
Impairment of goodwill relates to the write down during the year of goodwill in the Professional segment (note 9).
Acquisition-related costs
In 2014 acquisition-related costs related to legal and professional fees.
Deferred contingent consideration
The charge in the period relates to an increase in the deferred contingent consideration associated with the acquisition of Venture Business Research Limited (‘VB Research’).
The costs in the prior period related to contingent consideration associated with the acquisition of Investment Platforms Limited (‘IPL’) (£2.7m) and VB Research (£0.3m) in 2012. An additional £2.0m was charged in relation to the Econsultancy.com Limited (‘Econsultancy’) as part of its early settlement in June 2014. The deferred considerations for IPL and Econsultancy were settled in 2014.
Profit on disposal of trade and assets
On 6 February 2015, the Group sold the trade and assets of the Aidex Exhibition brand sitting within the Professional segment for total consideration of £0.4m. Profit on disposal was £0.4m.
Exceptional finance costs
Current period costs of £0.2m relate to unamortised facility costs £0.1m and legal fees of £0.1m associated with refinancing of the Group’s revolving credit facility.
The prior period cost related to the accelerated unwinding of the discounting on the Econsultancy deferred contingent consideration provision.
Other exceptional costs
In the prior period, costs included a credit in relation to the unwinding of the discount of the deferred consideration receivable on disposed trading assets of £0.1m, offset by costs incurred in relation to assignment of a lease for £0.1m, and other items.
OTHER ADJUSTING ITEMS
Other adjusting items relate to the amortisation of acquired intangibles and share-based payment costs. Further details are presented in note 1.
5 FINANCE COSTS
Year 18 months ended 31 ended 31 December December 2015 2014 £m £m
Interest payable on revolving credit facility 0.5 1.2 Commitment fees and amortisation of arrangement fee in respect of revolving credit facility 0.2 0.4 Total interest expense 0.7 1.6 Exceptional finance costs 0.2 2.9 0.9 4.5
Exceptional finance costs in 2015 relate to unamortised facility costs (£0.1m) and legal fees (£0.1m) associated with the refinancing of the Group’s revolving credit facility. In 2014, the exceptional finance costs related to the accelerated unwinding of the discount on the Econsultancy deferred contingent consideration provision.

FINANCIAL STATEMENTS
116 117
6 DIRECTORS AND EMPLOYEES
Year ended 18 months Year ended 18 months 31 ended 31 31 ended 31 December December December December 2015 2014 2015 2014 Group Group Company Company £m £m £m £m Wages and salaries 25.6 34.5 1.2 1.7 Social security costs 3.0 4.4 0.2 0.2 Other pension costs 0.9 1.1 - - Equity-settled share-based payments (note 24) 0.7 0.5 0.7 0.3 30.2 40.5 2.1 2.2 Exceptional redundancy costs (note 4) 0.6 0.9 - - 30.8 41.4 2.1 2.2
The average monthly number of employees employed during the period, including Directors, was:
Year 18 months ended 31 ended 31 December December 2015 2014 Group Group Number Number
Marketing 146 171 Financial Services 42 55 Home Interest 59 62 Professional 78 112 Central 239 184 564 584
Key management compensation
Year ended 18 months ended 31 December 31 December 2015 2014 £m £m Salaries and short term employment benefits 1.9 3.4Termination benefits 0.3 - Post-employment benefits 0.1 0.2 Share-based payments 0.4 0.4 2.7 4.0
Key management is defined as the Executive Directors and Executive Committee members.
Aggregate Directors’ remuneration
Year ended 18 months ended 31 December 31 December 2015 2014 £m £m Salaries, fees, bonuses and benefits in kind 1.0 1.7 Gains on exercises of share options - 0.1 Amounts receivable under long term incentive schemes 0.2 0.3 Money purchase pension contributions 0.1 0.1 1.3 2.2
Further details of Directors’ remuneration are included in the Remuneration Committee Report starting on page 58. Details of the emoluments of the highest paid Director are shown on page 69 of the Remuneration Committee Report.

FINANCIAL STATEMENTS
118 119
7 TAXATION
Year ended 18 months ended 31 31 December December 2015 2014 £m £mAnalysis of charge for the period Current tax UK Corporation Tax 1.5 1.5 Overseas tax 0.5 0.2 Adjustments in respect of prior period 0.1 (0.2) 2.1 1.5 Deferred tax (note 22) Current period (0.8) (0.5) Adjustments in respect of prior period - (0.2) (0.8) (0.7) Taxation 1.3 0.8
The tax charge for the year can be reconciled to the (loss) / profit in the statement of comprehensive income as follows:
Year ended 18 months ended 31 December 31 December 2015 2014 £m £m (Loss) / profit before tax (5.6) 11.3 Tax at the UK rate of corporation tax of 20.25% (2014: 22%) (1.1) 2.5 Effects of: Expenses not deductible for tax purposes 0.1 1.9 Goodwill impairment not deductible 2.4 -Income not subject to tax - (3.2)Effects of changes in tax rate on deferred tax balances (0.1) (0.2)Reversal of timing differences (0.6) -Adjustments in respect of prior period 0.1 (0.4)Effect of different tax rates of subsidiaries in other jurisdictions 0.5 0.2 1.3 0.8
The Finance Act 2013 included legislation to reduce the main rate of corporation tax from 21% to 20% from 1 April 2015. Accordingly the Company’s results for this accounting period will be taxed at a blended rate of 20.25%. This change had been substantively enacted at the balance sheet date and the Group’s deferred tax balances are therefore recorded at 20%. Further changes to the UK corporation tax rates were announced in the Chancellor’s Budget on 8 July 2015. These include reductions to the main rate to 19% from 1 April 2017 and to 18% from 1 April 2020. As these changes had been substantively enacted at the balance sheet date their effects are included in these financial statements in measuring deferred tax balances.
8 EARNINGS PER SHARE
Basic earnings per share (‘EPS’) is calculated by dividing the earnings attributable to ordinary shareholders by the weighted average number of shares in issue during the year. 473,859 (2014: 616,373) shares held in the employee benefit trust and 6,472,990 (2014: 6,535,973) shares held in treasury have been excluded in arriving at the weighted average number of shares.
For diluted earnings per share the weighted average number of ordinary shares in issue is adjusted to assume conversion of all potentially dilutive ordinary shares. This comprises share options and awards (including those granted under the Sharesave plan) granted to Directors and employees where the exercise price is less than the average market price of the Company’s ordinary shares during the year.
Basic and diluted earnings per share have also been presented on an adjusted basis, as the Directors believe that this measure is more reflective of the underlying performance of the Group.
Year ended 31 Year 18 months 18 months December ended 31 ended 31 ended 31 2015 December Year December December 18 months Earnings 2015 ended 31 2014 2014 ended 31 attributable Weighted December Earnings Weighted December to owners average 2015 attributable average 2014 of the number of Earnings to owners of number of Earnings parent shares per share the parent shares per share
£m millions Pence £m millions Pence Basic (6.9) 143.2 (4.8) 10.5 142.5 7.4 Effect of dilutive securities Options* - - - - 2.8 (0.2) Diluted (6.9) 143.2 (4.8) 10.5 145.3 7.2 Adjusted Basic (6.9) 143.2 (4.8) 10.5 142.5 7.4 Amortisation of acquired intangibles (excluding software) (note 10) 2.2 1.5 3.4 2.4 Exceptional finance costs 0.2 0.1 2.9 2.0 Exceptional operating costs (note 4) 0.8 0.6 6.7 4.7 Share-based payments 0.7 0.5 0.5 0.3 Impairment of goodwill 11.9 8.3 - -Profit on disposal of trade and assets (0.4) (0.3) - -Profit on disposal of subsidiary - - (14.7) (10.3)Tax effect of above adjustments (0.6) (0.4) (1.3) (0.9) Adjusted basic 7.9 143.2 5.5 8.0 142.5 5.6 Effect of dilutive securities Options - 4.5 (0.2) - 2.8 (0.1) Adjusted diluted 7.9 147.7 5.3 8.0 145.3 5.5
*Due to the reported loss during 2015, the effect of share options and awards is not dilutive

FINANCIAL STATEMENTS
120 121
9 GOODWILL
Group Total £mCost At 1 July 2013 164.0Disposal of subsidiary (note 33) (8.9) At 31 December 2014 and 31 December 2015 155.1 Accumulated impairment At 1 July 2013 and 31 December 2014 65.1 Charge for the year 11.9 At 31 December 2015 77.0 Net book amount At 1 July 2013 98.9 At 31 December 2014 90.0 At 31 December 2015 78.1
Goodwill by segment
Each brand is deemed to be a Cash Generating Unit (‘CGU’), being the lowest level for which cash flows are separately identifiable. Goodwill is attributed to individual CGUs but is reviewed at the segment level for the purposes of the annual impairment review as this is the level at which management monitors goodwill. The majority of the Group’s goodwill arose on the acquisition of the Centaur Communications group in 2004.
Goodwill is allocated to segments as follows:
Marketing Financial Services Home Interest Professional Total £m £m £m £m £m At 31 December 2015 36.7 12.3 7.5 21.6 78.1 At 31 December 2014 36.7 12.3 7.5 33.5 90.0
Impairment testing of goodwill and acquired intangible assets
During the period, goodwill and acquired intangible assets were tested for impairment in accordance with IAS 36. In assessing whether a write-down of goodwill and acquired intangible assets is required, the carrying value of the segment is compared with its recoverable amount. Recoverable amount is measured based on value-in-use.
The Group estimates the value-in-use of its CGUs using a discounted cash flow model, which adjusts the cash flows for risks associated with the assets and discounts these using a pre-tax rate of 13.2% (2014: 13.2%). The discount rate used is consistent with the Group’s weighted average cost of capital and is used across all segments, which all are based predominantly in the UK and considered to have similar risks and rewards.
The key assumptions used in calculating value-in-use are revenue growth, margin, adjusted EBITDA, discount rate and the terminal growth rate. The Group has used formally approved forecasts for the first three years of the calculation and applied a terminal growth rate of 2.25% (2014: 2.25%). This timescale and the terminal growth rate
are both considered appropriate given the cyclical nature of the Group’s revenues.
The assumptions used in the calculations of value-in-use for each segment have been derived based on a combination of past experience and management’s expectations of future growth rates in the business.
At 31 December 2015, before impairment testing, goodwill of £36.7m, £12.3m and £7.5m and £33.5m was allocated to the Marketing, Financial Services, Home Interest and Professional segments respectively. The portfolios reported within the Professional segment, including HR and Engineering, have been affected by weaker print and advertising trends leading to a more moderate growth outlook. The goodwill relating to the Professional segment has therefore been reduced to its recoverable amount through recognition of an impairment loss of £11.9m.
For the remaining segments, Marketing, Financial and Home Interest, the value-in-use calculations comfortably exceed the carrying values in the sensitivity scenarios.
Sensitivity analysis has been performed on the value-in-calculations, holding all other variables constant, to:
(i) apply a 5% reduction to forecast EBITDA in each year of the modelled cash flows. This would result in a further impairment of £1.2m in the Professional segment. No impairment would occur in any of the other segments.
(ii) apply a 0.5 percentage points increase in discount rate from 13.2% to 13.7%. This would result in a further impairment of £1.0m in the Professional segment. No impairment would occur in any of the other segments.
(iii) reduce the terminal value growth rate from 2.25% to 2.00%. This would result in a further impairment of £0.4m in the Professional segment. No impairment would occur in any of the other segments.

FINANCIAL STATEMENTS
122 123
10 OTHER INTANGIBLE ASSETS
Separately Brands acquired and websites Non- Computer publishing Customer and compete software rights* relationships* content* arrangements* Total £m £m £m £m £m £m Cost At 1 July 2013 19.2 5.6 11.6 4.7 0.5 41.6 Additions - separately acquired 2.8 - - - - 2.8 Additions - internally generated 2.0 - - - - 2.0 Disposal of subsidiary (note 33) (7.2) - - - - (7.2)Disposals (7.3) - - - - (7.3) At 31 December 2014 9.5 5.6 11.6 4.7 0.5 31.9 Additions - separately acquired 1.7 - - - - 1.7Additions - internally generated 1.2 - - - - 1.2Disposals (1.5) - - - - (1.5) At 31 December 2015 10.9 5.6 11.6 4.7 0.5 33.3 Accumulated amortisation At 1 July 2013 12.6 1.1 2.3 1.3 0.5 17.8 Amortisation charge for the period 3.3 0.4 1.7 1.3 - 6.7 Disposal of subsidiary (note 33) (5.2) - - - - (5.2)Disposals (7.3) - - - - (7.3) At 31 December 2014 3.4 1.5 4.0 2.6 0.5 12.0 Amortisation charge for the year 2.1 0.2 1.2 0.8 - 4.3Disposals (1.3) - - - - (1.3) At 31 December 2015 4.2 1.7 5.2 3.4 0.5 15.0 Net book value at 31 December 2015 6.7 3.9 6.4 1.3 - 18.3 Net book value at 31 December 2014 6.1 4.1 7.6 2.1 - 19.9 Net book value at 1 July 2013 6.6 4.5 9.3 3.4 - 23.8
* Amortisation of acquired intangibles is presented as an adjusting item.
The Company has no intangible assets (2014: £nil). Amortisation of intangible assets is included in net operating expenses in the Statement of Comprehensive Income.
11 PROPERTY, PLANT AND EQUIPMENT
Leasehold Fixtures Computer improvements and fittings equipment Total £m £m £m £m Cost At 1 July 2013 3.6 3.1 2.0 8.7 Additions 0.9 0.1 0.7 1.7 Disposal of subsidiary (0.1) - (0.5) (0.6)Disposals (1.5) (2.3) (1.5) (5.3)
At 31 December 2014 2.9 0.9 0.7 4.5 Additions 0.1 0.2 0.5 0.8Disposals (0.9) (0.5) (0.3) (1.7) At 31 December 2015 2.1 0.6 0.9 3.6 Accumulated depreciation At 1 July 2013 2.9 2.3 1.5 6.7 Depreciation charge for the period 0.3 0.5 0.4 1.2 Disposal of subsidiary (0.2) - (0.4) (0.6)Disposals (1.5) (2.3) (1.5) (5.3) At 31 December 2014 1.5 0.5 - 2.0 Depreciation charge for the year 0.3 0.2 0.4 0.9Disposals (0.8) (0.5) (0.3) (1.6) At 31 December 2015 1.0 0.2 0.1 1.3 Net book value at 31 December 2015 1.1 0.4 0.8 2.3 Net book value at 31 December 2014 1.4 0.4 0.7 2.5 Net book value at 1 July 2013 0.7 0.8 0.5 2.0
The Company has no property, plant and equipment (2014: £nil).

FINANCIAL STATEMENTS
124 125
12 INVESTMENTS
Investments in subsidiary undertakings £mCompany Cost At 1 July 2013, 31 December 2014 and 31 December 2015 146.2 Accumulated impairment At 1 July 2013, 31 December 2014 and 31 December 2015 12.2 Net book amount At 1 July 2013, 31 December 2014 and 31 December 2015 134.0
Proportion of ordinary shares Name held and voting rights Principal activities Country of incorporation % Ascent Publishing Limited 100 Digital and print publishing United KingdomCentaur Communications Limited 1 100 Holding company and agency services United KingdomCentaur Consumer Exhibitions Limited 100 Exhibitions United KingdomChiron Communications Limited 100 Digital information, training and events United KingdomE-consultancy.com Limited 100 Digital information, training and events United KingdomE-consultancy Asia Pacific Pty Limited 100 Digital information, training and events SingaporeE-consultancy Australia Pty Ltd 100 Digital information, training and events AustraliaE-consultancy LLC 100 Digital information, training and events United StatesInvestment Platforms Limited 100 Research data and analysis United KingdomMayfield Publishing Ltd 100 Investment company United KingdomPro-talk Ltd 100 Digital Publishing United KingdomTaxbriefs Holdings Limited 100 Holding company United KingdomTaxbriefs Limited 100 Digital and print publishing United KingdomThe Forum for Expatriate Management Limited 100 Events and information services United KingdomThe Forum for Expatriate Management Incorporated 100 Events and information services United StatesThe Profile Group (UK) Limited 100 Digital information services United KingdomThe Profile Group (US) Incorporated 100 Dormant United StatesYour Business Magazine Limited 100 Investment company United KingdomVenture Business Research Limited 100 Research data and analysis United Kingdom
1 Directly owned by Centaur Media Plc
The consolidated financial statements incorporate the financial statements of all entities controlled by the Company at 31 December 2015.
13 INVENTORIES
31 December 31 December 2015 2014 Group Group £m £m Work in progress 2.0 1.8
The Company had no inventory at 31 December 2015 (2014: £nil).
14 TRADE AND OTHER RECEIVABLES
31 December 31 December 31 December 31 December 2015 2014 2015 2014 Group Group Company Company £m £m £m £m Amounts falling due within one year Trade receivables 20.8 11.9 - - Less: provision for impairment of receivables (0.9) (0.5) - - Trade receivables - net 19.9 11.4 - -Employee benefit trust - - 2.5 1.8 Other receivables 2.3 1.4 0.2 0.3 Prepayments 1.7 1.7 - - Accrued income 1.1 1.2 - - 25.0 15.7 2.7 2.1
The ageing of trade receivables according to their original due date is detailed below:
31 December 31 December 31 December 31 December 2015 2015 2014 2014 Gross Provision Gross Provision £m £m £m £m Not due 9.0 - 6.9 - 0-30 days 3.7 - 2.8 - 31-60 days 1.7 - 1.4 (0.2)61-90 days 1.4 - 0.3 (0.1)Over 90 days 5.0 (0.9) 0.5 (0.2) 20.8 (0.9) 11.9 (0.5)
Within the balance is an amount relating to future revenues of £6.1m (2014: £4.6m) which forms part of deferred income in note 19.
The movement in the provision for impairment of receivables is detailed below:
Year ended 18 months 31 ended December 31 December 2015 2014 Group Group £m £m Balance at start of period 0.5 0.2 Utilised (0.2) (0.5)Additional provision charged to the statement of comprehensive income 0.6 0.8 0.9 0.5
The Group’s policy requires customers to pay in accordance with agreed payment terms, which are generally 30 days from the date of invoice or, in the case of live events related revenue, no less than 30 days before the event. All credit and recovery risk associated with trade receivables has been provided for in the balance sheet. The Group’s policy for recognising an impairment loss is given in note 1. Impairment losses are taken through administrative expenses in the statement of comprehensive income.
The Directors consider the carrying value of trade and other receivables approximates to their fair value.

FINANCIAL STATEMENTS
126 127
15 CASH AND CASH EQUIVALENTS
31 December 31 December 31 December 31 December 2015 2014 2015 2014 Group Group Company Company £m £m £m £m
Cash at bank and in hand 3.1 3.4 - -
16 BORROWINGS
31 December 31 December 31 December 31 December 2015 2014 2015 2014 Group Group Company Company £m £m £m £m Current liabilities Loan notes 1.1 - - - Arrangement fee in respect of revolving credit facility - (0.1) - (0.1) 1.1 (0.1) - (0.1) Non-current liabilities Finance lease payables 0.1 0.1 0.1 0.1 Arrangement fee in respect of revolving credit facility (0.2) (0.1) (0.2) (0.1)Revolving credit facility 21.0 18.1 21.0 18.1 20.9 18.1 20.9 18.1
Loan notes totalling £1.1m were issued in November 2015 to settle the deferred consideration in relation VB Research earn-out. Interest is payable on these loan notes at a variable rate of 1% above LIBOR, payable in June and December. Loan notes are redeemable up to twelve months from the date of issue. No loan notes were redeemed during the current or prior period.
Further details about the Group’s borrowings are provided in note 27.
17 FINANCIAL LIABILITIES
Finance lease payables
Lease payables are secured as the rights to the leased assets revert to the lessor in the event of default.
31 December 31 December 31 December 31 December 2015 2014 2015 2014 Group Group Company Company £m £m £m £m Gross finance lease liabilities - minimum lease payments No later than 1 year - - - - Later than 1 year and no later than 5 years 0.1 0.1 0.1 0.1 0.1 0.1 0.1 0.1 Future finance charges on finance leases - - - - Present value of finance lease liabilities 0.1 0.1 0.1 0.1
The present value of finance lease liabilities is as follows:
31 December 31 December 31 December 31 December 2015 2014 2015 2014 Group Group Company Company £m £m £m £m No later than 1 year - - - - Later than 1 year and no later than 5 years 0.1 0.1 0.1 0.1 Present value of finance lease liabilities 0.1 0.1 0.1 0.1
The Group leases office equipment with a carrying amount of £0.1m (2014: £0.1m) under a finance lease expiring in two years.

FINANCIAL STATEMENTS
128 129
18 TRADE AND OTHER PAYABLES
31 December 31 December 31 December 31 December 2015 2014 2015 2014 Group Group Company Company £m £m £m £m Trade payables 3.0 1.8 - - Payables to subsidiaries - - 8.3 4.8 Social security and other taxes 1.1 1.8 0.1 - Other payables 2.4 0.5 - - Accruals 5.9 6.9 0.1 0.5 12.4 11.0 8.5 5.3
Payables to subsidiaries are unsecured, have no fixed date of repayment and bear interest at an annual rate of 2.71% (2014: 2.11%).
The Directors consider that the carrying amount of the trade payables approximates their fair value.
19 DEFERRED INCOME
31 December 31 December 2015 2014 Group Group £m £m Deferred income 17.0 15.3
20 CURRENT INCOME TAX LIABILITIES
31 December 31 December 2015 2014 Group Group £m £m Corporation tax 0.9 0.2
21 PROVISIONS
Deferred consideration £mGroupAt 31 December 2014 1.1 Charged to statement of comprehensive income during the year 0.1Released during the year (1.2) At 31 December 2015 -
Deferred Consideration
Deferred consideration relates to VB Research.
The amount provided is dependent on continued employment of the former owners of the business and is treated as post-acquisition remuneration accruing over the period to the end of the performance period. All amounts represent the Directors' best estimate of the amount to be paid at the balance sheet date.
The amount of deferred contingent consideration payable with respect to the acquisition of VB Research was dependent on the profits generated by VB Research in the period 1 July 2014 to 30 June 2015 (the performance period), subject to a maximum earn-out payment of £5.0m.
The deferred consideration was settled in the current year through the payment of £0.1m in cash and the issue of loan notes for the remaining balance (see note 16 for more details).
22 DEFERRED INCOME TAX
The movement on the deferred income tax account is shown below.
Accelerated Other capital temporary Tax allowances differences losses Total £m £m £m £m Net asset / (liability) at 1 July 2013 1.0 (3.0) 0.5 (1.5)Adjustments in respect of prior period (0.5) 0.3 0.4 0.2 Disposal of subsidiary (0.1) - - (0.1)Recognised in the statement of comprehensive income (0.2) 0.9 (0.4) 0.3 Effect of rate change 0.1 0.1 - 0.2 Net asset / (liability) at 31 December 2014 0.3 (1.7) 0.5 (0.9)Recognised in the statement of comprehensive income 0.1 1.0 (0.3) 0.8
Net asset / (liability) at 31 December 2015 0.4 (0.7) 0.2 (0.1)
Deferred tax assets and liabilities are only offset where there is a legally enforceable right of offset and there is an intention to settle the balances net.
31 December 31 December 2015 2014 Group Group £m £m Deferred tax asset 0.6 0.8 Deferred tax liabilities (0.7) (1.7) Total (0.1) (0.9)
At the balance sheet date, the Group has unused tax losses of £1.9m (2014: £2.0m) available for offset against future profits. A deferred tax asset has been recognised in respect of £1.5m (2014: £1.8m) of such tax losses. No deferred tax has been recognised in respect of the remaining £0.4m (2014: £0.2m) as it is not currently considered probable that there will be future taxable profits available. Unrecognised losses may be carried forward indefinitely.
FINANCIAL STATEMENTS
130 131
23 SHARE CAPITAL
31 December 31 December 2015 2014 Group and Company Group and Company £m £m Authorised 200,000,000 (2014: 200,000,000) ordinary shares of 10p each 20.0 20.0 Issued and fully paid 150,207,960 (2014: 150,207,960) ordinary shares of 10p each 15.0 15.0
There are 800,000 (2014: 800,000) deferred shares of 10p each which carry restricted voting rights carry no right to receive a dividend payment in respect of any financial year.
See note 24 for information regarding the number of shares subject to options, the periods in which they were granted and the periods in which they may be exercised are given below.
24 SHARE-BASED PAYMENTS
The Group’s share-based payment expense for the period by scheme:
18 months Year ended ended 31 31 December December 2015 2014 £m £m Equity-settled Plans LTIP 2006 0.6 0.32014 Retention 0.1 0.1SELTIP - 0.1Share Incentive Plan - -ShareSave Plan - - 0.7 0.5
The Group’s share-based payment schemes are equity-settled.
Long Term Incentive Plan
The Group operates a Long Term Incentive Plan (‘LTIP’) for Executive Directors and selected senior management. This is an existing incentive policy and was approved by shareholders at the 2006 AGM. The share awards are valued at date of grant and the consolidated income statement is charged over the vesting period, taking into account the number of shares expected to vest. Full details of how the scheme operates are included in the Remuneration Report.
2014 Retention Plan
The 2014 Retention Plan was introduced in June 2014 with the aim of incentivising and rewarding participants for continued employment by the Group. Its purpose is to increase the interest of the employees in the Company’s business goals and results through share ownership.
Awards vest over a period of two or three years, with the only condition being continued employment. Awards were granted under this scheme in the prior period for no consideration and no exercise price. The Retention Plan will not result in the issue of any new ordinary shares as this plan is not approved by Shareholders. The awards will be settled from the shares held in the employee benefits trust.
Senior Executive Long-Term Incentive Plan (‘SELTIP’)
The Centaur Media Plc 2010 Senior Executive Long-Term Incentive Plan (the ‘SELTIP’) was introduced during 2011 and was approved by shareholders at the 2010 AGM. This is not an HMRC approved scheme and vests over a 3 year period with service and performance conditions. Awards were granted under this scheme in 2011 for no consideration and no exercise price.
This scheme has closed to new awards.
Awards of bonus units were made in 2013 as summarised in the following table:
Number of shares Financial Threshold PBTA Profit SELTIP Total bonus Bonus pool awarded in year profit achieved growth contribution pool allocated* total** 2013 £8.0m £8.6m £0.6m 30% £0.1m £0.1m 118,851
*The Remuneration Committee did not allocate the entire bonus pool in 2013** Awards were only made to participants with continuing employment
Long Term Incentive Plan, Retention Plan and Senior Executive Long-Term Incentive Plan
2014 LTIP LTIP LTIP LTIP LTIP Retention SELTIP 2006 2006 2006 2006 2006 Plan 2013 Grant date 27.10.15 10.08.15 26.03.15 04.08.14 08.11.13 30.06.14 15.09.11Share price at grant date (p) 78.25 80.5 69.5 56.75 54.25 62.38 33.88Fair value (p) 66.96 68.37 59.79 97.88 94.32 52.64 23.76Exercise date 28.10.18 10.08.18 23.03.18 04.08.17 15.03.17 31.12.16 17.09.14Exercise price (p) £nil £nil £nil £nil £nil £nil £nil Number of awards Balance at 1 January 2015 - - - 155,897 1,706,182 382,668 6,862Granted for the year 143,036 108,556 2,847,749 - - - -Forfeited during the year - - (629,175) - (267,273) - - Balance at 31 December 2015 143,036 108,556 2,218,574 155,897 1,438,909 382,668 6,862 Exercisable at 31 December 2015 - - - - - - 6,862 Balance at 1 July 2013 - - - - - - 118,851Granted for the period - - - 155,897 1,706,182 382,668 -Forfeited during the period - - - - - - (90,030)Exercised during the period - - - - - - (21,959) Balance at 31 December 2014 - - - 155,897 1,706,182 382,668 6,862 Exercisable at 31 December 2014 6,862 Average share price at date of exercise (p) 59.75
The shares outstanding at 31 December 2015 had a weighted average exercise price of £nil (2014: £nil) and a weighted remaining life of 2.0 years (2014: 2.6 years).

132 133132 133
FINANCIAL STATEMENTS
2014 LTIP LTIP LTIP LTIP LTIP Retention SELTIP 2006 2006 2006 2006 2006 Plan 2013 Grant date 27.10.15 10.08.15 26.03.15 04.08.14 08.11.13 30.06.14 15.09.11Expected volatility (%) 28.1 36.8 39.4 43.6 43.8 49.5 54.0Expected dividend yield (%) - - - - - 6.79 5.26Risk free interest rate (%) 0.69 1.02 0.58 1.17 0.92 1.22 0.57
Model of valuation used Stochastic Stochastic Stochastic Stochastic Stochastic Black- Black- Scholes Scholes
Share Incentive Plan
The Group has a Share Incentive Plan, which is a HRMC approved Tax-Advantaged plan, which provides employees with the opportunity to purchase shares in the Company. This plan is open to all employees who have been employed by the Group for more than 12 months. Employees may invest up to £1,800 per annum (or 10% of their salary if less) in ordinary shares in the Company, which are held in trust. The shares are purchased in open market and are held in trust for each employee. The shares can be withdrawn with tax paid at any time, or tax-free after five years. The Group matches the contribution with a ratio of one share for every two purchased. Other than continuing employment, there are no other performance conditions attached to the plan.
The Executive Directors are eligible to participate in the Share Incentive Plan, as are all employees of the Group.
Share Incentive Plan
31 December 31 December 2015 2014 Group Group Number of outstanding matching shares 78,602 65,594
ShareSave Plan
The Group had a ShareSave Plan (the ‘SAYE Scheme’) which is closed to new awards. The SAYE Scheme was an HMRC approved all-employee plan and is open to all employees who have been employed by the Group for more than 12 months. Employees could invest up to £3,000 per annum for a period of either 3 or 5 years, after which they could exercise SAYE options within 6 months of the anniversary date of the contract commencement date. Options were granted in 2008, 2009 and 2010. Other than continuing employment, there were no other performance conditions attached to the plan.
The Executive Directors are eligible to participate in the ShareSave Plan, as are all employees of the Group.
24 SHARE-BASED PAYMENTS (CONTINUED)
These awards were priced using the following models and inputs:ShareSave Plan
2010 2010 2009 2008 Sharesave Sharesave Sharesave Sharesave (5 year plan) (3 year plan) (5 year plan) (5 year plan) Grant date 23.04.10 23.04.10 30.04.09 24.04.08Share price at grant date (p) 50.5 50.5 37.3 72.0Fair value (p) 20.66 20.77 10.85 16.81Exercise date 23.04.15 23.04.13 30.04.14 24.04.13Exercise price (p) 41.24 41.24 20.92 64.7Contractual life remaining years - - - - Number of shares Balance at 1 January 2015 18,098 - - -Exercised during the year (18,098) - - - Balance at 31 December 2015 - - - - Exercisable at 31 December 2015 - - - - Average share price at date of exercise (p) 79.7 - - - Balance at 1 July 2013 18,098 83,618 564,051 29,678Forfeited during the period - (26,405) - - Exercised during the period - (57,213) (564,051) (29,678) Balance at 31 December 2014 18,098 - - - Exercisable at 31 December 2014 - - - - Average share price at date of exercise (p) - 57.0 35.96 -
In the current year, the weighted average exercise price was £nil (2014: £22.8p) and the weighted remaining life was 0 years (2014: 1 year).
These SAYE options were valued using a stochastic model with the following inputs:
2010 2010 2009 2008 Sharesave Sharesave Sharesave Sharesave (5 year plan) (3 year plan) (5 year plan) (5 year plan) Grant date 23.04.10 23.04.10 30.04.09 24.04.08Expected volatility (%) 48.1 57.7 45.2 29.6Expected dividend yield (%) 3.17 3.17 9.4 5.14Risk free interest rate (%) 2.88 2.02 2.65 4.56

FINANCIAL STATEMENTS
134 135
25 DIVIDENDS
18 months Year ended ended 31 31 December December 2015 2014 £m £m Equity dividends Final dividend for 2014: 1.3p per 10p ordinary share 1.9 -Interim dividend for 2015: 1.5p per 10p ordinary share 2.1 -Final dividend paid for 2013: 1.575p per 10p ordinary share - 2.2Interim dividend paid for 2014: 0.85p per 10p ordinary share - 1.2Interim dividend paid for 2014: 1.7p per 10p ordinary share - 2.4 4.0 5.8
A final dividend for the year ended 31 December 2015 of £2.2m (1.5p per share) is proposed by the Directors and, subject to shareholder approval at the Annual General Meeting, will be paid on 27 May 2016.
26 NOTES TO THE CASH FLOW STATEMENT
Reconciliation of (loss) / profit for the period to net cash inflow from operating activities
Year ended 18 months ended Year ended 18 months ended 31 December 31 December 31 December 31 December 2015 2014 2015 2014 Group Group Company Company £m £m £m £m (Loss) / profit for the period (6.9) 10.5 (2.0) (2.5) Adjustments for:Tax 1.3 0.8 - - Interest expense 0.9 1.6 0.9 0.1 Depreciation 0.9 1.2 - - Amortisation of intangibles 4.3 6.7 - - Impairment of goodwill (included within exceptional costs) 11.9 - - -IFRS 3 (‘R) earn-out (included within exceptional costs) 0.1 5.0 - -Earn-out discounting unwind - 2.9 - - Share-based payment charge 0.7 0.5 0.7 0.3 Profit on disposal of subsidiary - (14.7) - - Profit on disposal of trade and assets (0.4) - - -Other (0.3) (0.2) (0.2) - Changes in working capital (excluding effects of acquisitions and disposals of subsidiaries) (Increase) / decrease in inventories (0.2) 0.2 - - (Increase) / decrease in trade and other receivables (9.3) (0.6) (0.6) 7.3Increase in trade and other payables 1.4 0.2 3.2 5.0Increase in deferred income 1.7 3.5 - - Decrease in provisions - (0.1) - - Cash generated from operating activities 6.1 17.5 2.0 10.2
Analysis of changes in net debt
At 31 At 31 December Net DecemberGroup 2014 cash flow 2015 Note £m £m £m Cash and cash equivalents 15 3.4 (0.3) 3.1 Revolving credit facility 16 (18.1) (2.9) (21.0) Net debt (14.7) (3.2) (17.9)
At 31 At 31 December Net DecemberCompany 2014 cash flow 2015 Note £m £m £m Cash and cash equivalents 15 - - - Revolving credit facility 16 (18.1) (2.9) (21.0) Net debt (18.1) (2.9) (21.0)
27 FINANCIAL INSTRUMENTS
31 December 31 December 2015 2014 Note £m £m Financial assets Cash and bank balances 15 3.1 3.4Loans and receivables 14 22.2 12.8 25.3 16.2 Financial liabilities Amortised cost 33.5 27.4
The Group’s activities expose it to a variety of financial risks: interest rate risk, credit risk, liquidity risk, capital risk and currency risk. The following note describes the role that financial instruments have had during the period ended 31 December 2015 in the management of the Group’s financial risks.
Interest rate risk
The Group has no significant interest-bearing assets but is exposed to interest rate risk as it borrows funds at floating interest rates. This risk may be managed by the use of interest rate swap contracts as cash flow hedges. Hedging activities are evaluated regularly to align interest rate views and risk appetite with the hedging requirements of the Group’s revolving credit facility. The Group did not enter into any hedging transactions during the current or prior period and, as at 31 December 2015, the only floating rate to which the Group is exposed was LIBOR.

FINANCIAL STATEMENTS
136 137
27 FINANCIAL INSTRUMENTS (CONTINUED)
Interest rate sensitivity
The sensitivity analysis below has been determined based on exposure to interest rates at the reporting date and the stipulated change taking place at the beginning of the financial year and held constant throughout the year.
At the reporting date, if interest rates had been 25 basis points higher or lower and all other variables were held constant, the Group’s net profit after tax would increase / decrease by £0.1m.
The Group’s exposure to interest rates on financial assets and financial liabilities is detailed in the liquidity risk section of this note.
Credit risk
Credit risk is managed on a group basis. Credit risk arises from cash and cash equivalents, deposits with banks and financial institutions, and credit exposures to customers including outstanding receivables and committed transactions. Banks and financial institutions are independently rated by credit rating agencies. We choose only to deal with those with a minimum ‘A’ rating. We determine the credit quality for cash and cash equivalents to be strong. For customers, the business assesses the credit quality based on their financial position, past experience and other factors. The credit quality of trade receivables not yet due nor impaired has been assessed as acceptable based on historical performance. The Directors consider the maximum credit risk to which the Group is exposed is the sum of cash and cash equivalents per note 15 and the receivables balance per note 14. The Group does not consider that it is subject to any significant concentrations of credit risk.
Liquidity risk
The Group has exposure to liquidity risk if it is unable to settle transactions in the normal course of business and if new funding and refinancing cannot be obtained as required and on reasonable terms.
Throughout the year ended 31 December 2015, and for the foreseeable future, the Group was and is expected to be in a net borrowings position. The Group manages liquidity risk by maintaining adequate reserves and working capital credit facilities, and by continuously monitoring forecast and actual cash flows.
The total facility available to the Group is £25.0m and is available through to August 2019.
As at 31 December 2015, the Group had cash of £3.1m (2014: £3.4m) and undrawn loan facilities to further reduce its liquidity risk of £4.0m (2014: £6.9m).
The following tables detail the financial maturity for the Group’s financial liabilities:
Less than Book value Fair value 1 year 2-5 years £m £m £m £m At 31 December 2015 Financial liabilities Variable interest rate instruments 22.1 22.1 1.1 21.0 Fixed interest rate instruments 0.1 0.1 - 0.1 22.2 22.2 1.1 21.1 At 31 December 2014 Financial liabilities Variable interest rate instruments 18.1 18.1 - 18.1 Fixed interest rate instruments 0.1 0.1 - 0.1 18.2 18.2 - 18.2
The book value of primary financial instruments approximates to fair value where the instrument is on a short maturity or where they bear interest at rates approximate to the market.
All trade and other payables are due in one year or less, or on demand.
Capital risk
The Group manages its capital to ensure that all entities in the Group will be able to continue as a going concern while maximising return to stakeholders, as well as sustaining the future development of the business.
The capital structure of the Group consists of net debt, which includes borrowings (note 16) and cash and cash equivalents (note 15), and equity attributable to the owners of the parent, comprising issued share capital (note 23), other reserves and retained earnings.
The Group continues to benefit from its banking facilities (as renewed during June 2015), which features both a working capital facility, to assist in managing the Group’s liquidity risk, and an acquisition facility to support the Group’s acquisition strategy. The facility, available until August 2019, allows for a maximum drawdown of £25m. Interest is calculated on LIBOR plus a margin dependent on the Group’s net leverage position, which is re-measured quarterly in line with covenant testing.
The Group’s borrowings are subject to financial covenants tested quarterly. At 31 December 2015 and throughout 2015 all of these covenants were achieved.
Currency risk
Substantially all of the Group’s net assets are located and substantially all revenue and adjusted EBITDA is generated in the United Kingdom and consequently foreign exchange risk is limited. The results of the Group are not currently sensitive to movements in currency rates.
28 OPERATING LEASE COMMITMENTS - MINIMUM LEASE PAYMENTS
31 December 31 December 2015 2014 £m £mCommitments payable under non-cancellable operating leases Within 1 year 2.1 2.0 Later than one year and less than 5 years 6.5 7.8 After 5 years - 0.4 8.6 10.2 Commitments receivable under non-cancellable subleases Within 1 year 0.5 0.2 Later than one year and less than 5 years 1.8 1.2 2.3 1.4 The Group’s operating leases do not include any significant leasing terms or conditions.
At 31 December 2015, the Group had contracted with tenants to receive payments in respect of operating leases on land and buildings.
All lease commitments relates to land and buildings.
In November 2013 the Group signed a new lease for the entire Wells Street building. Two parts of the building are sub-let to tenants.
On 19 March 2015, the Group signed a new lease for its New York office, expiring on 31 January 2018. The total commitments relating to this lease amounted to £0.3m.
On 2 November 2015, the Group signed a non-cancellable property lease for its Singapore office, expiring 31 January 2017. The total commitments relating to this lease amounted to £0.1m.

138 139
FINANCIAL STATEMENTS
29 PENSION SCHEMES
The Group contributes to individual and collective money purchase pension schemes in respect of Directors and employees once they have completed the requisite period of service. The charge for the period in respect of these defined contribution schemes is shown in note 6. Included within other payables is an amount of £0.1m (2014: £0.1m) payable in respect of the money purchase pension schemes.
30 CAPITAL COMMITMENTS
At 31 December 2015, the Group had capital commitments totalling £nil. At 31 December 2014, capital commitments totalled £0.4m and related to new finance and CRM systems.
31 RELATED PARTY TRANSACTIONS
Group
Key management compensation is disclosed in note 6. There were no other material related party transactions.
Company
During the year, interest was recharged from subsidiary companies as follows:
18 months Year ended ended 31 31 December December 2015 2014 £m £m Interest payable 0.2 0.1 0.2 0.1
Borrowings of £2.9m were received (2014: £4.7m) by subsidiaries on behalf the Company.
The balances outstanding with subsidiary companies are disclosed in notes 14 and 18.
Audit Exemption
For the year ended 31 December 2015 the Company has provided a guarantee pursuant to sections 479A-C of the Companies Act 2006 over the liabilities of the following subsidiaries and as such they are exempt from the requirements of the Act relating to the audit of individual financial statements, or preparation of individual financial statements, as appropriate, for this financial year.
Name Company Number Outstanding liabilities £mCentaur Communications Limited 01595235 12.8
Centaur Consumer Exhibitions Limited 07276298 3.9
Chiron Communications Limited 01081808 9.3
Ascent Publishing Limited 02561341 1.7
The Forum for Expatriate Management Limited 06776955 0.5
Pro-Talk Ltd 03939119 -
Taxbriefs Holdings Limited 03572069 -
Taxbriefs Limited 01247331 0.5
Investment Platforms Limited 06439194 0.9
Venture Business Research Limited 05663936 0.3
The Profile Group (UK) Limited 05243851 5.8
Econsultancy.com Limited 04047149 4.9
Mayfield Publishing Ltd 02034820 0.4
Your Business Magazine Limited 01707331 2.4

140 141
OTHER INFORMATIONFINANCIAL STATEMENTS
32 POST BALANCE SHEET EVENTS
No material events have occurred after the reporting period.
33 DISPOSAL OF SUBSIDIARY
On 12 June 2014, the Group disposed of its interest in Perfect Information Limited (‘Perfect Information’). Economic control transferred on 31 May 2014.
The net assets of Perfect Information at the date of disposal were as follows:
31 May 2014 £m Intangible assets 2.0 Trade and other receivables 0.8 Intercompany 3.1 Cash and bank balances 0.4 Deferred tax asset 0.1 Current tax liability (0.2)Trade and other payables (0.5)Deferred income (2.5)Onerous lease provision (0.1)Attributable goodwill 8.9 Net assets disposed attributable to shareholders of the Parent Company 12.0 Directly attributable costs of disposal 1.2 Gain on disposal 14.7 Fair value of consideration 27.9 Satisfied by: Cash and cash equivalents 24.8 Novation of intercompany balances 3.1 27.9 Net cash inflow arising on disposal: Consideration received in cash and cash equivalents 24.8 Less: directly attributable costs of disposal 1.2 Less: cash and cash equivalents disposed of 0.4 23.2
Proceeds of £27.9m comprised cash of £24.8m and settlement of amounts owed by the continuing group to Perfect Information of £3.1 million.
There were no disposals of subsidiaries during 2015.
FIVE YEAR RECORD (UNAUDITED)
2011 2012 2013 2014 2015 Revenues (£m) 67.4 69.3 74.4 72.8 70.5Live events and paid-for content revenues as % of whole 52% 60% 66% 68% 67% Adjusted operating profit 7.2 10.4 10.0 10.2 10.5Adjusted operating profit margin 11% 15% 13% 14% 15% Operating (loss) / profit (£m) (30.0) 0.9 (33.3) 3.0 (4.7) Adjusted profit before tax (£m) 7.2 9.1 8.8 9.2 9.8 (30.2) (0.8) (35.7) 14.2 (5.6) Diluted adjusted EPS (pence) 3.6 4.4 4.7 5.0 5.3 Dividend per share (pence) 1.3 1.5 2.425 3.0 3.0 Operating cash flow (£m) 5.7 10.4 9.9 12.3 4.7 Average permanent headcount (FTE) 577 557 598 576 564Revenue per head (£’000) 117 124 124 126 125
Revenue by type
2011 2012 2013 2014 2015 £m £m £m £m £m Live events 20.8 22.8 28.0 28.9 27.2 Paid-for content 14.5 19.0 21.1 20.6 19.9 Advertising 31.6 26.3 24.6 22.4 22.5 Other 0.5 1.2 0.7 0.9 0.9 67.4 69.3 74.4 72.8 70.5
Balance Sheet Summary
2011 2012 2013 2014 2015 £m £m £m £m £m
Goodwill and other intangible assets 128.8 160.0 122.7 109.9 96.4
Other assets and liabilities (2.4) (19.0) (18.6) (8.4) (2.1)
Net assets before net debt 126.4 141 104.1 101.5 94.3 Net debt (5.4) (24.5) (27.0) (14.7) (17.9) Total equity 121.0 116.5 77.1 86.8 76.4

HEADING
DIRECTORS, ADVISORS AND OTHER CORPORATE INFORMATION
Company registration number04948078
Incorporated / Domiciled inEngland and Wales
Registered officeWells Point79 Wells StreetLondonW1T 3QN
Directors Ronald Sandler (Chairman) Andria Vidler (Chief Executive) Mark Kerswell (Group Finance Director)Christopher Satterthwaite Robert Boyle Rebecca Miskin
Company SecretaryGrainne Brankin
Independent AuditorsPricewaterhouseCoopers LLPChartered Accountants and Statutory Auditors1 Embankment PlaceLondon WC2N 6RH
RegistrarsShare Registrars Limited Suite E, First floor9 Lion and Lamb YardFarnhamSurreyGU9 7LL
142
OTHER INFORMATION

Wells Point, 79 Wells Street, London W1T 3QN