centennial bank global servicepic.bankofchina.com/bocappd/report/201203/p02012033150558222162… ·...
TRANSCRIPT
Bank of China Limited2011 Annual Results
March 30, 2012
Centennial Bank Global Service
1
Forward-looking Statement Disclaimer
This presentation and subsequent discussions may contain forward-lookingstatements that involve risks and uncertainties. These statements are generallyindicated by the use of forward-looking terminology such as believe, expect,anticipate, estimate, plan, project, target, may, will or may be expressed to be resultsof actions that may or are expected to occur in the future. You should not placeundue reliance on these forward-looking statements, which reflect our belief only asof the date of this presentation. These forward-looking statements are based on ourown information and on information from other sources we believe to be reliable.They relate to future events or our future financial, business or other performanceand are subject to a number of uncertainties that may cause our actual results todiffer materially.

2
Presentation Team
Mr. Wang Yongli, Executive Vice President
Mr. Li Lihui, President
Mr. Yue Yi, Executive Vice President

Bank of China was foundedFunctioned as central bank
Centennial Bank Global Service
1912
1929
1949
Established London officeStarted overseas network development
Became specialized foreign exchange bank
1985Issued the first bank card in China
2012
Starting point of new century
2011Became a Global Systematically Important Financial Institution
2008
1994/1995Became note-issuing bank in HK and Macau
2006Listed on the Hong Kong Stock Exchange and Shanghai Stock Exchange
1994Became state-owned commercial bank to provide full-range financial services
Provided financial service to Beijing Olympic Games as sole banking partner
The only bank in China that has ongoing operating history for a hundred yearsThe only Chinese enterprise that has been enrolled in the world top 500 enterprises for consecutive 23 years Awarded “Best Bank in China” by Euromoney for 9 timesAwarded “Best World’s Foreign Exchange and Trade Bank (China)” by Global Finance for 9 timesAwarded “Best Chinese Trade Finance Bank” by Trade Financefor 6 times
3

Centennial Bank Global Service
4
Premier Wen Jiabao sent a congratulatory letter to the ceremony:Bank of China has acted as an important window for the opening up of thecountry and a principal channel of overseas financing over years. Bank ofChina has served the general public, upheld integrity, and made greatcontribution to supporting the economic construction and promoting thedevelopment of foreign trade and economic cooperation. In the pastdecade, Bank of China has smoothly completed its shareholding reformand IPO, significantly strengthened its competitive strengths, andsubstantially enhanced its international image and influence.
With the transformation of the economic development pattern andstructural adjustment, China’s economic and social development hasraised new demands and higher requirements for the financial industry.Bank of China should continue to carry out the view of scientificdevelopment in depth, focus on transforming development mode, firmlyseize development opportunities, further enhance corporate governance,strive to enhance operation and management, continuously improvefinancial services, achieve further progresses, and make new biggercontribution to the steady and rapid development of the Chinese economyand society.
Vice Premier Li Keqiang delivered key note speech:Bank of China is the bank with the longest ongoing operating history, and has participated in and witnessed the historical course that the Chinese nation has realized the recovery, revival and rise out of hardships. After the founding of the People’s Republic of China, Bank of China, as the window of China’s opening up to and exchange with the outside world, has always worked in the forefront of international economic, trade and financial exchanges, and played a unique role in the opening up process. As a time-honored brand in the financial sector, Bank of China has followed the tide of time, persisted in exploration and innovation, created many firsts in the Chinese banking history, and was the first Chinese entity that has become one of the world top 500 enterprises. As the excellent representative of the Chinese banking sector, Bank of China has always adhered to the principle of seeking welfare for the society and seeking prosperity for the country, committed itself to the mission of building a strong nation, and made important contributions in different historical periods. Nowadays, Bank of China has become a financial institution with important influences worldwide.
Bank of China is standing at the starting point of a new century. Bank of China should carry forward the tradition of pursuing excellence, leverage its distinctive feature of international and diversified operation, seize historic opportunities, deepen its internal reform, strengthen its global operation capabilities, and strive to build a premier multinational banking group.
On February 3, 2012, Celebration Ceremony of the 100th Anniversary of Bank of China was held in the Great Hall of the People in Beijing

5
Agenda
1 Key Highlights & Development in 2011
2 2011 Operating Performance & 2012 Outlook
Agenda

Stable growth of after-tax profit
Sound capital adequacy
Achieving Sustainable Growth
6
Continuous improvement in asset quality
Steady improvement in profitability
48.06 62.02
65.57 85.35
109.69 130.32
2006 2007 2008 2009 2010 2011
RM
B bi
llion
CAGR= 22.1%
11.44%
10.67%10.81%
9.07%
10.09% 10.07%
13.59% 13.34% 13.43%
11.14%
12.58% 12.97%
2006 2007 2008 2009 2010 2011
Core capital adequacy ratio Capital adequacy ratio
0.95% 1.09% 1.01% 1.09% 1.14%1.17%
13.42% 13.85% 14.37%16.48%
18.87%18.27%
2006 2007 2008 2009 2010 2011
ROA ROE
4.04%3.12% 2.65%
1.52% 1.10% 1.00%
96.00% 108.18%121.72%
151.17%
196.67%220.75%
2006 2007 2008 2009 2010 2011NPL Ratio NPL Coverage Ratio

Increased proportion of depositIncreased proportion of RMB assets
7
Progress of Structural Optimization
Decreased loan to deposit ratioIncreased proportion of demand deposit
71.72%
68.77%
2010 2011
Group loan to deposit ratio
down by 2.95 pps
75.85%76.13%
2010 2011Proportion of total RMB assets
up by 0.28 ppt79.04%
79.63%
2010 2011
Proportion of deposits to total liabilities
up by 0.59 ppt
44.85%
46.09%
2010 2011
Proportion of average balance of domestic demand deposits
up by 1.25 pps
8
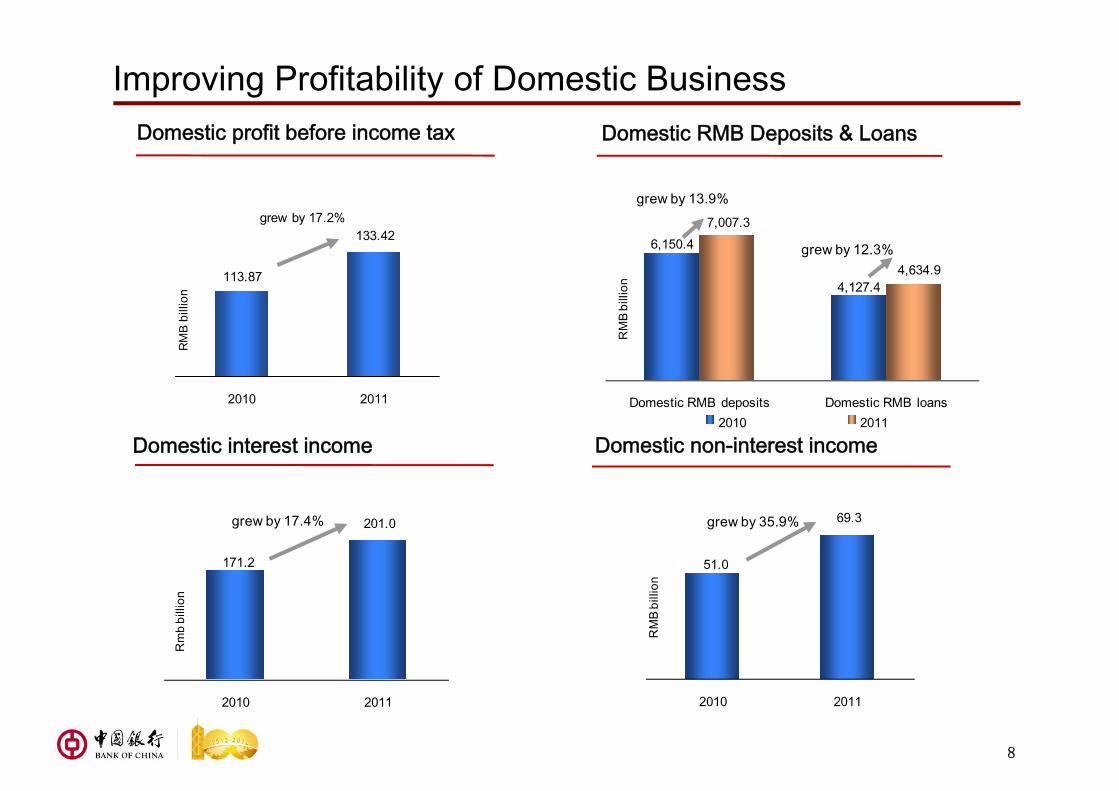
Improving Profitability of Domestic Business
Domestic non-interest incomeDomestic interest income
Domestic RMB Deposits & LoansDomestic profit before income tax
6,150.4
4,127.4
7,007.3
4,634.9
Domestic RMB deposits Domestic RMB loans
RM
B bi
llion
2010 2011
grew by 12.3%
grew by 13.9%
171.2
201.0
2010 2011
Rm
b bi
llion
grew by 17.4%
51.0
69.3
2010 2011
RM
B bi
llion
grew by 35.9%
113.87
133.42
2010 2011
RM
B b
illio
n
grew by 17.2%

172.5
134.8
217.5
178.4
Overseas clients deposits Overseas clients loans
USD
bill
ion
2010 2011
grew by 26.1%
grew by 32.4%
New York, Frankfurt, Tokyo, Singapore, and Sydney branches all act as local tier one clearing bankProactively implemented global customer service model to provide comprehensive services to Going Global enterprises, Fortune 500 companies and other overseas enterprisesOpened Bulk Commodity Financing and Forfeiting Center in SingaporeEstablished a platform for overseas card business, achieving credit card issuance in UK and Thailand 8 overseas institutions issued wealth management products
Accelerated Overseas Business DevelopmentVarious measures to extend overseas network
Optimize global product & service platform
Overseas contribution leading peers
9
Set up 12 new overseas institutions, with overseas network covering Hong Kong, Macau, Taiwan and 32 countriesOpened China Desks in 5 countries, including Oman, Peru, Ghana, the United Arab Emirates and ChileEstablished private banking units in Hong Kong and Macau, providing customized financial products and services to worldwide high-end customersInitial progress in developing Asia-Pacific and European wealth management platforms
Rapid growth of loans & deposits of overseas commercial banking business
76.47% 67.38%
23.53%32.62%
21.46% 22.39%
2010 2011
USD
bill
ion
Overseas assets
HK, Macau & Taiwan Other overseas regionsContribution ratio
440.2351.6
grew by 25.2%
87.41% 81.46%
12.59%18.54%
19.89%21.23%
2010 2011
USD
bill
ion
Overseas profit before income tax
HK, Macau & Taiwan Other overseas regionsContribution ratio
5.714.27
grew by 33.6%

Leading Position in Cross-border & Overseas RMB Businesses
Global clearance network taking shape Cross-border RMB settlement business leading peers with a market share over 30%
Rapid growth of RMB bond underwriting & investment
10
More diversified overseas RMB products & services
Opened 630 cross-border RMB clearing accounts for banks from Asia, Europe, America, Oceania & AfricaActing as designated RMB business clearing bank in Hong Kong & Macau BOCHK conducted business volume of over RMB1.77 trillion as clearing bank in Hong Kong
Engaged in underwritings of 18 RMB bond issuances in Hong Kong, amounting to RMB26.5 billion with market share of 26%HK and Macau operations actively participated in investment of domestic RMB bonds
Total amount of overseas institutions’ RMB deposits and loans reached RMB260 billion and RMB140 billion approximately, up by 77% and 5.3 times respectivelyExtended cash business from Asia-Pacific to other overseas areas with RMB cash wholesale business doubled in volume Largest local RMB business market maker in RussiaActively promoted overseas RMB credit card and RMB wealth management businesses
165.6
778.4195.5
550.6
23.3
426.3
2010 2011
RM
B bi
llion
Domestic operations BOCHK Other overseas operations
384.4
1,755.3
grew by 356.6%

Enhanced Competitiveness in Diversified Business
11
♦ Dominant position in HK property insurance market
♦ Life insurance business ranks 2nd in HK, and recorded gross premium income of HKD12.9 billion, up by 49%
♦ Leading position in RMB insurance business in HK
♦ After-tax profit of HKD3.6 billion
♦ Launched BOCGI Zheshang Investment Fund, which has raised RMB4.2 billion in its first round of funding
♦ Assets under management amounted to RMB54.5 billion, up by 37% over the prior year-end, higher than market benchmark
♦ Successfully launched new funds, including 4 public-offered funds, 2 one-on-multi discretionary accounts and 2 one-on-one discretionary accounts
♦ Awarded “the Top 10 Golden Bull Investment Managers”
Equity Investment Fund Management Aircraft Leasing
♦ After-tax profit of RMB1.21 billion
♦ Completed first RMB-denominated IPO in HK
♦ After-tax profit of USD201 million, an increase of 20%
♦ Ranking as global 5th aircraft lessor
♦ Possessing a fleet of 183 aircrafts, in service with 47 airlines of 29 countries worldwide
InsuranceInvestment Banking
In 2011, the Bank rigorously implemented the Group’s strategy on comprehensive operation and promoted cross-selling andsynergy between commercial banking and diversified business platform. The Bank’s commercial banking platformrecommended over 300 projects to diversified business platform, including listing and refinancing, debts issue, M&A, directequity investment and asset-backed structured financingBOC Insurance and BOC Investment Management achieved 72% and 52% respectively of their sales through the Bank’scommercial banking channelsProfit contribution from non-commercial banking business reached 6.4%, higher than other domestic peers
♦ Ranking 4th in domestic market in equity and debt underwriting volume
♦ Recorded premium income of RMB2.9 billion, up by 14%
♦ Provided insurance cover for overseas projects including Bata Port of Equator Guinea & Friendship Port of Mauritania

Prudent Risk Management
12
Market riskCredit risk Basel II & IIIImplementationLiquidity risk
The Bank continued to push forward the integration, refinement and specialization of its risk management function, and strengthen the risk management of key business areas, to ensure the
growth quality and keep a balance between risk, capital and return
Stepped up efforts to adjust and optimize industry structure and formulated Annual Guidelines for Industry Credit; continued to improve credit portfolio management and monitor the implementation monthlyStrengthened the management of loans granted to local government financing vehicles and property sectorCarried out stress testing and risk investigation for property sector loans to prevent cyclical riskExplored the differentiated credit approval model for medium-sized enterprises; continued to promote and improve the “Credit Factory” model designed for small and medium-sized enterprisesStrengthened personal credit management to prevent over-borrowing
Strengthened risk management of Group bond investment portfolio
Timely adjusted bond investment strategy, disposed of all high risk bonds issued by the five crisis-stricken European countries, reflecting the proactive and professional risk management capability
Established measurement management system for the three risks of Pillar IDeepened and extended the application of Basel II & III to promote asset structure optimization and improve capital efficiencyConducted in-depth researches into the influence of Basel III and regulatory reform on global systemically important banksAccelerated implementation of the advanced approaches for Base II & III
Implemented proactive and effective liquidity management under the tightening liquidity situation, intensified the management of liquidity reserve and established an early warning system
Strengthened centralized management of foreign currency funding and broaden funding sources

Loans to provincial and city level exceed 92%
95% with full or nearly-full cash flow coverageDecreasing balance and proportion under the same classification standard
Risk of LGFV Loans Well Under Control
13
Balanced repayment schedule
419.3 394.9
7.41%6.23%
2010 2011
RM
B b
illio
n
LGFV Loan BalanceProportion of LGFV loans to total loans
62.8%
29.7%
7.5%
Provincial City Level County Level
Fully
covered
82.6%
Nearly-full
covered
12.2%
Half
covered
1.6%
Barely
covered
3.6%
less than 2 yrs
22.4%
3 to 4 yrs18.0%
Over 5 (included)
yrs59.6%

1.660.00
0.78%0.00%
Property developer loan Land reserve loan
RM
B bi
llion
Non-performing loan balance Non-performing loan ratio
68% of customers are either qualified as HQ or provincial branch key accounts, 6 percentage points higher than prior year-endAverage contract term of property developer loans is 3 years, while the actual repayment term is even shorterNon-performing loan ratio of residential mortgage loan is 0.39%, 0.05 percentage point lower than the prior year-endAverage LTV ratio below 50% with sufficient collateral coverage
Lower balance and proportion than peers
Sound Asset Quality of Real Estate Sector
Sound asset quality
14
1.17%Avg. NPL ratio of domestic loans
213.2
38.8
3.36%
0.61%
Property developer loan Land reserve loan
RM
B bi
llion
Loan Balance as % of total loans

Prudent Risk Management of Small Enterprise Loans
15
Comprehensive risk management
Decreased NPL ratio
Client selection: Conduct quantitative research based on local industry features and build up target customer list by batches
Credit approval: Approval of loan application by professional credit officer based on financial and non-financial information at high efficiency
Post loan management: Set up early warning trigger and implement effective post loan management and real-time monitor of asset quality
Performance evaluation: Establish specialized SME business accountability and performance appraisal program
Increased proportion of small enterprise loans
Asset portfolio management: Dynamic monitor of asset portfolio with appropriate diversification of risk to improve both asset quality and yield
2.80%
1.80%
2010 2011
decreased by 1 ppt
177.2 239.4
388.6
5.56%
6.76%10.18%
2009 2010 2011BalanceProportion of loans to total domestic corporate loans
grew by 35.1%
grew by 62.3%
RM
Bbi
llion

Effectively Reduced FX Bond Investment Risk
Optimized structure with low risk
16
Low balance & proportion of European bond investment
Timely disposed of all the high risk position in bonds issued by the five crisis-stricken European countries, reflecting the Bank’s proactive and professional risk management
Further decrease of US high risk bond investment
15.7 12.9
1.00%0.69%
2010 2011
USD
bill
ion
European debt investmentas % of total assets
UK,Germany
Netherlands,
France and
Switherland
95.97%Other
European
countries
4.03%
2.973
1.563
1.775
0.063
2010 2011
USD
bill
ion
Debt issued by and mortgage-backed securities guaranteed by US Freddie Mac and Fannie MaeUS subprime mortgage, Alt-A mortage-backed securities and Non-Agency mortgage-backed securities
1.626
4.748

Increased input in branch network construction
17
Rapid development of E-banking channels
Channel Construction Promote Service Capability
Enhance outlet function: Domestic commercial banking outlets reached 10,225, including 1,500 middle to large-sized full-functional outlets
Upgrade mid-to-high end clients service channels: The Bank has established 3,699 wealth management centers, 166 prestigious wealth management centers and 19 private banking centers in the Chinese mainland
Enhance self-service utilities: Domestic ATMs, self-service terminals and self-service banks in operation reached 30,000,16,000,and 9,400 respectively, up by 6,000, 2,000,and 1,800 from the prior year-end
Comprehensively upgraded e-banking channels and improved online service: Number of e-banking customers exceeded 130 million, up by 72% from the prior year-end. Business substitution rate of electronic channels rose by 14 percentage points to 68%Upgrade online banking product offering: Increased functions including loan inquiry, credit card repayment, corporate wealth management product sales and personal clients investment and wealth management salesEnhanced mobile banking, home banking and e-business platform: The number of mobile banking users exceeded 17 million, 27 times greater than the prior year-endImprove overseas e-banking services: Online banking service covers 29 countries and regions
Outlet efficiency leading peers
Expansion of online banking client base
659
22.24
738
26.83
Average deposit per domestic outlet
Average operating income per domestic outlet
RM
B m
illio
n
2010 2011
grew by 21%
grew by 12%
25.14
0.419
55.72
1.08
Number of personal on-line banking clients
Number of corporate on-line banking clients
milli
on
2010 2011
grew by 122%
grew by 159%

Technology Drives Intelligent Service System
18
Expand, upgrade and optimize the current system in customer experiences, data process, and business process reengineeringAccording to the Bank’s strategy, extend the IT Blueprint to overseas operations to provide globalized and diversified business supportFocus on the integration of business and technology, and bolster the overall service capability and competitiveness
Centralized management of customer informationCentralized clearance and financial data managementEffective product innovationAll-round internal controlEnhance the technology support in risk managementPromote transformation of business process
Establish comprehensive account opening procedures for personal customer: achieved account opening of 23 personal products at one time together with activation of functions including online banking and phone banking, reducing front-desk process time by 70%Shift front-desk operations to back-office: saving front-desk process time 4 minutes per transaction for personal international inward remittance and 15 minutes per transaction for international outward remittance
The successful completion of the IT Blueprint project marks the transformation from “account-centric” to “customer-centric” service model. Client service quality and efficiency were significantly enhanced, and
technology will continue to promote the intelligent service system
The core banking system of the Bank won the sole Top Award among the “2011 Banking Technological Development Award” organized by the PBOC
Build intelligent service system
Improve customer service
19
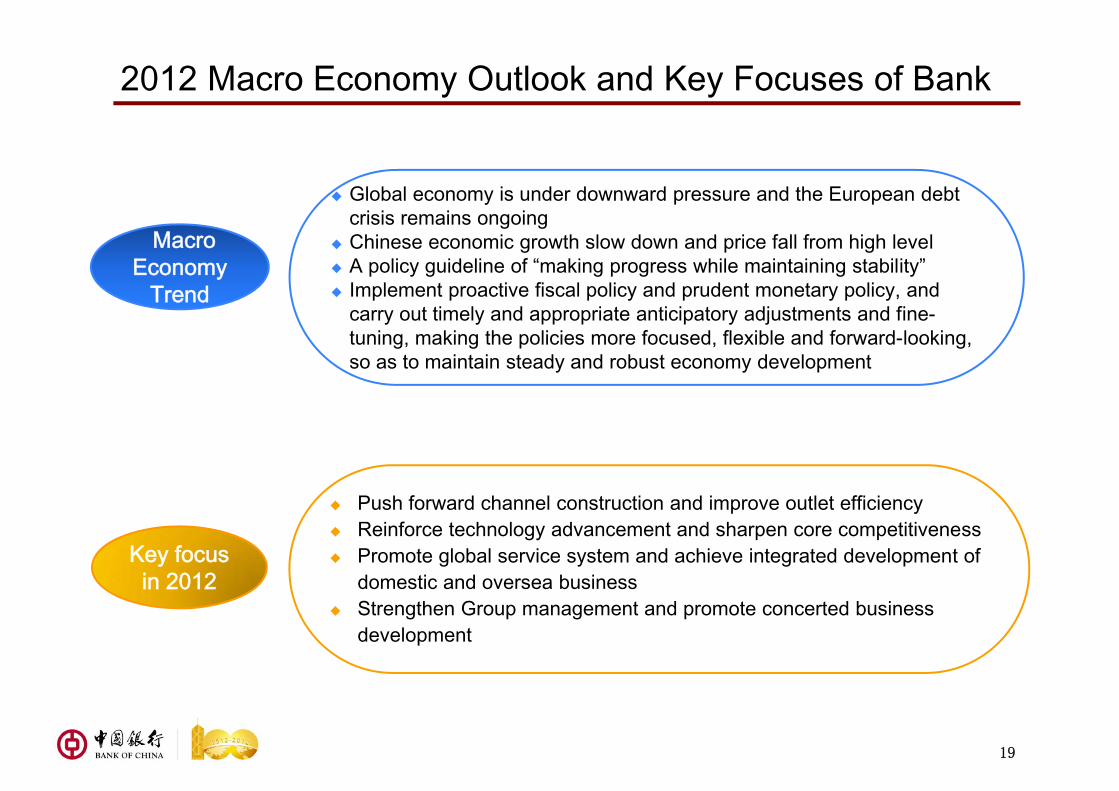
2012 Macro Economy Outlook and Key Focuses of Bank
Macro Economy
Trend
Global economy is under downward pressure and the European debt crisis remains ongoingChinese economic growth slow down and price fall from high levelA policy guideline of “making progress while maintaining stability”Implement proactive fiscal policy and prudent monetary policy, and carry out timely and appropriate anticipatory adjustments and fine-tuning, making the policies more focused, flexible and forward-looking, so as to maintain steady and robust economy development
Key focus in 2012
Push forward channel construction and improve outlet efficiencyReinforce technology advancement and sharpen core competitivenessPromote global service system and achieve integrated development of domestic and oversea businessStrengthen Group management and promote concerted business development

20
Agenda
1 Key Highlights & Development in 2011
2 2011 Operating Performance & 2012 Outlook
Agenda

(RMB million) 31 Dec 2011 31 Dec 2010 31 Dec 2009 2011 VS 2010 2010 VS 2009
Total assets 11,830,066 10,459,865 8,751,943 13.1% 19.5%
Loans, net 6,203,138 5,537,765 4,797,408 12.0% 15.4%
Investment securities 2,000,759 2,055,324 1,816,679 -2.7% 13.1%
Total liabilities 11,074,172 9,783,715 8,206,549 13.2% 19.2%
Due to customers1 8,817,961 7,733,537 6,716,823 14.0% 15.1%
Capital and reserves attributable toequity holders of the Bank
723,162 644,165 514,992 12.3% 25.1%
Key financial ratios (%) 31 Dec 2011 31 Dec 2010 31 Dec 2009 2011 VS 2010 2010 VS 2009
Core capital adequacy ratio 10.07 10.09 9.07 -0.02 1.02
Capital adequacy ratio 12.97 12.58 11.14 0.39 1.44
Non-performing loans to total loans 1.00 1.10 1.52 -0.10 -0.42
Allowance for loan impairment losses tonon-performing loans
220.75 196.67 151.17 24.08 45.50
Domestic allowance for loan impairmentlosses to domestic total loans
2.56 2.45 2.58 0.11 -0.13
Loan to deposit ratio2 68.77 71.72 72.04 -2.95 -0.32
21
Balance Sheet Summary
Note 1. Due to customers has been redefined to include structured deposits. Figures for previous years have been restated accordingly2. Loan to deposit ratio = outstanding loans ÷ balance of deposits. According to provisions of the PBOC, the balance of deposits includes due to customers and due to financial institutions such as financial holding and insurance companies

(RMB million) 2011 2010 2009 2011 VS 2010 2010 VS 2009Net interest income 228,064 193,962 158,881 17.6% 22.1%Non-interest income 100,234 82,556 73,689 21.4% 12.0%-Net fee and commission income 64,662 54,483 46,013 18.7% 18.4%Operating income 328,298 276,518 232,570 18.7% 18.9%
Operating expenses (140,815) (122,409) (107,307) 15.0% 14.1%
Impairment losses on assets (19,355) (12,993) (14,987) 49.0% -13.3%
Operating profit 168,128 141,116 110,276 19.1% 28.0%
Profit before income tax 168,644 142,145 111,097 18.6% 27.9%
Income tax expense (38,325) (32,454) (25,748) 18.1% 26.0%
Profit after income tax 130,319 109,691 85,349 18.8% 28.5%
Profit attributable to equity holders of the Bank 124,182 104,418 80,819 18.9% 29.2%
EPS (basic, RMB) 0.44 0.39 0.31 0.05 0.08
Dividend per share (before tax, RMB) 0.155 0.146 0.140 0.009 0.006
Key financial ratios (%)
Return on average total assets 1.17 1.14 1.09 0.03 0.05
Return on average equity 18.27 18.87 16.48 -0.60 2.39
Non-interest income to operating income 30.53 29.86 31.68 0.67 -1.82
Net fee & commission income to operating income 19.70 19.70 19.78 0.00 -0.08
Cost to income (calculated under domestic 33.07 34.16 34.92 -1.09 -0.76regulations)Net interest margin 2.12 2.07 2.04 0.05 0.03
Credit cost 0.32 0.29 0.38 0.03 -0.09
22
Profit & Loss Summary

23
Accelerated Transformation of Corporate Banking Business
Group corporate deposit
Group corporate loan
Global leading position in international settlement: Transactionvolume of international settlement business conducted by theGroup reached USD2.43 trillion, up by 23% over the last yearFactoring business lead the market: Domestic institutionsconducted USD29.6 billion of international factoring transactions,up by 48% compared with the prior year. Dual-factor exportfactoring volume ranked first globally for 46 consecutive monthsStrong advantages in L/G business: The balance of RMB-denominated letters of guarantee of domestic institutions wasRMB383.8 billion, up by 23% compared with prior year-endLeading position in domestic trade finance: The balance of RMB-denominated trade finance conducted by domestic institutionswas RMB230.0 billion, up by 43% over the prior year-end. FXtrade finance continued to lead the market
Market share of domestic corporate deposit further increased
Leading position in international settlement and trade finance
67.3% 68.6% 68.7%
17.4%14.8%
12.1%15.3%16.6%
19.2%
2009 2010 2011
RM
B bi
llion
Domestic RMB Domestic FX Overseas
3,762.94,244.4grew by 12.8% 4,725.3grew by 11.3%
84.3% 83.1% 81.9%
5.0%4.4%
4.1%10.7%
12.5%14.0%
2009 2010 2011
RM
B bi
llion
Domestic RMB Domestic FX Overseas
3,458.04,063.5
grew by 17.5% 4,694.3grew by 15.5%
9.35%
17.95%9.51%
26.84%
Domestic RMB Domestic FX 2010 2011
up by 0.16 ppt
up by 8.89 pps

31 Dec 2011 2011 VS 2010
No. of effective personal customers 153million 17%
No. of middle and high-end customers 7.35million 85%
No. of private banking customers 26 thousand 68%
24
Group personal loan
Rapid growth in bank card business
Upgraded Innovation of Personal Banking BusinessConstant expansion in domestic customer base
Group personal deposit
2009 2010 2011
RM
B bi
llion
Mortgage Others
79.1%
20.9%23.1%
76.9%
1,416.21,147.5
1,617.5
75.0%
25.0%grew by 23.4%
grew by 14.2%
RMB1,728.7billion
RMB1,302.2billion
42%
30%
56%
57%
30.86million
194million
2011 2011 VS 2010
Accumulated no. of effective credit cardAccumulated no. of debit card
Bank card consumptionRMB card merchant acquiringtransaction volume
31 Dec 2011 2011 VS 2010
75.6% 77.8% 80.4%
6.4%5.5%
4.7%18.0%
16.7%14.9%
2009 2010 2011
RM
B bi
llion
Domestic RMB Domestic FX Overseas
3,194.3
3,568.9grew by 11.7% 3,935.1
grew by 10.3%

25
Further Enhanced Competiveness of Financial Markets Business
Optimized structure of debt investment
Foreign exchange purchase and sale takes market leading position, and forward exchange trading business has a market share of 33%
Ranking of transaction volume on the Shanghai Gold Exchange improved to No.1
Introduced public quotation business for a variety of non-USD currencies against RMB into China’s inter-bank market
Introduced over thousand of financial products during the year to meet client’s diversified investment needs
No.3 issuance scale of publicly offered debt financing instruments
The first Bank to introduce “one-stop” global custody service in Chinese banking industry. At the end of 2011, assets under custody of the Group approached RMB3 trillion, leading peers
Solidify traditional strength and expand new business
71.2%73.9% 74.8%
28.8%26.1% 25.2%
2.73% 2.73%
2.95%
2009 2010 2011
RM
B bi
llion
RMB investment FX investment Yield
2,021.5 1,962.21,796.1

26
Net Interest Margin Further Improved
QoQ net interest margin trend in 2011Group net interest margin up by 5bps YoY
2.11% 2.10% 2.08%
2.20%
2.35% 2.35% 2.26%2.38%
1.47% 1.70% 1.71%
1.88%
1.16%1.07%
1.18% 1.20%
1Q 2011 2Q 2011 3Q2011 4Q2011
Group Domestic RMB Domestic FX OverseasNotes: Factor1: Increase of RMB bond yield Factor2: Increase of both proportion and pricing of RMB due from banks and
other financial institutions; reduced proportion of RMB due to banks and other financial institutions in liabilities
Factor3: Decrease of proportion of high yield domestic RMB assets to total domestic assets, resulting from increase of mandatory reserve
Factor4: Expansion of interest spread of domestic FX business Factor5: Contraction of interest spread of overseas business
2.07
2.12
0.05
0.05 0.06 0.04 0.03
2010 Factor 1 Factor 2 Factor 3 Factor 4 Factor 5 2011

27
Steady Growth in Non-Interest Income
Net fee and commission income Key drivers of Group’s non-interest income
9.1
4.9 4.0
12.4
6.9 7.0
Settlement and clearing fees
Domestic agency commissions
Revenue from sale of precious metals products
RM
B b
illio
n
2010 2011
grew by 35.5%
grew by 40.0% grew by 72.5%
17.2% 19.0%
15.4%17.7%
18.6%17.3%
16.2%
15.3%13.7%
12.2%18.9%
18.5%
2010 2011
RM
B bi
llion
Credit commitment feesSettlement and clearing feesAgency commissionsBank card feesSpread income from foreign exchange businessOther fees
59.2
70.0grew by 18.2%
4.7 5.4
Fee and commission expense
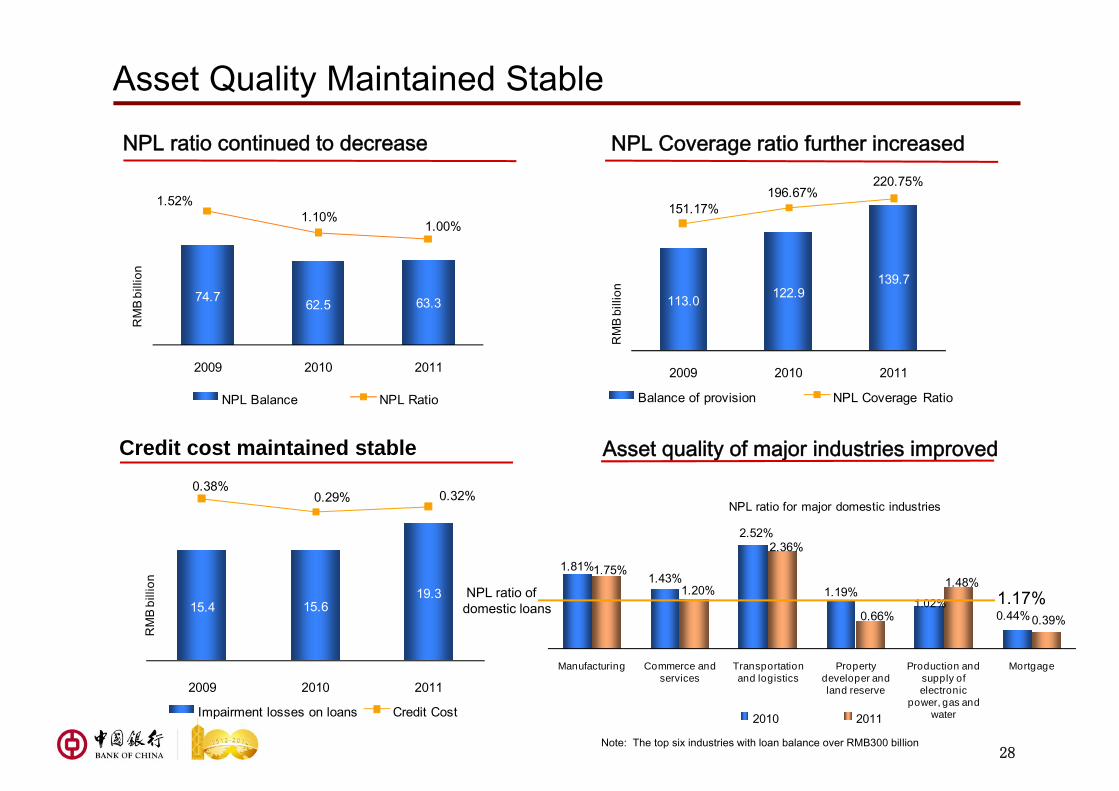
1.81%1.43%
2.52%
1.19%1.02%
0.44%
1.75%1.20%
2.36%
0.66%
1.48%
0.39%
Manufacturing Commerce and services
Transportation and logistics
Property developer and land reserve
Production and supply of electronic
power, gas and water
Mortgage
NPL ratio for major domestic industries
2010 2011
NPL ratio continued to decrease NPL Coverage ratio further increased
Asset Quality Maintained Stable
Credit cost maintained stable Asset quality of major industries improved
Note: The top six industries with loan balance over RMB300 billion
1.17%NPL ratio of domestic loans
28
74.7 62.5 63.3
1.52%1.10%
1.00%
2009 2010 2011
RM
B bi
llion
NPL Balance NPL Ratio
113.0 122.9 139.7
151.17%196.67%
220.75%
2009 2010 2011
RM
B bi
llion
Balance of provision NPL Coverage Ratio
15.4 15.6 19.3
0.38%0.29% 0.32%
2009 2010 2011
RM
B bi
llion
Impairment losses on loans Credit Cost

29
Effective Cost Control
Breakdown of operating expenses Cost to income ratio continued to decrease
34.92%
34.16%
33.07%
2009 2010 2011
Cost to income ratio(Calculated under domestic regulations)
down by 0.76 ppt
down by 1.09 pps
43.6% 43.2%
25.2%25.2%
8.4%8.7%11.8%
13.2%7.3%
5.4%3.7%
4.3%
2010 2011
RM
B bi
llion
Staff costs General operating and administrative expensesDepreciation and amortizationBusiness and other taxesInsurance benefits and claimsOther
122.4
140.8grew by 15.0%

Market Recognition Enhanced
The World’s Best Foreign Exchange Providers (China)
Best Chinese Trade Finance Bank
Most Influential Bank in AsiaBest Chinese-funded Private BankingBest Corporate Citizen
Best Product Innovation Award among Chinese Banks
30
The BrandZ Top 50 Most Valuable Chinese Brands
Best Board of Directors Award
Best Trade Finance Bank in ChinaBest Branch Banking in Asia PacificBest RMB Clearing Bank in Asia Pacific
Best Bank in ChinaBest Private Bank in ChinaBest Syndicated Loan Arranger in China
Information Disclosure Award 2011
Raised BOC’s rating toA/A-1

31
2012 Outlook for Key Financial IndicatorsImprove net interest margin
Keep credit cost within reasonable range
Enhance proactive and forward-looking risk managementStrengthen management of loans granted to local government finance vehicle and property sector, strictly restrict loans granted to industries with overcapacityKeep credit cost under 0.65%
Stable growth of non-interest income
Accelerate marketing of cross-border and overseas businesses to boost rapid growth of clearing and settlement fee incomeAccelerate development of third-party custodian business and sales of fund, insurance etc.Strengthen comprehensive operation to drive the rapid growth of non-commercial bank income
Lower cost to income ratioIncrease investment in market development
Strictly control administrative expenditure
Improve resource allocation efficiency to lower cost to income ratio
Outlook for key financial indicators
Optimize asset structure to increase yield. Expand small and medium-sized enterprisesbusinessStrive to expand core deposit to lower funding cost. Absorb low cost and stable deposits from government administrative institutions. Fully leverage on trade finance and settlement to increase sunk fundExpand usage channel of overseas RMB funds to improve overseas net interest margin
31

32
Q&A