center for information services and high performance
TRANSCRIPT

Nöthnitzer Straße 46
Raum 1026
Tel. +49 351 - 463 - 35048
Holger Brunst ([email protected])
Matthias S. Mueller ([email protected])
Center for Information Services and High Performance Computing (ZIH)
Performance Analysis of
Computer Systems
Dec. 14, 2011 – Energy Efficiency

Content
Motivation: Why is energy efficiency important?
Basics
Energy Efficiency Benchmarks and Activites
– Green500
– SPEC power_ssj2008
– Experiences with SPEC MPI
Matthias Müller

Nöthnitzer Straße 46
Raum 1026
Tel. +49 351 - 463 - 35048
Holger Brunst ([email protected])
Matthias S. Mueller ([email protected])
Center for Information Services and High Performance Computing (ZIH)
Motivation: Single CPU

Single Core Peak Performance and Processor TDP
Matthias Müller
0,01
0,1
1
10
100
1993
1994
1995
1996
1997
1998
1999
2000
2001
2002
2003
2004
2005
2006
2007
2008
2009
2010
Performance/Core [GFLOPS]
TDP [W]

Trends of CPU properties (single socket)
Kathy Yelick: „Ten Ways to Waste a Parallel Computer“
Keynote ISCA 2009. The 36th International Symposium on Computer Architecture
(mit Daten von Kunle Olukotun, Lance Hammond, Herb Sutter,Burton Smith, Chris
Batten und Krste Asanoviç)
Matthias S. Müller

Energieeffizienz im Hochleistungsrechnen
Ron Dreslinski: Near Threshold Computing: Reclaiming Moore's Law, Keynote EnA-HPC 2011
Matthias S. Müller

Zellescher Weg 12
Willers-Bau A113
Tel. +49 351 - 463 - 39835
Matthias Müller ([email protected])
Center for Information Services and High Performance Computing (ZIH)
Motivation: HPC Systems

Performance trend documented by TOP500
Matthias Mueller
1.167 TF/s
16.96 PF/s
59.7 GF/s
1.11 PF/s
0.4 GF/s
12.6 TF/s
1993
1994
1995
1996
1997
1998
1999
2000
2001
2002
2003
2004
2005
2006
2007
2008
Su
m
#1
#5
00
IBM
BladeCenter NECEarth Simulator
Intel ASCI
Red
IBM ASCI
White
Fujitsu
'NWT' NAL
1 Gflop/s
1 Tflop/s
100 Mflop/s
100 Gflop/s
100 Tflop/s
10 Gflop/s
10 Tflop/s
1 Pflop/s
10 Pflop/s
100 Pflop/s

TOP500 List June 2009: Nr. 1 and Nr. 2 Systems
Cray XT5 (Jaguar) at ORNL
Nr. 2 system
AMD Opteron QuadCore
6.95 MW
IBM Roadrunner at LANL
Nr. 1 system
IBM Cell (+ AMD Opteron)
2.35 MW

TOP500 Performance Trend
Matthias Müller
ExaFLOP in 2019
2 orders of magnitude in 7 years
ExaFLOP
PetaFLOP
TeraFLOP
GigaFLOP

Driving Forces behind the TOP500 performance trend
Moore s law
Parallelism (#Cores)
Processor performance
1.167 TF/s
16.96 PF/s
59.7 GF/s
1.11 PF/s
0.4 GF/s
12.6 TF/s
19
9
19
9
19
9
19
9
19
9
19
9
19
9
20
0
20
0
20
0
20
0
20
0
20
0
20
0
20
0
20
0
Su
m
#1
#5
00
IBM
BladeCenter NECEarth Simulator
Intel ASCI
Red
IBM ASCI
White
Fujitsu
'NWT' NAL
1 Gflop/s
1 Tflop/s
100 Mflop/s
100 Gflop/s
100 Tflop/s
10 Gflop/s
10 Tflop/s
1 Pflop/s
10 Pflop/s
100 Pflop/s
System Performance

Energy Efficiency of Intel CPUs (TDP/Peak Performance)
1E-09
1E-08
1E-07
1E-06
1993
1994
1995
1996
1997
1998
1999
2000
2001
2002
2003
2004
2005
2006
2007
2008
2009
2010
2011
Joul
e/FL
OP
Matthias Müller
1 order of magnitude in 7 years

Estimated Energy Consumption of TOP500 systems
Matthias Müller
1 order of magnitude in 7 years
MegaWatt

1993
1994
1995
1996
1997
1998
1999
2000
2001
2002
2003
2004
2005
2006
2007
2008
2009
2010
2011
2012
2013
2014
2015
2016
2017
2018
2019
2020
2021
2022
2023
2024
2025
2026
2027
2028
2029
Extrapolation of Energy Consumption

Investment and power costs during 5 years
Year Invest Energy
2006 150.000.000 21.000.000
2011 150.000.000 105.000.000
2019 150.000.000 1.383.000.000

Energy Consumption Scenario 2: Max Power 20 MW

Hitting the Energy Wall: What Is Next?
Energy efficiency hit us hard
– It is hard to translate transistors into performance
Multicore (curse)
When and how will it hit again?
– OoO execution and hardware prefetchers are inefficient
– Can we drop cache coherency? Message passing is more efficient than shared memory parallelism. PGAS on-chip is an option.
– How about trading hardware managed caches for software managed local store?
– NTC may really hurt (Who wants to write error resilient applications?)
Matthias Müller

Nöthnitzer Straße 46
Raum 1026
Tel. +49 351 - 463 - 35048
Holger Brunst ([email protected])
Matthias S. Mueller ([email protected])
Center for Information Services and High Performance Computing (ZIH)
Basics

Vocabulary
Energy: ability a physical system has to do work W
Power: the rate at which work is performed or energy is converted P=W/T
Voltage (U), Current (I) P=U*I
Power:
– Active power (Wirkleistung)
– Apparent power (Scheinleistung)
– Reactive power (Blindleistung)
Matthias Müller

Zellescher Weg 12
Willers-Bau A104
+49 351 - 463 - 32055
Daniel Hackenberg ([email protected])
Center for Information Services and High Performance Computing (ZIH)
Power Measurement

Power Measurement Methodology (SPEC)

VampirTrace Plugin Counter Interface
Daniel Hackenberg, Robert Schöne
Testsystem
Messumgebung
Programm
Event-
Server
Tracepoint-
Plugin
Sensors-
Plugin
Dataheap-
Plugin
libsensors
Dataheap Server
Monitoring Server
Netzteil
Leistungmessgerät

Integration of Power Measurement
Temperatur (libsensors)
Leistungsaufnahme (dataheap)
Speicherverhalten (perf events)
Taktfrequenz (Kernel Tracepoints)
C states (Kernel Tracepoints)

Temperature Effect on Power Consumption
15 minutes of a constant workload
– AMD system: 15 watt increase
– Intel system: 10 watt increase
Daniel Molka
260
270
280
290
300
310
320
330
340
350
0 100 200 300 400 500 600 700 800 900
pow
er [w
att]
time [s]
power increase over time
Opteron 2435 Xeon X5670

Improved Power Measurement Setup
Power separately or remove:
– Chassis Fan(s), CPU Fan
– PSU Fan
– HDDs
– PCIe cards, DVD drive etc.
Measure 12V DC at P8 connector (1,6 W idle, >80 W peak)
Measure remaining voltage rails behind power supply (DC side)
Increase time resolution of power measurement
Include new CPU counters (package power consumption on Intel Sandy Bridge)
Use specifically modified mainboards with high precision resistors for current measurement (AMD Brazos/Llano)
Daniel Hackenberg

Zellescher Weg 12
Willers-Bau A104
+49 351 - 463 - 32055
Daniel Hackenberg ([email protected])
Center for Information Services and High Performance Computing (ZIH)
Power Consumption

Energy Consumption of Components
Machine Type Watt
IBM Power7 8-core 3000 MHz (750-8233-E8B) 183
4 GB DIMM 12
8 GB DIMM 12
16 GB DIMM 16
Disk 10k rpm 7
Disk 15k rpm 9
SSD disk 8
PCI card 12
Numbers from IBM Systems Power Estimator (http://www-912.ibm.com/see/EnergyEstimator)

Dynamic Voltage and Frequency Scaling (DVFS)
P~V²*f
Reduced power consumption, reduced performance
P-State (Performance-State) consists of frequency/voltage setting
Higher P-State lower frequency/voltage
More techniques:
– C-States (Microprocessor and package idle state - processor sleep, power gating)
– T-States (Microprocessor throttle-state - skipping cycles)
– S-States (system sleep states)

Simple Model with constant voltage design
High frequency: T=c4 W=c1*c4+c2*c4*V²*f W~f
Holger Brunst, Matthias Müller: Leistungsanalyse
P=c1+c2*V²*f , W=P*T
Low frequency: T=c3/f W=c1*c2/f+c3*V² W~1/f
W
f
W~f
W~1/f

P-States Example
P-State Multiplier Voltage Frequency f V^2*f
P-State 0: 13.00000 1225 mV 2600 MHz 3.25 12.32 P-State 1: 10.50000 1175 mV 2100 MHz 2.63 7.71 P-State 2: 8.50000 1150 mV 1700 MHz 2.13 4.94 P-State 3: 7.00000 1125 mV 1400 MHz 1.75 3.28 P-State 4: 4.00000 1050 mV 800 MHz 1.00 1.00
Holger Brunst, Matthias Müller: Leistungsanalyse
AMD Istanbul CPU

Combining Benchmarking and Power Measurements
Relevant metric: Energy consumption per workload [Joule]
Find optimal working points for different workloads
0
10
20
30
40
50
60
70
80
wupwise swim mgrid applu galgel equake apsi gafort fma3d art
SPECompM on Intel Xeon X5570 Energy Consumption per Benchmark Run
1600 MHz 2000 MHz 2800 MHz 2933 MHz turbo
Daniel Hackenberg

Nöthnitzer Straße 46
Raum 1026
Tel. +49 351 - 463 - 35048
Holger Brunst ([email protected])
Matthias S. Mueller ([email protected])
Center for Information Services and High Performance Computing (ZIH)
Benchmarks

Nöthnitzer Straße 46
Raum 1026
Tel. +49 351 - 463 - 35048
Holger Brunst ([email protected])
Matthias S. Mueller ([email protected])
Center for Information Services and High Performance Computing (ZIH)
Green500
http://www.green500.org

Green 500 List (November 2011)
Holger Brunst, Matthias Müller: Leistungsanalyse

Trends in Energy Efficiency in Green500
Green500 List MFLOPS/W Site* Computer*
Nov 2007 357.23 Science and Technology Facilities Council - Daresbury Laboratory "Blue Gene/P Solution
June 2008 488.14 Fraunhofer ITWM
"BladeCenter QS22 Cluster, PowerXCell 8i 3.2 Ghz, Infiniband
Nov. 2008 536.24
Interdisciplinary Centre for Mathematical and Computational Modelling, University of Warsaw
"BladeCenter QS22 Cluster, PowerXCell 8i 4.0 Ghz, Infiniband
June 2009 536.24
Interdisciplinary Centre for Mathematical and Computational Modelling, University of Warsaw
"BladeCenter QS22 Cluster, PowerXCell 8i 4.0 Ghz, Infiniband
Nov. 2009 722.98 Forschungszentrum Juelich (FZJ)
QPACE SFB TR Cluster, PowerXCell 8i, 3.2 GHz, 3D-Torus
June 2010 773.38 Forschungszentrum Juelich (FZJ)
QPACE SFB TR Cluster, PowerXCell 8i, 3.2 GHz, 3D-Torus
Nov. 2010 1684.20 IBM Thomas J. Watson Research Center NNSA/SC Blue Gene/Q Prototype
June 2011 2097.19 IBM Thomas J. Watson Research Center NNSA/SC Blue Gene/Q Prototype 2
Nov. 2011 2026.48 IBM - Rochester
BlueGene/Q, Power BQC 16C 1.60 GHz, Custom
Holger Brunst, Matthias Müller: Leistungsanalyse

Run rules for Green500
Holger Brunst, Matthias Müller: Leistungsanalyse
New run rules (5 pages) since Oct. 19, 2010
Assuming that
– (1) the computational workload during the Linpack benchmark is well-balanced across all units, and
– (2) all units are identical and consume the same amount of power for the same workload.
Power extrapolation: P = N · Punit : „Calculate total FLOPS/watt of the supercomputer by multiplying subcomponent’s FLOPS/watt by the number of “subcomponent” as defined in Section 1.O. „

Nöthnitzer Straße 46
Raum 1026
Tel. +49 351 - 463 - 35048
Holger Brunst ([email protected])
Matthias S. Mueller ([email protected])
Center for Information Services and High Performance Computing (ZIH)
SPEC power_ssj2008

SPEC Power and Performance Methodology
An introduction on power and performance metrics for computer systems
Guidance for Power and Performance benchmark development (existing and new
designs)
Methodology – captures the experience/conclusions of the SPECpower committee
since January 2006
http://www.spec.org/power_ssj2008/docs/SPECpower-Methodology.pdf
SPECpower_ssj2008 First industry standard benchmark that measures the power and performance
characteristics of server-class compute-equipment. A leap forward in power and
performance analysis of Enterprise Computer Servers
Released end of 2007
http://www.spec.org/power_ssj2008/
October 21, 2010 38
History of Power Metrics at SPEC

SPECpower_ssj2008 – First industry standard benchmark that measures the power and performance
characteristics of server-class compute-equipment. A leap forward in power and performance analysis of Enterprise Computer Servers
– Released end of 2007
– 190+ published results at SPEC
– Submission from 20 companies world-wide
– Over 4.5x energy efficiency gain since SPECpower_ssj2008 released • 698 - 3210 overall ssj_ops/watt
(best result from first submission cycle to the best current result)
– http://www.spec.org/power_ssj2008/
SPECweb2009 and SPECvirt_sc2010 – First industry standard benchmarks that measure the power and performance
characteristics of web serving compute-equipment and datacenter servers used in virtualized server consolidation.
39
SPEC power overview

Variable System Utilization
Holger Brunst, Matthias Müller: Leistungsanalyse

Metric of SPECpower_ssj2008

SPECpower_ssj2008 V1.10 - FDR
October 21, 2010 42

Trends in Energy Proportionality and Efficiency
System of 2007:
•Supermicro 6025B-TR+ (Intel Xeon processor L5335)
•799 ssj_ops/watt at 100% load
System of 2011:
•HP ProLiant DL165 G7 (AMD Opteron 6276 processor)
•3827 ssj_ops/watt at 100% load

Trend in Power Consumption (Peak vs. Idle)
Holger Brunst, Matthias Müller: Leistungsanalyse

Daniel Hackenberg
Summary SPECpower_ssj2008
Industry-standard benchmark that
– Evaluates the power and performance characteristics of
– Volume server class and multi-node class computers
Very mature benchmark methodology
– Dedicated power daemon for accepted power meters only
– Records current, voltage, power factor, temperature
– Very strict run rules
BUT
– Java Workload
– Strongly VM dependent
– Servers typically run Windows

Nöthnitzer Straße 46
Raum 1026
Tel. +49 351 - 463 - 35048
Holger Brunst ([email protected])
Matthias S. Mueller ([email protected])
Center for Information Services and High Performance Computing (ZIH)
Experiences with SPEC MPI

Daniel Hackenberg
What We Need
An HPC benchmark with a sophisticated power measurement methodology
SPEC MPI2007
– Industry-standard HPC benchmark
– Averages the results of 12 MPI applications that are common in HPC
– Medium data set scales up to 128 MPI ranks, runs up to 512 ranks
– Large data set scales up to 2048 ranks, tested up to 4096 ranks
Challenge:
– Companies probably do not want to measure each node
– We need run rules that ensure that hardware vendors do not cheat (too much)

Daniel Hackenberg
Test Equipment Overview
Test System: IBM iDataPlex
– 32 nodes, each with 12x 4 GB DDR3, 250 GB HDD, QDR IB
– 64x Intel Xeon E5530, 2.4 GHz, 80W TDP
– Turbo Boost up to 2.66 GHz, HyperThreading off
Power Meter
– 1x ZES LMG 450 (4 channel)
– 1x ZES LMG 95 (1 channel)
– Measuring compute nodes only, no switches, no I/O
Benchmark: SPEC MPI2007 V2.0
– medium data set
– Intel Compiler Suite 11.1, Open MPI 1.4.1

Test System & Power Measurements
Daniel Hackenberg

Test System & Power Measurements
Daniel Hackenberg

Daniel Hackenberg
Old vs. New
Comparing the power consumption of
– a 2005 LNXI dual core Opteron Cluster
– a 2010 IBM iDataPlex quad core Nehalem Cluster
Linpack 107.leslie3
d
104.milc Idle
Cluster 2005 100 % 92 % 87 % 65 %
Cluster 2010 100 % 83 % 71 % 26 %

Per-Node Power Consumption Variation: Idle
Daniel Hackenberg
11 W
7%
Idle variations become bigger as soon as you swap broken parts
We have seen >12% in our Opteron Cluster

Per-Node Power Consumption Variation: Linpack
Daniel Hackenberg
27 W
5%
Relative per-node power variation of idle and Linpack similar

Power Consumption Variation of 256 Intel Nehalem Cores
Daniel Hackenberg
100 %
70 %
26 %
83 %

Power Consumption Variation of an IB Switch
Daniel Hackenberg
0.2%
IB switch power consumption independent of the IB network traffic
Power Consumption Variation over Runtime
0
2000
4000
6000
8000
10000
50 100 150 200 250 300 350 400
Pow
er [W
atts
]
Time [s]
122.tachyon128.GAPgeofem
130.socorro
Daniel Hackenberg
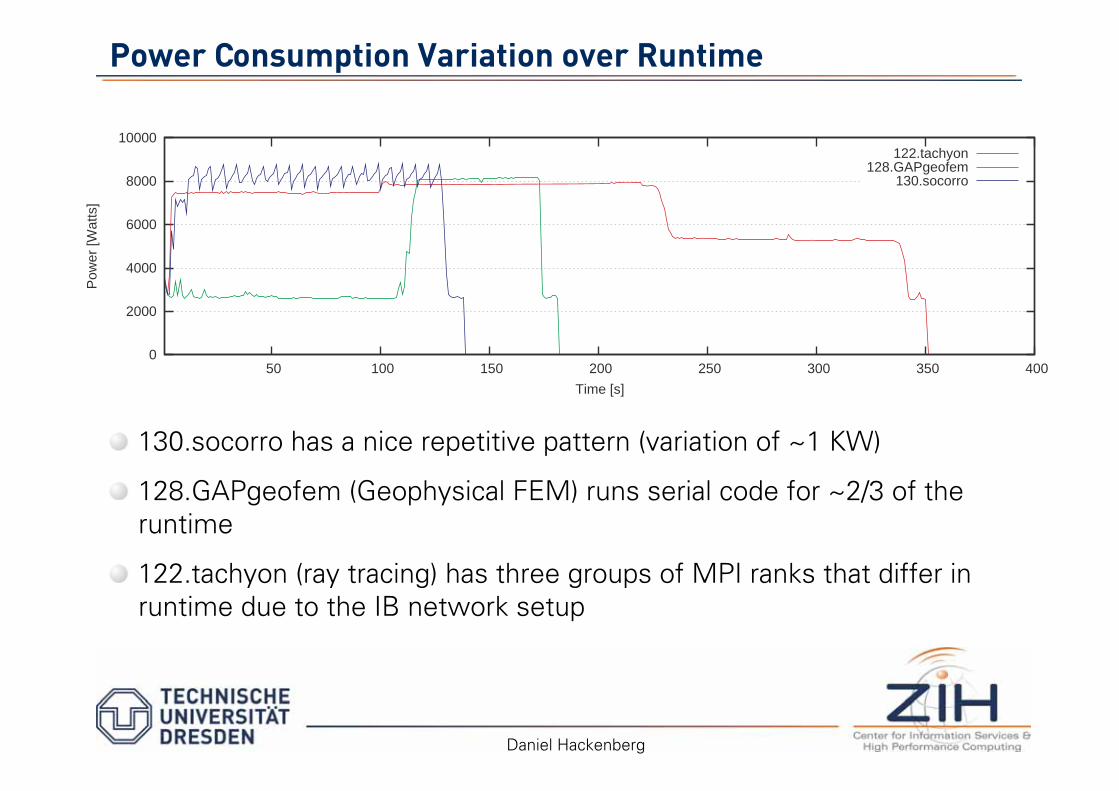
130.socorro has a nice repetitive pattern (variation of ~1 KW)
128.GAPgeofem (Geophysical FEM) runs serial code for ~2/3 of the runtime
122.tachyon (ray tracing) has three groups of MPI ranks that differ in runtime due to the IB network setup

Power Measurement Software Infrastructure
IBM x iDataPlex
16
17
18
19
30
31
Switch
IBM x iDataPlex
0
1
2
3
14
15
Switch
Power Client
PTDaemon
LMG 95
PTDaemon
LMG 450
Node
Double Nodewith shared power supply
Voltage
RS 232
QDR Infiniband
Node 0-29 (240 cores) measured by one power meter
Node 30+31 (16 cores) measured by a second power meter
IB switch is powered separately
Daniel Hackenberg

Test Series
Daniel Hackenberg
Node0
Power
supply
Rank 0-7 Rank 8-15
Node1 Node28
Power
supply
Node29
Rank 224-231 Rank 232-239
Node30 Node31
Rank 240-247 Rank 248-255
Rank Group 0 Rank Group 14 Rank Group 15
LMG 95LMG 450
Rank 240-247 Rank 248-255 Rank 208-215 Rank 216-223 Rank 224-231 Rank 232-239
Rank Group 14
Setup 0
Setup 1
Rank Group 13Rank Group 15
Power
supply
Node2
Rank 16-23 Rank 24-31
Node3
Rank Group 1
Rank 0-7 Rank 8-15
Rank Group 0
Power
supply
16 MPI rank groups, each group has 16 MPI ranks
MPI rank groups cycle through the 16 double-nodes
rank group 15 measured separately
rank group 14 measured separately

Power Consumption of MPI Rank Groups
Daniel Hackenberg
84 W
17%
8 SPEC MPI2007 benchmarks show very small power variations

Power Consumption of MPI Rank Groups
Daniel Hackenberg
344 W
69%
4-5 SPEC MPI2007 benchmarks show significant power variations

Power Consumption Extrapolation Correctness
Daniel Hackenberg
There is no single MPI rank group that can be used for a good extrapolation
For SPEC MPI2007, using the first rank group(s) usually works (you do not underestimate, except for tachyon)

Daniel Hackenberg
Conclusions
Power consumption variations are growing, therefore
Power consumption extrapolation is difficult
We need industry standard HPC benchmarks that
– Include a power metric
– Have well-defined run rules
– Hopefully do not require companies to buy one power meter per node
SPEC OMP/MPI2007 aims to fill that gap
SPEC OMP currently in an early stage of defining run rules
SPEC MPI2007 will take a bit longer

Daniel Hackenberg
Full Paper Available
http://www.springerlink.com/content/bg6j875q82161605/