center for training transportation professionals … for training transportation professionals ......
TRANSCRIPT

2018
1
SoilsTesting Technician
cttpCenter for TrainingTransportation Professionals
Course Overview
♦Terminology
♦Soil Classification
♦Sampling
♦Soil Preparation
♦Moisture Content• Oven• Speedy Moisture Tester
♦Atterberg Limits• LL, PL, PI
♦Moisture Density Relationships
• Standard Proctor• Modified Proctor
♦Compaction• Nuclear Density Gauge
♦ARDOT Specifications
2

2018
2
Test Day
♦Written Exam• ≈ 60 Questions• Closed Book Exam• 2 Hour Time Limit• 70 % Overall Required
to Pass Exam
♦Results• www.cttp.org• Letter & Certificate
♦Performance Exam• 4 Exam Stations
~ Liquid Limit~ Plastic Limit~ Proctor ~ Nuclear Density Gauge
• 2 Attempts Allowed to Pass Each Station
3
Basic Aggregates Certification Renewal
♦5 Year Certification
♦To prevent expiration:• Take online Basic Aggregates Certification Renewal
course • Pass final quiz after all online modules are complete• Cost - $0 (none)• Extends Basic Aggregates Certification for 5 years
♦If not completed prior to expiration date, other CTTP certifications will be suspended
• Soils, Hot-Mix Asphalt, Concrete, Concrete Strength
4

2018
3
Unit Conversions
♦Weight / Mass• 1 ton 2000 lb• 1 lb 453.6 g• 1 kg 1000 g
♦Convert 15 lb to grams
. ♦Convert 6804 g to lb
. 5
Introduction
♦Soil • Naturally occurring
unconsolidated rock particles, organic matter, water, and air
♦Testing• Grain Size influences
the stability and maximum load bearing capacity of a soil
• Behavior Characteristicspredict how a soil will behave to changes in moisture
• Density optimizes the engineering properties of the soil for the intended application
6

2018
4
Terminology
♦Air Dried• Dried at ≤ 140°F
(60°C)~ Chemically bound
moisture is still present in the soil
~ Moisture Content ≠ 0
♦Oven Dried• Dried to a constant
mass at a temperature of 230 ± 9 °F (110 ± 5 °C)
~ No moisture is present in the soil sample
~ Moisture Content = 0
7
Classification of Soils… for Highway
Construction Purposes
AASHTO M 145
8Soil Classification
2018
5
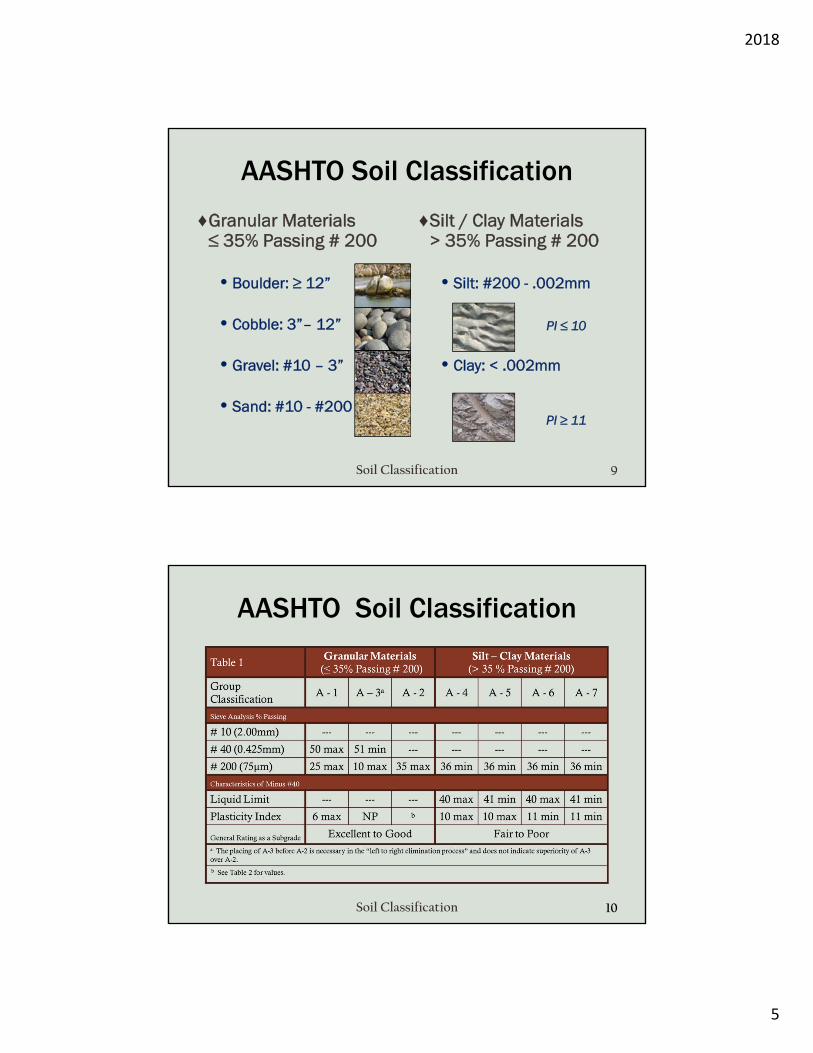
AASHTO Soil Classification
♦Granular Materials ≤ 35% Passing # 200
• Boulder: ≥ 12”
• Cobble: 3”– 12”
• Gravel: #10 – 3”
• Sand: #10 - #200
♦Silt / Clay Materials > 35% Passing # 200
• Silt: #200 - .002mm
• Clay: < .002mm
9Soil Classification
PI ≤ 10
PI ≥ 11
AASHTO Soil Classification
10Soil Classification

2018
6
AASHTO Soil Classification
11Soil Classification
♦Classify the following soil as a granular, silt, or clay material and determine the group number of the soil
> 35% Passing # 200 = Silt or Clay= A4, A5, A6, or A7
PI ≤ 10 = Silt = A4 or A5
LL ≥ 41 = A5
Silt - Group A5
Sampling Soils
AHTD 30
12Sampling

2018
7
Apparatus ♦Back hoe, auger, post hole digger, shovel
♦Sample Containers• Should prevent the loss of
fines and moisture~ Sealable plastic containers ~ Heavy doubled paper bags
are ok if moisture is not to be maintained
~ Unlined cloth or open weave bags should not be used
13Sampling
Sampling ♦Sample Numbers• Areas must be enclosed
by at least three samples~ Risk factor of failure~ Uniformity of soil
• Typical Spacing~ Highway: 200’ – 2000’~ Borrow Pits: 100’ – 400’~ Earth Dams: 50’ – 150’
14Sampling
Look for changes in soil types, color, or texture
2018
8
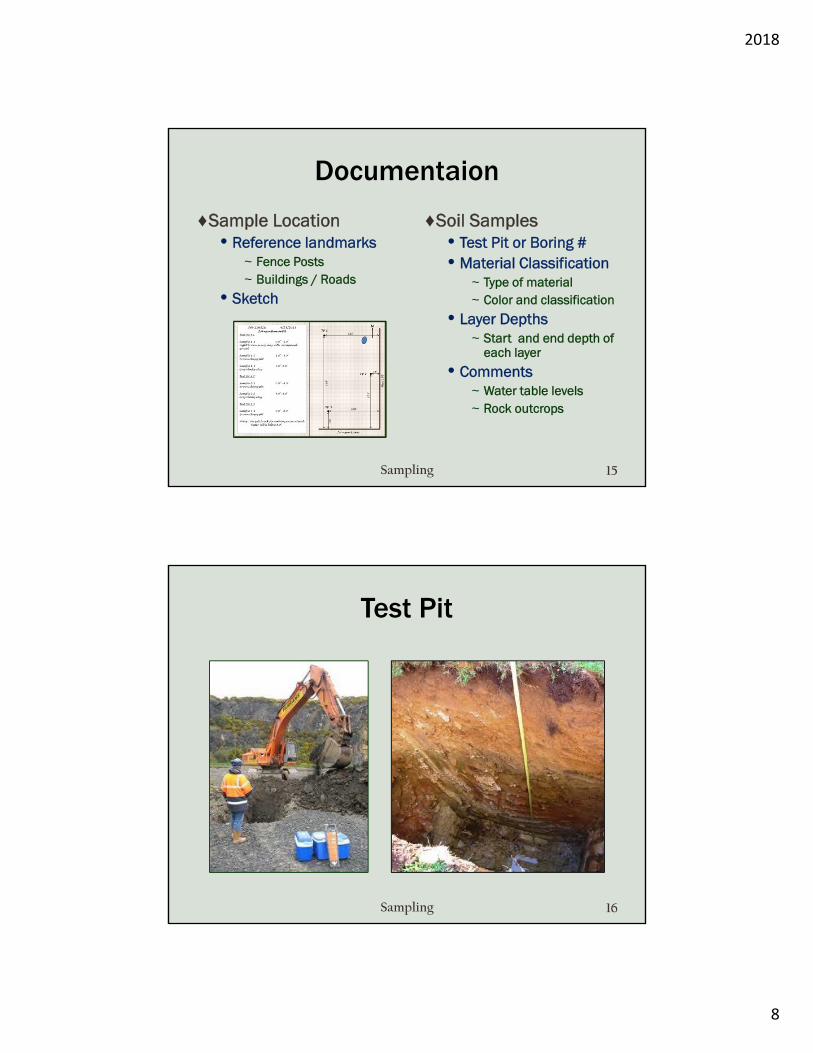
Documentaion
♦Sample Location• Reference landmarks
~ Fence Posts~ Buildings / Roads
• Sketch
♦Soil Samples• Test Pit or Boring #• Material Classification
~ Type of material~ Color and classification
• Layer Depths~ Start and end depth of
each layer
• Comments~ Water table levels~ Rock outcrops
15Sampling
Test Pit
16Sampling

2018
9
Boring
17Sampling
Dry Preparation of Disturbed
Soil… Samples for Test
AASHTO R 58
18Dry Preparation

2018
10
Apparatus
♦Drying Apparatus• Fan, heat lamp, oven
♦Sieves• 2”, ¾”, # 4, # 10, # 40• Additional sizes as
needed by specific test
♦Pulverizing Apparatus• Mortar & Rubber -
covered Pestle
• Power Equipment with Rubber -covered Rollers
19Dry Preparation
Individual grain sizes may not be reduced in size !
Procedure
♦Air dry material• ≤ 140 °F (60 °C)
♦Reduce sample• Split or Quarter
♦Select appropriate sieve according to test procedure to be performed
♦Process soil over specified sieve
♦Pulverize material retained on screen
• Rescreen the material• Repeat until all
composite soils are broken up
♦Combine and mix all material passing the specified screen
20Dry Preparation
Use AASHTO R 74 (Wet-Prep) for hard-to-process soils, or soils which need to
maintain their natural moisture contents

2018
11
Test Method for Moisture
Content of Soils…
AHTD 348
AASHTO T 265
21Moisture Content
Field Testing
22Moisture Content
♦ARDOT Specifications• Oven Drying
~ Most Accurate~ Slow Results
• Speedy Moisture~ Limited to finer grained soils~ Quick Results~ No license required
• Nuclear Density Gauge~ Accuracy may fluctuate based on
surrounding conditions~ Quick Results~ Nuclear license required

2018
12
Apparatus
♦Balance• 0.1 % of sample wt.
~ 10 g → 0.01 g~ 100 g → 0.1 g~ 500 g → 0.5 g
♦Oven• 230 ± 9 °F (110 ± 5 °C)
♦Moisture Tins• Corrosion Resistant• Close-fitting Lids
23Moisture Content
Procedure
♦Record tin number and empty weight of clean, dry, tin
• Tare weight
♦Place “wet soil” into tin• Cover with lid
♦Weigh sample tin
♦Record weight of “Wet Soil + Tare”
♦Dry sample at 230 °F to a constant mass
• Remove lid
24Moisture Content
2018
13
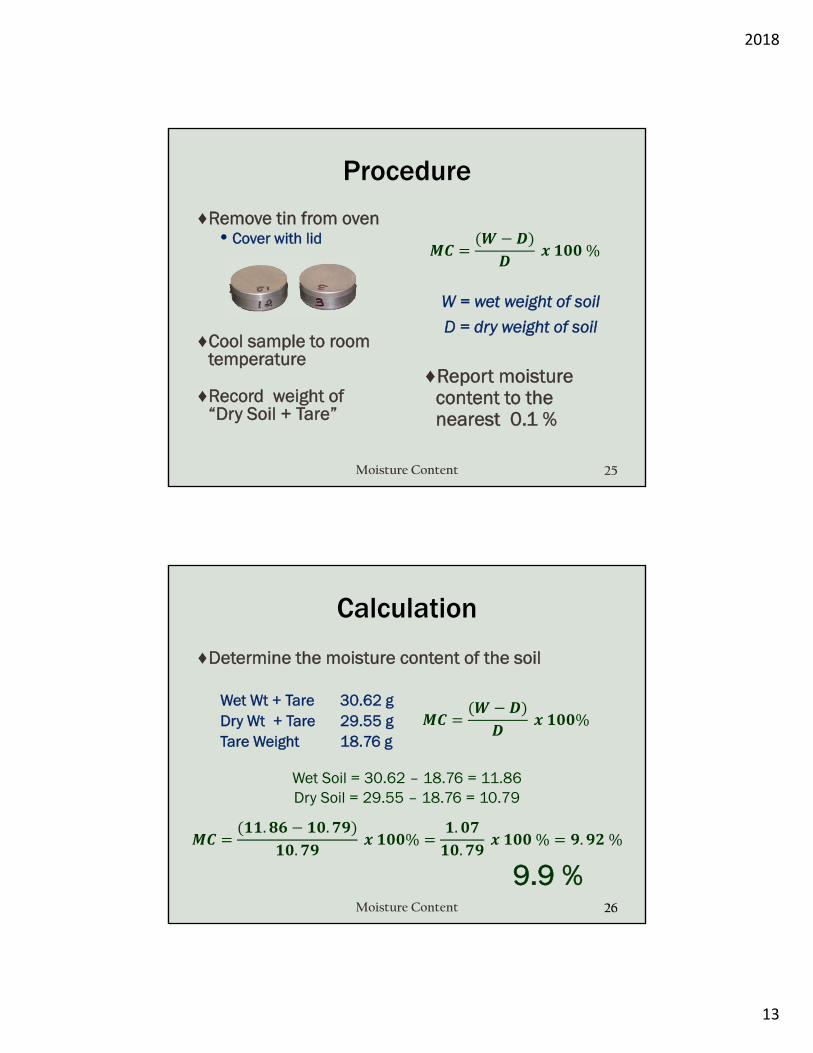
Procedure
♦Remove tin from oven• Cover with lid
♦Cool sample to room temperature
♦Record weight of “Dry Soil + Tare”
W = wet weight of soil
D = dry weight of soil
♦Report moisture content to the nearest 0.1 %
25Moisture Content
%
Calculation
♦Determine the moisture content of the soil
Wet Wt + Tare 30.62 gDry Wt + Tare 29.55 gTare Weight 18.76 g
26Moisture Content
Wet Soil = 30.62 – 18.76 = 11.86Dry Soil = 29.55 – 18.76 = 10.79
%. .. % . . % . %
9.9 %

2018
14
Calculation
♦Determine the moisture content of the soil
Wet Wt + Tare 44.75 gDry Wt + Tare 40.33 gTare Weight 13.00 g
27Moisture Content
Special Cases
♦Soil containing minerals which have loosely bound water from hydration
• Gypsum
♦Soil containing significant amounts of organic materials
♦Solutions
• Oven dry at ≈ 140°F
• Use vacuum desiccation at ≈ 10 mm Hg at a temperature of ≥ 73°F
28Moisture Content

2018
15
Sieve Analysis of Soils
AASHTO T 11
AASHTO T 27
29Sieve Analysis
Sieve Analysis of Soils
♦Determines the grain size distribution of soils
♦Used for:• Soil Classification• Specification
Compliance
♦Differences• Soil Sieve Sizes
~ 2”, 1½”, 1”, ¾”, 3/8”, #4, #10, #40, #200
• Washing~ Use wetting agent if
necessary~ Allow extra soak time
30Sieve Analysis

2018
16
ARDOT Specifications
♦Embankment Material• # 200 Specification
♦Plating Material• Protects subgrade
slopes and grows vegetative covers
• Typical specifications in range of PI = 10 –25
♦AHTD Select Materials• Foundation for base
course
31Sieve Analysis
Introduction
32Atterberg Limits
♦Atterberg limits characterize how a soil will behave with changes in moisture contents
• Liquid Limit• Plastic Limit• Plasticity Index
♦Liquid State• Flows and
changes shape easily
♦Plastic State• Moldable
and retains shape
♦Solid State• Breaks
rather than change shape
-- Liquid Limit --
-- Plastic Limit --
Plas
ticity
Inde
x

2018
17
Plastic Limit of Soils
AASHTO T 90
33Plastic Limit
Plastic Limit♦The lowest moisture
content at which the soil remains plastic
♦A soil is at its plastic limit when it begins to crumble when rolled to a 3 mm diameter
34Plastic Limit
2018
18
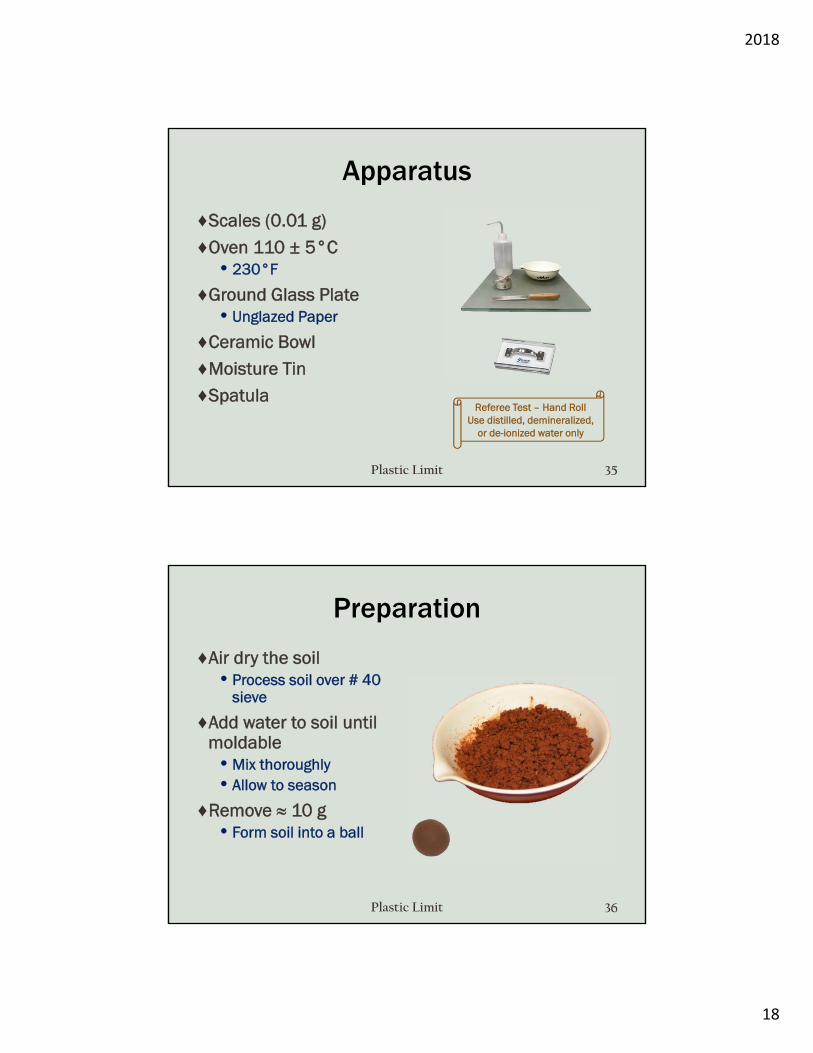
Apparatus
♦Scales (0.01 g)
♦Oven 110 ± 5°C• 230°F
♦Ground Glass Plate• Unglazed Paper
♦Ceramic Bowl
♦Moisture Tin
♦Spatula
35Plastic Limit
Referee Test – Hand RollUse distilled, demineralized,
or de-ionized water only
Preparation
♦Air dry the soil• Process soil over # 40
sieve
♦Add water to soil until moldable
• Mix thoroughly• Allow to season
♦Remove ≈ 10 g• Form soil into a ball
36Plastic Limit

2018
19
♦Roll specimen into a thread of 3 mm (≈ ⅛”) uniform diameter
• Roll on ground side of glass plate at 80-90 strokes per minute
• If thread crumbles before reaching 3 mm, add water and remix
Procedure
♦Record empty tin # and tare weight
♦Pinch off a small “pea” sized piece of soil and form an ellipsoidal shape
37Plastic Limit
≈ 10 g ≈ 1.5 – 2 g
Ball Pea Ellipsoid
♦Place crumbled soil portions into tin
• Cover tin with lid
♦Select another “pea” and repeat process until entire 10 g sample is tested
Procedure
♦When thread reaches 3 mm in diameter, re-form soil into an ellipsoidal shape
• Do not roll past 3 mm
♦Repeat rolling process until soil crumbles before reaching or just as it reaches 3 mm
38Plastic Limit
2018
20
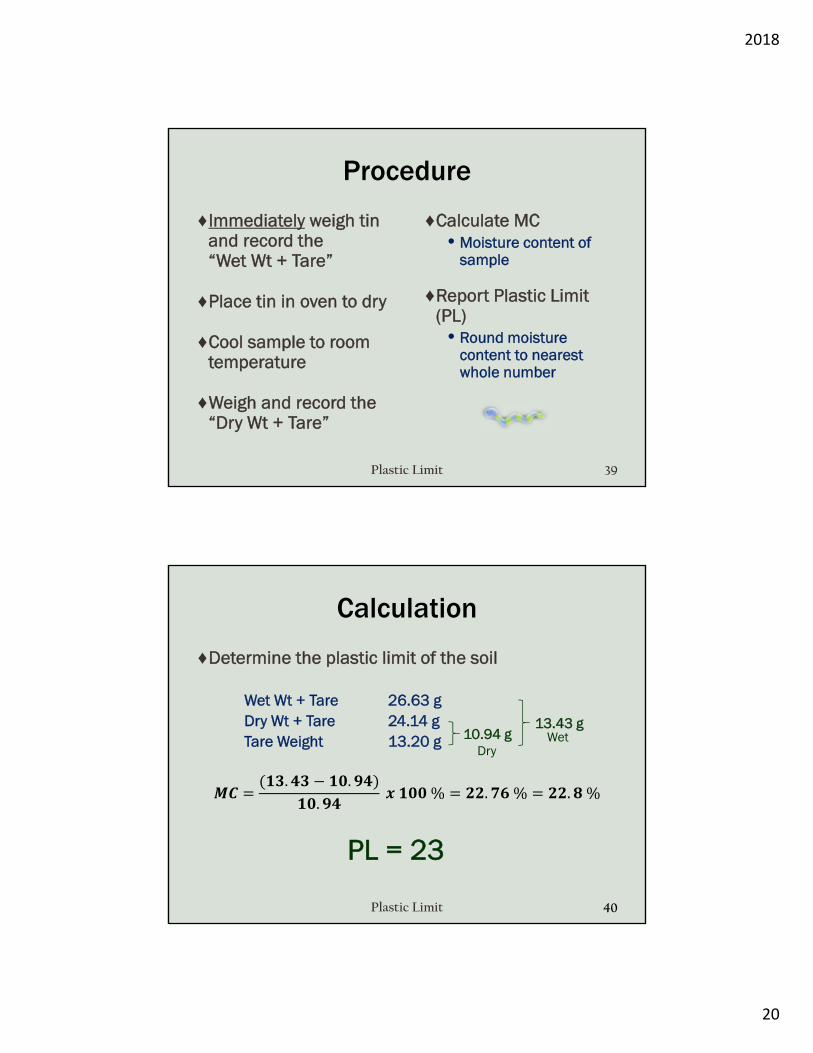
♦Calculate MC • Moisture content of
sample
♦Report Plastic Limit (PL)
• Round moisture content to nearest whole number
Procedure
♦Immediately weigh tin and record the “Wet Wt + Tare”
♦Place tin in oven to dry
♦Cool sample to room temperature
♦Weigh and record the “Dry Wt + Tare”
39Plastic Limit
Calculation
♦Determine the plastic limit of the soil
Wet Wt + Tare 26.63 gDry Wt + Tare 24.14 gTare Weight 13.20 g
40Plastic Limit
. .. % . % . %PL = 23
10.94 gDry
13.43 gWet
2018
21
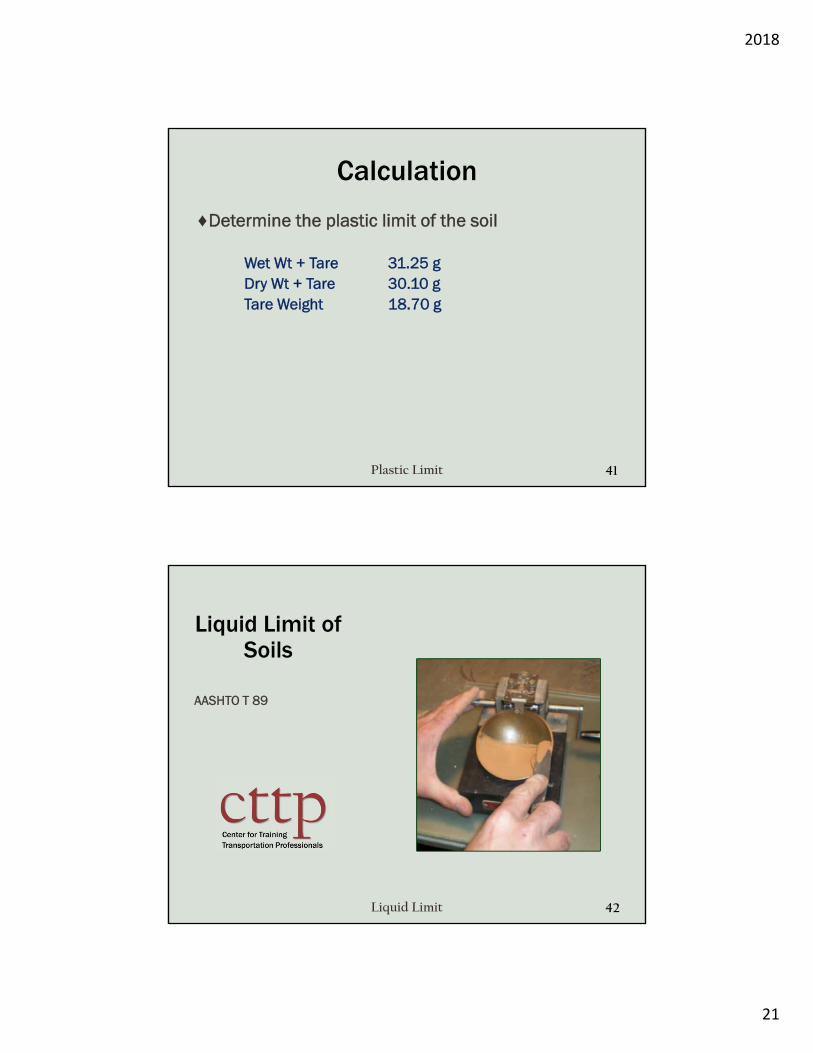
Calculation
♦Determine the plastic limit of the soil
Wet Wt + Tare 31.25 gDry Wt + Tare 30.10 gTare Weight 18.70 g
41Plastic Limit
Liquid Limit of Soils
AASHTO T 89
42Liquid Limit
2018
22
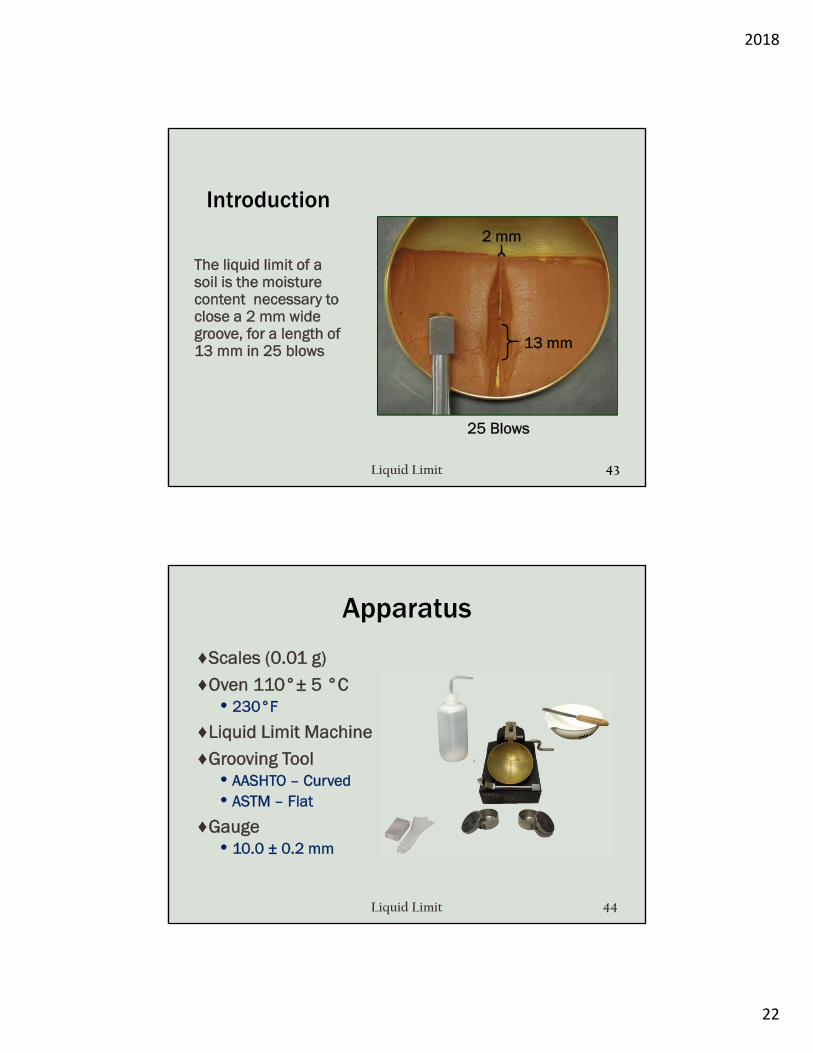
Introduction
The liquid limit of a soil is the moisture content necessary to close a 2 mm wide groove, for a length of 13 mm in 25 blows
43Liquid Limit
25 Blows
13 mm
2 mm
Apparatus
♦Scales (0.01 g)
♦Oven 110°± 5 °C• 230°F
♦Liquid Limit Machine
♦Grooving Tool• AASHTO – Curved• ASTM – Flat
♦Gauge• 10.0 ± 0.2 mm
44Liquid Limit

2018
23
LL Machine Check
♦Points of contact ♦Wear areas
♦Pin Play / Screws
45Liquid Limit
Calibrate Cup Drop
♦Dissect the point of contact with smooth side of tape
♦Lower cup so that it is resting on the base
♦Insert gauge block until it is in contact with the tape
~ Hold gauge block so that it lies flat against the base
♦Daily Check
46Liquid Limit

2018
24
Calibrate Cup Drop
♦Check drop height• Turn crank
~ Cup should make a clicking sound without lifting from gauge block
♦To adjust drop height• Loosen set screw• Turn adjustment screw• Tighten set screw
♦Re-check drop height• Reset gauge block• Check drop height
47Liquid Limit
Set Screw
AdjustmentScrew
Remember to remove tape when done!
Soil Preparation
♦Air dry soil
♦Dry or Wet Prep soil using # 40 sieve
♦Add water and mix until soil obtains a peanut butter-like consistency
• Add water in small increments
~ Adding water too rapidly may produce a “false” liquid limit value
♦If soil becomes too wet, do not add dry soil
• Use natural evaporation
48Liquid Limit

2018
25
ProcedureMethod B (1 Point)
♦Record empty tin #
♦Weigh and record empty tare weight
• Include lid
49Liquid Limit
Procedure Method B (1 Point)
50Liquid Limit
♦Place soil in cup• Depth of 10 mm• Avoid entrapment
of air bubbles within the soil
• Cover unused soil to retain moisture
10 mm

2018
26
ProcedureMethod B (1 Point)
♦Divide the soil in the cup with the grooving tool
• Cut groove along centerline of cup
~ Up to 6 strokes allowed to reach bottom of cup
~ No more cuts after touching the bottom of the cup
• Groove must be 2 ± 0.1 mm wide
51Liquid Limit
ProcedureMethod B (1 Point)
♦Turn Crank• 2 rev. / second• Count # blows• Stop at 13 mm closure• Do not hold device
♦Blow Range 22 - 28
♦# Blows outside 22 - 28• Adjust moisture & retry
♦# Blows 22 – 28• Immediately verify test
♦Verification Test• Redo test
~ Do not adjust moisture
• ± 2 blows of previous test• 22 – 28 blows
Liquid Limit

2018
27
ProcedureMethod B (1 Point)
♦Record blow count of verification test
♦Obtain MC sample• Take sample perpendicular
to groove and include the “closed” portion
• Sample weight ≥ 10 g
♦Record “Wet Wt. + Tare”♦Dry sample at 230 °F♦Cool sample♦Record “Dry Wt + Tare”
53Liquid Limit
ProcedureMethod B (1 Point)
♦Calculate moisture content (%)
♦Correct moisture content to 25 Blows
• K-factor
♦Report• Round corrected
moisture content to nearest whole number for the liquid limit
54Liquid Limit
⁄ .

2018
28
CalculationMethod B (1 Point)
♦Determine the liquid limit of the soil
Wet Wt + Tare 31.60 gDry Wt + Tare 27.14 g 27 blowsTare Weight 14.50 g
55Liquid Limit
. .. % . % . %. . .LL= 36
k27= 1.009
CalculationMethod B (1 Point)
♦Determine the liquid limit of the soil
Wet Wt + Tare 30.71 gDry Wt + Tare 28.32 g 23 blowsTare Weight 13.88 g
56Liquid Limit

2018
29
ProcedureMethod A (3 Point)
♦Record three tin #’s and tare weights
♦Obtain proper closure in each of the ranges
• (1) 25 – 35 Blows• (2) 20 – 30 Blows• (3) 15 – 25 Blows• No verification
♦Record blow counts
♦Obtain MC sample and weights from each point
♦Add additional water to adjust MC between points and mix well
♦Check blow count difference
• ≥ 10
57Liquid Limit
≥ 10
ProcedureMethod A (3 Point)
♦Calculate all three moisture contents
♦Plot MC vs # Blows• Semi-logarithmic paper• ½ way is ≈ 3/5
♦Draw “best fit” line
♦Find MC at 25 blows
♦Report Liquid Limit (LL)• Round MC at 25 blows to
nearest whole number
20 30 401030
32
34
36
38
40
Moi
stur
e C
onte
nt (
% )
Blow Count
Flow Curve
Liquid Limit
Blow Range # Blows MC
25 - 35 33 31.5
20 - 30 27 34.2
15 - 25 19 36.7
LL = 35
58
2018
30
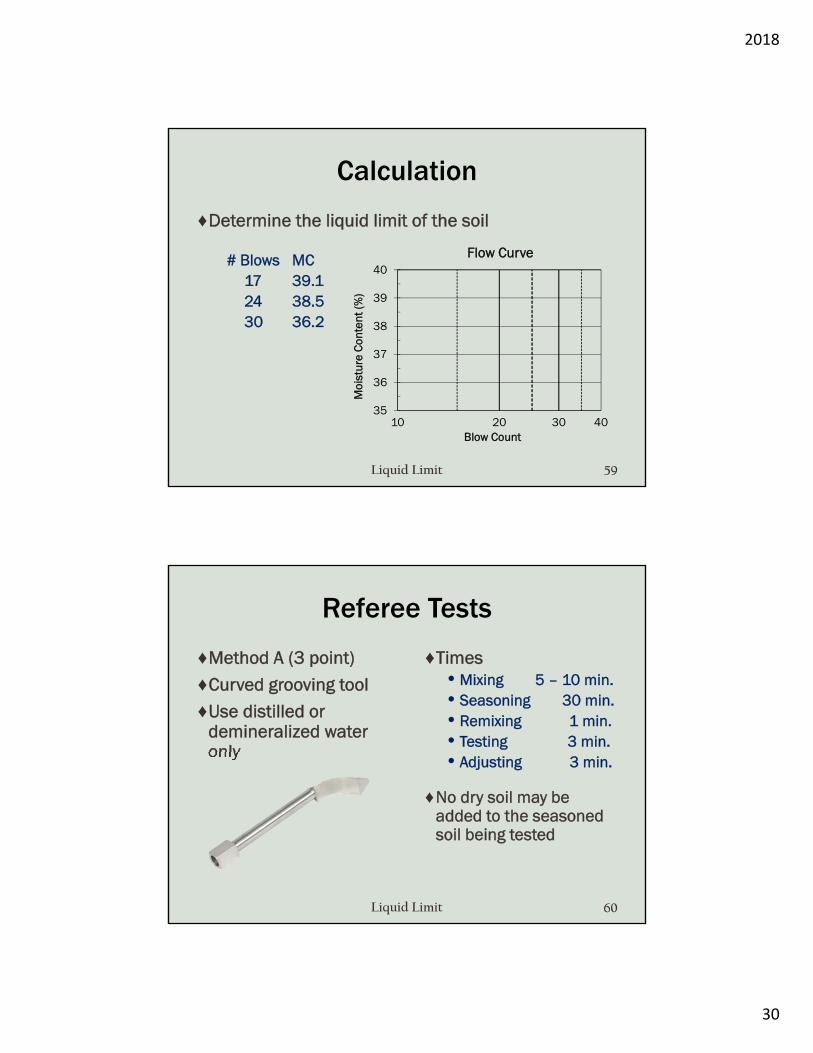
Calculation
♦Determine the liquid limit of the soil
# Blows MC17 39.124 38.530 36.2
Liquid Limit
20 30 401035
36
37
38
39
40
Moi
stur
e C
onte
nt (%
)
Blow Count
Flow Curve
59
Referee Tests
♦Method A (3 point)
♦Curved grooving tool
♦Use distilled or demineralized water only
♦Times• Mixing 5 – 10 min.• Seasoning 30 min.• Remixing 1 min.• Testing 3 min.• Adjusting 3 min.
♦No dry soil may be added to the seasoned soil being tested
60Liquid Limit

2018
31
Plasticity Index of Soils
AASHTO T 89
61Plasticity Index
♦Plasticity Index (PI) is the range of moisture contents where the soil exhibits plastic properties
• Higher PI Values (> 10)~ Clayey soils
• Lower PI Values (≤ 10)~ Aggregates~ Sands~ Silts
Calculation
♦Report PI to the nearest whole number
♦Determine the plasticity index of the soil
LL = 37 PL = 23
62Plasticity Index
PI = Plasticity IndexLL = Liquid LimitPL = Plastic Limit
PI = 14
2018
32
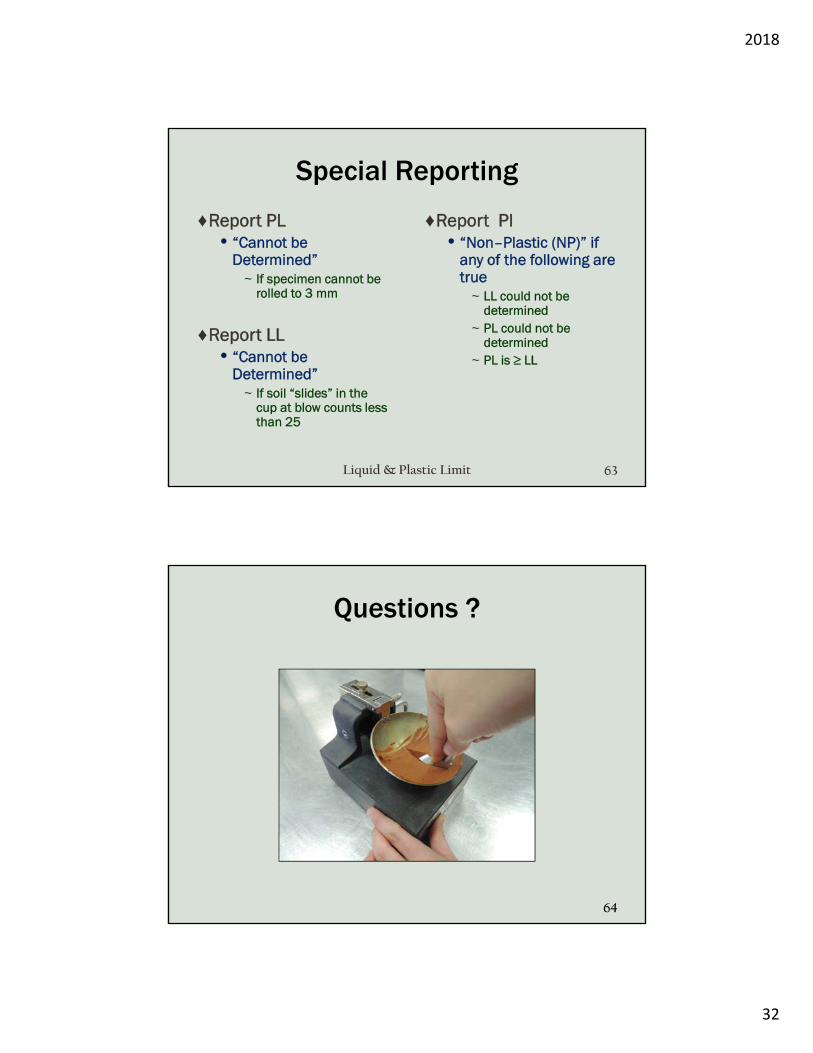
Special Reporting
♦Report PL• “Cannot be
Determined”~ If specimen cannot be
rolled to 3 mm
♦Report LL • “Cannot be
Determined” ~ If soil “slides” in the
cup at blow counts less than 25
♦Report PI• “Non–Plastic (NP)” if
any of the following are true
~ LL could not be determined
~ PL could not be determined
~ PL is ≥ LL
63Liquid & Plastic Limit
Questions ?
64

2018
33
Water
Moisture content is based on the dry weight of soil
65Water
Air
Water
Solids(dry soil)
WA
D
WW
W
%
Water
♦Δ MC - % Desired change in moisture content• Δ MC = Target MC - MC
♦W – Wet weight of soil or total weight of soil
♦D – Dry weight of soil
♦To determine how much water is needed for a desired Δ MC :
• Dry Weight of soil known:
66Water
%

2018
34
Water
♦The dry weight of a soil sample is 2000.0 g. How much water will need to be added for the soil to contain 3 % moisture ?
60 g or 60 mL
67Water
%% . %
Water Calculation
♦The dry weight of a soil sample is 2500.0 g. How many mL of water will need to be added for the soil to contain 10.2 % moisture ?
68Water

2018
35
Water
♦To determine how much water is needed for a desired Δ MC :
• Wet Weight of soil known:
. %. Δ . Δ %69Water
This equation is the moisture content equation
rearranged
Water
♦A 2630 g soil sample has a moisture content of 3.4 %. How many mL of water do you need to add to bring the soil sample to 12.0 % moisture?
. . %% . .
. . % . % . %
. ∆ % . . %% 70Water
219 mL
2018
36
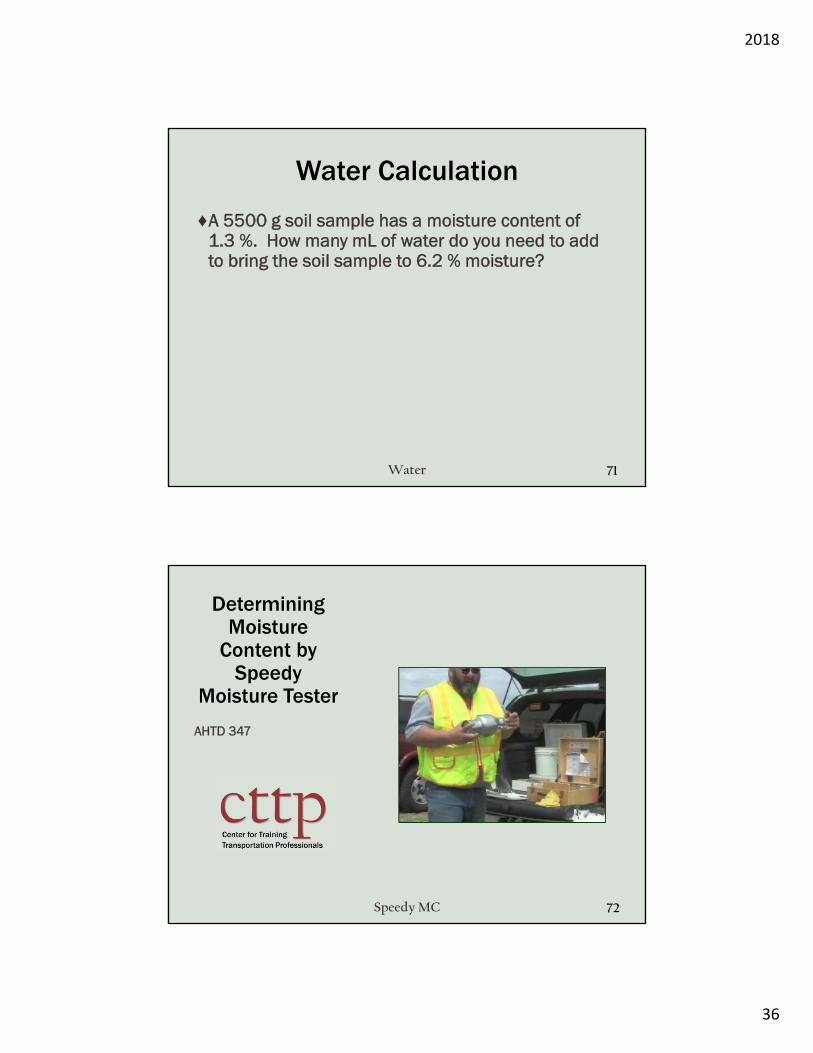
Water Calculation
♦A 5500 g soil sample has a moisture content of 1.3 %. How many mL of water do you need to add to bring the soil sample to 6.2 % moisture?
71Water
Determining Moisture
Content by Speedy
Moisture Tester
AHTD 347
72Speedy MC

2018
37
Introduction
♦Alternative method to oven drying for fine grained soils
• Not quite as accurate• Quicker test• No license to operate
♦Calcium carbide reacts with the water in the soil
♦Reaction produces acetylene gas
♦Gas pressure inside the meter is measured and converted to a moisture content
• Based on wet mass
73Speedy MC
Introduction
♦Testers come in many sizes and require different standard sample sizes
• 20 g Tester• 26 g Tester• 200 g Tester
♦Standard sample size for this class is 20 g
♦Caution – Calcium carbide reacts violently with water
74Speedy MC

2018
38
Procedure
♦Clean tester chamber and cap prior to use
♦Tilt chamber on side and roll (2) steel balls into chamber• Avoid dropping
balls directly onto pressure port
75Speedy MC
Note : Procedures are written for a Standard Sample Size of 20 g
Procedure
♦Place 3 scoops (≈ 24 g) of calcium carbide into chamber
♦Prepare soil sample
• Pulverize or break into small pieces
76Speedy MC

2018
39
Procedure
♦Weigh out 20 g of soil• Check your individual
tester specifications
♦Place soil into cap
♦Keep chamber on it’s side and secure the cap
• Prevents soil mixing with reagent
77Speedy MC
Procedure
♦Raise tester to a vertical position
• Soil must mix with reagent to produce gas
♦Shake horizontally with a circular rotating motion for a minimum of 1 minute
78Speedy MC
2018
40
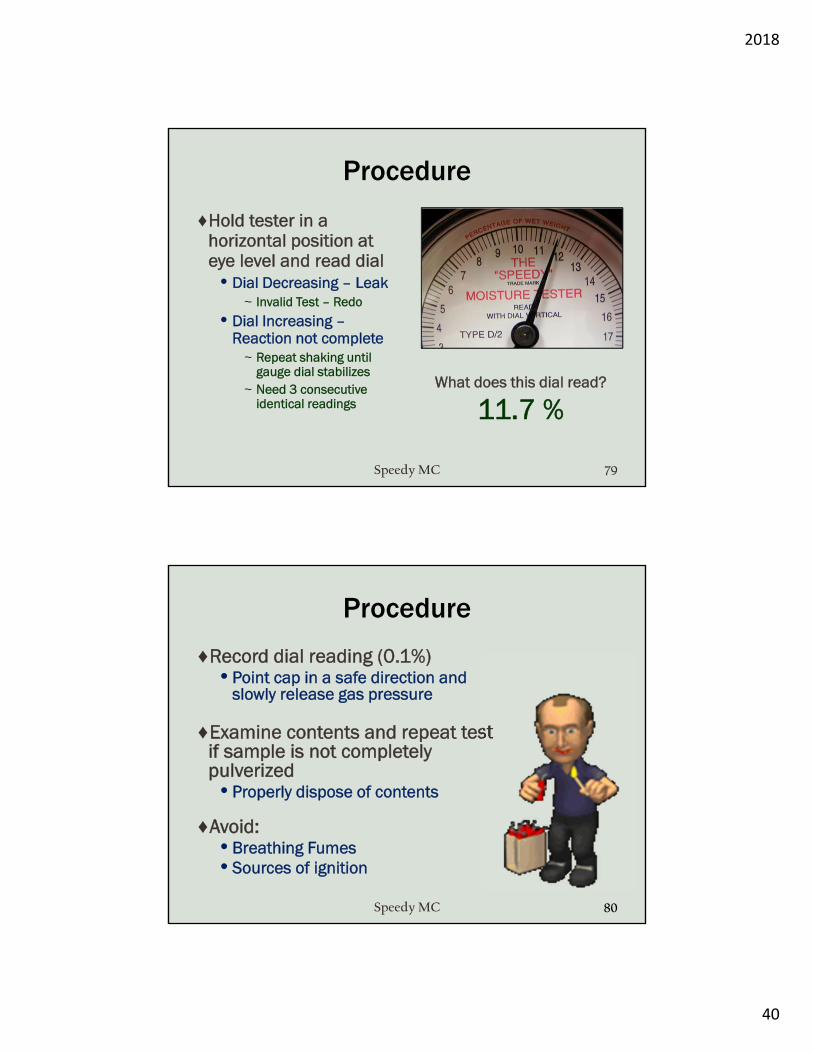
Procedure
♦Hold tester in a horizontal position at eye level and read dial
• Dial Decreasing – Leak~ Invalid Test – Redo
• Dial Increasing –Reaction not complete
~ Repeat shaking until gauge dial stabilizes
~ Need 3 consecutive identical readings
What does this dial read?
11.7 %
What does this dial read?
11.7 %
79Speedy MC
Procedure
♦Record dial reading (0.1%)• Point cap in a safe direction and
slowly release gas pressure
♦Examine contents and repeat test if sample is not completely pulverized• Properly dispose of contents
♦Avoid:• Breathing Fumes• Sources of ignition
80Speedy MC

2018
41
Procedure
♦Record moisture content
• Use ARDOT correction chart to convert from % of wet mass to % of dry mass
♦Report moisture content
• To nearest 0.1%
81Speedy MC
Procedure
♦Determine the moisture content of the soil
Sample Weight 20 gDial Reading 9.3
• If the standard sample weight was used, read the moisture content directly from the AHTD correction chart
82Speedy MC
MC = 10.1 %

2018
42
Special Cases
♦Very low moistures • Double the sample size
~ Use 40 g of soil instead of 20 g
• Divide dial reading by 2 before going to the conversion chart
♦Very high moistures• Cut the sample size in
half~ Use 10 g of soil instead
of 20 g
• Multiply dial reading by 2 before going to the conversion chart
83Speedy MC
• Read moisture content from conversion chart based on calculated value
MC = 29.8%
Special Cases
♦Determine the moisture content of the soil
Sample Weight 10 gDial Reading 11.5 %
• Sample weight cut in half
• Multiply dial reading by 2 before going to the chart
11.5 x 2 = 23.0
84Speedy MC

2018
43
• Read moisture content from conversion chart based on calculated value
MC = 4.1%
Special Cases
♦Determine the moisture content of the soil
Sample Weight 40 gDial Reading 7.6 %
• Sample weight doubled
• Divide dial reading by 2 before going to the chart
7.6 / 2 = 3.8
85Speedy MC
Calculation
♦Determine the moisture content of the soil
86Speedy MC
Sample Weight
Dial Reading
ChartMoisture Content
20 g 15.3 %
10 g 17.4 %
40 g 4.6 %

2018
44
Moisture Density
Relations of Soils
AASHTO T 99
AASHTO T 180
87Proctor
Compaction ♦Compaction• Densification of a soil by
applying a load to the soil ~ Reduces settlement~ Increases shear resistance~ Reduces permeability
♦Moisture affects compaction• Compaction at the optimum
water content results in the greatest density for a specified compactive effort
88Proctor

2018
45
Compaction
89Proctor
Optimum MC• Soil particles
pack closely• Interlocking soil
structure• Compacts
moderately easy• Stable soil
structure
Below Opt. MC• Soil particles
pack loosely• Weak, permeable
soil structure• Compaction is
more difficult• Stable soil
structure is questionable
Above Opt. MC• Soil particles
pack in layers (shear planes)
• Non-interlocking soil structure
• Compacts easily• Non-stable soil
structure typical
Proctor Curves
♦The relationship between moisture and density establishes the proctor curve of a soil
♦Proctor curves serve as the basis for field compaction
• Maximum Dry Density~ Used in the field to
determine the % compaction of the soil
• Optimum Moisture~ Used in the field as a
target to help achieve the desired degree of compaction and prevent instability of the soil structure
90Proctor

2018
46
Apparatus
♦Sieves• 2”, ¾”, # 4
♦Scales• 1 g or 0.005 lb or
better
♦Oven (230 ± 9 °F)
♦Mold Assembly• 4” or 6” I.D.• Solid or split side
♦Straight Edge
♦Moisture Tins
♦Rammer• 5.5 lb – 12” drop• 10.0 lb – 18” drop
91Proctor
AASHTO Proctor Specifications
♦T 99 (Standard)• 5.5 lb Rammer • 12” Drop
♦T 180 (Modified)• 10 lb Rammer• 18” Drop
92Proctor
2018
47
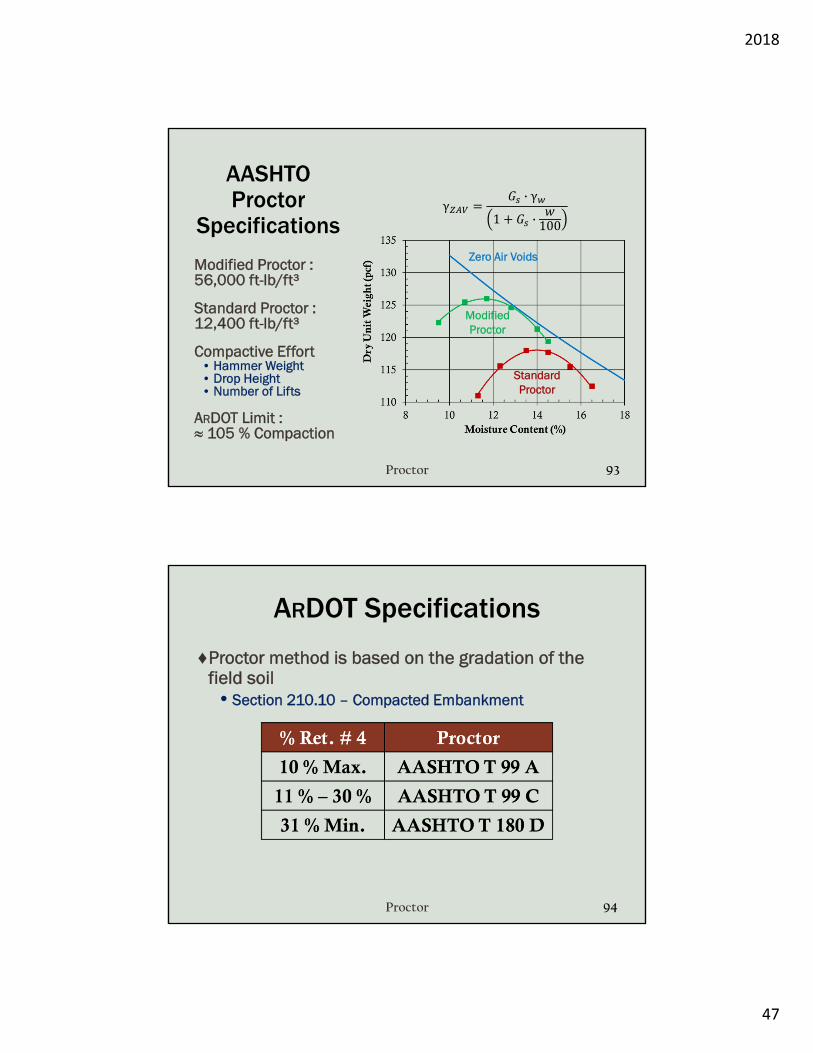
AASHTO Proctor
Specifications
Modified Proctor :56,000 ft-lb/ft³
Standard Proctor :12,400 ft-lb/ft³
Compactive Effort• Hammer Weight• Drop Height• Number of Lifts
ARDOT Limit :≈ 105 % Compaction
93Proctor
Zero Air Voids
Modified Proctor
Standard Proctor
γ · γ1 · 100
ARDOT Specifications
♦Proctor method is based on the gradation of the field soil
• Section 210.10 – Compacted Embankment
94Proctor

2018
48
Procedure
♦Soil Preparation• Determine the gradation of the field soil
~ 2”, ¾”, # 4 sieves
• Select the appropriate procedure and method based on the gradation of the soil or other specifications
• Air dry field sample and process sample over the appropriate sieve (# 4 or ¾”)
• Continue air drying processed sample until the desired starting moisture content is obtained
95Proctor
♦Select increment• Increment - consistent
change in moisture content between points
~ Usually 1 – 2 %~ Maximum of 2½ %
Procedure
♦Reduce processed sample and obtain a representative portion(s)
• Rocky soils or heavy clays require individual portions
~ 4” Mold ≈ 2500 g~ 6” Mold ≈ 6000 g
• Other soil types allow reuse of soil
96Proctor
10%2500 g
12%2500 g
14%2500 g
16%2500 g
2% 2% 2%

2018
49
Procedure
♦Determine the amount of water to be added to each point
♦Mix water into soil to achieve a uniform moisture content
97Proctor
Procedure
♦Allow soil to “season”• Place in sealable
containers• Heavy clays must
“season” for a minimum of 12 hours prior to compaction
♦Tighten joint on split molds to maintain constant volume
♦Attach mold firmly to base
98Proctor

2018
50
Procedure
♦Record weight of empty mold assembly (mold and base)
♦Attach collar to mold
99Proctor
Procedure
♦Add soil for 1 lift into mold• Evenly distribute soil in mold
♦Gently tamp soil surface• Eliminates loose state
♦Solid Compaction Surface• 200 lb concrete block• Sound concrete floor
100Proctor
2018
51
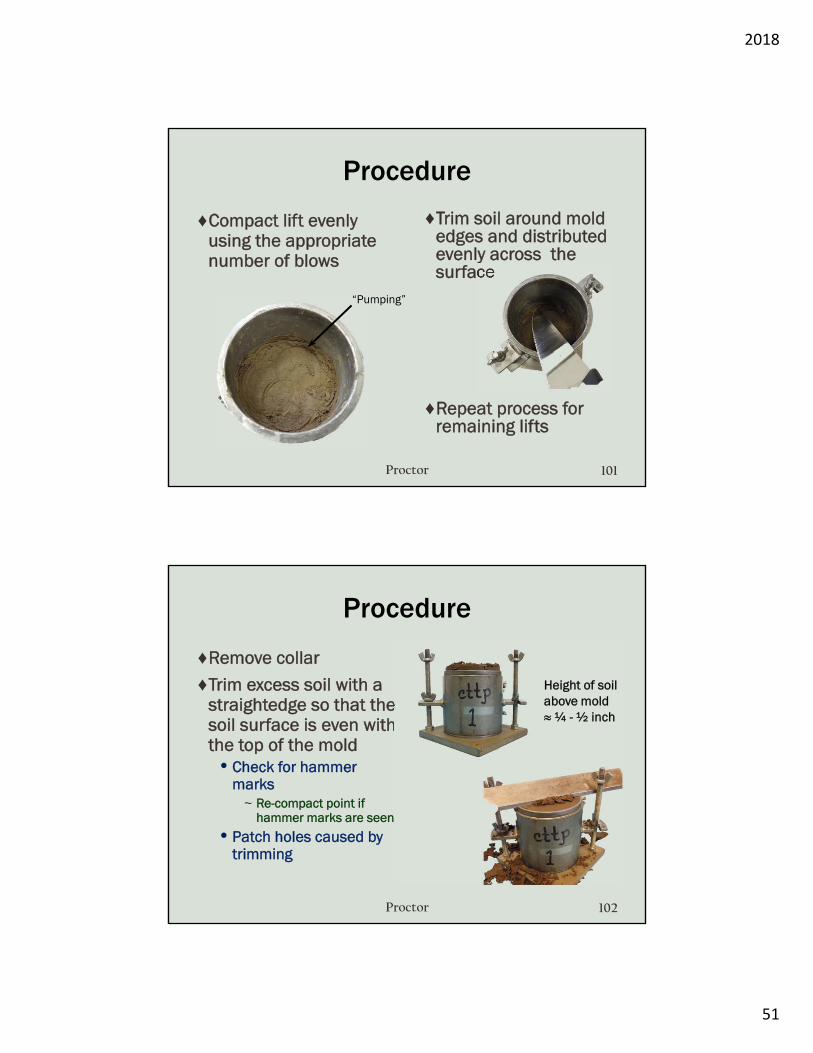
Procedure
♦Compact lift evenly using the appropriate number of blows
♦Trim soil around mold edges and distributed evenly across the surface
♦Repeat process for remaining lifts
101Proctor
“Pumping”
Procedure
♦Remove collar
♦Trim excess soil with a straightedge so that the soil surface is even with the top of the mold
• Check for hammer marks
~ Re-compact point if hammer marks are seen
• Patch holes caused by trimming
102Proctor
Height of soil above mold ≈ ¼ - ½ inch
2018
52
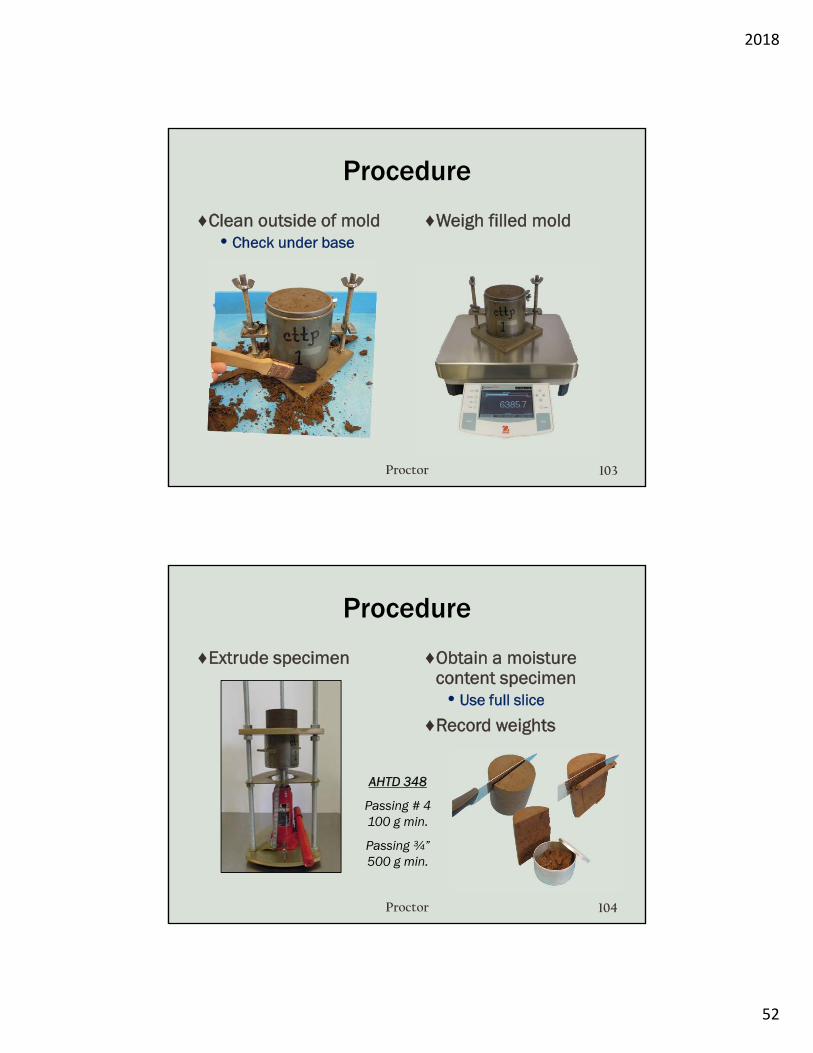
Procedure
♦Clean outside of mold• Check under base
♦Weigh filled mold
103Proctor
Procedure
♦Extrude specimen
104Proctor
♦Obtain a moisture content specimen
• Use full slice
♦Record weights
AHTD 348
Passing # 4100 g min.
Passing ¾”500 g min.

2018
53
Procedure
♦Repeat compaction process for all points
• Compact points until there is no increase in the wet mass of soil and then perform one more determination
• At least 2 points over optimum are required
~ Except for non-cohesive drainable soils
• Points will increase in mass and then decrease in mass
After which point could you stop compacting points?
Target Wet Mass
10 % 4300 g
12 % 4380 g
14 % 4400 g
16 % 4360 g
18 % 4310 g
Stop !
105Proctor
Proctor Curve
♦Plot Proctor Points• X - axis : % Moisture• Y - axis : Dry Density
♦Draw Proctor Curve• Decide ≈ peak location• Draw smooth parabola
♦Record Peak Values• Maximum Dry Density• Optimum Moisture Content
♦Report Density & MC• Max DD: nearest 0.1 lb/ft³• Opt. MC: nearest 0.1%
106Proctor
10 12 14 16
% Moisture
100
110
120
Dry
Den
sity
(lbs
/ft³
)

2018
54
Proctor Curve
105
106
107
108
109
110
111
112
113
114
115
0 2 4 6 8 10 12 14 16 18 20
Max
. Dry
Den
sity
(pcf
)
Moisture Content (%)
Proctor 107
Peak Location by Graphing
119
120
121
122
123
124
125
126
127
8 9 10 11 12 13 14 15 16 17 18
Dry
Den
sity
(pcf
)
Moisture Content (%)
1
3
2
108Proctor

2018
55
Peak Location by Graphing
119
120
121
122
123
124
125
126
127
8 9 10 11 12 13 14 15 16 17 18
Dry
Den
sity
(pcf
)
Moisture Content (%)
DD Max = 126.2 @ 13.5%
109Proctor
Practice Proctor Graphs
110Proctor
120.0
121.0
122.0
123.0
124.0
125.0
126.0
127.0
128.0
129.0
130.0
8 9 10 11 12 13 14 15 16120.0
121.0
122.0
123.0
124.0
125.0
126.0
127.0
128.0
129.0
130.0
8 9 10 11 12 13 14 15 16

2018
56
Practice Proctor Graphs
111Proctor
120.0
121.0
122.0
123.0
124.0
125.0
126.0
127.0
128.0
129.0
130.0
8 9 10 11 12 13 14 15 16120.0
121.0
122.0
123.0
124.0
125.0
126.0
127.0
128.0
129.0
130.0
8 9 10 11 12 13 14 15 16
Practice Proctor Graphs
112Proctor
120.0
121.0
122.0
123.0
124.0
125.0
126.0
127.0
128.0
129.0
130.0
8 9 10 11 12 13 14 15 16
Add point close to optimum moisture
content !
120.0
121.0
122.0
123.0
124.0
125.0
126.0
127.0
128.0
129.0
130.0
8 9 10 11 12 13 14 15 16
?
Add points to finish proctor !

2018
57
Practice Proctor Graphs
113Proctor
120.0
121.0
122.0
123.0
124.0
125.0
126.0
127.0
128.0
129.0
130.0
8 9 10 11 12 13 14 15 16120.0
121.0
122.0
123.0
124.0
125.0
126.0
127.0
128.0
129.0
130.0
8 9 10 11 12 13 14 15 16
Fire the technician !
Use rules only with evenly spaced
moisture contents !
Peak Location by Graphing
114Proctor
115
120
125
130
135
140
8 9 10 11 12 13
Dry
Den
sity
(pcf
)
Moisture Content (%)
3
DD Max = 126.5 @ 10.8%
2
1Never use straight lines through data points to establish peak!
Peak values obtained by using straight lines are too high for maximum density.
Remember, you must have evenly spaced moisture contents for this method !

2018
58
Graphical Parabola Method
115Proctor
115
120
125
130
135
140
8 9 10 11 12 13
Dry
Den
sity
(pcf
)
Moisture Content (%)
A
B
DD Max = 126.0 @ 10.8%
E
D
CG
FK J
H
. . . %Optimum MC is halfway between point A & H
Graphical Parabola Method
116Proctor
115
120
125
130
135
140
8 9 10 11 12 13
Dry
Den
sity
(pcf
)
Moisture Content (%)
A
B
DD Max = 126.0 @ 10.8%
C

2018
59
Calibration of Measure
AASHTO T 19
Section 8
117Mold Volume
Procedure
♦Clean and dry mold and base plate
♦Place a thin layer of grease on upper and lower mold rims
♦Assemble mold and base plate
♦Weigh glass plate and mold assembly
118Mold Volume

2018
60
Procedure
♦Fill mold with water and cover with glass plate
• Eliminate bubbles and excess water
• Dry mold assembly and glass plate
♦Weigh mold, water and glass plate
119Mold Volume
Procedure
♦Measure temperature of water to nearest 1° F
♦Determine the density of the water at the measured temperature
• AASHTO Table 3~ Interpolate
♦Calculate the volume of the mold
120Mold Volume

2018
61
Procedure
♦Calculate volume of mold
♦Report volume of mold to the nearest 0.0001 ft³
121Mold Volume
Calculation
♦Determine the volume of the mold
Mold + Plate 2.426 lbMold + Water + Plate 4.500 lbTemperature 76 °F
122Mold Volume
Density of Water @ 76°
62.252 lb/ft³
. .. . . . .V = 0.0333 ft³

2018
62
Calculation
♦Determine the volume of the mold
Mold + Plate 15.248 lbMold + Water + Plate 19.928 lbTemperature 68 °F
123Mold Volume
Mold Volumes
♦4” Mold• 0.0333 ± 0.0005 ft³• 0.000943 ± 0.0000014 m³
♦6” Mold• 0.0750 ± 0.0009 ft³• 0.002124 ± 0.000025 m³
♦Use mold volume determined by AASHTO T 19 for density calculations
124Proctor
2018
63
Density Calculations
125Proctor
% %
%
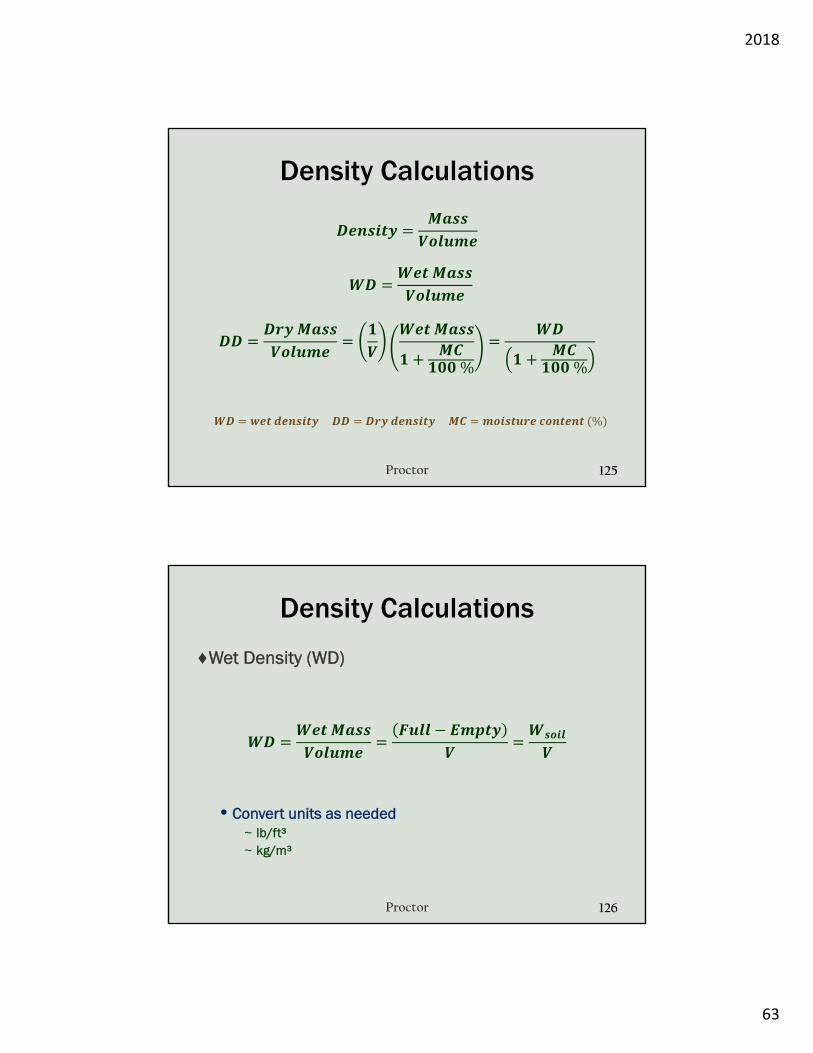
Density Calculations
♦Wet Density (WD)
• Convert units as needed~ lb/ft³~ kg/m³
126Proctor
2018
64
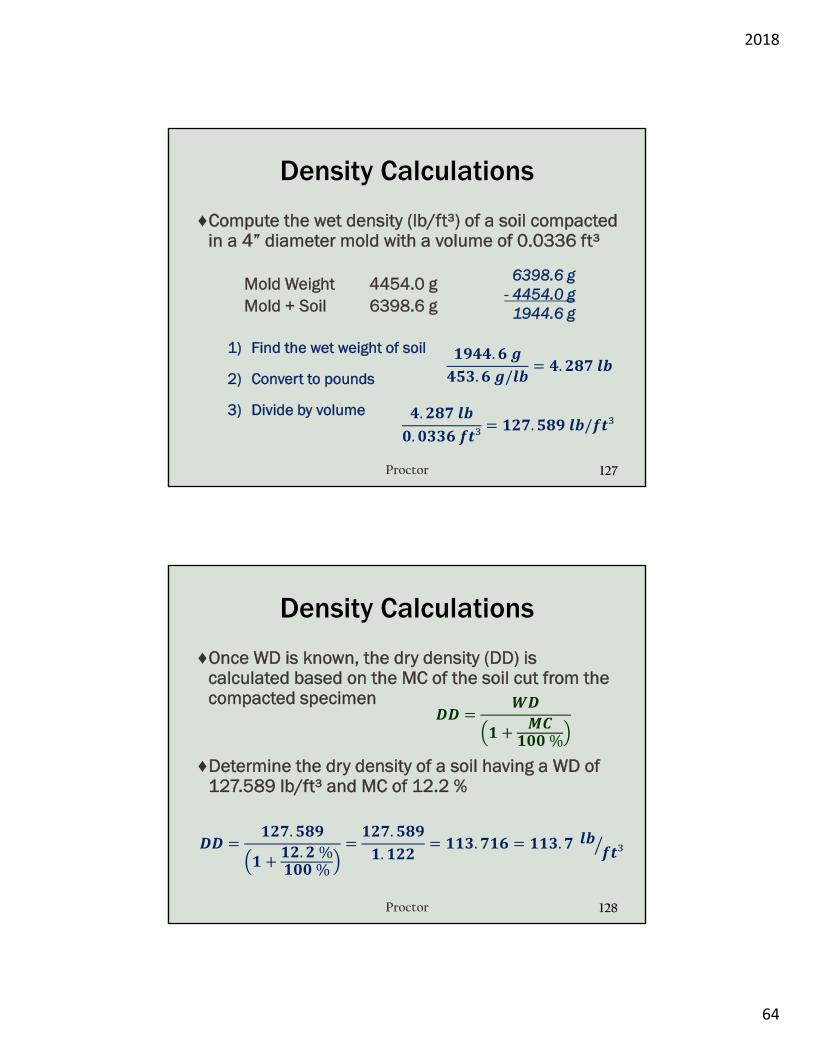
Density Calculations
♦Compute the wet density (lb/ft³) of a soil compacted in a 4” diameter mold with a volume of 0.0336 ft³
Mold Weight 4454.0 g Mold + Soil 6398.6 g
1) Find the wet weight of soil
2) Convert to pounds
3) Divide by volume
127Proctor
6398.6 g- 4454.0 g
1944.6 g
. . / . . . ³ . / ³
Density Calculations
♦Once WD is known, the dry density (DD) is calculated based on the MC of the soil cut from the compacted specimen
♦Determine the dry density of a soil having a WD of 127.589 lb/ft³ and MC of 12.2 %
128Proctor
% . . %% .. . . ³

2018
65
Sample Proctor
♦Sample Proctor Data Mold Volume 0.0334 ft³
129Proctor
EmptyMold Wt
(g)
Mold +Soil Wt
(g)
SoilWeight
(g)
SoilWeight
(lb)
WetDensity(lb/ft³)
MoistureContent
(%)
DryDensity(lb/ft³)
4475.0 6433.3
4475.0 6512.4
4475.0 6520.9
4475.0 6460.3 %
Sample Proctor
♦Sample Proctor Data
130Proctor
115
116
117
118
119
120
121
122
10 11 12 13 14Moisture Content (%)
Dry
Den
sity
(pcf
)
2018
66
Proctor Adjustments
♦An increase or decrease in the amount of rock in the field will change the maximum dry density and optimum moisture content of the soil
♦Adjustments are only made when the change would not require a different proctor method to be run
♦Field Indicators for Adjustments :• High density tests (continuously without reason)• Low density tests (continuously without reason)• Visual noticeable change in soil gradation
131Proctor
Proctor Adjustments
♦Adjusts the maximum dry density and optimum moisture content of a soil to account for the coarse particles (rock) found in field conditions
• ARDOT Material Replacement Method (ARDOT)~ Alters the way the proctor is run by substituting smaller rock
which is allowed in the mold, for larger rock not allowed in the mold by the AASHTO method
• AASHTO Correction of Maximum Dry Density and Optimum Moisture for Oversized Particles (AASHTO COP)
~ Mathematically corrects the established AASHTO proctor by using actual material properties and the percentages of soil and rock found in the field
132Proctor

2018
67
Proctor Adjustments
♦AASHTO Method A & B Proctors• AASHTO & ARDOT : If more than 5 % is retained on the
# 4 sieve, run the AASHTO proctor and apply the AASHTO correction for oversized particles on # 4 sieve
♦AASHTO Method C & D Proctors• AASHTO : If more than 5 % is retained on the ¾” sieve,
run the AASHTO proctor and apply the AASHTO correction for oversized particles on ¾” sieve
• AHTD : If material is retained on the ¾” sieve, use the ARDOT material replacement method when running the AASHTO proctor
133Proctor
Proctor Adjustments
♦What proctor should be performed for the soil with the following gradation?
134Proctor
♦What proctor should be performed for the soil with the following gradation?
Sieve % Passing
2” 100
3/4” 100
# 4 96
# 200 15
AASHTO T 99 A
Sieve % Passing
2” 100
3/4” 100
# 4 64
# 200 8.7
AASHTO T 180 D

2018
68
Proctor Adjustments
♦What proctor should be performed for the soil with the following gradation?
♦What proctor should be performed for the soil with the following gradation?
135Proctor
Sieve % Passing
2” 100
3/4” 100
# 4 93
# 200 13
AASHTO T 99 A with AASHTO COP
Sieve % Passing
2” 100
3/4” 92
# 4 77
# 200 10
AASHTO T 99 C with ARDOT
ARDOT Material Replacement
136Proctor
# 4
2”
3/4”
Sieve%
Passing
# 4
2”
3/4”
38 %
60 %
Ignore % Ret.on 2” Sieve
Material Replacement

2018
69
ARDOT Material Replacement
♦Batching 5500 g / Point
• 98 % of material passes 2” sieve
• 38 % of (3/4” - # 4) Rock is needed for each point
• 60 % of (minus # 4) Soil is needed for each point
137Proctor
...
2133 Rock+ 3367 Soil
5500 Point
AASHTO Correction for Oversized Particles
♦Run Proctor• AASHTO T 99 A
~ AASHTO COP
• Max. DD = 116.6 pcf• Opt. MC = 14.2 %
♦ Run Bulk Specific Gravity (Gsb) of Rock
• Gsb= 2.588
♦Calculate corrected proctor value and optimum moisture content
• Worksheet
138Proctor

2018
70
AASHTO Correction for Oversized Particles
139Proctor
% Coarse Material (0.1)
% Fine Material (0.1)
Moisture Content of Coarse Material
Moisture Content of Fine Material
Corrected Total Moisture Content
Dry Density of Fine Material
Bulk Specific Gravity of Coarse Mat.
Unit Weight of Coarse Material
Corrected Total Dry Density
(field)
100 - (PC)
(assume 2%)
(proctor)
(proctor)
(lab test)
Gsb x 62.4 = 2.588 x 62.4
Compacted Laboratory Dry Density Corrected to Field Dry Density
13.3%
119.0 pcf
7.4
92.6
2.0
14.2
116.6
2.588
161.491
(PC)
(PF)
(MCC)
(MCF)
(MCT)
(DF)
Gsb
(k)
(Dd)
In-Place Density and Moisture
Content of Soil by Nuclear Methods
AASHTO T 310
140Density Gauge

2018
71
Apparatus
♦Nuclear Densometer
141Density Gauge
Drill Rod
Extraction Tool
Scraper Plate
Reference Standard
Density Gauge
♦Direct Measurements• Wet Density• Moisture Content
♦Calculated Values• Dry Density
• % Compaction
142Density Gauge
1 100%% 100%
2018
72
Density Gauge
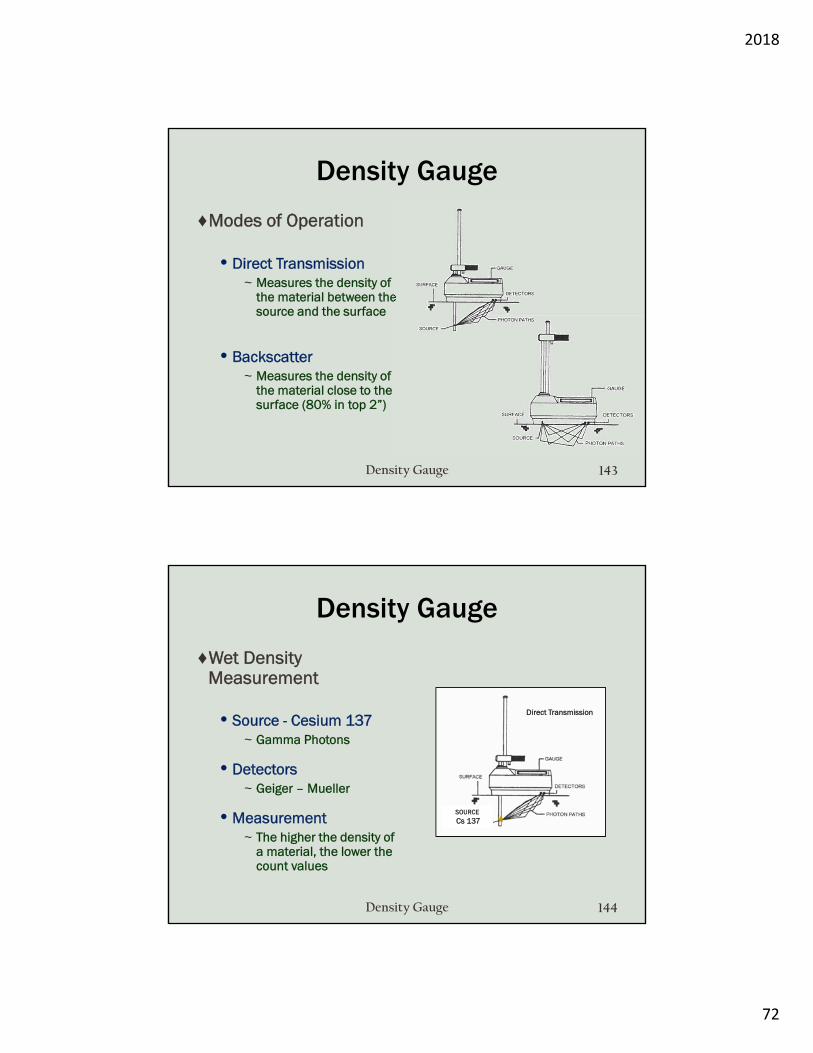
♦Modes of Operation
• Direct Transmission~ Measures the density of
the material between the source and the surface
• Backscatter~ Measures the density of
the material close to the surface (80% in top 2”)
143Density Gauge
Density Gauge
♦Wet Density Measurement
• Source - Cesium 137~ Gamma Photons
• Detectors~ Geiger – Mueller
• Measurement~ The higher the density of
a material, the lower the count values
144Density Gauge
SOURCECs 137
Direct Transmission

2018
73
Density Gauge
♦Moisture Measurement
• Source – Am 241: BE 9~ Neutrons
• Detectors~ Helium – 3
• Measurement~ Neutrons are slowed by
collisions with hydrogen~ Measurement depth is a
function of the moisture content (unknown)
145Density Gauge
Calibration
♦Radioactive Sources• Aging changes the
relationship between count rates and gauge outputs
♦Calibration• Initially• 24 months
~ Or yearly verification
♦Source Rod Positions
146Density Gauge
SOURCE ROD INDEX ROD
BACKSCATTER POSITION
SAFE POSITION
INDEX TRIGGER
DIRECT TRANSMISSION POSITIONS
2 in.
12 in.

2018
74
Troxler 3430
♦Keypad
147Density Gauge
ON YES
OFF NO
START ENTER
DEPTHTIME
SPECIALSTDMAPR
(READY) 1 minDepth : 4 inches
Standard Count
♦Adjusts for source decay and background radiation• Used daily to determine the proper functioning of gauge
♦Site Selection• Concrete or Asphalt• ≥ 10’ from large objects• ≥ 30’ from any other radioactive sources
♦Run Standard Count• Place gauge on Standard Block• Rod in “Safe” position• Press <Standard>
148Density Gauge
Metal Butt Plate
Standard Block
Safe Position

2018
75
Standard Count
♦Determine Compliance• Use procedure
recommended by the gauge manufacturer
• If none given by manufacturer, use
~ Ns = new standard count
~ No = average of last 4 standard counts
~ F = pre-scale factor
♦Troxler, Humbolt, InstroTek, & CPN Gauges require :
• ± 1 % Density• ± 2 % Moisture
• From the average of the last 4 standard counts taken
149Density Gauge
1.96 /
Standard Count ComplianceRatio Method
♦Average last 4 counts
♦Take new standardNew Counts 2234 638
♦Determine Ratios• Density (± 1 %)
Ratio Range = 0.99 – 1.01~ 2234 / 2258 = 0.9893~ 2258 / 2234 = 1.0107
• Moisture (± 2 %)Ratio Range = 0.98 – 1.02 ~ 638 / 646 = 0.9876~ 646 / 638 = 1.0125
♦Determine Pass/Fail• Fails – Both must pass
150Density Gauge
Date DS MS
May 5th 2251 650
May 6th 2260 642
May 7th 2258 645
May 8th 2262 648
Average 2258 646
F
P

2018
76
Standard Count ComplianceRange Method
♦Average last 4 counts
♦Take new standardNew Counts 2234 638
♦Determine Ranges• Density (± 1 %)
2258 x 0.01 = ± 22~ 2258 - 2234 = 24
• Moisture (± 2 %)646 x 0.02 = ± 12 ~ 646 - 638 = 8
♦Determine Pass/Fail• Fails – Both must pass
151Density Gauge
Date DS MS
May 5th 2251 650
May 6th 2260 642
May 7th 2258 645
May 8th 2262 648
Average 2258 646
F
P
Standard Count Compliance
♦Average last 4 counts
♦New Standard2246 575
♦Determine if the new density and moisture standard counts pass or fail
152Density Gauge
Date DS MS
May 10th 2275 588
May 12th 2260 551
May 13th 2265 565
May 15th 2262 556

2018
77
Standard Count Compliance
♦Failing Standard Counts1. Re-run standard count
~ Check set-up
2. Establish a new average~ Run 4 new standard counts
• Gauge Drift Best Practice• Max. Deviation DS = 25• Max Deviation MS = 12
~ Run new standard count and compare to new average
• Pass – Proceed to testing Fail – Repair gauge
153Density Gauge
Standard Count Compliance
♦Passing Standard Counts• Proceed to testing
154Density Gauge

2018
78
Procedure
♦Prepare Surface• Remove any dry or
loose materials• Smooth and level soil
surface• Fill any voids with
native fines or sand~ No more than 10% of
footprint should be filled
~ Filler pad thickness should not exceed 1/8” in depth
155Density Gauge
Procedure
♦Determine Test Depth• Equal to lift thickness
~ Test Depth is to be entered into gauge
~ Test Depth is the depth the rod should be extended to
• Test depth should never exceed lift thickness
156Density Gauge
8 in.10 in.
Test Depth = 8 inches
2018
79
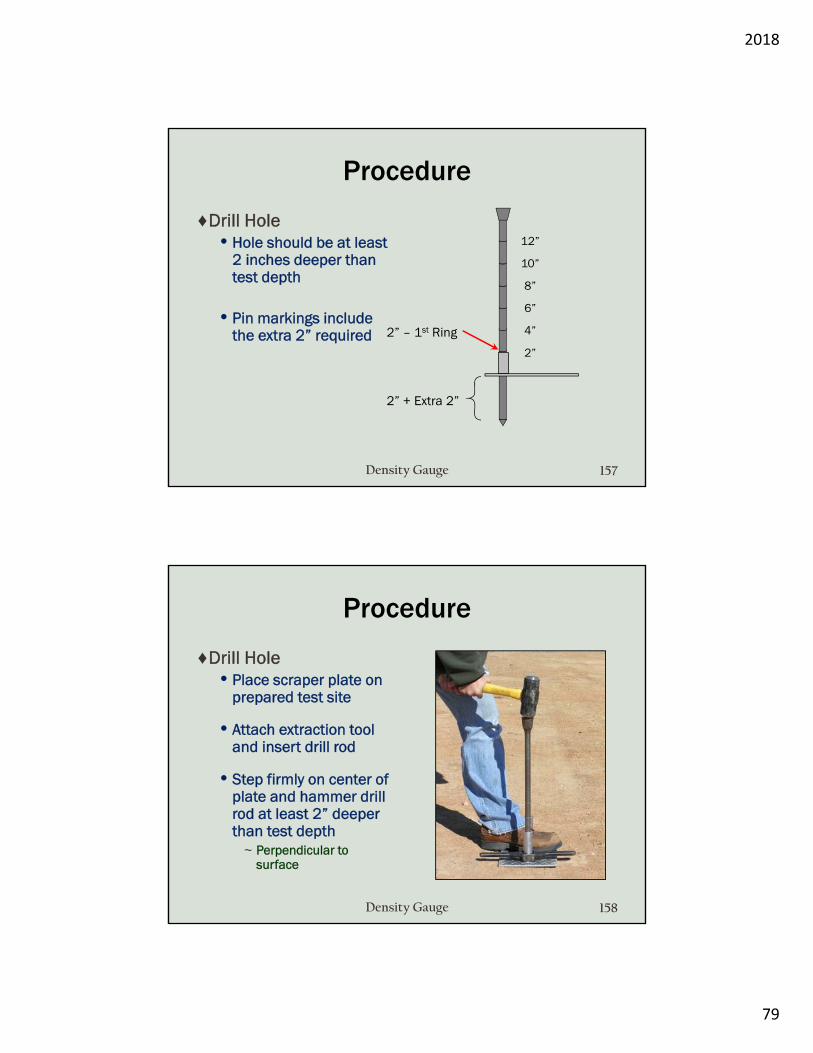
Procedure
♦Drill Hole• Hole should be at least
2 inches deeper than test depth
• Pin markings include the extra 2” required
157Density Gauge
2” + Extra 2”
2” – 1st Ring
12”
10”
8”
6”
4”
2”
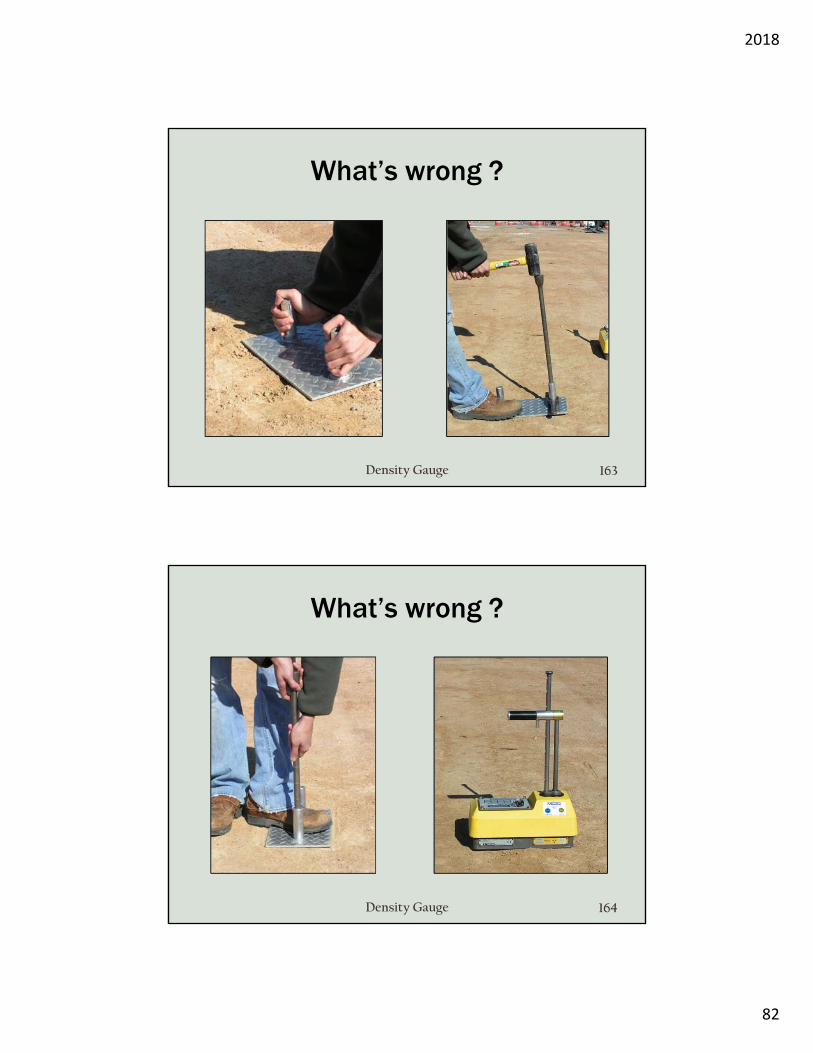
Procedure
♦Drill Hole• Place scraper plate on
prepared test site
• Attach extraction tool and insert drill rod
• Step firmly on center of plate and hammer drill rod at least 2” deeper than test depth
~ Perpendicular to surface
158Density Gauge

2018
80
Procedure
♦Remove drill rod with an upward, twisting motion
159Density Gauge
♦Mark plate footprint and hole location
♦Remove tools from area
• ≈ 3 ft away
Procedure
♦Check gauge parameters
• Depth (lift thickness)• Time (1 minute)• Max. Density (proctor)
♦Place gauge in footprint• Align rod with hole marks
♦Lower rod to test depth
♦Snug gauge back against hole
• Check contact with soil
160Density Gauge

2018
81
Procedure
♦Snug gauge backagainst hole
• Check contact with soil
161Density Gauge
♦Start Test
♦Move away from gauge• ≈ 3 feet
Push →
Procedure
♦Safe Rod
♦Record Data• Wet Density• Dry Density• % Compaction• % Moisture• Location
162Density Gauge
♦Error Sources!
• Source rod not “clicked into position”
• Depth set incorrectly• Gaps under gauge
after rod insertion• External causes
~ Ground Vibration~ Drainage structures~ Power lines
2018
82
What’s wrong ?
163Density Gauge
What’s wrong ?
164Density Gauge
2018
83
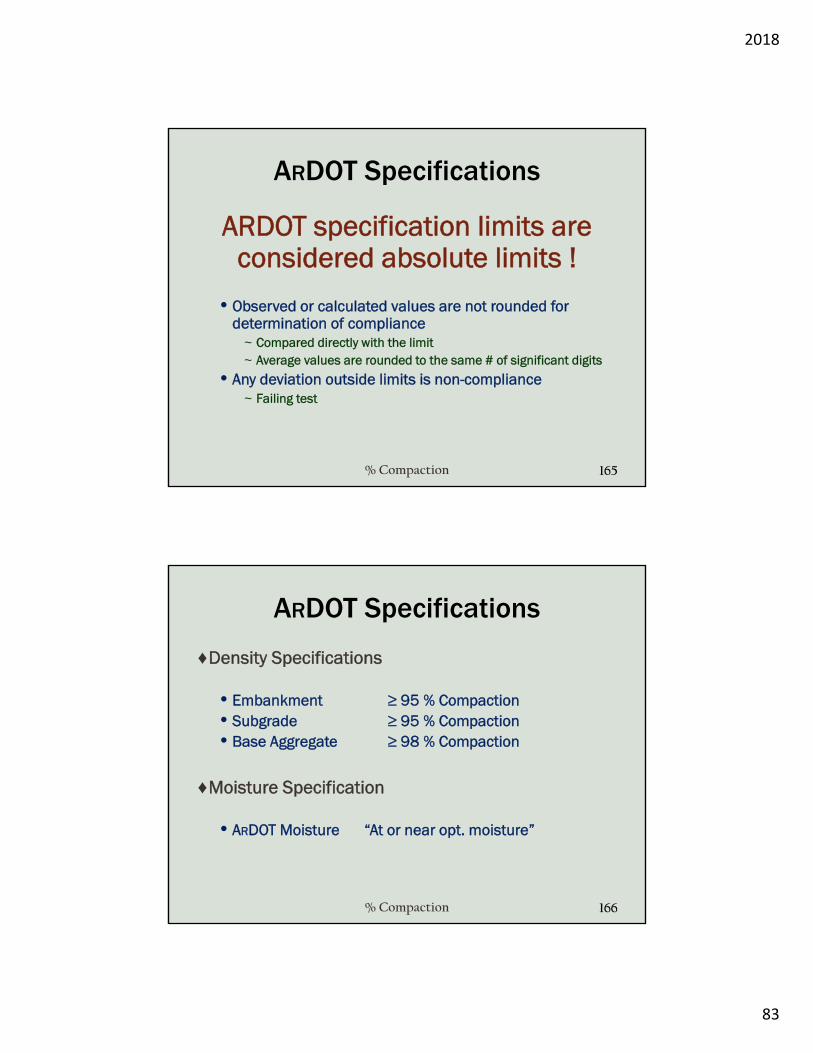
ARDOT Specifications
ARDOT specification limits are considered absolute limits !
• Observed or calculated values are not rounded for determination of compliance
~ Compared directly with the limit~ Average values are rounded to the same # of significant digits
• Any deviation outside limits is non-compliance~ Failing test
165% Compaction
ARDOT Specifications
♦Density Specifications
• Embankment ≥ 95 % Compaction• Subgrade ≥ 95 % Compaction• Base Aggregate ≥ 98 % Compaction
♦Moisture Specification
• ARDOT Moisture “At or near opt. moisture”
166% Compaction

2018
84
% Compaction
♦Correct proctor value was active in the gauge at the time of testing and true moisture content returned by the gauge% %
♦Proctor value was not available at the time of testing% % %
167% Compaction
Calculation
♦Determine the % compaction
Gauge DD 113.0 lb/ft³ @ 12.4 %Proctor 115.9 lb/ft³ @ 14.0 %
168% Compaction
% %% .. % . % . %
% PR = 97.5 %

2018
85
Calculation
♦Determine the % compaction
Gauge DD 135.6 lb/ft³ @ 6.3 %Proctor 138.0 lb/ft³ @ 6.5 %
169% Compaction
Calculation
♦Determine the % compaction and if the site meets the required specifications
170Density Gauge
Test DD MC
Gauge (8 % Coarse) 114.0 pcf 12.5 %
Proctor (0% Coarse) 116.0 pcf 14.0 %
Proctor (8% Coarse) 119.3 pcf 13.0 %
Specifications ≥ 98 % ± 1 %% .. % . % . %Fails Density – Passes Moisture

2018
86
Moisture Offset
♦Corrects the gauge’s inaccurate moisture content readings due to substances found in the soil
• Cement, Gypsum, Coal, Lime (- correction)
~ High Hydrogen Forms
• Boron, Cadmium, Chlorine (+ correction)
~ Neutron Absorbing
♦Take gauge MC readings at 5 different locations
♦Collect moisture samples from center of footprint at each location
• Run oven dry moisture contents
♦Compute moisture offset according to the gauge manufacturer’s recommendations
171Density Gauge
Trench Offset
♦Corrects moisture and shallow density readings
♦Use anytime gauge is within 2 feet of a vertical soil structure
♦Take a normal standard count outside trench
♦Put gauge on standard block inside trench
• Take a four minute reading with the rod in the “safe” position
♦Record trench counts
172Density Gauge
2 ft
Offset = Trench - Standard

2018
87
ARDOT Specifications
♦Base Aggregate
• Test Quantities~ Contractor - 1000 tons~ AHTD - 4000 tons
• Tests for QC~ Gradation~ Density & Moisture~ Plasticity Index~ Thickness if Specified
• Sounding
♦Compacted Embankment
• Test Quantity~ 3000 yd³ / 1 per lift
min.
• Tests for QC~ Density & Moisture
♦Granular Borrow• Additional Tests for QC
~ Gradation~ Plasticity Index
173ARDOT Specifications