central bank of cyprus 1. effective exchange rate indices of the cyprus pound .....10 2. liquidity...
TRANSCRIPT
CENTRAL BANK OF CYPRUS
ECONOMIC RESEARCH AND STATISTICS DIVISION
ECONOMIC RESEARCH DEPARTMENT
MONETARY POLICY REPORT
OCTOBER 2007


CENTRAL BANK OF CYPRUS
ECONOMIC RESEARCH AND STATISTICS DIVISION
ECONOMIC RESEARCH DEPARTMENT
MONETARY POLICY REPORT
OCTOBER 2007

The Monetary Policy Report (MPR) is drafted by the Central Bank’s Economic Research Department in preparation for the meetings of the Monetary Policy Committee (MPC), and summarises current economic developments in Cyprus. The MPR appears about eight times a year. Of these eight issues, four are more extensive and comprehensive than the others. The Greek version of the MPR as well as the English version of the statistical tables are available on the Bank’s website on the same day as the MPC meeting. The entire English version of the MPR is posted on the Bank’s website during the following month. The English edition of the more extensive version is also available in printed form.
© CENTRAL BANK OF CYPRUS, 2007 ECONOMIC RESEARCH AND STATISTICS DIVISION Address: 80 Kennedy Avenue 1076 Nicosia Cyprus Postal Address: P.O. Box 25529 1395 Nicosia Cyprus Website: http://www.centralbank.gov.cy E-mail: [email protected] Telephone: +357-22714465 Fax: +357-22378155 All rights reserved. Reproduction for educational and non-commercial purposes is permitted provided that the source is acknowledged. Available, in PDF format at www.centralbank.gov.cy/nqcontent.cfm?a_id=661
ISSN 1450 – 2658


CONTENTS
1. INTRODUCTION ...................................................................................................1
2. ECONOMIC DEVELOPMENTS .............................................................................2 2.1 INTERNATIONAL DEVELOPMENTS AND EXCHANGE RATES ......................2 2.2 MONETARY DEVELOPMENTS ........................................................................13 2.3 INFLATION..........................................................................................................24 2.4 PRODUCTION, DEMAND AND THE LABOUR MARKET .................................26 2.5 PUBLIC FINANCES ..........................................................................................31 2.6 EXTERNAL TRANSACTIONS ...........................................................................32 2.7 PROSPECTS FOR 2007 ...................................................................................33
Boxes 1. Effective exchange rate indices of the Cyprus pound ..........................10
2. Liquidity conditions and monetary policy operations ............................21
3. ANNEX .................................................................................................................37
Symbols, conventions and abbreviations
1. The following symbols are used:
- no figures to be expected CYP and £ Cyprus pound n.y.a. not yet available € euro
0 nil or negligible $ US dollar Q quarter ST£ pound sterling
p provisional ¥ Japanese yen
2. Thousands, millions and billions are separated by a dot (.) and decimals are separated by a comma (,). In some cases the totals in the tables may not add up due to rounding. 3. CBC Central Bank of Cyprus CCIs Co-operative Credit Institutions CPI Consumer Price Index CSE Cyprus Stock Exchange
Cystat Statistical Service of the Republic of Cyprus ECB European Central Bank
Eurostat Statistical Office of the European Communities
Monetary Policy Report October 2007
1
1. INTRODUCTION
International developments
The uncertainty in the international money
markets, triggered by the crisis in the US
subprime loans market, persists albeit in a
milder form. In September the ECB, the Bank of
England and the Federal Reserve injected more
liquidity in the interbank loans market with the
aim of reducing pressures in the money market.
At the same time, the international economy is
still affected by the increases in food and oil
prices, which have led to a rise in inflationary
pressures.
During their recent meetings on 6 September
2007, the ECB and the Bank of England both
decided to maintain their official interest rates
unchanged at 4% and 5,75%, respectively. In
contrast, on 18 September 2007 the Federal
Reserve announced a decrease in its official
interest rate from 5,25% to 4,75%. This decision
was made for precautionary reasons, following
the crisis in the subprime loans market and the
on-going liquidity problems.
Domestic developments
The growth rates in the money supply as well as
credit to the private sector remain at high levels.
As a result, the Monetary Policy Committee of
the Central Bank of Cyprus (CBC) maintained its
official interest rate unchanged at 4,5% during
its last meeting on 10 September 2007. The
interest rate on the marginal lending facility and
the interest rate on the overnight deposit facility
remain unchanged at 5% and 3%, respectively.
M2 growth was strong in August mainly due to
the persistent increase in credit to the private
sector. Borrowing in foreign currency, despite
being at lower levels compared with the previous
year, continues to hold a significant share
(28,7%) of total credit granted in the 12 months
to August 2007.
Inflation rose to 2,47% in August 2007, which
was above the previous month’s rate of 2,43%.
This reflects mainly the increase in the price of
agricultural products and the small increase in
the price of electricity, a development which was
only partially offset by the fall in petroleum
product prices in August 2007 compared with
August 2006.
As far as external transactions are concerned,
the number of tourists visiting Cyprus in the first
eight months of 2007 was up by 0,1%,
compared with a decrease of 2,4% in the
corresponding period of 2006. As regards
revenue from tourism, an increase of 2,3% was
recorded in the period January-June 2007
compared with a 3,9% increase in the
corresponding period of 2006.
According to provisional Cystat figures, total
imports (cif) increased by 8,2% in the first seven
months of 2007, compared with an increase of
16,6% in the corresponding period of 2006.
Exports of goods fell by 2,9% in the first seven
months of 2007 compared with an increase of
4,8% in the corresponding period of 2006.
According to detailed data for the first half of
2006, the decrease in exports of goods was due
to the decrease of re-exports, while exports of
domestically produced goods increased by
15,7% year-on-year in the first half of 2007.
The turnover volume index of retail trade rose by
7,6% in the first seven months of 2007
compared with 5,7% in the same period of the
previous year. In July 2007 this index increased
by 10,4% compared with a rise of 5,6% in the

Central Bank of Cyprus
2
corresponding month of 2006. In the labour
market, unemployment as a percentage of the
economically active population reached 3,3% in
the first seven months of 2007, compared with
3,5% in the corresponding period of 2006. In
the secondary sector, the sale of cement rose by
11% in the first eight months of 2007 compared
with a 0,6% rise in the corresponding period of
2006. At the same time the volume of building
permits rose by 5,3% in the first six months of
the year compared with a rise of 5,6% in the
same period of 2006. Finally, the volume index
of manufacturing production rose by 3,2% in the
first seven months of 2007 compared with a fall
of 1,5% in the corresponding period of 2006.
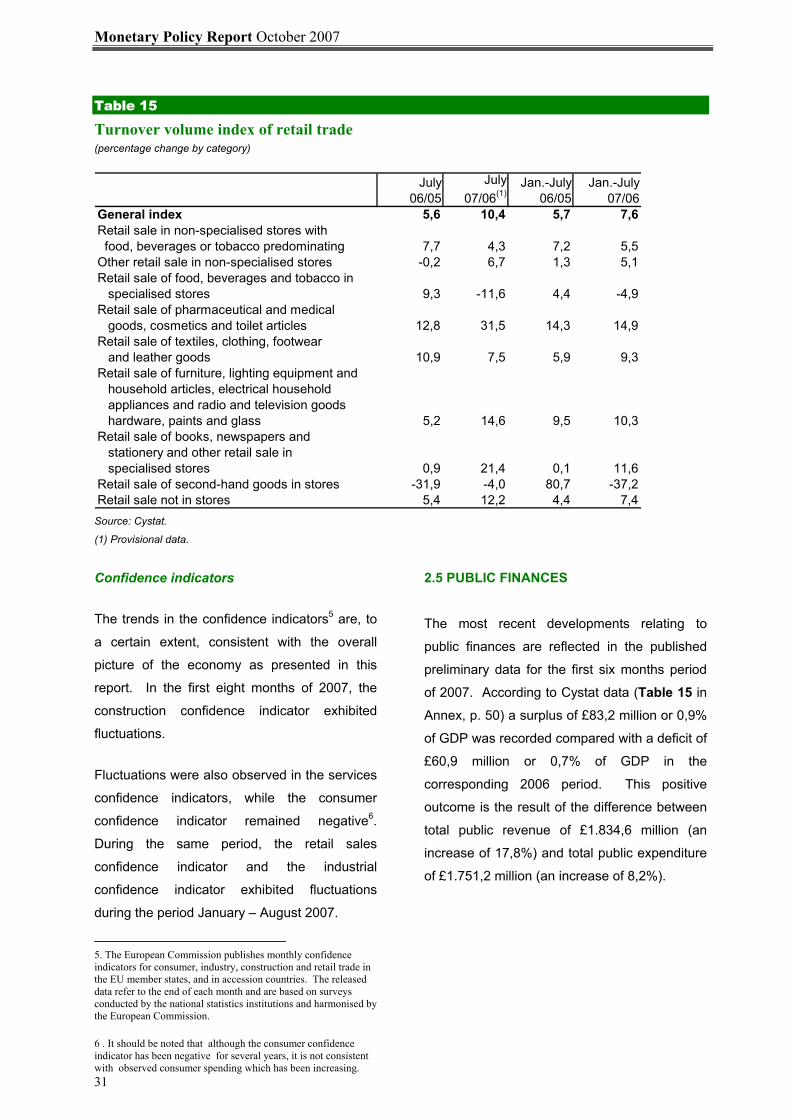
The most recent developments relating to public
finances are reflected in the preliminary data for
the first six months period of 2007, published by
the Ministry of Finance and Cystat and covering
semi-governmental organisations as well.
According to this data (see Table 15 in Annex,
p. 50) a surplus of £83,2 million or 0,9% of GDP
was recorded, compared with a deficit of £60,9
million or 0,7% of GDP in the corresponding
2006 period. This positive outcome is the result
of the difference between total public revenue of
£1.834,6 million (an increase of 17,8%) and total
public expenditure of £1.751,2 million (an
increase of 8,2%).
2. ECONOMIC DEVELOPMENTS 2.1 INTERNATIONAL DEVELOPMENTS AND EXCHANGE RATES
International developments The uncertainty in the international money
markets, triggered by the crisis in the US
subprime loans market, persists albeit in a
milder form. In September the ECB, the Bank of
England and the Federal Reserve injected more
liquidity in the interbank loans market with the
aim of reducing pressures in the money market.
At the same time, the international economy is
still affected by the increases in food and oil
prices, which have led to a rise in inflationary
pressures.
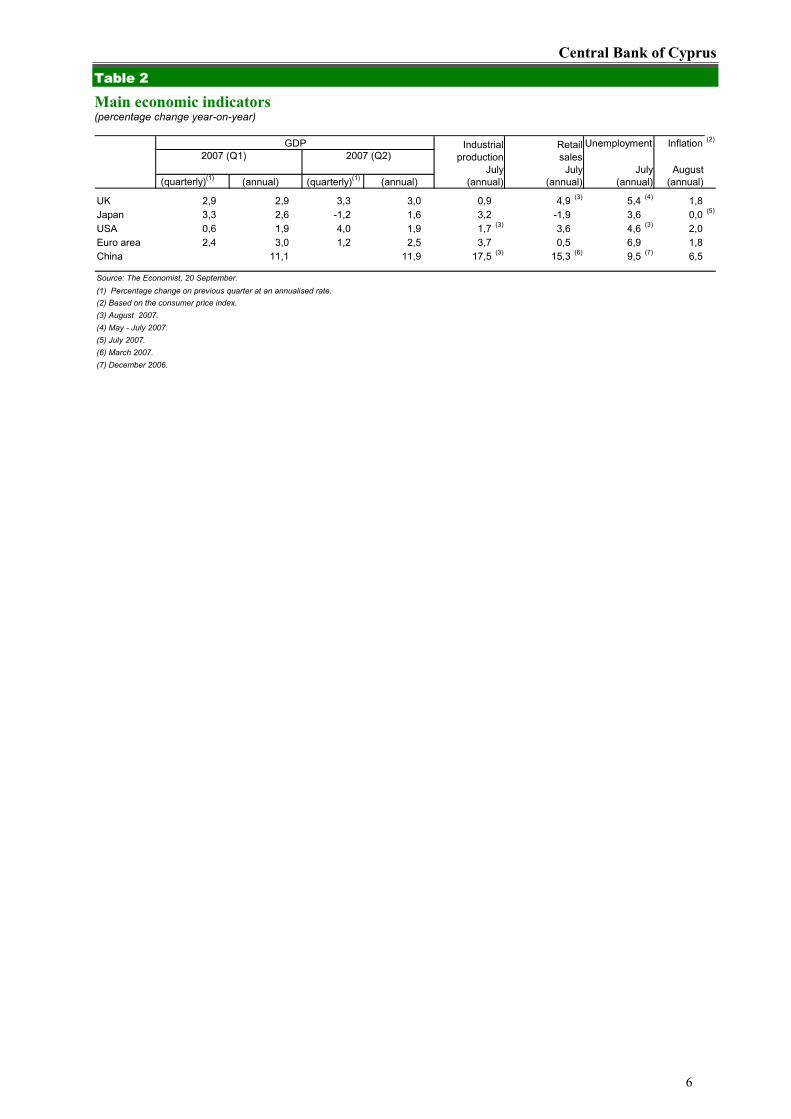
Euro area As can be seen from Tables 1 and 2 (pp. 5 and
6), despite the increased uncertainty emerging
from the turmoil in the money markets, the
predictions for economic growth in the euro zone
are around 2,5% for 2007 and 2,2% for 2008.
Unemployment is expected to be lower in 2007
compared with 2006, contributing to the increase
in economic growth and increasing expectations
for a further rise in European interest rates
during the current year. Inflation was 1,8% in
August compared with 2,3% in the same month
of the previous year. Analysts, however, predict
an increase in inflation above 2% until the next
meeting of the ECB due, mainly, to the
continued rise in oil and food prices, as well as
the rapid increase in the money supply. The
purchasing managers index declined to 54,3 in
August, the lowest point in the last 18 months.
The ECB, following its decision not to increase
interest rates on 6 September 2007, announced
repos of €75 billion on 12 September, which

Monetary Policy Report October 2007
3
aimed at relieving pressures in the money
market.
UK
The rate of economic growth is expected to
reach 2,9% in 2007, while in 2008 it is expected
to be around 2,4%. In August inflation reached
1,8%, down from 2,3% in the corresponding
month of 2006. As a result of the decrease in
inflationary pressures as well as the turmoil in
money markets, analysts do not expect the Bank
of England to increase its official interest rate
further until November. Moreover, following
higher domestic growth rates, unemployment
reached 5,4% in the period May-July 2007,
compared with 5,6% in the same period last
year. Data published on 5 September 2007
show that services increased unexpectedly in
August.
As a consequence of the turmoil in the money
markets, the financial sector in the United
Kingdom was also affected. The rumours for the
financing problems encountered by Northern
Rock and its subsequent support by the Bank of
England caused a lot of concern in the market.
At the same time, the data announced by
Rightmove have shown that house prices in
Britain decreased by 2,6% in August compared
with the previous month.
USA
Economic growth is expected to reach 2% in
2007. Inflation was 2% in August 2007, partly
as a result of the slowdown in consumer
expenditure, the decrease in house prices and
the tightness in the credit market. On 6
September 2007, the Federal Reserve injected
more liquidity in the interbank loans market, thus
decreasing the pressures in the money markets.
However, on 7 September unfavourable labour
market data were released. More specifically,
there was a decrease in new jobs in August
while the estimates for June and July were
revised downwards. As a result of the crisis in
the subprime loans market and the continuous
liquidity problems, the Fed decided to decrease
its official interest rate from 5,25% to 4,75% on
18 September.
Japan
Economic growth is expected to be around 2,9%
in 2007, while in 2008 it is estimated to
experience a marginal slowdown. Unemploy-
ment was 3,6% in July 2007 compared with
4,1% in the same month of the previous year.
There was no inflation in July 2007 compared
with inflation of 0,2% in the same month of 2006.
Inflation is expected to increase gradually, partly
as a result of the increase in land prices.
However, low inflation levels are expected to
prevail during the next few months. On 19
September 2007 the Bank of Japan maintained
its official interest rate at 0,5%, as anticipated by
the markets.
China
The rate of economic growth is increasing at a
rapid pace and is expected to be above 10% in
2007, while a mild slowdown is expected for
2008. Industrial production increased by 17,5%
in August compared with 15,7% in the same
month last year. Inflation increased by 6,5% in
August 2007 compared with 1,3% in August
2006, mainly due to the increases in food prices.
As a result, on 14 September 2007 the Central
Bank of China increased its official interest rates
for the fifth consecutive time since March, in an
effort to keep inflation at sustainable levels.
Finally, the country’s large trade surplus
Central Bank of Cyprus
4
increased by 81% during the period January –
July 2007.
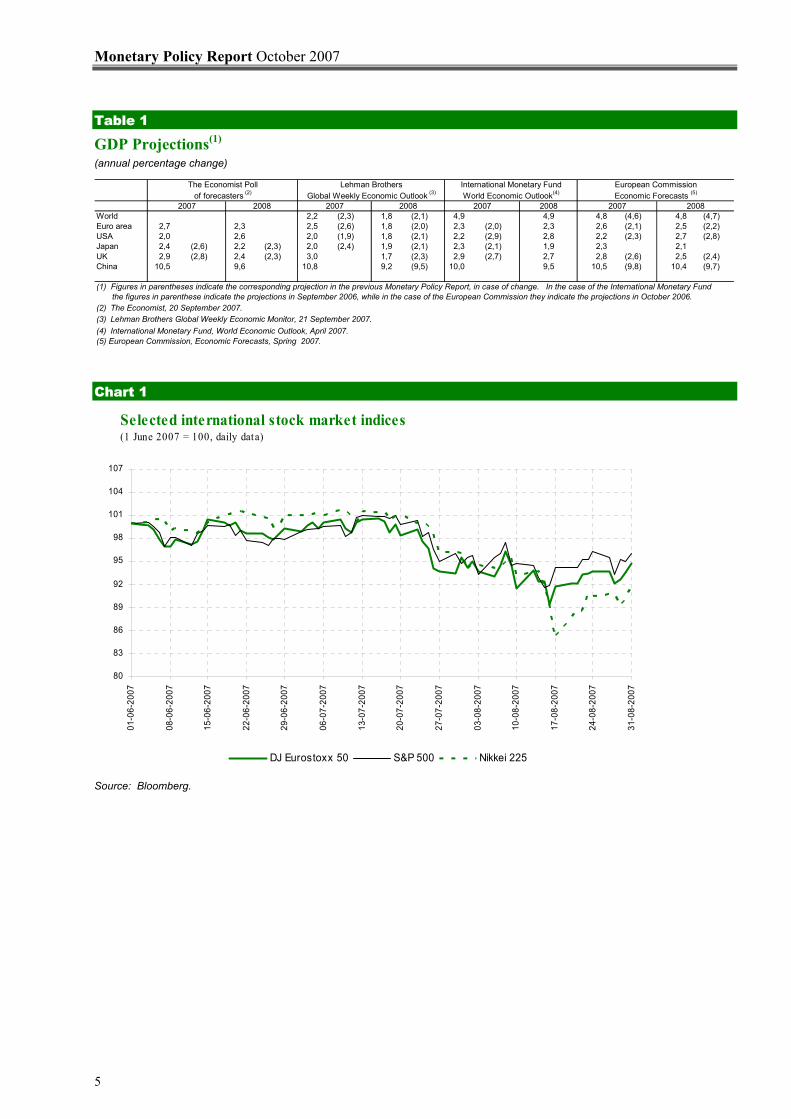
Stock market developments
Chart 1 (p. 5) presents the Eurostoxx 50, S&P
500 and Nikkei 225 share indices for the period
June - August 2007. After the decline
experienced in the first three weeks of August,
the three indices increased towards the end of
the month as a result of the interventions by the
ECB, the Federal Reserve and other central
banks. These liquidity injections outweighed, to
some extent, the big losses experienced in mid-
August. During the period June – August 2007,
the Eurostoxx 50, S&P 500, and the Nikkei 225
declined by 5,2%, 4,1% and 7,7%, respectively.
Oil
The average daily price of Brent crude
remained at the relatively high level of $71,87
per barrel in August, down from $77,66 per
barrel in July and $71,58 per barrel in June. Oil
prices increased to $80,17 per barrel on 24
September due to, among other things,
increased international demand and geopolitical
uncertainty. Moreover, the decision to increase
OPEC’s daily production by 500.000 barrels as
from 1 November 2007 did not stabilise oil
prices. Doubts about supplies continue to
contribute to high oil prices.
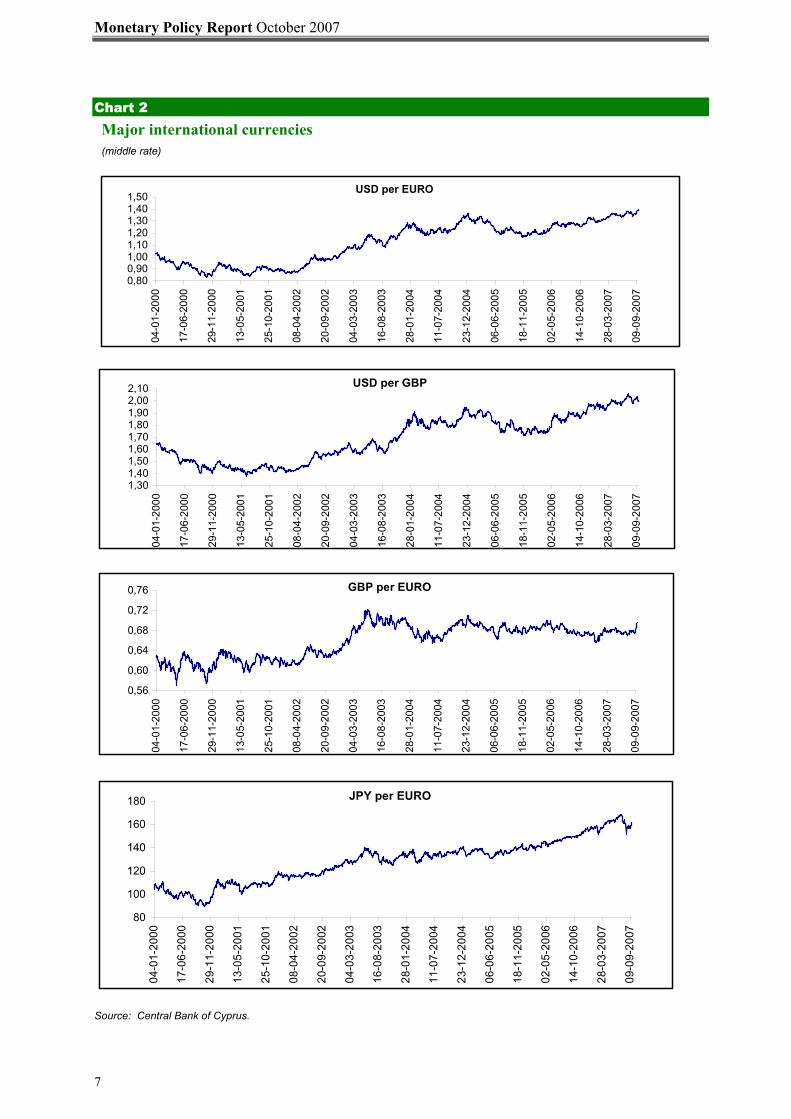
International currencies Euro
The euro strengthened against the other three
main currencies, i.e. the dollar, yen and sterling
during the period 20 August and 19 September
because of the market’s expectations for an
interest rate increase by the ECB, something not
expected for the other three currencies.
US dollar
The dollar was negatively affected by the 50
basis points reduction of the discount rate by the
Fed and by the reduction of the federal funds
rate by 50 basis points down to 4,75% on 18
September.
The US currency considerably weakened
relative to the euro, reaching $1,3953 on 19
September compared with $1,3495 on 20
August (Chart 2, p. 7). This was a new record
low.
Sterling
Sterling weakened relative to the euro during the
period under review, as the euro was recorded
at ST£0,6969 on 19 September compared with
ST£0,6780 on 20 August. Sterling was
undermined by the financial problems that the
British banking group Northern Rock was facing,
while the subsequent support by the Bank of
England caused concerns to the market.
Moreover, the fact that during the last meeting of
the Bank of England’s Monetary Policy
Committee no one voted for an increase in
rates, together with the decline of residential
prices in August, weakened the market’s
expectations for an increase in interest rates,
thus negatively affecting sterling.
Japanese yen
The yen weakened relative to the euro, reaching
¥161,65 per euro on 19 September compared
with ¥155,22 on 20 August. The Japanese
currency was undermined by the relative
reduction of uncertainty in the markets, which
increased the carry trade, and also by the
resignation of the country’s prime minister.
Monetary Policy Report October 2007
5
Table 1 GDP Projections(1) (annual percentage change)
2008World 2,2 (2,3) 1,8 (2,1) 4,9 4,9 4,8 (4,6) 4,8 (4,7)Euro area 2,7 2,3 2,5 (2,6) 1,8 (2,0) 2,3 (2,0) 2,3 2,6 (2,1) 2,5 (2,2)USA 2,0 2,6 2,0 (1,9) 1,8 (2,1) 2,2 (2,9) 2,8 2,2 (2,3) 2,7 (2,8)Japan 2,4 (2,6) 2,2 (2,3) 2,0 (2,4) 1,9 (2,1) 2,3 (2,1) 1,9 2,3 2,1UK 2,9 (2,8) 2,4 (2,3) 3,0 1,7 (2,3) 2,9 (2,7) 2,7 2,8 (2,6) 2,5 (2,4)China 10,5 9,6 10,8 9,2 (9,5) 10,0 9,5 10,5 (9,8) 10,4 (9,7)
(1) Figures in parentheses indicate the corresponding projection in the previous Monetary Policy Report, in case of change. In the case of the International Monetary Fund the figures in parenthese indicate the projections in September 2006, while in the case of the European Commission they indicate the projections in October 2006.(2) The Economist, 20 September 2007.(3) Lehman Brothers Global Weekly Economic Monitor, 21 September 2007.(4) International Monetary Fund, World Economic Outlook, April 2007.(5) European Commission, Economic Forecasts, Spring 2007.
European CommissionEconomic Forecasts (5)
2007 2008
Lehman Brothers
2007Global Weekly Economic Outlook (3)
2007 2008
International Monetary FundWorld Economic Outlook(4)
The Economist Pollof forecasters (2)
2007 2008
Chart 1
Selected international stock market indices (1 June 2007 = 100, daily data)
80
83
86
89
92
95
98
101
104
107
01-0
6-20
07
08-0
6-20
07
15-0
6-20
07
22-0
6-20
07
29-0
6-20
07
06-0
7-20
07
13-0
7-20
07
20-0
7-20
07
27-0
7-20
07
03-0
8-20
07
10-0
8-20
07
17-0
8-20
07
24-0
8-20
07
31-0
8-20
07
DJ Eurostoxx 50 S&P 500 Nikkei 225
Source: Bloomberg.
Central Bank of Cyprus
6
Table 2
Main economic indicators (percentage change year-on-year)
Inflation (2)
(quarterly)(1) (annual)
UK 2,9 2,9 3,3 3,0 0,9 4,9 (3) 5,4 (4) 1,8Japan 3,3 2,6 -1,2 1,6 3,2 -1,9 3,6 0,0 (5)
USA 0,6 1,9 4,0 1,9 1,7 (3) 3,6 4,6 (3) 2,0Euro area 2,4 3,0 1,2 2,5 3,7 0,5 6,9 1,8China 11,1 11,9 17,5 (3) 15,3 (6) 9,5 (7) 6,5
Source: The Economist, 20 September.(1) Percentage change on previous quarter at an annualised rate.(2) Based on the consumer price index.(3) August 2007.(4) May - July 2007.(5) July 2007.(6) March 2007.(7) December 2006.
Retail sales
July (annual)
Unemployment
August (annual)
July (annual)(quarterly)(1)
Industrial production
July (annual)
GDP2007 (Q1) 2007 (Q2)
(annual)
Monetary Policy Report October 2007
7
Chart 2 Major international currencies (middle rate)
USD per EURO
0,800,901,001,101,201,301,401,50
04-0
1-20
00
17-0
6-20
00
29-1
1-20
00
13-0
5-20
01
25-1
0-20
01
08-0
4-20
02
20-0
9-20
02
04-0
3-20
03
16-0
8-20
03
28-0
1-20
04
11-0
7-20
04
23-1
2-20
04
06-0
6-20
05
18-1
1-20
05
02-0
5-20
06
14-1
0-20
06
28-0
3-20
07
09-0
9-20
07
JPY per EURO
80
100
120
140
160
180
04-0
1-20
00
17-0
6-20
00
29-1
1-20
00
13-0
5-20
01
25-1
0-20
01
08-0
4-20
02
20-0
9-20
02
04-0
3-20
03
16-0
8-20
03
28-0
1-20
04
11-0
7-20
04
23-1
2-20
04
06-0
6-20
05
18-1
1-20
05
02-0
5-20
06
14-1
0-20
06
28-0
3-20
07
09-0
9-20
07
GBP per EURO
0,56
0,60
0,64
0,68
0,72
0,76
04-0
1-20
00
17-0
6-20
00
29-1
1-20
00
13-0
5-20
01
25-1
0-20
01
08-0
4-20
02
20-0
9-20
02
04-0
3-20
03
16-0
8-20
03
28-0
1-20
04
11-0
7-20
04
23-1
2-20
04
06-0
6-20
05
18-1
1-20
05
02-0
5-20
06
14-1
0-20
06
28-0
3-20
07
09-0
9-20
07
USD per GBP
1,301,401,501,601,701,801,902,002,10
04-0
1-20
00
17-0
6-20
00
29-1
1-20
00
13-0
5-20
01
25-1
0-20
01
08-0
4-20
02
20-0
9-20
02
04-0
3-20
03
16-0
8-20
03
28-0
1-20
04
11-0
7-20
04
23-1
2-20
04
06-0
6-20
05
18-1
1-20
05
02-0
5-20
06
14-1
0-20
06
28-0
3-20
07
09-0
9-20
07
Source: Central Bank of Cyprus.
Central Bank of Cyprus
8
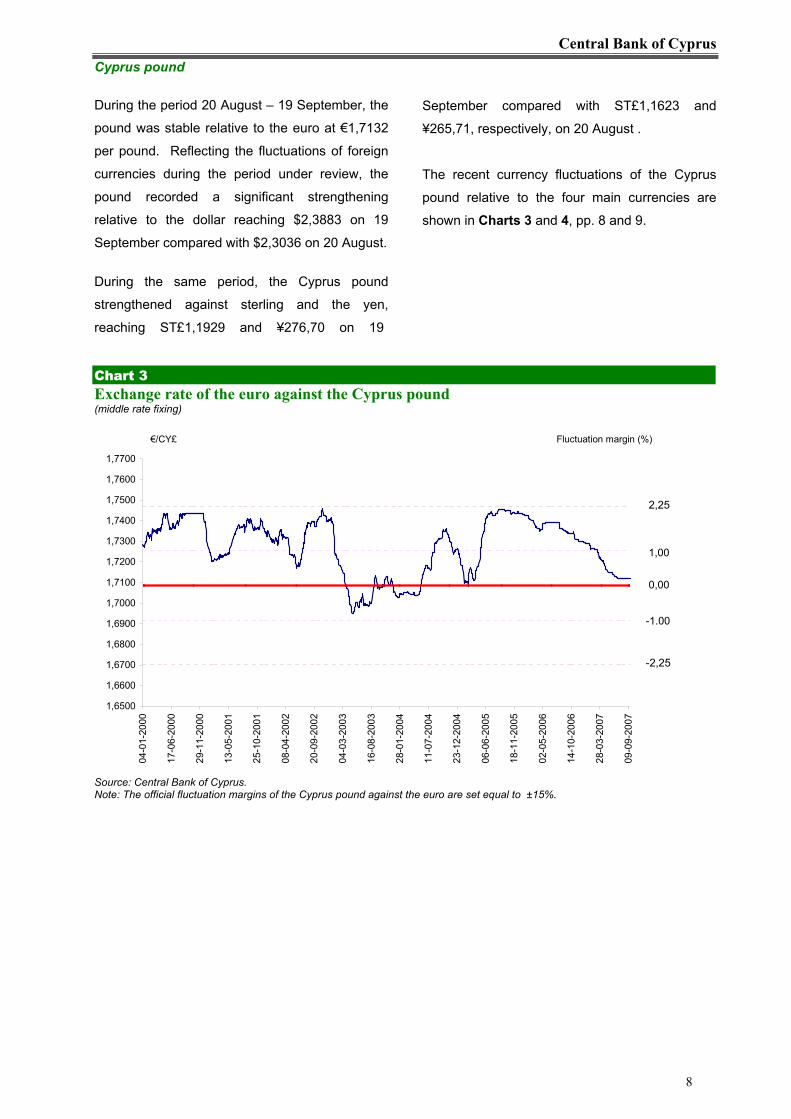
Cyprus pound During the period 20 August – 19 September, the
pound was stable relative to the euro at €1,7132
per pound. Reflecting the fluctuations of foreign
currencies during the period under review, the
pound recorded a significant strengthening
relative to the dollar reaching $2,3883 on 19
September compared with $2,3036 on 20 August.
During the same period, the Cyprus pound
strengthened against sterling and the yen,
reaching ST£1,1929 and ¥276,70 on 19
September compared with ST£1,1623 and
¥265,71, respectively, on 20 August .
The recent currency fluctuations of the Cyprus
pound relative to the four main currencies are
shown in Charts 3 and 4, pp. 8 and 9.
Chart 3 Exchange rate of the euro against the Cyprus pound (middle rate fixing)
1,6500
1,6600
1,6700
1,6800
1,6900
1,7000
1,7100
1,7200
1,7300
1,7400
1,7500
1,7600
1,7700
04-0
1-20
00
17-0
6-20
00
29-1
1-20
00
13-0
5-20
01
25-1
0-20
01
08-0
4-20
02
20-0
9-20
02
04-0
3-20
03
16-0
8-20
03
28-0
1-20
04
11-0
7-20
04
23-1
2-20
04
06-0
6-20
05
18-1
1-20
05
02-0
5-20
06
14-1
0-20
06
28-0
3-20
07
09-0
9-20
07
-2,25
2,25
-1.00
1,00
0,00
€/CY£ Fluctuation margin (%)
Source: Central Bank of Cyprus. Note: The official fluctuation margins of the Cyprus pound against the euro are set equal to ±15%.

Monetary Policy Report October 2007
9
Chart 4 Cyprus pound against major international currencies (middle rate)
JPY
140160180200220240260280300
04-0
1-20
00
17-0
6-20
00
29-1
1-20
00
13-0
5-20
01
25-1
0-20
01
08-0
4-20
02
20-0
9-20
02
04-0
3-20
03
16-0
8-20
03
28-0
1-20
04
11-0
7-20
04
23-1
2-20
04
06-0
6-20
05
18-1
1-20
05
02-0
5-20
06
14-1
0-20
06
28-0
3-20
07
09-0
9-20
07
GBP
0,981,021,061,101,141,181,221,26
04-0
1-20
00
17-0
6-20
00
29-1
1-20
00
13-0
5-20
01
25-1
0-20
01
08-0
4-20
02
20-0
9-20
02
04-0
3-20
03
16-0
8-20
03
28-0
1-20
04
11-0
7-20
04
23-1
2-20
04
06-0
6-20
05
18-1
1-20
05
02-0
5-20
06
14-1
0-20
06
28-0
3-20
07
09-0
9-20
07
USD
1,401,601,80
2,002,202,40
04-0
1-20
00
17-0
6-20
00
29-1
1-20
00
13-0
5-20
01
25-1
0-20
01
08-0
4-20
02
20-0
9-20
02
04-0
3-20
03
16-0
8-20
03
28-0
1-20
04
11-0
7-20
04
23-1
2-20
04
06-0
6-20
05
18-1
1-20
05
02-0
5-20
06
14-1
0-20
06
28-0
3-20
07
09-0
9-20
07
Source: Central Bank of Cyprus.
Central Bank of Cyprus
10
BOX 1
Effective exchange rate indices of the Cyprus pound
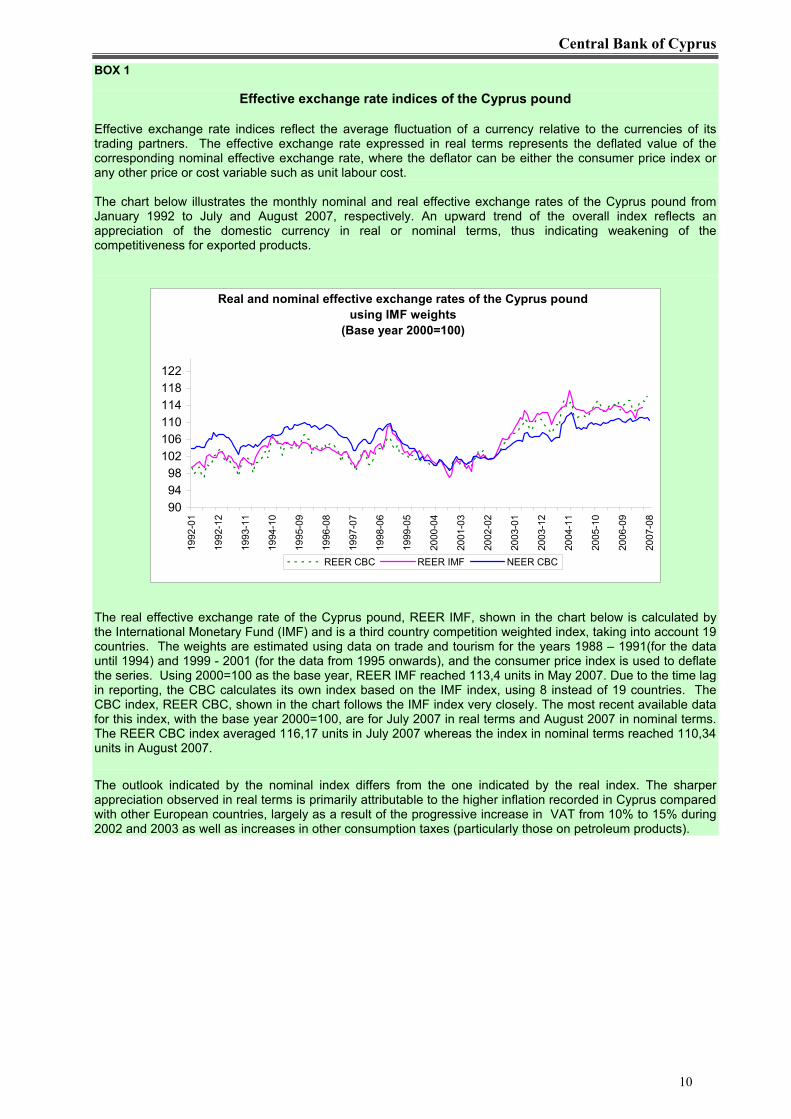
Effective exchange rate indices reflect the average fluctuation of a currency relative to the currencies of its trading partners. The effective exchange rate expressed in real terms represents the deflated value of the corresponding nominal effective exchange rate, where the deflator can be either the consumer price index or any other price or cost variable such as unit labour cost. The chart below illustrates the monthly nominal and real effective exchange rates of the Cyprus pound from January 1992 to July and August 2007, respectively. An upward trend of the overall index reflects an appreciation of the domestic currency in real or nominal terms, thus indicating weakening of the competitiveness for exported products.
Real and nominal effective exchange rates of the Cyprus pound using IMF weights
(Base year 2000=100)
909498
102106110114118122
1992
-01
1992
-12
1993
-11
1994
-10
1995
-09
1996
-08
1997
-07
1998
-06
1999
-05
2000
-04
2001
-03
2002
-02
2003
-01
2003
-12
2004
-11
2005
-10
2006
-09
2007
-08
REER CBC REER IMF NEER CBC
The real effective exchange rate of the Cyprus pound, REER IMF, shown in the chart below is calculated by the International Monetary Fund (IMF) and is a third country competition weighted index, taking into account 19 countries. The weights are estimated using data on trade and tourism for the years 1988 – 1991(for the data until 1994) and 1999 - 2001 (for the data from 1995 onwards), and the consumer price index is used to deflate the series. Using 2000=100 as the base year, REER IMF reached 113,4 units in May 2007. Due to the time lag in reporting, the CBC calculates its own index based on the IMF index, using 8 instead of 19 countries. The CBC index, REER CBC, shown in the chart follows the IMF index very closely. The most recent available data for this index, with the base year 2000=100, are for July 2007 in real terms and August 2007 in nominal terms. The REER CBC index averaged 116,17 units in July 2007 whereas the index in nominal terms reached 110,34 units in August 2007.
The outlook indicated by the nominal index differs from the one indicated by the real index. The sharper appreciation observed in real terms is primarily attributable to the higher inflation recorded in Cyprus compared with other European countries, largely as a result of the progressive increase in VAT from 10% to 15% during 2002 and 2003 as well as increases in other consumption taxes (particularly those on petroleum products).
Monetary Policy Report October 2007
11
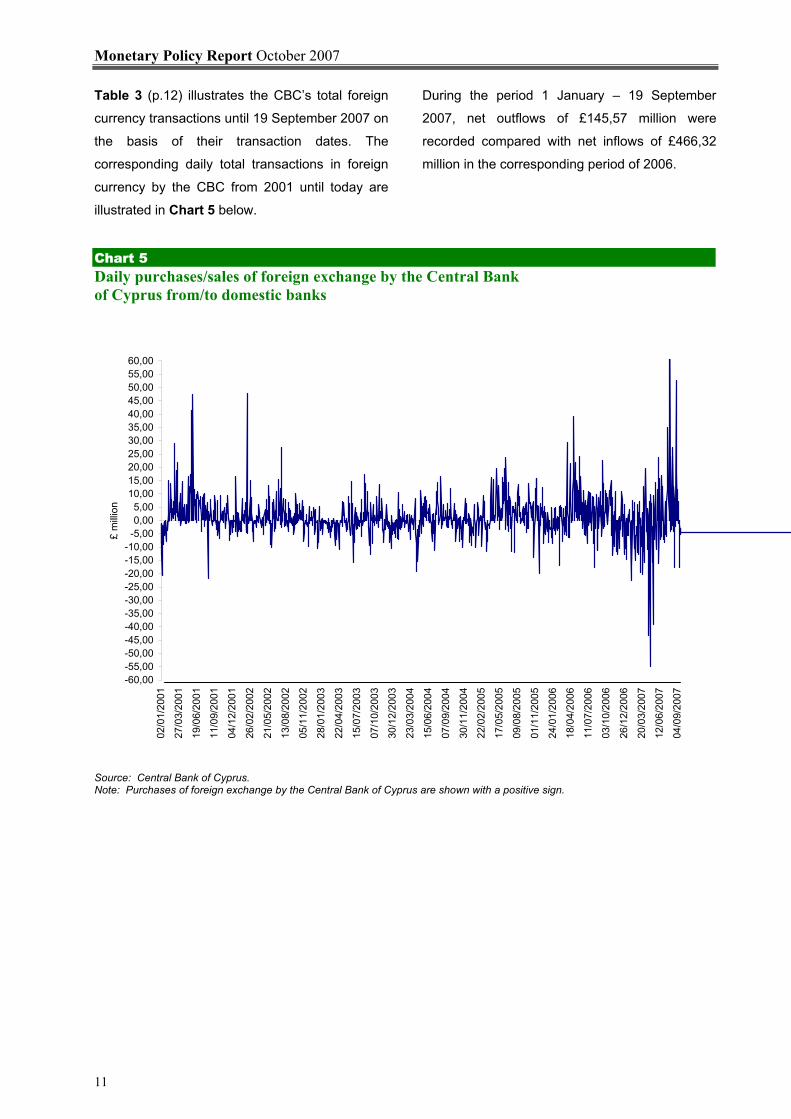
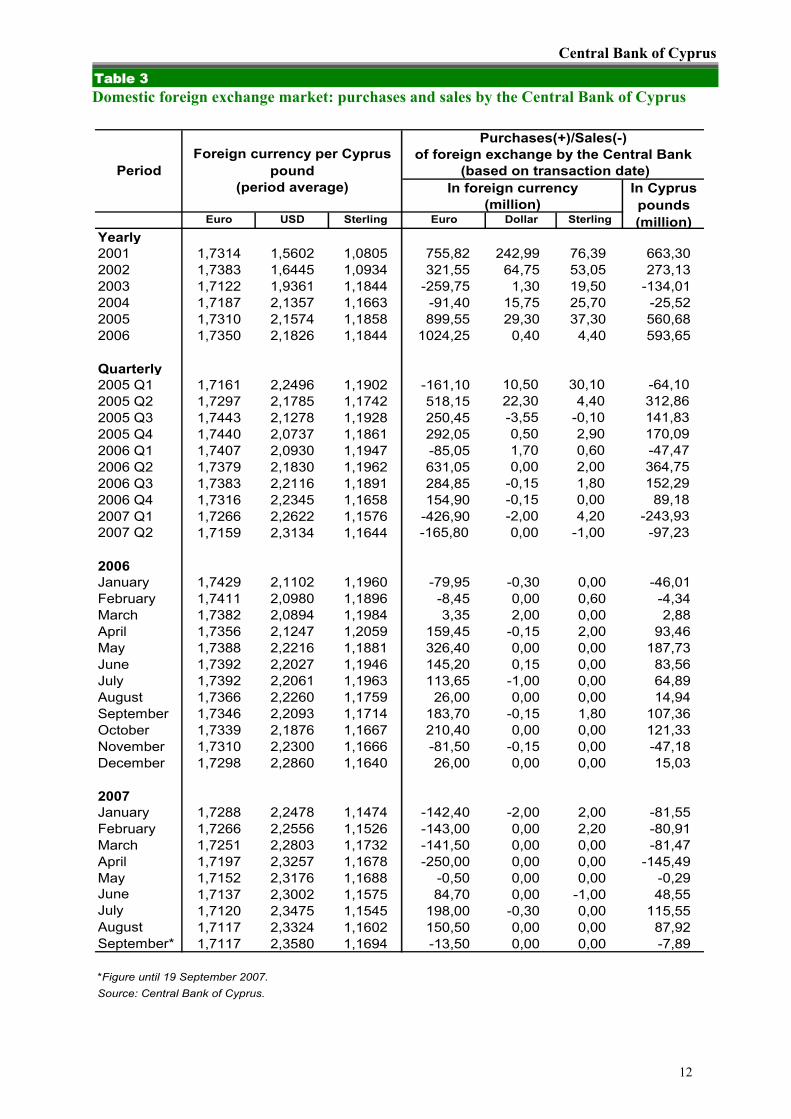
Table 3 (p.12) illustrates the CBC’s total foreign
currency transactions until 19 September 2007 on
the basis of their transaction dates. The
corresponding daily total transactions in foreign
currency by the CBC from 2001 until today are
illustrated in Chart 5 below.
During the period 1 January – 19 September
2007, net outflows of £145,57 million were
recorded compared with net inflows of £466,32
million in the corresponding period of 2006.
Chart 5 Daily purchases/sales of foreign exchange by the Central Bank of Cyprus from/to domestic banks
-60,00-55,00-50,00-45,00-40,00-35,00-30,00-25,00-20,00-15,00-10,00-5,000,005,00
10,0015,0020,0025,0030,0035,0040,0045,0050,0055,0060,00
02/0
1/20
01
27/0
3/20
01
19/0
6/20
01
11/0
9/20
01
04/1
2/20
01
26/0
2/20
02
21/0
5/20
02
13/0
8/20
02
05/1
1/20
02
28/0
1/20
03
22/0
4/20
03
15/0
7/20
03
07/1
0/20
03
30/1
2/20
03
23/0
3/20
04
15/0
6/20
04
07/0
9/20
04
30/1
1/20
04
22/0
2/20
05
17/0
5/20
05
09/0
8/20
05
01/1
1/20
05
24/0
1/20
06
18/0
4/20
06
11/0
7/20
06
03/1
0/20
06
26/1
2/20
06
20/0
3/20
07
12/0
6/20
07
04/0
9/20
07
£ m
illio
n
Source: Central Bank of Cyprus. Note: Purchases of foreign exchange by the Central Bank of Cyprus are shown with a positive sign.
Central Bank of Cyprus
12
Table 3 Domestic foreign exchange market: purchases and sales by the Central Bank of Cyprus
Euro USD Sterling
Yearly2001 1,7314 1,5602 1,0805 755,82 242,99 76,39 663,302002 1,7383 1,6445 1,0934 321,55 64,75 53,05 273,132003 1,7122 1,9361 1,1844 -259,75 1,30 19,50 -134,012004 1,7187 2,1357 1,1663 -91,40 15,75 25,70 -25,522005 1,7310 2,1574 1,1858 899,55 29,30 37,30 560,682006 1,7350 2,1826 1,1844 1024,25 0,40 4,40 593,65
Quarterly2005 Q1 1,7161 2,2496 1,1902 -161,10 10,50 30,10 -64,102005 Q2 1,7297 2,1785 1,1742 518,15 22,30 4,40 312,862005 Q3 1,7443 2,1278 1,1928 250,45 -3,55 -0,10 141,832005 Q4 1,7440 2,0737 1,1861 292,05 0,50 2,90 170,092006 Q1 1,7407 2,0930 1,1947 -85,05 1,70 0,60 -47,472006 Q2 1,7379 2,1830 1,1962 631,05 0,00 2,00 364,752006 Q3 1,7383 2,2116 1,1891 284,85 -0,15 1,80 152,292006 Q4 1,7316 2,2345 1,1658 154,90 -0,15 0,00 89,182007 Q1 1,7266 2,2622 1,1576 -426,90 -2,00 4,20 -243,932007 Q2 1,7159 2,3134 1,1644 -165,80 0,00 -1,00 -97,23
2006January 1,7429 2,1102 1,1960 -79,95 -0,30 0,00 -46,01February 1,7411 2,0980 1,1896 -8,45 0,00 0,60 -4,34March 1,7382 2,0894 1,1984 3,35 2,00 0,00 2,88April 1,7356 2,1247 1,2059 159,45 -0,15 2,00 93,46May 1,7388 2,2216 1,1881 326,40 0,00 0,00 187,73June 1,7392 2,2027 1,1946 145,20 0,15 0,00 83,56July 1,7392 2,2061 1,1963 113,65 -1,00 0,00 64,89August 1,7366 2,2260 1,1759 26,00 0,00 0,00 14,94September 1,7346 2,2093 1,1714 183,70 -0,15 1,80 107,36October 1,7339 2,1876 1,1667 210,40 0,00 0,00 121,33November 1,7310 2,2300 1,1666 -81,50 -0,15 0,00 -47,18December 1,7298 2,2860 1,1640 26,00 0,00 0,00 15,03
2007January 1,7288 2,2478 1,1474 -142,40 -2,00 2,00 -81,55February 1,7266 2,2556 1,1526 -143,00 0,00 2,20 -80,91March 1,7251 2,2803 1,1732 -141,50 0,00 0,00 -81,47April 1,7197 2,3257 1,1678 -250,00 0,00 0,00 -145,49May 1,7152 2,3176 1,1688 -0,50 0,00 0,00 -0,29June 1,7137 2,3002 1,1575 84,70 0,00 -1,00 48,55July 1,7120 2,3475 1,1545 198,00 -0,30 0,00 115,55August 1,7117 2,3324 1,1602 150,50 0,00 0,00 87,92September* 1,7117 2,3580 1,1694 -13,50 0,00 0,00 -7,89
*Figure until 19 September 2007.Source: Central Bank of Cyprus.
(period average) In Cyprus pounds (million)Euro Dollar Sterling
Period Foreign currency per Cyprus
pound
Purchases(+)/Sales(-)of foreign exchange by the Central Bank
(based on transaction date) In foreign currency
(million)
Monetary Policy Report October 2007
13
2.2 MONETARY DEVELOPMENTS
The banking system in Cyprus consists of the
domestic banks, the co-operative credit
institutions (CCIs) and the former international
banking units (IBUs). Although there are
updated figures for commercial banks, data for
CCIs are available with a delay of approximately
three months. For this reason, in the analysis
that follows it is mainly commercial bank data
that are described as they are readily available,
whereas in the case of CCIs our comments are
based on estimates or preliminary data.
Following the complete liberalisation of capital
movements, the former IBUs are free to provide
credit to Cypriots1.
Analysis of monetary aggregates
During August M2 continued to grow at a fast
rate, mainly because of the continued increase
in credit to the private sector (Charts 6 and 7, respectively, p. 14). At the same time, the
increase in foreign currency loans persisted,
with the share of new foreign currency loans to
total loans outstanding at the end of August
2007 constituting 19% of total credit.
According to provisional data, the annual rate of
growth of the total money supply M2C2, which
includes deposits in domestic banks and CCIs,
was 18,5% in August, compared with 18,1% in
July 2007 and 12,1% in August 2006. Credit to
the private sector by domestic banks and the
CCIs grew by 22,5% in August 2007, compared
with 13% in the same month of 2006.
1. It should be noted that, since 1 January 2006 the term ‘international banking units’ has ceased to be used. Upon introduction of the new monthly balance sheet for monetary and financial institutions (MFIs), the data from IBUs will be consolidated with the local MFIs. 2. The monetary aggregate M2C should be treated with caution since the CCIs are not supervised by the Central Bank of Cyprus and, in addition, the automation undertaken by the Co-operative Computers Society (SEM) Ltd. does not yet cover all the CCIs.
M2 grew by 19,7% in August, which was slightly
higher than the 19,6% experienced in July, and
significantly higher than the 13,3% experienced
in August 2006. According to the three-month
moving average, the rate of growth of M2 during
the period June – August 2007 accelerated to
19,4%, compared with 18,8% in the period
May – July 2007.
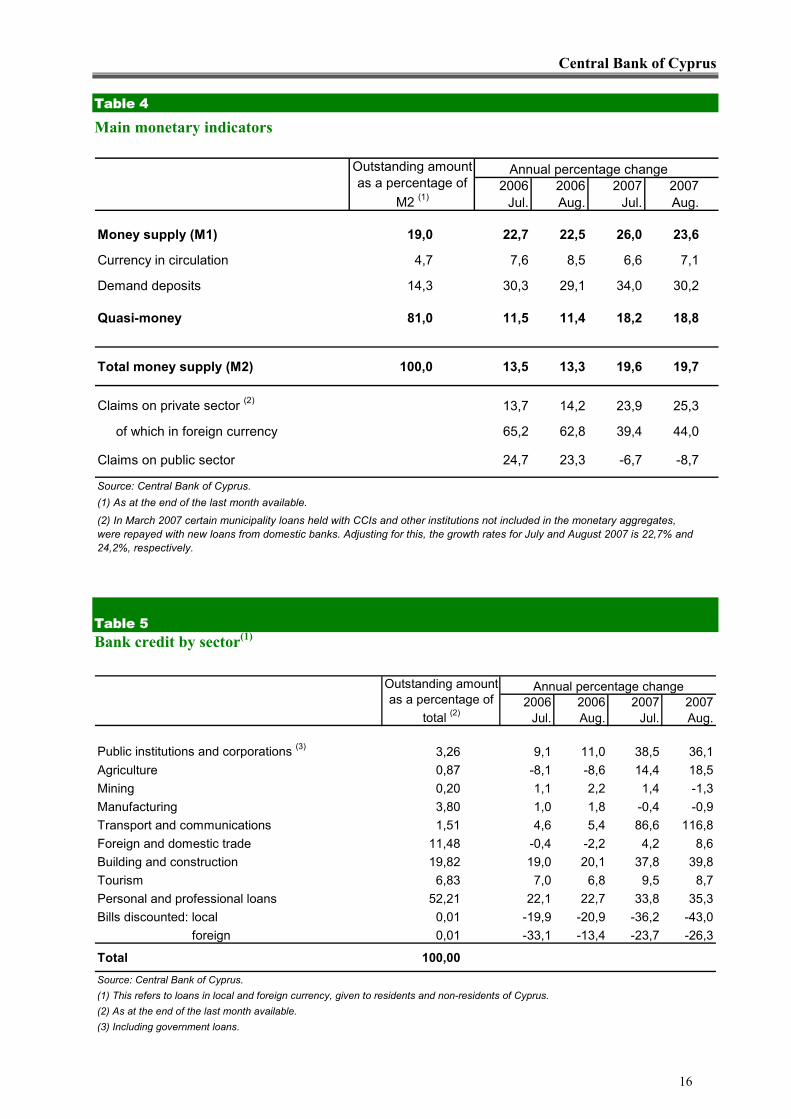
Table 4 (p. 16) presents the annual percentage
change of components and factors affecting total
money supply. Regarding the components of
M2, the narrow money aggregate M1 registered
an annual increase of 23,6% in August,
compared with 26% in July 2007 and 22,5% in
August 2006. The slowdown in M1 growth
emanated mainly from demand deposits in local
currency. Quasi-money rose by 18,8% in August
compared with 18,2% in July 2007 and 11,4%
August 2006. The acceleration in quasi-money
growth and the simultaneous slowdown in M1
growth indicate a switch from demand deposits
towards time deposits. More specifically, the
main increase was for deposits of seven days to
three months duration. At the end of August,
quasi-money accounted for 81% of total money
supply while M1 accounted for 19% of total
money supply.
The annual rate of growth of residents’ local
currency deposits rose by 12,2% in August,
compared with 11,7% in July 2007 and 12% in
August 2006. At the same time, the annual rate
of growth of resident foreign currency deposits
was 80,2% in August, compared with 86,7% in
July 2007 and 27% in August 2006. This
development was partly the result of a narrowing
in the interest rate gap between euro and
Cyprus pound deposits, the forthcoming
adoption of the euro on 1 January 2008 and the
fact that all transactions on the Cyprus Stock
Exchange are undertaken in euros.

Central Bank of Cyprus
14
Chart 6 M2 growth (annual percentage change, monthly data)
2,0
4,0
6,0
8,0
10,0
12,0
14,0
16,0
18,0
20,0
22,001
-199
8
06-1
998
11-1
998
04-1
999
09-1
999
02-2
000
07-2
000
12-2
000
05-2
001
10-2
001
03-2
002
08-2
002
01-2
003
06-2
003
11-2
003
04-2
004
09-2
004
02-2
005
07-2
005
12-2
005
05-2
006
10-2
006
03-2
007
08-2
007
M2 3 month centred moving average
Source: Central Bank of Cyprus. Chart 7 Growth of claims on private sector (annual percentage change, monthly data)
3,05,07,09,0
11,013,015,017,019,021,023,025,027,0
01-1
998
06-1
998
11-1
998
04-1
999
09-1
999
02-2
000
07-2
000
12-2
000
05-2
001
10-2
001
03-2
002
08-2
002
01-2
003
06-2
003
11-2
003
04-2
004
09-2
004
02-2
005
07-2
005
12-2
005
05-2
006
10-2
006
03-2
007
08-2
007
Claims on private sector 3 month centred moving average
Source: Central Bank of Cyprus.

Monetary Policy Report October 2007
15
The acceleration in the growth of Μ2 was mainly
a result of the increase in credit to the private
sector, which grew by 25,3% in August. Credit
had risen by 23,9% in July 2007 and 14,2% in
August 2006. The three-month moving average
of credit growth was 24% during the period June
– August 2007, compared with 22,8% in the
period May – July 2007. On the other hand,
credit to the public sector declined by 8,7% and
6,7% in August and July, respectively, compared
with an increase of 23,3% in August 2006.
The breakdown of bank credit by sector of
economic activity (Table 5, p. 16) shows that
personal/professional loans rose by 35,3% in
August, compared with 33,8% in July 2007 and
22,7% in August 2006. Credit to the construction
sector rose at an annual rate of 39,8% in August,
compared with 37,8% in July 2007 and 20,1% in
August 2006.
The largest share of total outstanding amounts at
the end of August 2007 was maintained by
personal/professional loans with 52,2%, followed
by credit to the construction sector with 19,8%,
foreign and domestic trade with 11,5%, and
tourism with 6,8%.
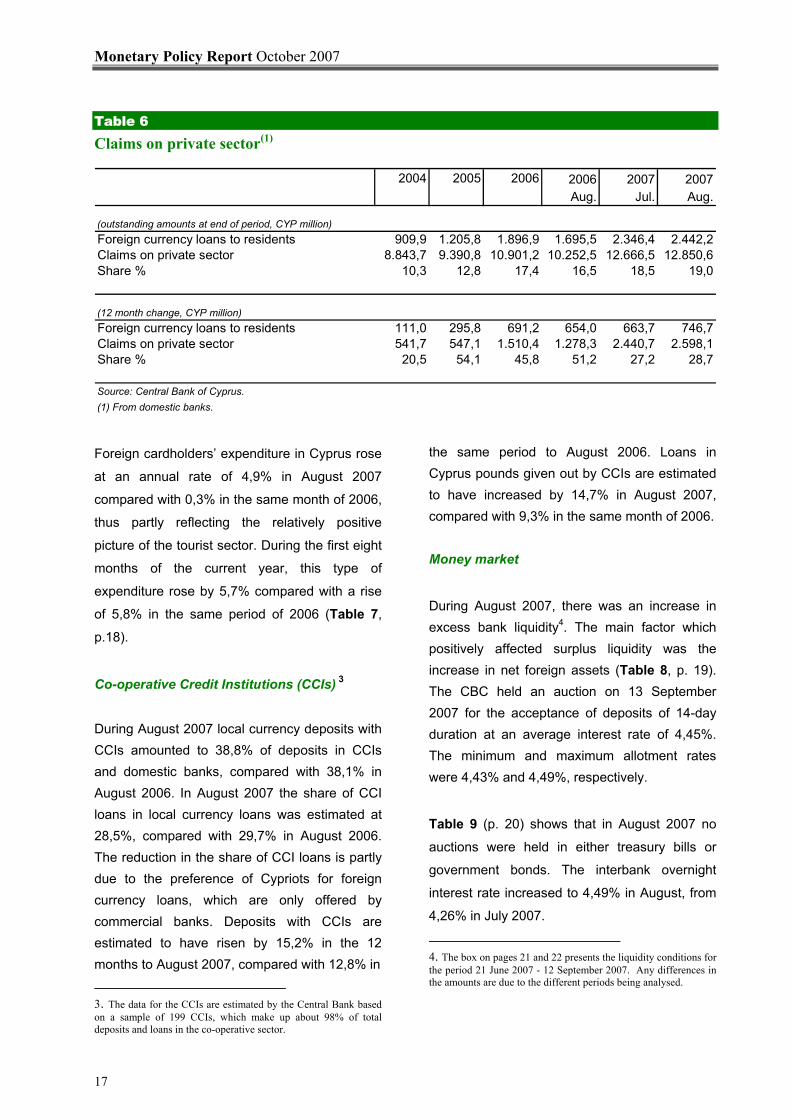
Foreign currency lending to residents by domestic
banks rose by £746,7 million in the 12 months to
August 2007, compared with a rise of £654 million
in the same period of the previous year (Table 6,
p. 17). The share of new foreign currency loans to
total new loans given in the 12 months to August
2007 was 28,7%, compared with 51,2% in the
same period of 2006. The share of new foreign
currency loans to total loans outstanding at the end
of August 2007 was 19%, compared with 16,5% at
the end of August 2006.
At the end of July 2007, loans in euro as a
percentage of total foreign currency loans
reached 54,5%, loans in Swiss francs accounted
for 37,4% and loans in dollars accounted for
3,2%, compared with 59,8%, 31,4% and 6,2%,
respectively, at the end of July 2006. The
increasing share of loans in Swiss francs is
attributed to the low interest rates in this
currency, as opposed to the steady and
continuous rise of euro interest rates in the last
two years. It also appears that borrowers have
been disregarding the exchange rate risk
associated with such transactions, even though
the exchange rate between the Swiss franc and
the Cyprus pound has historically exhibited
fluctuations.
Domestic expenditure by holders of Cypriot
credit cards rose at an annual rate of 11,9% in
August 2007, compared with 17,7% in August
2006. In the first eight months of 2007, this
expenditure rose by 19,2% compared with
16,9% in the same period of 2006.
Expenditure by Cypriot cardholders abroad rose
at an annual rate of 35,1% in August, compared
with 29,2% in the same month of the previous
year. During the period January – August 2007,
this type of expenditure rose by 37,8%
compared with 35% in the same period of the
preceding year.
Central Bank of Cyprus
16
Table 4
Main monetary indicators
Annual percentage change2006 2006 2007 2007
Jul. Aug. Jul. Aug.
Money supply (M1) 19,0 22,7 22,5 26,0 23,6
Currency in circulation 4,7 7,6 8,5 6,6 7,1
Demand deposits 14,3 30,3 29,1 34,0 30,2
Quasi-money 81,0 11,5 11,4 18,2 18,8
Total money supply (M2) 100,0 13,5 13,3 19,6 19,7
Claims on private sector (2) 13,7 14,2 23,9 25,3
of which in foreign currency 65,2 62,8 39,4 44,0
Claims on public sector 24,7 23,3 -6,7 -8,7
Source: Central Bank of Cyprus.(1) As at the end of the last month available.
Outstanding amount as a percentage of
M2 (1)
(2) In March 2007 certain municipality loans held with CCIs and other institutions not included in the monetary aggregates, were repayed with new loans from domestic banks. Adjusting for this, the growth rates for July and August 2007 is 22,7% and 24,2%, respectively.
Table 5 Bank credit by sector(1)
Annual percentage change2006 2006 2007 2007
Jul. Aug. Jul. Aug.
Public institutions and corporations (3) 3,26 9,1 11,0 38,5 36,1Agriculture 0,87 -8,1 -8,6 14,4 18,5Mining 0,20 1,1 2,2 1,4 -1,3Manufacturing 3,80 1,0 1,8 -0,4 -0,9Transport and communications 1,51 4,6 5,4 86,6 116,8Foreign and domestic trade 11,48 -0,4 -2,2 4,2 8,6Building and construction 19,82 19,0 20,1 37,8 39,8Tourism 6,83 7,0 6,8 9,5 8,7Personal and professional loans 52,21 22,1 22,7 33,8 35,3Bills discounted: local 0,01 -19,9 -20,9 -36,2 -43,0 foreign 0,01 -33,1 -13,4 -23,7 -26,3
Total 100,00Source: Central Bank of Cyprus.(1) This refers to loans in local and foreign currency, given to residents and non-residents of Cyprus.(2) As at the end of the last month available. (3) Including government loans.
Outstanding amount as a percentage of
total (2)
Monetary Policy Report October 2007
17
Table 6 Claims on private sector(1)
2004 2005 2006 2006 2007 2007Aug. Jul. Aug.
(outstanding amounts at end of period, CYP million)Foreign currency loans to residents 909,9 1.205,8 1.896,9 1.695,5 2.346,4 2.442,2Claims on private sector 8.843,7 9.390,8 10.901,2 10.252,5 12.666,5 12.850,6Share % 10,3 12,8 17,4 16,5 18,5 19,0
(12 month change, CYP million)Foreign currency loans to residents 111,0 295,8 691,2 654,0 663,7 746,7Claims on private sector 541,7 547,1 1.510,4 1.278,3 2.440,7 2.598,1Share % 20,5 54,1 45,8 51,2 27,2 28,7
Source: Central Bank of Cyprus.(1) From domestic banks.
Foreign cardholders’ expenditure in Cyprus rose
at an annual rate of 4,9% in August 2007
compared with 0,3% in the same month of 2006,
thus partly reflecting the relatively positive
picture of the tourist sector. During the first eight
months of the current year, this type of
expenditure rose by 5,7% compared with a rise
of 5,8% in the same period of 2006 (Table 7,
p.18).
Co-operative Credit Institutions (CCIs) 3
During August 2007 local currency deposits with CCIs amounted to 38,8% of deposits in CCIs and domestic banks, compared with 38,1% in August 2006. In August 2007 the share of CCI loans in local currency loans was estimated at 28,5%, compared with 29,7% in August 2006. The reduction in the share of CCI loans is partly due to the preference of Cypriots for foreign currency loans, which are only offered by commercial banks. Deposits with CCIs are estimated to have risen by 15,2% in the 12 months to August 2007, compared with 12,8% in
3. The data for the CCIs are estimated by the Central Bank based on a sample of 199 CCIs, which make up about 98% of total deposits and loans in the co-operative sector.
the same period to August 2006. Loans in Cyprus pounds given out by CCIs are estimated to have increased by 14,7% in August 2007, compared with 9,3% in the same month of 2006. Money market
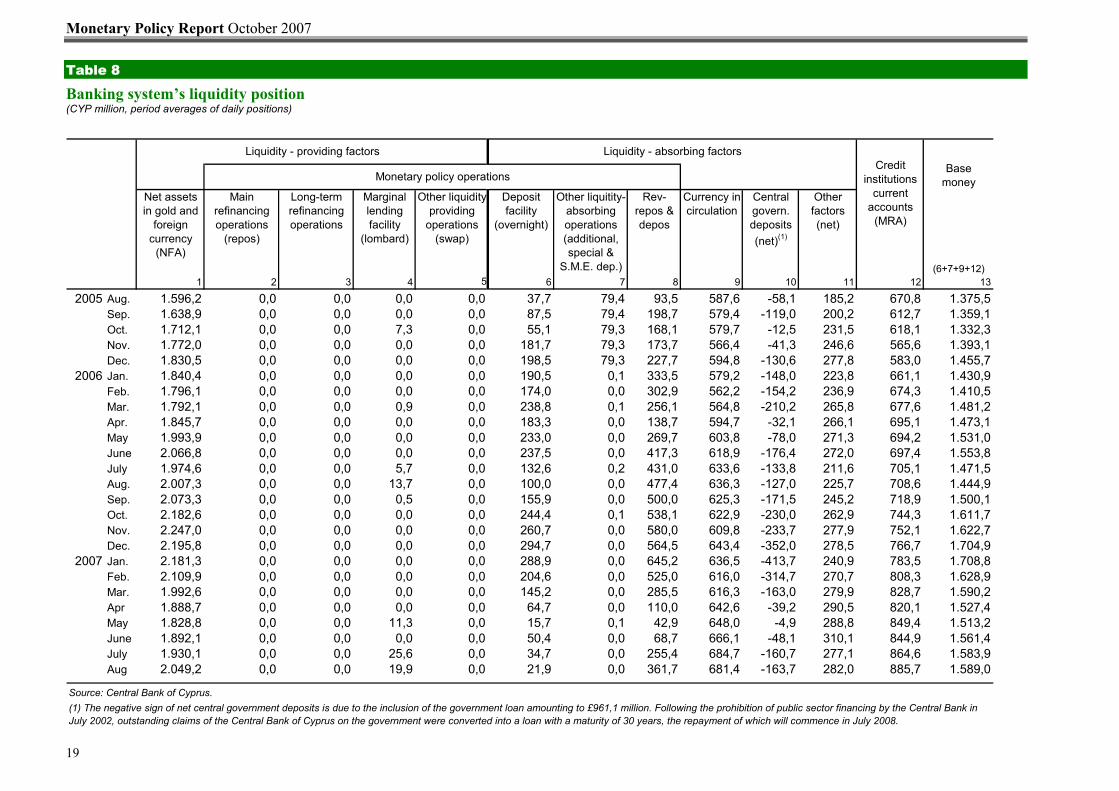
During August 2007, there was an increase in excess bank liquidity4. The main factor which positively affected surplus liquidity was the increase in net foreign assets (Table 8, p. 19). The CBC held an auction on 13 September 2007 for the acceptance of deposits of 14-day duration at an average interest rate of 4,45%. The minimum and maximum allotment rates were 4,43% and 4,49%, respectively.
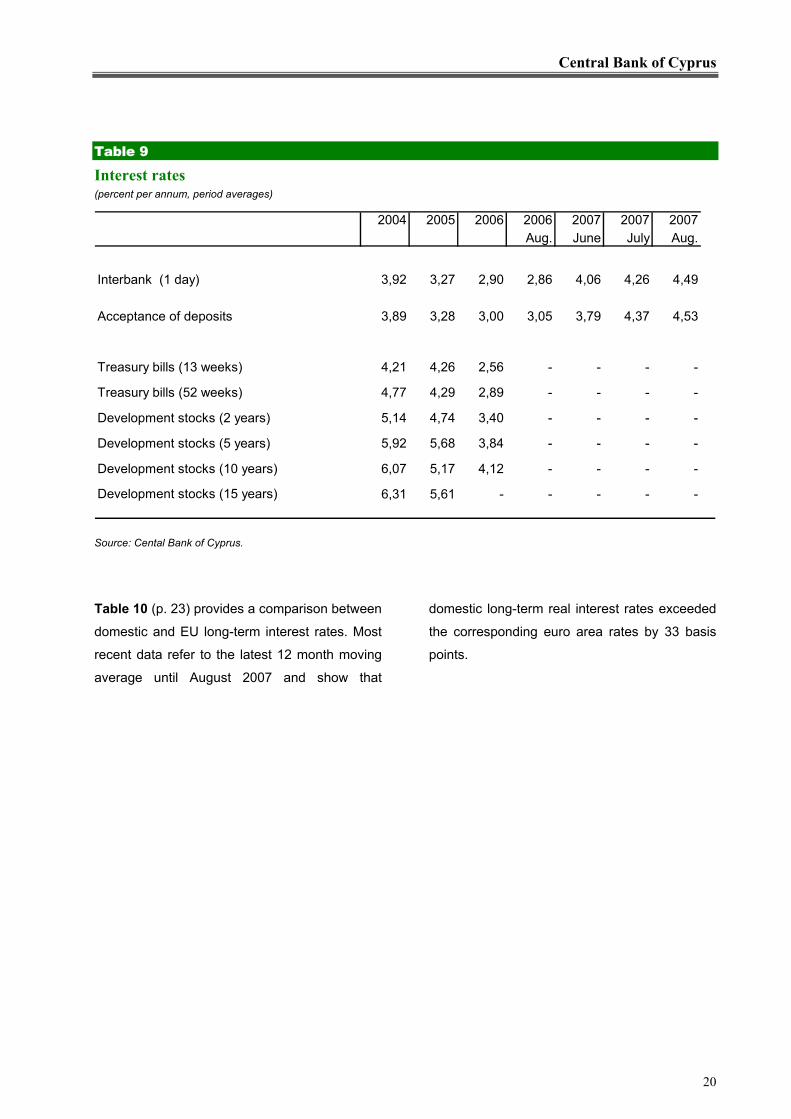
Table 9 (p. 20) shows that in August 2007 no
auctions were held in either treasury bills or
government bonds. The interbank overnight
interest rate increased to 4,49% in August, from
4,26% in July 2007.
4. The box on pages 21 and 22 presents the liquidity conditions for the period 21 June 2007 - 12 September 2007. Any differences in the amounts are due to the different periods being analysed.

Central Bank of Cyprus
18
Table 7 Credit card transactions
2005 2006 2006 2007 2006 2007
Foreign cardholder spending in Cyprus
Value (CYP thousand) 244.609 256.958 31.988 33.559 167.782 177.271Annual % change 5,1 5,0 -0,3 4,9 5,8 5,7
Local cardholder spending in Cyprus
Value (CYP thousand) 659.486 769.917 68.190 76.338 486.029 579.586Annual % change 11,4 16,7 17,7 11,9 16,9 19,2
Local cardholder spending abroad
Value (CYP thousand) 244.131 332.497 28.772 38.881 202.816 279.550Annual % change 25,2 36,2 29,2 35,1 35,0 37,8
Source: JCC Payment Systems.
Jan.-Aug.August
Monetary Policy Report October 2007
19
Table 8 Banking system’s liquidity position (CYP million, period averages of daily positions)
Main refinancing operations
(repos)
Long-term refinancing operations
Marginal lending facility
(lombard)
Deposit facility
(overnight)
Rev- repos & depos
Currency in circulation
Other factors (net)
(6+7+9+12)1 2 3 4 5 6 7 8 9 10 11 12 13
2005 Aug. 1.596,2 0,0 0,0 0,0 0,0 37,7 79,4 93,5 587,6 -58,1 185,2 670,8 1.375,5Sep. 1.638,9 0,0 0,0 0,0 0,0 87,5 79,4 198,7 579,4 -119,0 200,2 612,7 1.359,1Oct. 1.712,1 0,0 0,0 7,3 0,0 55,1 79,3 168,1 579,7 -12,5 231,5 618,1 1.332,3Nov. 1.772,0 0,0 0,0 0,0 0,0 181,7 79,3 173,7 566,4 -41,3 246,6 565,6 1.393,1Dec. 1.830,5 0,0 0,0 0,0 0,0 198,5 79,3 227,7 594,8 -130,6 277,8 583,0 1.455,7
2006 Jan. 1.840,4 0,0 0,0 0,0 0,0 190,5 0,1 333,5 579,2 -148,0 223,8 661,1 1.430,9Feb. 1.796,1 0,0 0,0 0,0 0,0 174,0 0,0 302,9 562,2 -154,2 236,9 674,3 1.410,5Mar. 1.792,1 0,0 0,0 0,9 0,0 238,8 0,1 256,1 564,8 -210,2 265,8 677,6 1.481,2Apr. 1.845,7 0,0 0,0 0,0 0,0 183,3 0,0 138,7 594,7 -32,1 266,1 695,1 1.473,1May 1.993,9 0,0 0,0 0,0 0,0 233,0 0,0 269,7 603,8 -78,0 271,3 694,2 1.531,0June 2.066,8 0,0 0,0 0,0 0,0 237,5 0,0 417,3 618,9 -176,4 272,0 697,4 1.553,8July 1.974,6 0,0 0,0 5,7 0,0 132,6 0,2 431,0 633,6 -133,8 211,6 705,1 1.471,5Aug. 2.007,3 0,0 0,0 13,7 0,0 100,0 0,0 477,4 636,3 -127,0 225,7 708,6 1.444,9Sep. 2.073,3 0,0 0,0 0,5 0,0 155,9 0,0 500,0 625,3 -171,5 245,2 718,9 1.500,1Oct. 2.182,6 0,0 0,0 0,0 0,0 244,4 0,1 538,1 622,9 -230,0 262,9 744,3 1.611,7Nov. 2.247,0 0,0 0,0 0,0 0,0 260,7 0,0 580,0 609,8 -233,7 277,9 752,1 1.622,7Dec. 2.195,8 0,0 0,0 0,0 0,0 294,7 0,0 564,5 643,4 -352,0 278,5 766,7 1.704,9
2007 Jan. 2.181,3 0,0 0,0 0,0 0,0 288,9 0,0 645,2 636,5 -413,7 240,9 783,5 1.708,8Feb. 2.109,9 0,0 0,0 0,0 0,0 204,6 0,0 525,0 616,0 -314,7 270,7 808,3 1.628,9Mar. 1.992,6 0,0 0,0 0,0 0,0 145,2 0,0 285,5 616,3 -163,0 279,9 828,7 1.590,2Apr 1.888,7 0,0 0,0 0,0 0,0 64,7 0,0 110,0 642,6 -39,2 290,5 820,1 1.527,4May 1.828,8 0,0 0,0 11,3 0,0 15,7 0,1 42,9 648,0 -4,9 288,8 849,4 1.513,2June 1.892,1 0,0 0,0 0,0 0,0 50,4 0,0 68,7 666,1 -48,1 310,1 844,9 1.561,4July 1.930,1 0,0 0,0 25,6 0,0 34,7 0,0 255,4 684,7 -160,7 277,1 864,6 1.583,9Aug 2.049,2 0,0 0,0 19,9 0,0 21,9 0,0 361,7 681,4 -163,7 282,0 885,7 1.589,0
Source: Central Bank of Cyprus.
Central govern. deposits (net)(1)
Net assets in gold and
foreign currency
(NFA)
Other liquidityproviding
operations (swap)
Other liquitity- absorbing operations (additional, special &
S.M.E. dep.)
(1) The negative sign of net central government deposits is due to the inclusion of the government loan amounting to £961,1 million. Following the prohibition of public sector financing by the Central Bank in July 2002, outstanding claims of the Central Bank of Cyprus on the government were converted into a loan with a maturity of 30 years, the repayment of which will commence in July 2008.
Credit institutions
current accounts
(MRA)
Base moneyMonetary policy operations
Liquidity - providing factors Liquidity - absorbing factors
Central Bank of Cyprus
20
Table 9
Interest rates (percent per annum, period averages)
2004 2005 2006 2006 2007 2007 2007Aug. June July Aug.
Interbank (1 day) 3,92 3,27 2,90 2,86 4,06 4,26 4,49
Acceptance of deposits 3,89 3,28 3,00 3,05 3,79 4,37 4,53
Treasury bills (13 weeks) 4,21 4,26 2,56 - - - -
Treasury bills (52 weeks) 4,77 4,29 2,89 - - - -
Development stocks (2 years) 5,14 4,74 3,40 - - - -
Development stocks (5 years) 5,92 5,68 3,84 - - - -
Development stocks (10 years) 6,07 5,17 4,12 - - - -
Development stocks (15 years) 6,31 5,61 - - - - -
Source: Cental Bank of Cyprus.
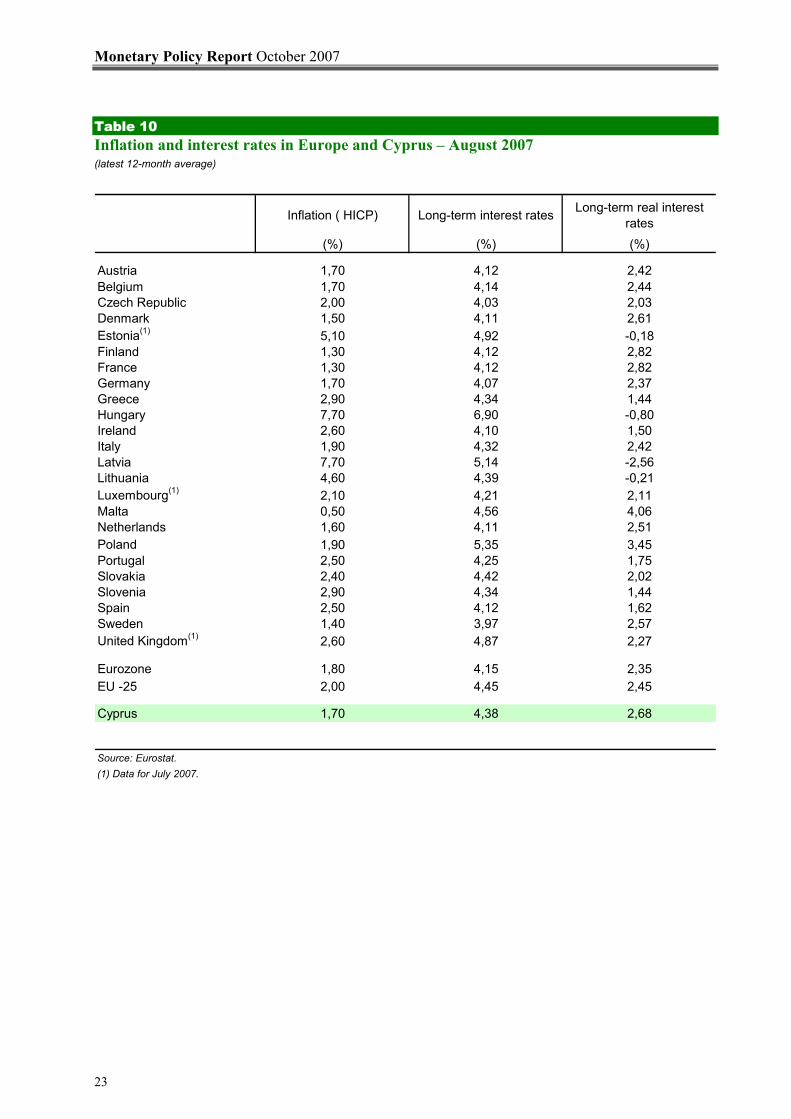
Table 10 (p. 23) provides a comparison between
domestic and EU long-term interest rates. Most
recent data refer to the latest 12 month moving
average until August 2007 and show that
domestic long-term real interest rates exceeded
the corresponding euro area rates by 33 basis
points.
Monetary Policy Report October 2007
21
BOX 2
Open market operations(CYP million; interest rates in percentages per annum)
Operation Date of settlement
Date of maturity
Bids (amount)
Allotment (amount)
Bid-cover ratio
Weighted average
allotment rate
Running for (…) days
LAO 21/06/2007 05/07/2007 147,0 70,0 2,10 3,59 14LAO 05/07/2007 19/07/2007 308,0 280,0 1,10 4,26 14LAO 19/07/2007 02/08/2007 96,0 80,0 1,20 4,37 14LAO 19/07/2007 02/01/2008 206,0 206,0 1,00 4,60* 167LAO 02/082007 16/08/2007 219,0 150,0 1,46 4,38 14LAO 16/08/2007 30/08/2007 169,0 169,0 1,00 4,47 14LAO 30/08/2007 13/09/2007 140,2 140,2 1,00 4,50 14* Fixed rate auction
Source: Central Bank of Cyprus.
Standing facilities(period averages of daily recourse in CYP million)
Period Deposit facility
Marginal lending facility
141,5 0,00,0 0,0
44,7 56,63,6 9,3
25,8 32,927,1 27,0
Source: Central Bank of Cyprus.
Liquidity conditions and monetary policy operations
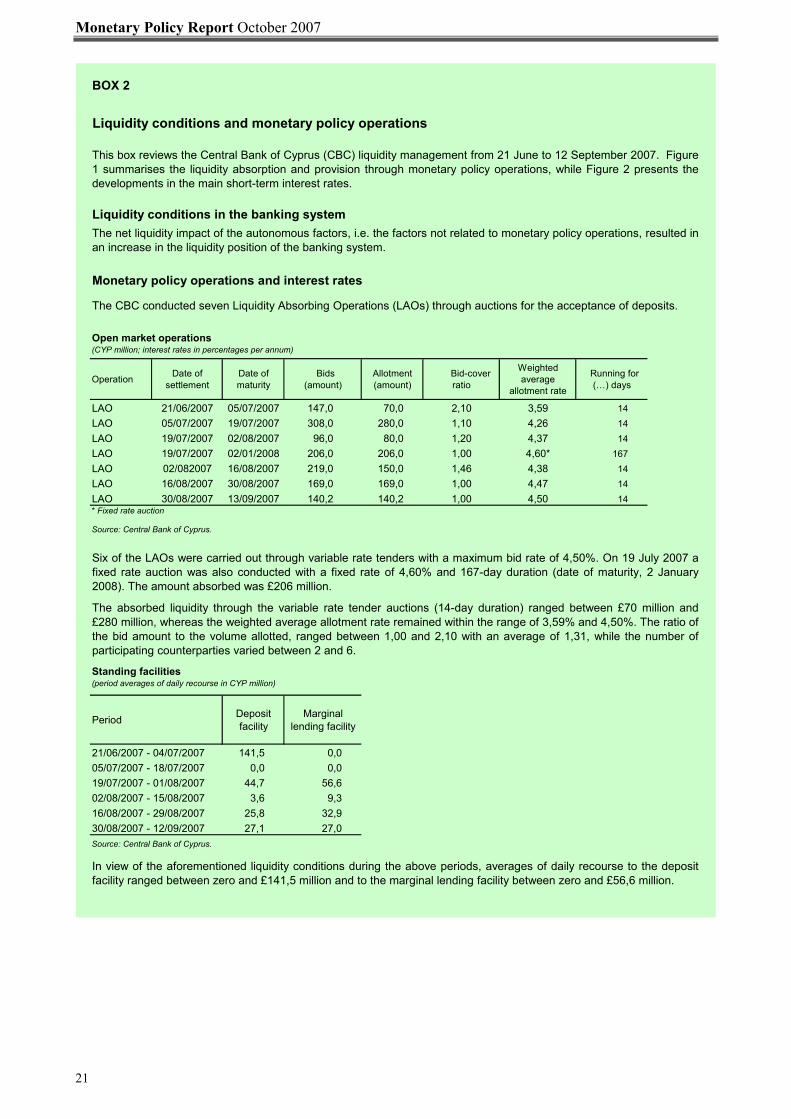
This box reviews the Central Bank of Cyprus (CBC) liquidity management from 21 June to 12 September 2007. Figure1 summarises the liquidity absorption and provision through monetary policy operations, while Figure 2 presents thedevelopments in the main short-term interest rates.
Liquidity conditions in the banking systemThe net liquidity impact of the autonomous factors, i.e. the factors not related to monetary policy operations, resulted inan increase in the liquidity position of the banking system.
Monetary policy operations and interest rates
The CBC conducted seven Liquidity Absorbing Operations (LAOs) through auctions for the acceptance of deposits.
Six of the LAOs were carried out through variable rate tenders with a maximum bid rate of 4,50%. On 19 July 2007 afixed rate auction was also conducted with a fixed rate of 4,60% and 167-day duration (date of maturity, 2 January2008). The amount absorbed was £206 million.
21/06/2007 - 04/07/2007
The absorbed liquidity through the variable rate tender auctions (14-day duration) ranged between £70 million and£280 million, whereas the weighted average allotment rate remained within the range of 3,59% and 4,50%. The ratio ofthe bid amount to the volume allotted, ranged between 1,00 and 2,10 with an average of 1,31, while the number ofparticipating counterparties varied between 2 and 6.
30/08/2007 - 12/09/2007
05/07/2007 - 18/07/2007
In view of the aforementioned liquidity conditions during the above periods, averages of daily recourse to the depositfacility ranged between zero and £141,5 million and to the marginal lending facility between zero and £56,6 million.
19/07/2007 - 01/08/200702/08/2007 - 15/08/200716/08/2007 - 29/08/2007

Central Bank of Cyprus
22
Overnight interbank interest rate(percent per annum)
Period Minimum rate
Maximum rate
Average rate
3,97 4,38 4,104,16 4,29 4,224,31 4,45 4,374,39 4,47 4,444,49 4,54 4,534,53 4,59 4,56
Source: Central Bank of Cyprus.
During the period under review the overnight interbank interest rate ranged between 3,97% and 4,59%. The averagerate stood at around 4,37%.
21/06/2007 - 04/07/200705/07/2007 - 18/07/200719/07/2007 - 01/08/200702/08/2007 - 15/08/200716/08/2007 - 29/08/200730/08/2007 - 12/09/2007
Figure 1. Monetary policy operations
0,0
50,0
100,0
150,0
200,0
250,0
300,0
21/06/2007 -04/07/2007
05/07/2007 -18/07/2007
19/07/2007 -01/08/2007
19/07/2007 -01/01/2008
02/08/2007 -15/08/2007
16/08/2007 -29/08/2007
30/08/2007 -12/09/2007
CYP
mill
ion
Liquidity absorbing operations through variable rate auctions (amount alloted)
Liquidity absorbing operation through fixed rate auction (amount alloted)
Deposit facility (daily average recourse)
Marginal lending facitly (daily average recourse)
Figure 2. Interest rates
2,00
2,25
2,50
2,75
3,00
3,25
3,50
3,75
4,00
4,25
4,50
4,75
5,00
5,25
5,50
5,75
6,00
21/06
/2007
27/06
/2007
02/07
/2007
06/07
/2007
12/07
/2007
18/07
/2007
24/07
/2007
30/07
/2007
03/08
/2007
09/08
/2007
16/08
/2007
22/08
/2007
28/08
/2007
01/09
/2007
06/09
/2007
12/09
/2007
% p
er a
nnum
Overnight InterbankMarginal lending facilityDeposit facilityLiquidity absorbing operations' weighted average allotmentLiquidity absorbing operations' maximum bidFixed rate (4,60%) at the liquidity absorbing operation dated 19/7/2007
International and domestic official interest
rates
As already mentioned, at their recent meetings
on 6 September 2007 the ECB and the Bank of
England left their official interest rates
unchanged at 4% and 5,75%, respectively. In
contrast, the Federal Reserve lowered its official
interest rate from 5,25% to 4,75% at its recent
meeting on 18 September 2007. This decision
was made due to concerns of inherent risks for
the economy’s growth, following the crisis in the
subprime loans market and the continuous
liquidity problems.
On the other hand, the CBC left its interest rates
unaltered at its meeting on 10 September 2007
(Table 11, p. 24). More specifically, the
minimum bid rate on the main refinancing
operations remained at 4,5%, while the marginal
lending facility and the overnight deposit facility
rates remained at 5% and 3%, respectively.
Monetary Policy Report October 2007
23
Table 10 Inflation and interest rates in Europe and Cyprus – August 2007 (latest 12-month average)
Inflation ( HICP) Long-term interest rates Long-term real interest rates
(%) (%) (%)
Austria 1,70 4,12 2,42Belgium 1,70 4,14 2,44Czech Republic 2,00 4,03 2,03Denmark 1,50 4,11 2,61Estonia(1) 5,10 4,92 -0,18Finland 1,30 4,12 2,82France 1,30 4,12 2,82Germany 1,70 4,07 2,37Greece 2,90 4,34 1,44Hungary 7,70 6,90 -0,80Ireland 2,60 4,10 1,50Italy 1,90 4,32 2,42Latvia 7,70 5,14 -2,56Lithuania 4,60 4,39 -0,21Luxembourg(1) 2,10 4,21 2,11Malta 0,50 4,56 4,06Netherlands 1,60 4,11 2,51Poland 1,90 5,35 3,45Portugal 2,50 4,25 1,75Slovakia 2,40 4,42 2,02Slovenia 2,90 4,34 1,44Spain 2,50 4,12 1,62Sweden 1,40 3,97 2,57United Kingdom(1) 2,60 4,87 2,27
Eurozone 1,80 4,15 2,35EU -25 2,00 4,45 2,45
Cyprus 1,70 4,38 2,68
Source: Eurostat.(1) Data for July 2007.

Central Bank of Cyprus
24
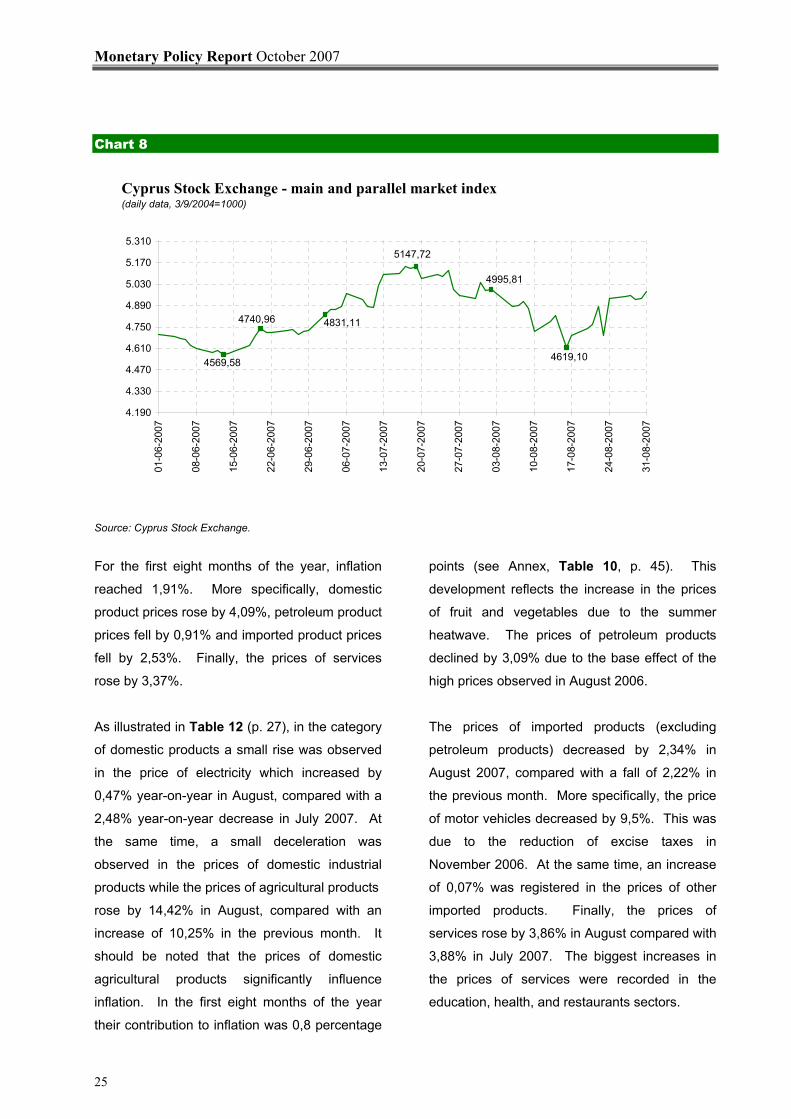
Cyprus Stock Exchange (CSE)
After the fall in the first three weeks of August, the
main and parallel market index of the CSE
increased towards the end of the month. The
banking sector accounted for a predominant
share in stocks purchased, partly as a result of
banks’ positive financial results.
More specifically, the financial results for the first
six months of the year have shown that the
banks’ performance was well above analysts
expectations as far as operational goals,
performance and expansion abroad are
concerned.
In August 2007 the aforementioned index
fluctuated between 4.619,1 and 4.995,8 (Chart 8, p. 25), reaching a monthly average of 4.862,7.
During the first eight months of the year, the
average value of the index was 4.533,5. The
average daily value of transactions decreased to
£8,6 million in August, compared with £13,5
million in July. At the same time, the average
daily volume of transactions decreased to 2.916
in August compared with 4.598 in the previous
month. The companies with the largest volume of
transactions were Hellenic Bank Plc and Marfin
Popular Bank Public Company Ltd, accounting for
19,4% and 18,8% of the total volume,
respectively.
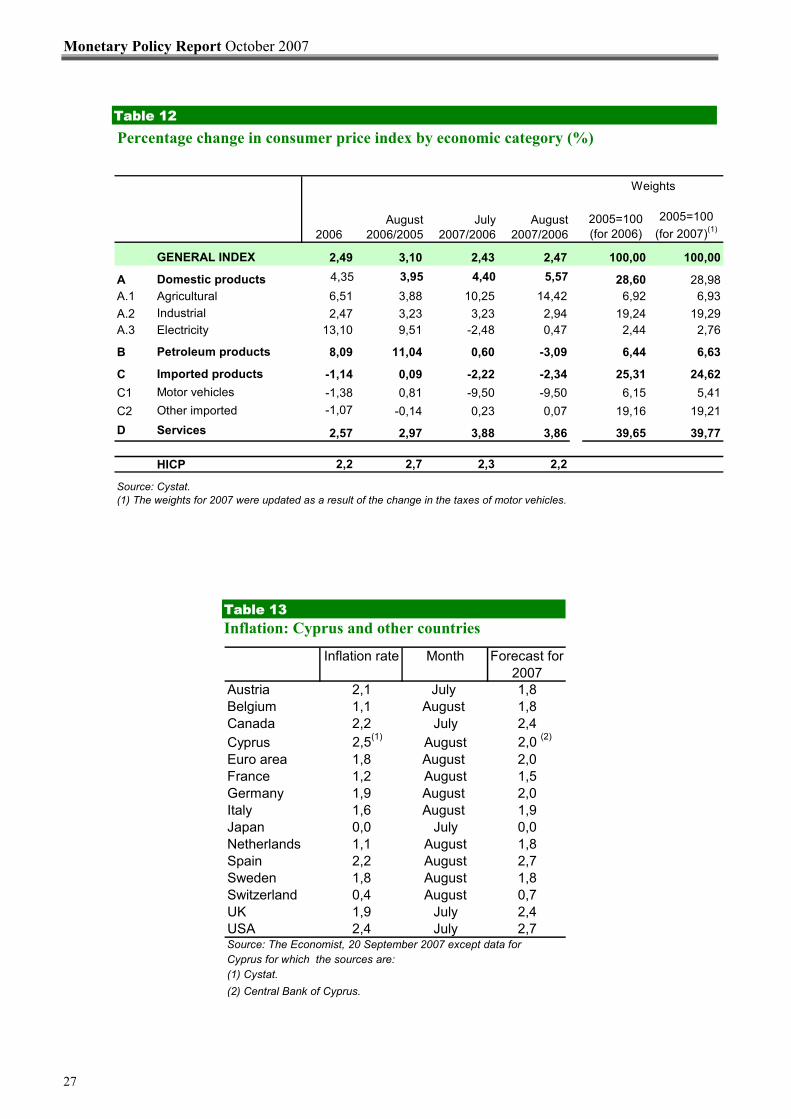
2.3 INFLATION
In August 2007 the consumer price index
exhibited a marginal acceleration registering an
increase of 2,47%, compared with 2,43% in the
previous month. As Table 12 (p. 27) shows, the
increase in the rate of inflation in August
(compared with July) largely reflects the
acceleration in the price of agricultural products,
as well as the small increase, compared with a
fall in the previous month, of the price of
electricity.
Table 11 Selected official interest rates (percent per annum, changes in percentage points)
change
European Central Bank (6 September 2007)Minimum bid rate on the main refinancing operations 4,00 -Interest rate on the marginal lending facility 5,00 -Interest rate on the deposit facility 3,00 -
Bank of England (6 September 2007)Rate paid on commercial bank reserves 5,75 -
Federal Reserve (18 September 2007)Federal funds rate 4,75 -0,50Discount rate 5,25 -0,50
Central Bank of Cyprus (10 September 2007)Minimum bid rate on the main refinancing operations 4,50 -Maximum bid rate on the liquidity absorbing operations 4,50 -Interest rate on the marginal lending facility 5,00 -Interest rate on the deposit facility 3,00 -
Sources: European Central Bank, Bank of England, Federal Reserve and Central Bank of Cyprus.
Monetary Policy Report October 2007
25
Chart 8
Cyprus Stock Exchange - main and parallel market index(daily data, 3/9/2004=1000)
4569,58
4740,96 4831,11
5147,72
4619,10
4995,81
4.190
4.330
4.470
4.610
4.750
4.890
5.030
5.170
5.310
01-0
6-20
07
08-0
6-20
07
15-0
6-20
07
22-0
6-20
07
29-0
6-20
07
06-0
7-20
07
13-0
7-20
07
20-0
7-20
07
27-0
7-20
07
03-0
8-20
07
10-0
8-20
07
17-0
8-20
07
24-0
8-20
07
31-0
8-20
07
Source: Cyprus Stock Exchange.
For the first eight months of the year, inflation
reached 1,91%. More specifically, domestic
product prices rose by 4,09%, petroleum product
prices fell by 0,91% and imported product prices
fell by 2,53%. Finally, the prices of services
rose by 3,37%.
As illustrated in Table 12 (p. 27), in the category
of domestic products a small rise was observed
in the price of electricity which increased by
0,47% year-on-year in August, compared with a
2,48% year-on-year decrease in July 2007. At
the same time, a small deceleration was
observed in the prices of domestic industrial
products while the prices of agricultural products
rose by 14,42% in August, compared with an
increase of 10,25% in the previous month. It
should be noted that the prices of domestic
agricultural products significantly influence
inflation. In the first eight months of the year
their contribution to inflation was 0,8 percentage
points (see Annex, Table 10, p. 45). This
development reflects the increase in the prices
of fruit and vegetables due to the summer
heatwave. The prices of petroleum products
declined by 3,09% due to the base effect of the
high prices observed in August 2006.
The prices of imported products (excluding
petroleum products) decreased by 2,34% in
August 2007, compared with a fall of 2,22% in
the previous month. More specifically, the price
of motor vehicles decreased by 9,5%. This was
due to the reduction of excise taxes in
November 2006. At the same time, an increase
of 0,07% was registered in the prices of other
imported products. Finally, the prices of
services rose by 3,86% in August compared with
3,88% in July 2007. The biggest increases in
the prices of services were recorded in the
education, health, and restaurants sectors.

Central Bank of Cyprus
26
The Harmonised Index of Consumer Prices
(HICP) recorded an increase of 2,2% in August
compared with 2,3% in July. It should be noted
that until August 2007, the 12 month moving
average of HICP remained at 1,7%.
For purposes of comparison, Table 13 (p. 27)
shows the latest available monthly figures for
inflation in Cyprus, the euro area and other
developed economies as well as forecasts during
2007. As explained in more detail on page 36,
inflation in Cyprus for 2007 is expected to register
a deceleration compared with last year due to the
reduction in excise duties on cars and the
stabilisation in the price of oil. The deceleration
in inflation could have been stronger had there
been no significant acceleration in the prices of
agricultural products.
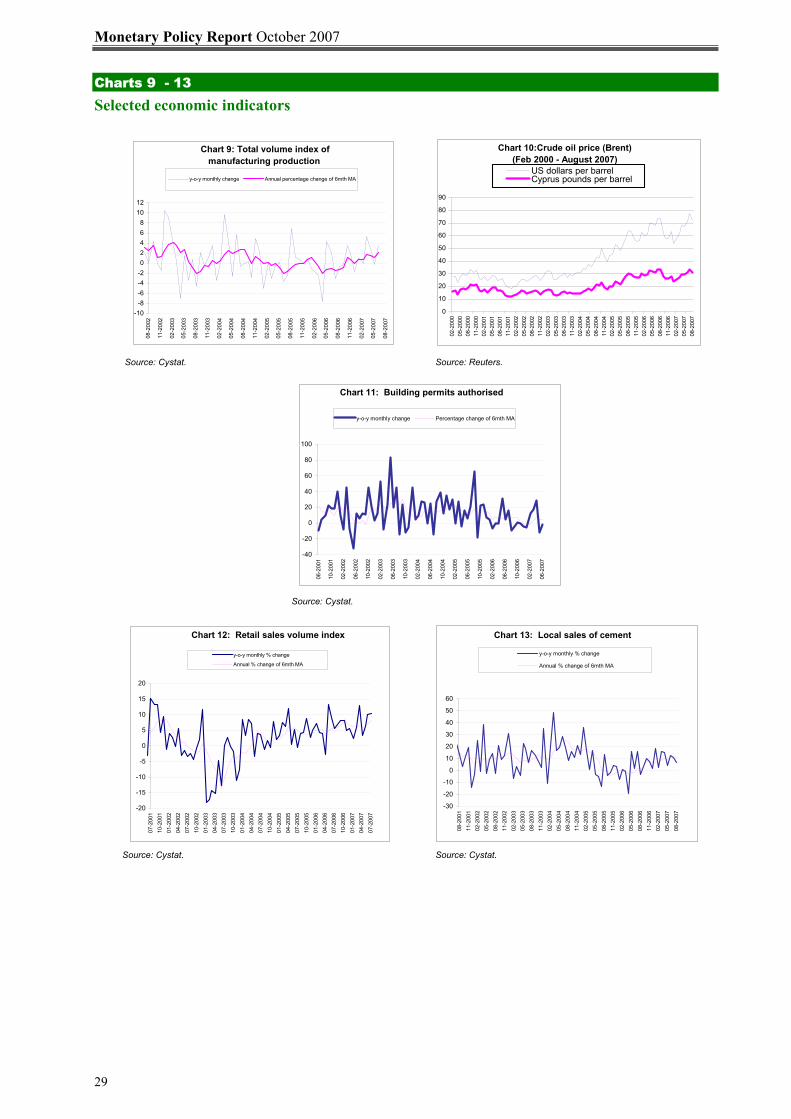
2.4 PRODUCTION, DEMAND AND THE LABOUR MARKET Production
In the first half of 2007, real GDP grew by 3,8%
compared with 4% in the first half of 2006. In the
services sector, there was an increase of 0,1% in
tourist arrivals in the first eight months of 2007,
compared with a decrease of 2,4% in the same
period of 2006. In the first half of 2007 tourist
revenue increased by 2,3% compared with an
increase of 3,9% in the same period of 2006.
In the secondary sectors of the economy,
manufacturing exhibited an increase of 3,2% in
the first seven months of 2007 compared with a
decrease of 1,5% in the same period of 2006
(Table 14, p. 28 and Chart 9 p. 29). In the
construction sector, the volume of building
permits rose by 5,3% in the first half of 2007
compared with a rise of 5,6% in the same period
of 2006. In the first eight months of 2007, sales
of cement increased by 11% compared with a
rise of 0,6% in the corresponding period of 2006.
Monetary Policy Report October 2007
27
Table 12 Percentage change in consumer price index by economic category (%)
2005=100 (for 2006)
2005=100 (for 2007)(1)
GENERAL INDEX 2,49 3,10 2,43 2,47 100,00 100,00
A Domestic products 4,35 3,95 4,40 5,57 28,60 28,98A.1 Agricultural 6,51 3,88 10,25 14,42 6,92 6,93A.2 Industrial 2,47 3,23 3,23 2,94 19,24 19,29A.3 Electricity 13,10 9,51 -2,48 0,47 2,44 2,76
B Petroleum products 8,09 11,04 0,60 -3,09 6,44 6,63
C Imported products -1,14 0,09 -2,22 -2,34 25,31 24,62C1 Motor vehicles -1,38 0,81 -9,50 -9,50 6,15 5,41C2 Other imported -1,07 -0,14 0,23 0,07 19,16 19,21D Services 2,57 2,97 3,88 3,86 39,65 39,77
HICP 2,2 2,7 2,3 2,2
Source: Cystat.(1) The weights for 2007 were updated as a result of the change in the taxes of motor vehicles.
Weights
August 2006/2005
July 2007/2006
August 2007/20062006
Table 13 Inflation: Cyprus and other countries
Inflation rate Month Forecast for 2007
Austria 2,1 July 1,8Belgium 1,1 August 1,8Canada 2,2 July 2,4Cyprus 2,5(1) August 2,0 (2)
Euro area 1,8 August 2,0France 1,2 August 1,5Germany 1,9 August 2,0Italy 1,6 August 1,9Japan 0,0 July 0,0Netherlands 1,1 August 1,8Spain 2,2 August 2,7Sweden 1,8 August 1,8Switzerland 0,4 August 0,7UK 1,9 July 2,4USA 2,4 July 2,7Source: The Economist, 20 September 2007 except data forCyprus for which the sources are: (1) Cystat.(2) Central Bank of Cyprus.

Central Bank of Cyprus
28
Table 14
Manufacturing production volume index (percentage change by category)
July 06/05
July 07/06
Jan.-July 06/05
Jan .- July 07/06
General index -1,6 6,6 -1,5 3,2Food products, beverages & tobacco -6,6 5,8 -9,8 1,9Textiles & textile products -23,6 2,7 -26,3 3,3Leather & leather products -21,7 -22,6 -22,2 -5,1Wood & wood products -10,4 -7,6 0,5 -2,0Paper, paper products, publishing & printing 4,4 3,2 4,7 -0,2Refined petroleum products 3,4 10,0 6,0 -20,6Chemicals, chemical products & man-made fibres 5,8 16,3 4,8 9,7Rubber & plastic products 2,8 11,9 2,2 5,5Other non-metallic mineral products 5,2 12,2 1,8 6,2Basic metals & fabricated metal products 10,6 5,6 6,9 4,0Machinery & equipment n.e.c. -0,3 0,2 4,0 0,7Electrical & optical equipment 30,5 20,3 24,9 10,0Transport equipment 12,5 6,4 20,6 3,7Manufacturing n.e.c. -10,4 8,1 2,2 2,1Source: Cystat.
Monetary Policy Report October 2007
29
Charts 9 - 13 Selected economic indicators
Source: Cystat. Source: Reuters.
Source: Cystat.
Source: Cystat. Source: Cystat.
US$/barrel
CYP/barrel
Chart 9: Total volume index of manufacturing production
-10-8-6-4-202468
1012
08-2
002
1 1-2
0 02
0 2- 2
0 03
0 5-2
0 03
0 8- 2
0 03
1 1-2
0 03
0 2- 2
0 04
05- 2
0 04
0 8-2
004
11- 2
0 04
0 2-2
005
05- 2
0 05
0 8-2
005
11- 2
0 05
0 2- 2
0 06
0 5-2
0 06
0 8- 2
0 06
1 1-2
0 06
0 2- 2
0 07
0 5-2
0 07
08-2
0 07
y-o-y monthly change Annual percentage change of 6mth MA
Chart 10:Crude oil price (Brent) (Feb 2000 - August 2007)
0
10
20
30
40
50
60
70
80
90
02-2
000
05-2
000
08-2
000
11-2
000
02-2
001
05-2
001
08-2
001
11-2
001
02-2
002
05-2
002
08-2
002
11-2
002
02-2
003
05-2
003
08-2
003
11-2
003
02-2
004
05-2
004
08-2
004
11-2
004
02-2
005
05-2
005
08-2
005
1
1-20
05
02-
2006
0
5-20
06
08-
2006
1
1-20
06
02-
2007
0
5-20
0708
-200
7
US dollars per barrelCyprus pounds per barrel
Chart 11: Building permits authorised
-40
-20
0
20
40
60
80
100
06-2
001
10-2
001
02-2
002
06-2
002
10-2
002
02-2
003
06-2
003
10-2
003
02-2
004
06-2
004
10-2
004
02-2
005
06-2
005
10-2
005
02-2
006
06-2
006
10-2
006
02-2
007
06-2
007
y-o-y monthly change Percentage change of 6mth MA
Chart 12: Retail sales volume index
-20
-15
-10
-5
0
5
10
15
20
07-2
001
10-2
001
01-2
002
04-2
002
07-2
002
10-2
002
01-2
003
04-2
003
07-2
003
10-2
003
01-2
004
04-2
004
07-2
004
10-2
004
01-2
005
04-2
005
07-2
005
10-2
005
01-2
006
04-2
006
07-2
006
10-2
006
01-2
007
04-2
007
07-2
007
y-o-y monthly % change
Annual % change of 6mth MA
Chart 13: Local sales of cement
-30
-20
-10
0
10
20
30
40
50
60
08-2
001
11-2
001
02-2
002
05-2
002
08-2
002
11-2
002
02-2
003
05-2
003
08-2
003
11-2
003
02-2
004
05-2
004
08-2
004
11-2
004
02-2
005
05-2
005
08-2
005
11-2
005
02-2
006
05-2
006
08-2
006
11-2
006
02-2
007
05-2
007
08-2
007
y-o-y monthly % change
Annual % change of 6mth MA

Central Bank of Cyprus
30
Charts 14 -15 Selected economic indicators
Source: Cystat. Source: Cystat.
Chart 14: Registration of motor vehicles (private saloon)
-100
-50
0
50
100
150
200
05-2
002
08-2
002
11-2
002
02-2
003
05-2
003
08-2
003
11-2
003
02-2
004
05-2
004
08-2
004
11-2
004
02-2
005
05-2
005
08-2
005
11-2
005
02-2
006
05-2
006
08-2
006
11-2
006
02-2
007
05-2
007
08-2
007
% c
hang
e of
mov
ing
aver
age
y‐o‐y % monthly changeAnnual percentage change of 6mth MA
Chart 15: Unemployment
0
1
2
3
4
5
6
05-2
002
08-2
002
11-2
002
02-2
003
05-2
003
08-2
003
11-2
003
02-2
004
05-2
004
08-2
004
11-2
004
02-2
005
05-2
005
08-2
005
11-2
005
02-2
006
05-2
006
08-2
006
11-2
006
02-2
007
05-2
007
08-2
007
Une
mpl
oym
ent r
ate
(%)
Non seasonally adjusted Seasonally adjusted
Consumption
The turnover volume of retail trade from which
the sales of motor vehicles are excluded,
exhibited a rise of 7,6% in the first seven
months of 2007 compared with a 5,7% increase
in the same period of 2006. In July this index
rose by 10,4% compared with a rise of 5,6% in
the same period of 2006. Due to the reduction
in excise taxes in November 2006, car
registrations exhibited an increase of 36,8% in
the first eight months of 2007.
Labour market The most recent data on unemployment in the
Labour Force Survey cover the first quarter of
2007. According to the survey, unemployment
was recorded at 4,8% in the first quarter of 2007
compared with 5,9% in the first quarter of 2006.
Employment increased to 369.000 in the first
quarter of 2007 compared with 351.000 and
344.000 in the first quarter of 2006 and 2005
respectively.
The most recent data for the number of
registered unemployed are those of August
2007. These show that the number of
registered unemployed fell by 8,3%, while
unemployment as a percentage of the
economically active population fluctuated at
around 3,1% compared with 3,4% in August
2006.
For the first eight months of 2007, the number of
registered unemployed fell by 5,7% compared
with a decrease of 2,4% in the same period of
2006. Unemployment as a percentage of the
economically active population fluctuated at
around 3,3%, compared with 3,5% in the
corresponding period of the previous year. The
data indicate that the reduction in registered
unemployment during the first five months of
2007 is due to the increase of the economically
active population and the decrease of the
number of unemployed, compared with the
respective period of 2006.
Monetary Policy Report October 2007
31
Table 15
Turnover volume index of retail trade (percentage change by category)
July 06/05
July 07/06(1)
Jan.-July 06/05
Jan.-July 07/06
General index 5,6 10,4 5,7 7,6Retail sale in non-specialised stores with food, beverages or tobacco predominating 7,7 4,3 7,2 5,5Other retail sale in non-specialised stores -0,2 6,7 1,3 5,1Retail sale of food, beverages and tobacco in specialised stores 9,3 -11,6 4,4 -4,9Retail sale of pharmaceutical and medical goods, cosmetics and toilet articles 12,8 31,5 14,3 14,9Retail sale of textiles, clothing, footwear and leather goods 10,9 7,5 5,9 9,3Retail sale of furniture, lighting equipment and household articles, electrical household appliances and radio and television goods hardware, paints and glass 5,2 14,6 9,5 10,3Retail sale of books, newspapers and stationery and other retail sale in specialised stores 0,9 21,4 0,1 11,6Retail sale of second-hand goods in stores -31,9 -4,0 80,7 -37,2Retail sale not in stores 5,4 12,2 4,4 7,4
Source: Cystat.
(1) Provisional data.
Confidence indicators
The trends in the confidence indicators5 are, to
a certain extent, consistent with the overall
picture of the economy as presented in this
report. In the first eight months of 2007, the
construction confidence indicator exhibited
fluctuations.
Fluctuations were also observed in the services
confidence indicators, while the consumer
confidence indicator remained negative6.
During the same period, the retail sales
confidence indicator and the industrial
confidence indicator exhibited fluctuations
during the period January – August 2007.
5. The European Commission publishes monthly confidence indicators for consumer, industry, construction and retail trade in the EU member states, and in accession countries. The released data refer to the end of each month and are based on surveys conducted by the national statistics institutions and harmonised by the European Commission. 6 . It should be noted that although the consumer confidence indicator has been negative for several years, it is not consistent with observed consumer spending which has been increasing.
2.5 PUBLIC FINANCES The most recent developments relating to
public finances are reflected in the published
preliminary data for the first six months period
of 2007. According to Cystat data (Table 15 in
Annex, p. 50) a surplus of £83,2 million or 0,9%
of GDP was recorded compared with a deficit of
£60,9 million or 0,7% of GDP in the
corresponding 2006 period. This positive
outcome is the result of the difference between
total public revenue of £1.834,6 million (an
increase of 17,8%) and total public expenditure
of £1.751,2 million (an increase of 8,2%).

Central Bank of Cyprus
32
More analytically from the public revenue side,
the unexpected significant acceleration is mainly
due to the enhanced tax receipts. Specifically,
current taxes on income, wealth, etc., increased
by 35,3%. These include receipts from
corporation taxes (an increase of 61,4%) due to
the increasing profitability of the former
international business companies, as well as to
the receipts from capital gains taxes (an
increase of 173,3%) as a result of the
continuous boom in the property and
construction sectors. Apart from the increase in
revenue referred to above, increases were also
recorded in the indirect taxation categories,
mainly in the taxes on production and imports by
16,6%. Of these, VAT receipts were positively
influenced by the satisfactory GDP rate of
growth, which is partly reflected by increased
private consumption. Furthermore, VAT receipts
increased as a result of the continuing enhanced
collecting ability of the relevant government
department. As regards non-taxation receipts, it
is noted that during the first six months of 2008
inflows of £7,5 million, £6,4 million and £7,4
million were effected from the Electricity
Authority, airport management fees, and the
CBC’s profits, respectively.
On the public expenditure side, a smaller
increase has been observed. Increases in
social benefit and other current transfers of 14%
and 55% are noted. Current transfers include
the following sub-categories: pensions and
gratuities (a 16,2% rise due to the gradual
extension of the retirement age), educational
grants (a 34,8% rise due to training subsidies),
semi-governmental organisation grants (a 57,7%
rise due to the CTO and Cyprus University
grants) and Cyprus’s contribution towards the
EU Budget, which increased by 19,3%. In
contrast, reductions were recorded in defence
and capital expenditures. Wages and salaries
registered a small increase of 3,4%, reflecting
the 1,2% COLA increase and the 1% pre-agreed
contractual salary increase in 2007.
Public debt was contained at 61,9% of GDP
during the first six months of 2007 compared
with 66,4% in the corresponding 2006 period.
2.6 EXTERNAL TRANSACTIONS Goods An overview of the trade balance for the first
seven months of 2007 is given in Table 16 (p. 35) which is based on preliminary data
published by Cystat. Since May 2004, the
collection of data on intra EU-trade has been
undertaken using a methodology introduced by
Eurostat for all EU countries.
During the period January-July 2007, the value
of total imports of goods recorded an increase of
8,2% compared with an increase of 16,6% in the
same period of 2006. A substantial increase
was observed in the imports of vehicles, due to
the reduction of the consumption tax at the end
of 2006.
The value of total exports of goods recorded a
2,7% decrease in the first seven months of
2007, compared with a 4,8% increase in the
same period in 2006. The fall in the export of
goods is due to the reduction of re-exports.
According to data for the first half of 2007, re-
exports decreased by 14,5% while exports of
domestically produced goods increased by
15,7%.
As a result of the above, the trade balance
registered further deterioration reaching a deficit
of £1.646,4 million during the first seven months
of 2007, compared with a deficit of £1.481,1
million in the corresponding period of 2006.

Monetary Policy Report October 2007
33
Tourism Tourist arrivals, shown in Table 17 (p. 36)
increased by 0,1% in the period January –
August 2007 compared with a 2,4% decrease in
the corresponding period of 2006. There was a
substantial 8,1% increase in tourist arrivals in
August 2007 compared with a decrease of 6,5%
in August 2006.
Revenue from tourism increased by 2,3% in the
first six months of 2007 compared with a 3,9%
increase in the corresponding month of 2006.
Expenditure per head for the first half of 2007
increased by 5,9% compared with a 6,1%
increase in the corresponding period of 2006.
Balance of payments
Table 14 in the Annex (p. 49) presents
preliminary data on the balance of payments for
the first half of 2007. The data reveals a
worsening of the current account deficit
compared with the first half of 2006.
The current account deficit in the first half of
2007 was £331,9 million compared with £148,5
million in the same period of 2006. The
deterioration of the current account is mainly the
result of the worsening of the trade deficit.
Specifically, imported goods (fob) recorded an
increase of 8,2% in the first half of 2007 and
exports decreased by 2,9% during the same
period because of the decrease in re-exports. A
significant part of the deterioration of the trade
deficit is due to the large increase in car imports.
The surplus recorded by services reached
£874,3 million in the first half of 2007 compared
with £886,5 million in the same period in 2006.
The main changes in the services account were
the improvement of financial services and a
decrease in the other business services. The
services surplus, excluding tourism, registered
an improvement of £8,1 million in the first half of
2007 compared with 2006.
As far as the income account is concerned, a
net deficit of £10,8 million was recorded in the
first half of 2007 compared with a surplus of
£27,8 million in the first quarter of 2006.
Current transfers during the first half of 2007
were recorded at similar levels to the respective
half of 2006. In particular, a surplus of £62,2
million was recorded in the first half of 2007
compared with a £64,2 million surplus in the
corresponding period of 2006.
2.7 PROSPECTS FOR 2007
Real GDP is expected to display a marginal
acceleration in 2007 compared with 2006. More
specifically, the growth of private consumption is
expected to fluctuate around the 2006 level
while gross capital formation and imports are
expected to decelerate. As a result of the
positive economic environment in the EU,
exports are expected to increase.
The above developments, combined with an
expected slowdown of the inflow of foreign
workers in Cyprus, are expected to lead to a
decrease in the unemployment rate, a prospect
that is supported by current data.
As far as public finances are concerned, the
overall situation appears satisfactory.
Developments fall within the parameters
specified within the context of both the
Convergence Programme 2006-10 and the
March 2007 “EDP Notifications” which projected
a deficit of 1,4% of GDP for the year 2007.

Central Bank of Cyprus
34
However, it should be borne in mind that the
increased tax receipts are mainly due to the
rapid expansion of the construction and property
sectors, which is likely to be temporary.
Although there are no grounds for doubting the
2007 fiscal outcome, it should be emphasized
that any relaxation from the initial targets may
easily lead to fiscal deterioration over the
medium term.
Despite the historically high prices of agricultural
products, inflation in 2007 is expected to
decelerate and hover at around 2% due to the
reduction in motor vehicle excises in November
2006 and the expected deceleration in oil prices.
The continuing high price of oil is expected to
negatively influence the current account
balance, even though its effect is expected to be
mitigated by the weakening of the dollar relative
to the Cyprus pound. At the same time,
increased demand continues to negatively affect
the current account balance, which renders
possible a further increase of the deficit in 2007.
Finally, a continuing source of concern is the
high growth rate of monetary aggregates.
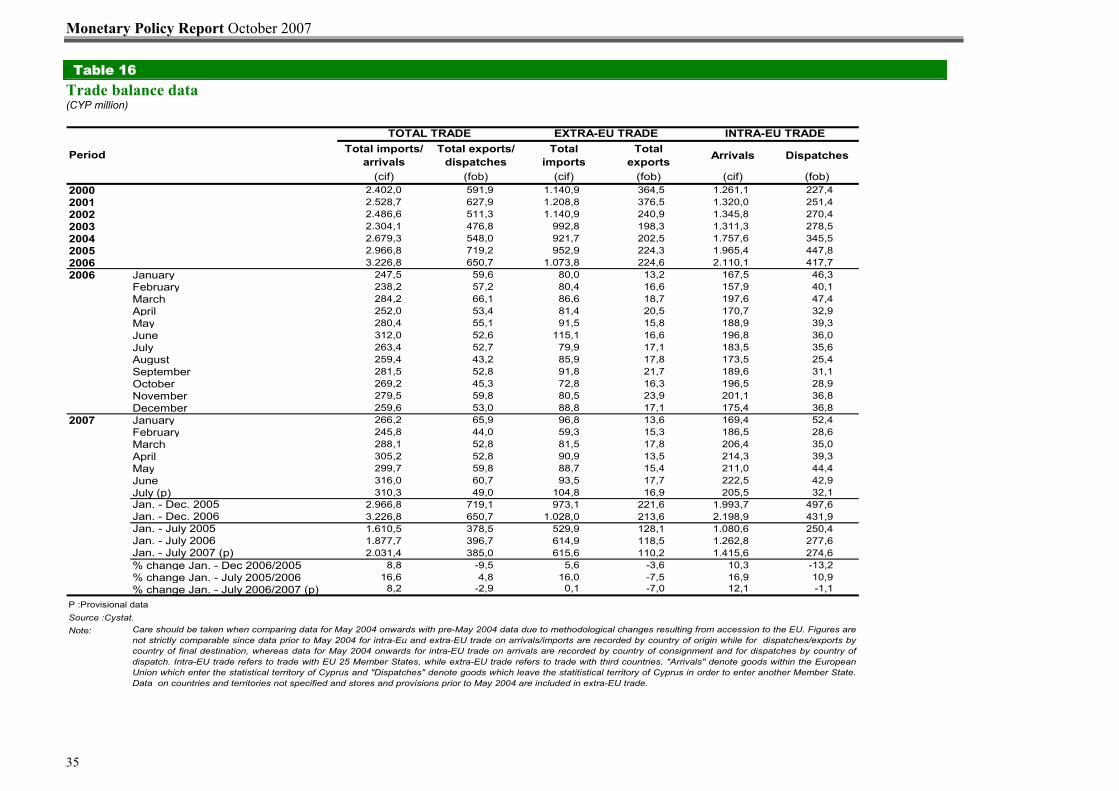
Monetary Policy Report October 2007
35
Table 16 Trade balance data (CYP million)
2000 2.402,0 591,9 1.140,9 364,5 1.261,1 227,42001 2.528,7 627,9 1.208,8 376,5 1.320,0 251,42002 2.486,6 511,3 1.140,9 240,9 1.345,8 270,42003 2.304,1 476,8 992,8 198,3 1.311,3 278,52004 2.679,3 548,0 921,7 202,5 1.757,6 345,52005 2.966,8 719,2 952,9 224,3 1.965,4 447,82006 3.226,8 650,7 1.073,8 224,6 2.110,1 417,72006 January 247,5 59,6 80,0 13,2 167,5 46,3
February 238,2 57,2 80,4 16,6 157,9 40,1March 284,2 66,1 86,6 18,7 197,6 47,4April 252,0 53,4 81,4 20,5 170,7 32,9May 280,4 55,1 91,5 15,8 188,9 39,3June 312,0 52,6 115,1 16,6 196,8 36,0July 263,4 52,7 79,9 17,1 183,5 35,6August 259,4 43,2 85,9 17,8 173,5 25,4September 281,5 52,8 91,8 21,7 189,6 31,1October 269,2 45,3 72,8 16,3 196,5 28,9November 279,5 59,8 80,5 23,9 201,1 36,8December 259,6 53,0 88,8 17,1 175,4 36,8
2007 January 266,2 65,9 96,8 13,6 169,4 52,4February 245,8 44,0 59,3 15,3 186,5 28,6March 288,1 52,8 81,5 17,8 206,4 35,0April 305,2 52,8 90,9 13,5 214,3 39,3May 299,7 59,8 88,7 15,4 211,0 44,4June 316,0 60,7 93,5 17,7 222,5 42,9July (p) 310,3 49,0 104,8 16,9 205,5 32,1Jan. - Dec. 2005 2.966,8 719,1 973,1 221,6 1.993,7 497,6Jan. - Dec. 2006 3.226,8 650,7 1.028,0 213,6 2.198,9 431,9Jan. - July 2005 1.610,5 378,5 529,9 128,1 1.080,6 250,4Jan. - July 2006 1.877,7 396,7 614,9 118,5 1.262,8 277,6Jan. - July 2007 (p) 2.031,4 385,0 615,6 110,2 1.415,6 274,6% change Jan. - Dec 2006/2005 8,8 -9,5 5,6 -3,6 10,3 -13,2% change Jan. - July 2005/2006 16,6 4,8 16,0 -7,5 16,9 10,9% change Jan. - July 2006/2007 (p) 8,2 -2,9 0,1 -7,0 12,1 -1,1
P :Provisional data Source :Cystat.Note:
Arrivals
(cif)
Dispatches
(fob)
Total imports
(cif)
Total exports
(fob)
Care should be taken when comparing data for May 2004 onwards with pre-May 2004 data due to methodological changes resulting from accession to the EU. Figures arenot strictly comparable since data prior to May 2004 for intra-Eu and extra-EU trade on arrivals/imports are recorded by country of origin while for dispatches/exports bycountry of final destination, whereas data for May 2004 onwards for intra-EU trade on arrivals are recorded by country of consignment and for dispatches by country ofdispatch. Intra-EU trade refers to trade with EU 25 Member States, while extra-EU trade refers to trade with third countries. "Arrivals" denote goods within the EuropeanUnion which enter the statistical territory of Cyprus and "Dispatches" denote goods which leave the statitistical territory of Cyprus in order to enter another Member State.Data on countries and territories not specified and stores and provisions prior to May 2004 are included in extra-EU trade.
TOTAL TRADE EXTRA-EU TRADE INTRA-EU TRADE
Period Total imports/ arrivals
(cif)
Total exports/ dispatches
(fob)

Central Bank of Cyprus
36
Table 17
Tourist arrivals(1)
(number of persons)
2000 2001 2002 2003 2004 2005 2006 2007January 63.553 64.214 54.067 59.529 56.504 58.894 54.875 51.848 -5,1 4,2 -6,8 -5,5February 87.243 83.569 71.950 77.972 75.705 72.600 66.151 63.098 -2,9 -4,1 -8,9 -4,6March 135.487 137.578 138.625 91.634 111.946 137.075 107.071 104.316 22,2 22,4 -21,9 -2,6April 221.785 237.228 180.481 169.891 191.251 183.561 206.548 189.310 12,6 -4,0 12,5 -8,3May 299.355 324.901 279.070 231.527 261.646 284.132 283.513 273.058 13,0 8,6 -0,2 -3,7June 302.011 322.835 293.192 262.100 264.799 282.652 280.164 282.465 1,0 6,7 -0,9 0,8July 362.299 373.385 327.404 318.143 305.978 338.972 341.443 352.423 -3,8 10,8 0,7 3,2August 356.686 371.536 301.724 325.390 305.926 336.587 314.872 340.534 -6,0 10,0 -6,5 8,1September 329.964 329.400 306.731 287.358 303.506 302.833 296.532 5,6 -0,2 -2,1October 300.597 269.744 275.840 271.980 278.976 292.273 283.046 2,6 4,8 -3,2November 133.500 107.454 111.327 123.800 114.048 104.822 95.682 -7,9 -8,1 -8,7December 93.722 74.887 77.822 83.919 78.723 75.656 71.022 -6,2 -3,9 -6,1Jan - August 1.828.419 1.915.246 1.646.513 1.536.186 1.573.755 1.694.473 1.654.637 1.657.052 2,4 7,7 -2,4 0,1Jan - Dec 2.686.202 2.696.731 2.418.233 2.303.243 2.349.008 2.470.057 2.400.919 2,0 5,2 -2,8
Source: Cystat.(1) Arrivals of same-day visitors are not included.
% change 2007/2006
% change 2006/2005
% change 2004/2003
% change 2005/2004
Table 18
Receipts from tourism(1) (CYP million)
% change % change % change % change2000 2001 2002 2003 2004 2005 2006 2007 2004/2003 2005/2004 2006/2005 2007/2006
January - 24,9 21,6 25,6 21,8 20,7 21,2 19,7 -15,0 -5,0 2,3 -7,1February - 29,1 28,9 31,4 25,4 23,5 23,1 22,6 -19,1 -7,5 -1,8 -2,2March - 49,7 59,1 37,8 42,1 47,6 38,9 40,1 11,1 13,2 -18,3 3,1April - 89,9 77,0 67,1 72,1 62,0 74,5 72,4 7,4 -14,0 20,1 -2,8May - 139,1 119,5 92,5 99,5 105,4 111,9 119,8 7,6 5,9 6,1 7,1June 122,9 157,4 139,3 114,8 109,3 113,3 117,7 121,4 -4,8 3,7 3,9 3,2July 162,7 192,0 160,7 152,4 135,1 140,1 155,0 -11,4 3,7 10,6August 173,7 205,0 153,8 165,3 148,1 161,3 155,0 -10,4 8,9 -3,9September 161,9 176,3 157,4 134,1 141,2 137,9 140,9 5,3 -2,3 2,2October 135,1 130,2 128,0 112,4 115,9 120,5 122,9 3,1 4,0 2,0November 54,1 48,8 51,4 48,7 43,1 43,1 37,6 -11,5 0,0 -12,8December 36,2 29,2 35,6 32,9 28,8 30,3 28,8 -12,4 5,2 -5,0Jan - June 490,1 445,4 369,3 370,1 372,5 387,1 395,9 0,2 0,6 3,9 2,3Jan - Dec 1.271,6 1.132,3 1.015,0 982,3 1.005,7 1.027,4 -3,2 2,4 2,2
Source: Cystat.(1) Receipts from same-day visitors are not included.

Monetary Policy Report October 2007
37
3. ANNEX
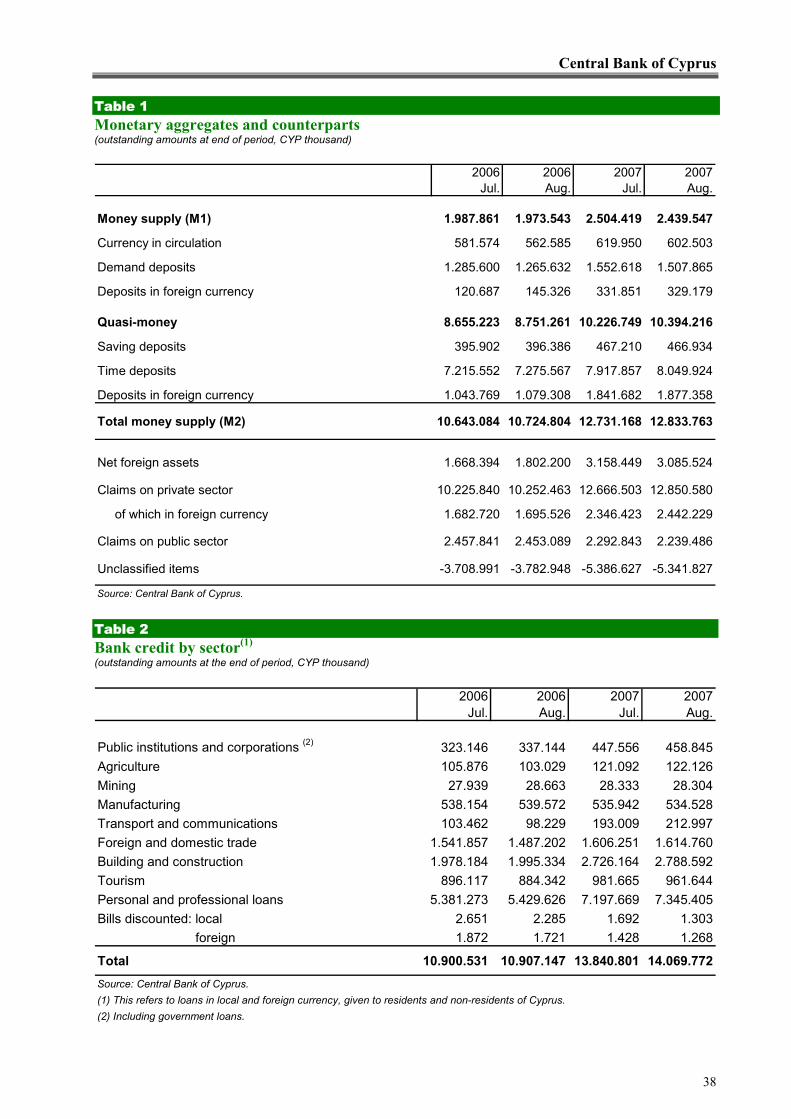
Central Bank of Cyprus
38
Table 1 Monetary aggregates and counterparts (outstanding amounts at end of period, CYP thousand)
2006 2006 2007 2007Jul. Aug. Jul. Aug.
Money supply (M1) 1.987.861 1.973.543 2.504.419 2.439.547
Currency in circulation 581.574 562.585 619.950 602.503
Demand deposits 1.285.600 1.265.632 1.552.618 1.507.865
Deposits in foreign currency 120.687 145.326 331.851 329.179
Quasi-money 8.655.223 8.751.261 10.226.749 10.394.216
Saving deposits 395.902 396.386 467.210 466.934
Time deposits 7.215.552 7.275.567 7.917.857 8.049.924
Deposits in foreign currency 1.043.769 1.079.308 1.841.682 1.877.358
Total money supply (M2) 10.643.084 10.724.804 12.731.168 12.833.763
Net foreign assets 1.668.394 1.802.200 3.158.449 3.085.524
Claims on private sector 10.225.840 10.252.463 12.666.503 12.850.580
of which in foreign currency 1.682.720 1.695.526 2.346.423 2.442.229
Claims on public sector 2.457.841 2.453.089 2.292.843 2.239.486
Unclassified items -3.708.991 -3.782.948 -5.386.627 -5.341.827
Source: Central Bank of Cyprus. Table 2 Bank credit by sector(1) (outstanding amounts at the end of period, CYP thousand)
2006 2006 2007 2007Jul. Aug. Jul. Aug.
Public institutions and corporations (2) 323.146 337.144 447.556 458.845Agriculture 105.876 103.029 121.092 122.126Mining 27.939 28.663 28.333 28.304Manufacturing 538.154 539.572 535.942 534.528Transport and communications 103.462 98.229 193.009 212.997Foreign and domestic trade 1.541.857 1.487.202 1.606.251 1.614.760Building and construction 1.978.184 1.995.334 2.726.164 2.788.592Tourism 896.117 884.342 981.665 961.644Personal and professional loans 5.381.273 5.429.626 7.197.669 7.345.405Bills discounted: local 2.651 2.285 1.692 1.303 foreign 1.872 1.721 1.428 1.268
Total 10.900.531 10.907.147 13.840.801 14.069.772Source: Central Bank of Cyprus.(1) This refers to loans in local and foreign currency, given to residents and non-residents of Cyprus.(2) Including government loans.

Monetary Policy Report October 2007
39
Table 3 Official interest rates (percent per annum)
Reverse repo operations
Acceptance of deposits
operations (1)
Maximum bid rate
Maximum bid rate
2001 10 Aug. 3,50 5,00 - 6,5018 Sep. 3,00 4,50 - 6,0002 Nov. 2,50 4,00 4,00 5,50
2002 13 Dec. 2,50 3,75 3,75 5,00
2003 04 Apr. 2,50 3,50 3,50 4,50
2004 30 Apr. 3,50 4,50 4,50 5,50
2005 25 Feb. 3,25 4,25 4,25 5,2520 May 2,75 3,75 3,75 4,7509 Jun. 2,25 3,25 3,25 4,25
2006 01 Sep.(2) 2,50 4,50 4,50 4,50
2007 12 Mar. 2,75 4,50 4,50 4,7506 Jun. 3,00 4,50 4,50 5,00
Source: Central Bank of Cyprus.(1) The first operation for the acceptance of deposits was conducted on 9 October 2001 with a maximum bid rate of 4,50%.(2) Following the Monetary Policy Committee's decision on 1 September 2006, the main refinancing operations rate (repo) replaced the marginal lending facility rate (Lombard), which had been used since 1 January 2001, for the purpose of pricing local currency bank loans.
3,75
3,50
5,004,504,00
Date of monetary policy decision
Deposit facility
Repo operations
Minimum bid rate
Main refinancing operations
Liquidity absorbing operations
Marginal lending facility
Open market operations
4,50
4,50
4,25
4,50
3,253,75
4,50
Table 4 Open market operations allotted through tenders – liquidity absorbing operations(1)
(CYP million, interest rates in percent per annum)
Bids (amount)
Allotment (amount)
Maximum bid rate
Weighted average
allotment rate
Minimum allottment rate
Maximum allottment rate
2006 14 Sep. 727,5 500,0 4,50 3,88 3,29 3,94 1428 Sep. 803,0 500,0 4,50 3,89 3,65 3,94 1412 Oct. 829,0 550,0 4,50 3,89 3,79 3,91 1426 Oct. 930,5 580,0 4,50 3,87 3,69 3,93 1409 Nov. 824,0 580,0 4,50 3,88 3,78 3,92 1423 Nov. 842,0 580,0 4,50 3,89 3,79 3,91 1407 Dec. 886,0 530,0 4,50 3,87 3,79 3,90 1421 Dec. 1.034,0 600,0 4,50 3,76 3,65 3,80 14
2007 04 Jan. 889,0 650,0 4,50 3,84 3,50 3,97 1418 Jan. 916,0 650,0 4,50 3,84 3,74 3,94 1401 Feb. 1.023,5 600,0 4,50 3,69 3,67 3,69 1415 Feb. 789,0 450,0 4,50 3,71 3,48 3,88 1401 Mar. 579,5 350,0 4,50 3,50 3,44 3,57 1415 Mar. 492,0 250,0 4,50 3,45 3,39 3,47 1429 Mar. 248,0 150,0 4,50 3,52 3,34 3,59 1412 Apr. 242,0 100,0 4,50 3,47 3,39 3,49 1426 Apr. 204,0 50,0 4,50 3,34 3,34 3,34 1410 May 40,0 40,0 4,50 3,29 3,29 3,29 1424 May 40,0 40,0 4,50 3,98 3,98 3,98 1407 Jun. 134,0 80,0 4,50 3,88 3,84 3,92 1421 Jun. 147,0 70,0 4,50 3,59 3,59 3,59 1405 Jul. 308,0 280,0 4,50 4,26 3,54 4,50 1419 Jul. 96,0 80,0 4,50 4,37 4,26 4,48 1419 Jul. 206,0 206,0 167
02 Aug. 219,0 150,0 4,50 4,38 4,25 4,47 1416 Aug. 169,0 169,0 4,50 4,47 4,35 4,50 1430 Aug. 140,2 140,2 4,50 4,50 4,43 4,50 1413 Sep. 11,0 11,0 4,50 4,45 4,43 4,49 14
Source: Central Bank of Cyprus.(1) Since 9 October 2001, open market operations for the absorption of liquidity have been conducted through auctions for the acceptance of deposits (depos).
Date of settlement Variable rate tenders
Running for (…) days

Central Bank of Cyprus
40
Table 5 Money market interest rates (percent per annum, period average)
Overnight deposits
2-7 days deposits
1-month deposits
1-6 months deposits
6-12 months deposits
Overnight deposits (EONIA)
1-month deposits
(EURIBOR)
3-month deposits
(EURIBOR)
6-month deposits
(EURIBOR)
12-month deposits
(EURIBOR)
2006 July 2,79 3,08 3,23 3,53 - 2,81 2,94 3,10 3,29 3,54Aug. 2,86 3,04 3,25 3,67 - 2,97 3,09 3,23 3,41 3,62Sep. 3,46 3,79 3,73 3,76 - 3,04 3,16 3,34 3,53 3,72Oct. 3,67 4,16 4,09 4,45 - 3,28 3,35 3,50 3,64 3,80Nov. 3,58 3,95 4,02 4,24 - 3,33 3,42 3,60 3,73 3,86Dec. 3,37 4,16 4,02 4,01 - 3,50 3,64 3,68 3,79 3,92
2007 Jan. 3,35 4,11 4,18 3,77 - 3,56 3,62 3,75 3,89 4,06Feb. 3,10 3,96 4,13 4,00 4,00 3,57 3,65 3,82 3,94 4,09Mar. 3,18 3,94 4,04 3,99 - 3,69 3,84 3,89 4,00 4,11Apr. 3,62 3,95 3,95 4,05 4,20 3,82 3,86 3,98 4,10 4,25May 3,86 4,09 4,12 3,88 - 3,79 3,92 4,07 4,20 4,37June 4,06 4,17 4,22 4,27 - 3,96 4,10 4,15 4,28 4,51July 4,26 4,24 4,31 4,38 - 4,06 4,11 4,22 4,36 4,56Aug. 4,49 4,59 4,48 4,46 - 4,05 4,31 4,54 4,59 4,67
Sources: Central Bank of Cyprus and European Central Bank.
Cyprus Euro area

Monetary Policy Report October 2007
41
Table 6 Commercial bank interest rates(1, 2)
(percent per annum)
Enterprises: overdraft within
limits
Enterprises: secured loans
Personal: secured loans
Housing: loans secured by
assignment of life policy
Credit cards Current accounts
3 month notice -
over CYP5.000
1 year fixed deposits - over
CYP5.000
2005 Aug. 6,70 6,69 7,49 5,74 12,00 0,45 3,47 3,82Sep. 6,69 6,69 7,49 5,74 12,00 0,46 3,47 3,79Oct. 6,69 6,68 7,29 5,74 12,00 0,47 3,47 3,75Nov. 6,69 6,68 7,29 5,72 12,00 0,46 3,48 3,72Dec. 6,69 6,68 7,28 5,71 12,00 0,45 3,47 3,68
2006 Jan. 6,67 6,67 7,28 5,71 12,00 0,46 3,48 3,63Feb. 6,65 6,65 7,27 5,71 12,00 0,45 3,48 3,59Mar. 6,64 6,65 7,27 5,69 12,00 0,47 3,48 3,57Apr. 6,64 6,64 7,28 5,69 12,00 0,48 3,48 3,55May 6,64 6,63 7,28 5,68 12,00 0,47 3,48 3,52June 6,65 6,62 7,28 5,68 12,00 0,43 3,48 3,43July 6,65 6,62 7,28 5,68 12,00 0,46 3,47 3,42Aug. 6,64 6,62 7,29 5,68 12,00 0,46 3,47 3,42Sep. 6,88 6,81 7,51 5,84 12,17 0,55 3,64 3,58Oct. 6,89 6,81 7,50 5,84 12,17 0,51 3,65 3,58Nov. 6,88 6,81 7,48 5,84 12,17 0,50 3,65 3,58Dec. 6,88 6,80 7,48 5,84 12,17 0,51 3,65 3,58
2007 Jan. 6,90 6,81 7,63 5,92 12,17 0,54 3,65 3,58Feb. 6,91 6,81 7,66 5,92 12,17 0,53 3,65 3,57Mar. 6,89 6,80 7,67 5,92 12,17 0,53 3,65 3,57Apr. 6,89 6,79 7,67 5,92 12,17 0,48 3,66 3,57May 6,87 6,78 7,67 5,93 12,17 0,47 3,66 3,58June 6,86 6,78 7,65 5,93 12,17 0,47 3,66 3,60July 6,86 6,78 7,65 5,94 12,17 0,44 3,66 3,61Aug. 6,86 6,77 7,65 5,95 12,17 0,45 3,66 3,61
Lending rates Deposit rates
(2) Data refer to the average of the representative interest rates as defined by the three largest banks. (1) Reported as at end of month.
Source: Domestic banks.
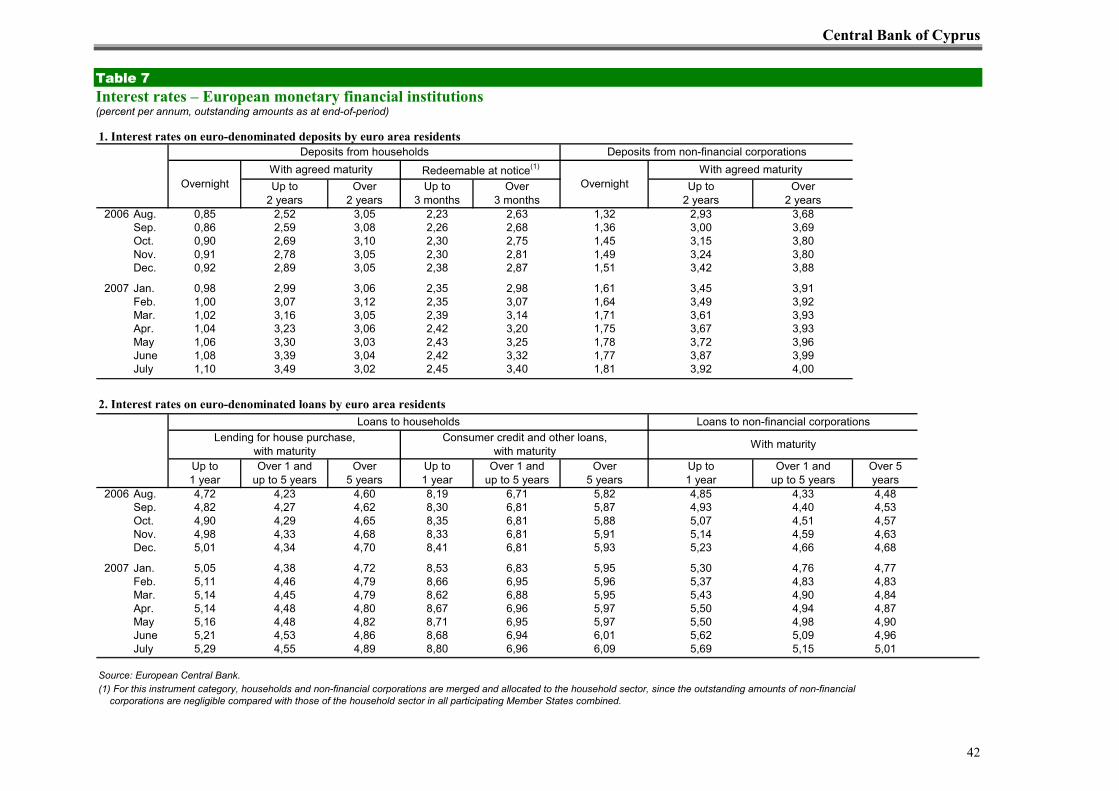
Central Bank of Cyprus
42
Table 7 Interest rates – European monetary financial institutions (percent per annum, outstanding amounts as at end-of-period)
1. Interest rates on euro-denominated deposits by euro area residents
Up to 2 years
Over 2 years
Up to 3 months
Over 3 months
Up to 2 years
Over 2 years
2006 Aug. 0,85 2,52 3,05 2,23 2,63 1,32 2,93 3,68Sep. 0,86 2,59 3,08 2,26 2,68 1,36 3,00 3,69Oct. 0,90 2,69 3,10 2,30 2,75 1,45 3,15 3,80Nov. 0,91 2,78 3,05 2,30 2,81 1,49 3,24 3,80Dec. 0,92 2,89 3,05 2,38 2,87 1,51 3,42 3,88
2007 Jan. 0,98 2,99 3,06 2,35 2,98 1,61 3,45 3,91Feb. 1,00 3,07 3,12 2,35 3,07 1,64 3,49 3,92Mar. 1,02 3,16 3,05 2,39 3,14 1,71 3,61 3,93Apr. 1,04 3,23 3,06 2,42 3,20 1,75 3,67 3,93May 1,06 3,30 3,03 2,43 3,25 1,78 3,72 3,96June 1,08 3,39 3,04 2,42 3,32 1,77 3,87 3,99July 1,10 3,49 3,02 2,45 3,40 1,81 3,92 4,00
2. Interest rates on euro-denominated loans by euro area residents
Up to 1 year
Over 1 and up to 5 years
Over 5 years
Up to 1 year
Over 1 and up to 5 years
Over 5 years
Up to 1 year
Over 1 and up to 5 years
Over 5 years
2006 Aug. 4,72 4,23 4,60 8,19 6,71 5,82 4,85 4,33 4,48Sep. 4,82 4,27 4,62 8,30 6,81 5,87 4,93 4,40 4,53Oct. 4,90 4,29 4,65 8,35 6,81 5,88 5,07 4,51 4,57Nov. 4,98 4,33 4,68 8,33 6,81 5,91 5,14 4,59 4,63Dec. 5,01 4,34 4,70 8,41 6,81 5,93 5,23 4,66 4,68
2007 Jan. 5,05 4,38 4,72 8,53 6,83 5,95 5,30 4,76 4,77Feb. 5,11 4,46 4,79 8,66 6,95 5,96 5,37 4,83 4,83Mar. 5,14 4,45 4,79 8,62 6,88 5,95 5,43 4,90 4,84Apr. 5,14 4,48 4,80 8,67 6,96 5,97 5,50 4,94 4,87May 5,16 4,48 4,82 8,71 6,95 5,97 5,50 4,98 4,90June 5,21 4,53 4,86 8,68 6,94 6,01 5,62 5,09 4,96July 5,29 4,55 4,89 8,80 6,96 6,09 5,69 5,15 5,01
Source: European Central Bank.(1) For this instrument category, households and non-financial corporations are merged and allocated to the household sector, since the outstanding amounts of non-financial corporations are negligible compared with those of the household sector in all participating Member States combined.
Consumer credit and other loans, with maturity With maturity
Loans to non-financial corporationsLoans to householdsLending for house purchase,
with maturity
OvernightWith agreed maturity Redeemable at notice(1)
Deposits from non-financial corporationsWith agreed maturity
Deposits from households
Overnight
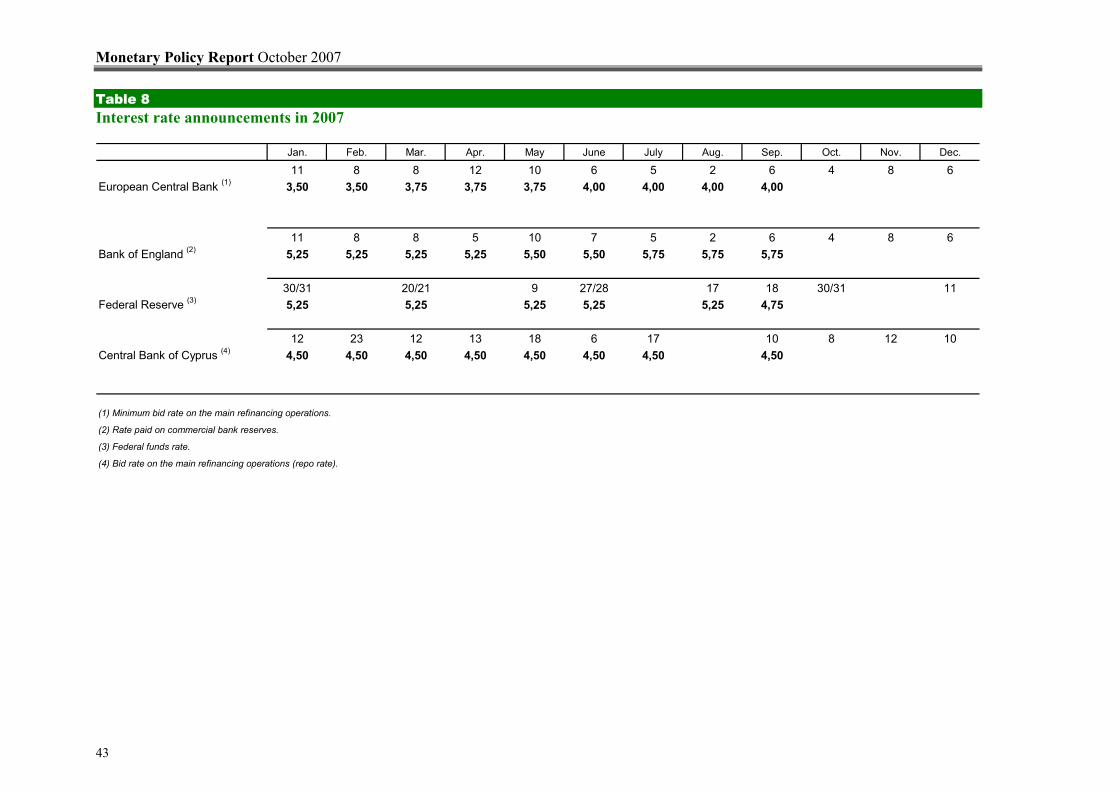
Monetary Policy Report October 2007
43
Table 8 Interest rate announcements in 2007
Jan. Feb. Mar. Apr. May June July Aug. Sep. Oct. Nov. Dec.
11 8 8 12 10 6 5 2 6 4 8 6European Central Bank (1) 3,50 3,50 3,75 3,75 3,75 4,00 4,00 4,00 4,00
11 8 8 5 10 7 5 2 6 4 8 6Bank of England (2) 5,25 5,25 5,25 5,25 5,50 5,50 5,75 5,75 5,75
30/31 20/21 9 27/28 17 18 30/31 11Federal Reserve (3) 5,25 5,25 5,25 5,25 5,25 4,75
12 23 12 13 18 6 17 10 8 12 10Central Bank of Cyprus (4) 4,50 4,50 4,50 4,50 4,50 4,50 4,50 4,50
(1) Minimum bid rate on the main refinancing operations.
(2) Rate paid on commercial bank reserves.
(3) Federal funds rate.
(4) Bid rate on the main refinancing operations (repo rate).

Central Bank of Cyprus
44
Table 9 Percentage change in consumer price index by economic category (%) August 2007/2006
1998=1002005=100 (for 2006)
2005=100 (for 2007)(1)
GENERAL INDEX 2,28 2,56 2,49 3,10 2,43 2,47 2,95 1,84 1,91 100,00 100,00 100,00
A Domestic products 2,95 1,79 4,35 3,95 4,40 5,57 4,76 3,88 4,09 32,36 28,60 28,98A.1 Agricultural 3,32 1,34 6,51 3,88 10,25 14,42 5,56 9,98 10,54 7,93 6,92 6,93A.2 Industrial 3,36 1,14 2,47 3,23 3,23 2,94 2,60 2,89 2,90 22,91 19,24 19,29A.3 Electricity -3,13 11,51 13,10 9,51 -2,48 0,47 20,23 -4,94 -4,25 1,52 2,44 2,76
B Petroleum products 17,18 14,82 8,09 11,04 0,60 -3,09 13,54 -0,58 -0,91 4,33 6,44 6,63
C Imported products -5,55 -2,47 -1,14 0,09 -2,22 -2,34 -0,90 -2,56 -2,53 22,20 25,31 24,62C1 Motor vehicles -13,50 -2,42 -1,38 0,81 -9,50 -9,50 0,49 -10,22 -10,13 9,43 6,15 5,41C2 Other imported -0,39 -2,49 -1,07 -0,14 0,23 0,07 -1,35 -0,04 -0,03 12,77 19,16 19,21D Services 3,23 3,34 2,57 2,97 3,88 3,86 2,43 3,30 3,37 41,11 39,65 39,77
HICP 1,9 2,1 2,2 2,7 2,3 2,2 2,7 1,7 1,7
2006Jan. - Aug. 2007/2006
Weights
August 2006/2005
July 2007/2006
August 2007/2006
Jan. - Aug. 2006/2005
Jan. - Jul. 2007/20062004 2005
(1) The weights for 2007 were updated as a result of the change in the taxes of motor vehicles. Source : Cystat.
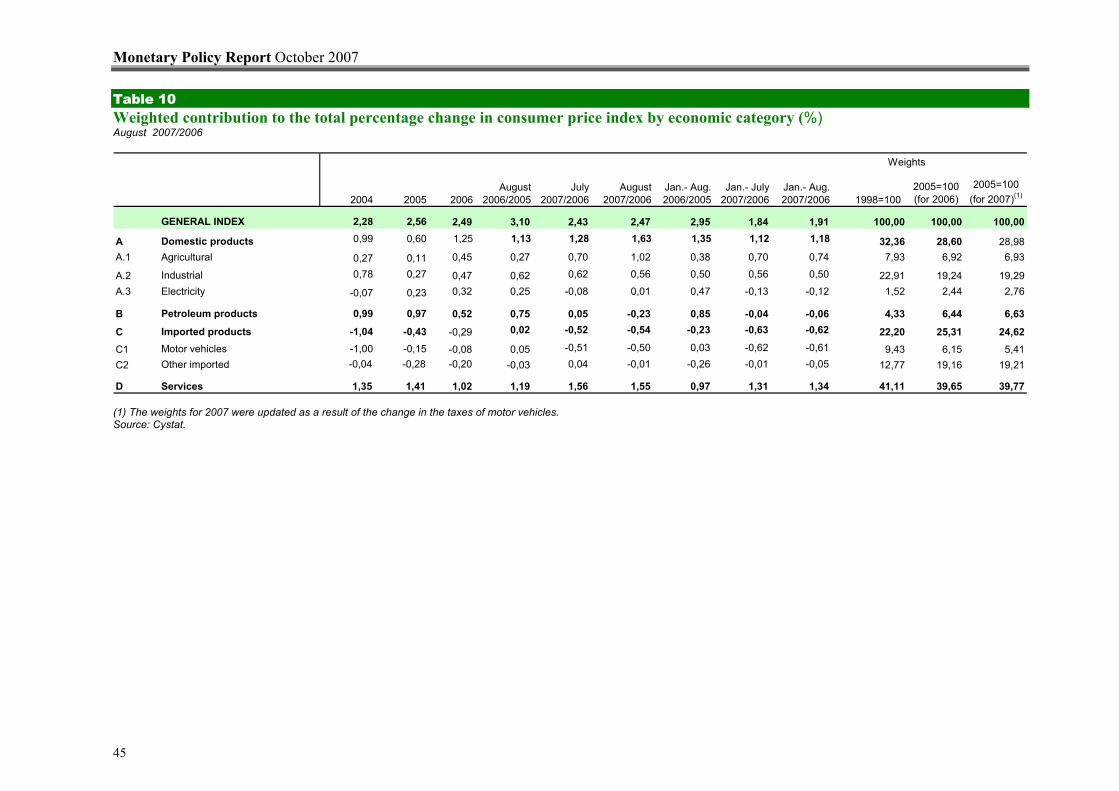
Monetary Policy Report October 2007
45
Table 10 Weighted contribution to the total percentage change in consumer price index by economic category (%) August 2007/2006
1998=1002005=100 (for 2006)
2005=100 (for 2007)(1)
GENERAL INDEX 2,28 2,56 2,49 3,10 2,43 2,47 2,95 1,84 1,91 100,00 100,00 100,00
A Domestic products 0,99 0,60 1,25 1,13 1,28 1,63 1,35 1,12 1,18 32,36 28,60 28,98A.1 Agricultural 0,27 0,11 0,45 0,27 0,70 1,02 0,38 0,70 0,74 7,93 6,92 6,93
A.2 Industrial 0,78 0,27 0,47 0,62 0,62 0,56 0,50 0,56 0,50 22,91 19,24 19,29A.3 Electricity -0,07 0,23 0,32 0,25 -0,08 0,01 0,47 -0,13 -0,12 1,52 2,44 2,76
B Petroleum products 0,99 0,97 0,52 0,75 0,05 -0,23 0,85 -0,04 -0,06 4,33 6,44 6,63
C Imported products -1,04 -0,43 -0,29 0,02 -0,52 -0,54 -0,23 -0,63 -0,62 22,20 25,31 24,62C1 Motor vehicles -1,00 -0,15 -0,08 0,05 -0,51 -0,50 0,03 -0,62 -0,61 9,43 6,15 5,41C2 Other imported -0,04 -0,28 -0,20 -0,03 0,04 -0,01 -0,26 -0,01 -0,05 12,77 19,16 19,21
D Services 1,35 1,41 1,02 1,19 1,56 1,55 0,97 1,31 1,34 41,11 39,65 39,77
2006Jan.- Aug. 2007/2006
Weights
August 2006/2005
July 2007/2006
August 2007/2006
Jan.- Aug. 2006/2005
Jan.- July 2007/20062004 2005
(1) The weights for 2007 were updated as a result of the change in the taxes of motor vehicles. Source: Cystat.
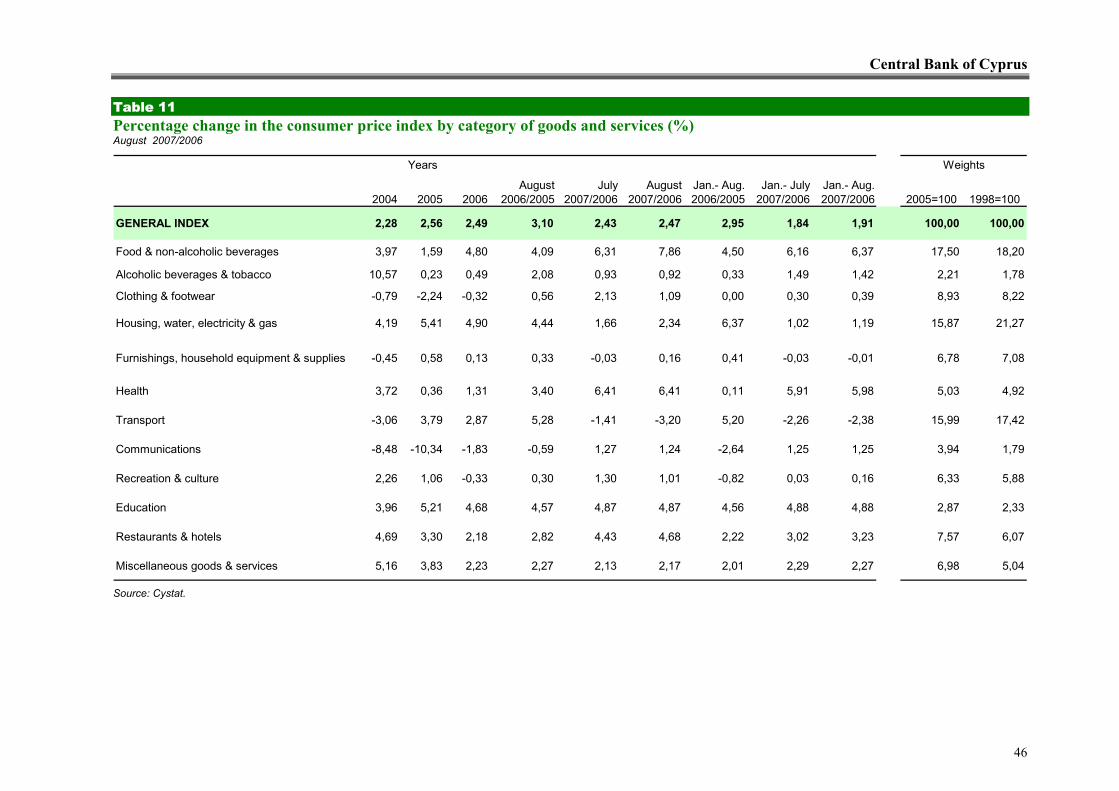
Central Bank of Cyprus
46
Table 11 Percentage change in the consumer price index by category of goods and services (%) August 2007/2006
2004 2005 2006 2005=100 1998=100
GENERAL INDEX 2,28 2,56 2,49 3,10 2,43 2,47 2,95 1,84 1,91 100,00 100,00
Food & non-alcoholic beverages 3,97 1,59 4,80 4,09 6,31 7,86 4,50 6,16 6,37 17,50 18,20
Alcoholic beverages & tobacco 10,57 0,23 0,49 2,08 0,93 0,92 0,33 1,49 1,42 2,21 1,78
Clothing & footwear -0,79 -2,24 -0,32 0,56 2,13 1,09 0,00 0,30 0,39 8,93 8,22
Housing, water, electricity & gas 4,19 5,41 4,90 4,44 1,66 2,34 6,37 1,02 1,19 15,87 21,27
Furnishings, household equipment & supplies -0,45 0,58 0,13 0,33 -0,03 0,16 0,41 -0,03 -0,01 6,78 7,08
Health 3,72 0,36 1,31 3,40 6,41 6,41 0,11 5,91 5,98 5,03 4,92
Transport -3,06 3,79 2,87 5,28 -1,41 -3,20 5,20 -2,26 -2,38 15,99 17,42
Communications -8,48 -10,34 -1,83 -0,59 1,27 1,24 -2,64 1,25 1,25 3,94 1,79
Recreation & culture 2,26 1,06 -0,33 0,30 1,30 1,01 -0,82 0,03 0,16 6,33 5,88
Education 3,96 5,21 4,68 4,57 4,87 4,87 4,56 4,88 4,88 2,87 2,33
Restaurants & hotels 4,69 3,30 2,18 2,82 4,43 4,68 2,22 3,02 3,23 7,57 6,07
Miscellaneous goods & services 5,16 3,83 2,23 2,27 2,13 2,17 2,01 2,29 2,27 6,98 5,04
Weights
July 2007/2006
August 2006/2005
August 2007/2006
Jan.- Aug. 2007/2006
Jan.- July 2007/2006
Jan.- Aug. 2006/2005
Years
Source: Cystat.

Monetary Policy Report October 2007
47
Table 12 Weighted contributions to the total change in the consumer price index by category of goods and services (%) August 2007/ 2006
2004 2005 2006 2005=100 1998=100
GENERAL INDEX 2,28 2,56 2,49 3,10 2,43 2,47 2,95 1,84 1,91 100,00 100,00
Food & non-alcoholic beverages 0,76 0,31 0,82 0,72 1,12 1,41 0,79 1,09 1,13 17,50 18,20
Alcoholic beverages & tobacco 0,28 0,01 0,01 0,05 0,02 0,02 0,01 0,03 0,03 2,21 1,78
Clothing & footwear -0,05 -0,14 -0,03 0,04 0,17 0,08 0,00 0,03 0,03 8,93 8,22
Housing, water, electricity & gas 0,93 1,22 0,76 0,72 0,27 0,38 1,00 0,17 0,19 15,87 21,27
Furnishings, household equipment & supplies -0,03 0,04 0,01 0,02 0,00 0,01 0,03 0,00 0,00 6,78 7,08
Health 0,20 0,02 0,06 0,17 0,32 0,32 0,01 0,29 0,30 5,03 4,92
Transport -0,51 0,59 0,45 0,86 -0,23 -0,53 0,83 -0,37 -0,39 15,99 17,42
Communications -0,10 -0,11 -0,07 -0,02 0,05 0,05 -0,11 0,05 0,05 3,94 1,79
Recreation & culture 0,12 0,06 -0,02 0,02 0,08 0,06 -0,05 0,00 0,01 6,33 5,88
Education 0,10 0,13 0,13 0,13 0,14 0,14 0,13 0,14 0,14 2,87 2,33
Restaurants & hotels 0,31 0,23 0,16 0,22 0,34 0,36 0,17 0,23 0,24 7,57 6,07
Miscellaneous goods & services 0,28 0,21 0,15 0,16 0,15 0,15 0,14 0,16 0,16 6,98 5,04
August 2007/2006
July 2007/2006
WeightsYearsJan.- Aug. 2007/2006
Jan.- July 2007/2006
August 2006/2005
Jan.- Aug. 2006/2005
Source: Cystat.

Central Bank of Cyprus
48
Table 13 Cyprus Stock Exchange: purchase and sale of listed shares by non-residents(1) (CYP thousand)
Apr. May June July Aug. Apr. May June July Aug.
EUROPE 7.395,9 257.715,8 16.001,1 22.009,3 2.518,2 2.870,3 1.449,4 3.461,1 282.799,6 22.036,2 20.822,2 1.122,5 1.669,4 1.310,4EU-25 6.805,2 242.454,5 15.221,9 21.171,7 2.497,2 2.800,2 1.416,5 2.980,4 275.945,2 21.593,3 20.191,5 1.098,4 1.635,9 1.276,2 Greece 5.667,5 140.748,9 7.693,4 14.304,0 886,6 977,2 583,2 2.269,5 260.812,4 8.532,8 17.704,4 657,9 954,0 687,9 United Kingdom 238,2 58.345,6 7.070,3 5.257,1 1.457,8 1.464,3 662,2 390,6 10.088,4 12.336,4 1.361,2 421,9 606,7 548,9Other European countries 590,7 15.261,3 779,2 837,5 21,0 70,1 32,9 480,7 6.854,4 442,9 630,7 24,1 33,6 34,2 Russian Federation 405,4 1.029,9 17,8 0,3 1,0 1,0 1,0 279,7 1.220,2 116,4 107,7 2,3 8,5 2,1
AFRICA 51,4 7.252,2 374,0 169,4 10,8 52,2 4,7 90,1 8.722,4 384,4 242,7 16,8 80,8 102,8North African countries 0,0 0,0 0,0 0,0 0,0 0,0 0,0 1,8 0,0 5,7 0,0 0,0 0,1 0,1Other African countries 51,4 7.252,2 374,0 169,4 10,8 52,2 4,7 88,3 8.722,4 378,7 242,7 16,8 80,7 102,7 South Africa 0,0 232,6 90,6 59,9 4,7 13,7 2,5 7,6 220,4 87,5 133,2 10,8 18,1 9,8
AMERICA 429,3 128.783,8 5.874,1 7.182,1 164,0 597,1 556,5 1.232,7 32.988,8 5.253,2 11.908,6 237,8 282,0 913,9North American countries 84,1 94.136,8 1.242,9 1.008,3 58,9 221,0 123,5 33,2 6.193,4 3.815,9 7.349,2 62,3 91,4 122,5 United States of America 81,9 94.115,1 1.242,9 1.006,2 58,8 220,8 123,5 33,2 5.957,0 3.783,3 7.348,2 62,3 88,8 118,1 Canada 2,2 21,7 0,0 2,1 0,1 0,1 0,0 0,0 236,5 32,5 0,9 0,0 2,6 4,4Central American countries 345,2 34.647,0 4.631,2 6.173,9 105,2 376,2 433,0 1.199,4 26.795,3 1.437,3 4.559,5 175,6 190,6 791,4South American countries 0,0 0,0 0,0 0,0 0,0 0,0 0,0 0,0 0,0 0,0 0,0 0,0 0,0 0,0
ASIA 267,3 6.523,5 9,3 7,8 1,2 1,3 0,7 229,2 5.446,5 507,1 50,3 26,5 4,6 0,0West Asia 204,7 86,1 9,3 0,0 0,0 1,2 0,1 168,9 955,4 507,1 50,3 26,5 2,7 0,0Other Asian countries 62,6 6.437,4 0,0 7,8 1,2 0,1 0,6 60,3 4.491,1 0,0 0,0 0,0 1,9 0,0
OCEANIA 0,0 28,2 78,8 18,8 2,4 3,1 10,1 0,0 19,0 35,3 48,3 1,3 15,6 24,7Total 8.143,9 400.303,5 22.337,2 29.387,5 2.696,6 3.524,1 2.021,4 5.013,0 329.976,3 28.216,1 33.072,2 1.404,9 2.052,3 2.351,8
Source: Cyprus Stock Exchange.(1) Purchase of shares included in the central securities depository as well as shares not included in the central securities depository.
Sale of listed shares by non-residents
20052007 2007
2006
Geographic origin of non-resident investors
2005
Purchase of listed shares by non-residents
2006

Monetary Policy Report October 2007
49
Table 14 Balance of payments (CYP million)
2006 2006 2006 2007 2007(Annual) (Prov.) (Q1) (Prov.) (Q2) (Prov.) (Q1) (Prov.) (Q2) (Prov.)
CATEGORIES CREDIT DEBIT NET CREDIT DEBIT NET CREDIT DEBIT NET CREDIT DEBIT NET CREDIT DEBIT NET
CURRENT ACCOUNT 5.353,7 5.850,1 -496,4 1.091,4 1.254,9 -163,5 1.358,5 1.343,5 15,0 1.160,4 1.427,9 -267,5 1.501,3 1.565,7 -64,4
Goods, services and income 4.969,4 5.562,8 -593,4 986,4 1.182,8 -196,4 1.259,6 1.275,8 -16,2 1.056,9 1.360,1 -303,2 1.404,5 1.495,4 -90,9Goods and services 3.977,5 4.319,9 -342,4 804,0 1.026,7 -222,7 1.056,0 1.073,8 -17,8 820,8 1.093,4 -272,6 1.063,0 1.173,7 -110,7
Goods 650,8 2.952,0 -2.301,2 182,8 705,9 -523,1 161,1 765,0 -603,9 160,5 732,6 -572,1 173,5 859,1 -685,6Services 3.326,6 1.367,9 1.958,8 621,2 320,8 300,4 894,9 308,8 586,1 660,3 360,8 299,5 889,5 314,6 574,9
Transport 774,3 502,4 271,9 190,0 145,0 45,0 227,7 121,7 106,0 197,4 148,5 48,9 210,0 105,3 104,8Travel 1.101,5 449,5 651,9 101,5 97,3 4,3 321,0 98,8 222,2 101,5 106,2 -4,8 326,7 115,7 211,0Communications services 42,9 58,6 -15,7 9,9 11,9 -2,0 7,4 18,0 -10,6 19,1 22,2 -3,1 7,1 8,1 -1,0Construction services 93,8 10,8 83,0 17,5 2,5 15,0 24,5 2,6 21,9 24,7 4,9 19,8 22,5 3,1 19,4Insurance services 53,2 35,4 17,8 15,4 11,2 4,2 14,1 7,0 7,0 9,5 8,5 1,0 10,3 5,0 5,4Financial services 147,2 60,9 86,2 31,7 6,2 25,4 30,6 16,1 14,5 44,9 7,5 37,4 44,0 18,3 25,6Computer and information services 94,4 15,9 78,5 24,2 4,5 19,8 23,8 3,2 20,6 24,1 5,1 19,1 22,5 2,3 20,2Royalties and licence fees 7,5 27,8 -20,2 3,1 3,0 0,1 0,2 1,7 -1,5 2,6 1,9 0,8 0,5 1,2 -0,8Other business services 806,7 135,1 671,6 177,4 22,9 154,4 198,5 26,6 171,9 178,2 41,8 136,5 189,7 29,3 160,4Personal, cultural and recreational services 24,6 30,2 -5,6 6,5 6,9 -0,4 4,2 6,6 -2,4 8,1 7,3 0,8 8,4 14,5 -6,1Government services, n.i.e. 180,6 41,3 139,3 44,0 9,5 34,4 42,9 6,6 36,2 50,1 7,0 43,1 47,8 11,8 36,0
Income 992,0 1.242,9 -250,9 182,4 156,1 26,3 203,6 202,0 1,6 236,1 266,7 -30,6 341,6 321,7 19,9Compensation of employees 16,1 86,0 -69,9 4,3 24,5 -20,1 3,9 15,7 -11,8 3,9 26,0 -22,1 4,1 18,0 -13,9Investment income 975,8 1.156,9 -181,0 178,0 131,6 46,4 199,7 186,3 13,4 232,2 240,7 -8,5 337,5 303,7 33,8
Current transfers 384,3 287,3 96,9 105,0 72,1 33,0 98,9 67,6 31,2 103,6 67,8 35,8 96,7 70,3 26,5General government 143,9 95,4 48,5 38,7 32,4 6,2 33,5 20,4 13,1 34,1 19,7 14,4 33,9 16,7 17,2Other sectors 240,4 191,9 48,5 66,4 39,7 26,7 65,4 47,3 18,1 69,5 48,1 21,4 62,9 53,6 9,3
Capital and financial account 580,6 183,0 59,0 203,2 96,2Capital account 45,4 30,3 15,1 7,7 11,2 -3,5 15,7 6,4 9,4 1,8 5,9 -4,1 5,9 8,5 -2,6
Financial account 565,5 186,5 49,7 207,2 98,8Direct investment 297,7 -16,9 67,9 76,2 74,1
Abroad -392,5 -61,4 -31,2 -87,1 -70,4In Cyprus 690,2 44,4 99,0 163,3 144,6
Portfolio investment -345,2 -90,5 160,8 -201,0 409,7Assets -2.205,0 -386,0 -338,7 -737,6 -248,2Liabilities 1.859,8 295,5 499,5 536,6 657,9
Financial derivatives 8,3 1,6 1,5 2,8 -0,9Other investment 1.065,2 224,3 10,1 -196,4 -105,4
Assets -2.337,9 -285,4 -548,9 -639,7 -2.241,5Liabilities 3.403,1 509,7 559,0 443,3 2.136,1
Reserve assets -460,5 68,0 -190,6 525,6 -278,7NET ERRORS AND OMISSIONS -84,2 -19,5 -74,0 64,3 -31,8
Sources: Central Bank of Cyprus and Cystat.
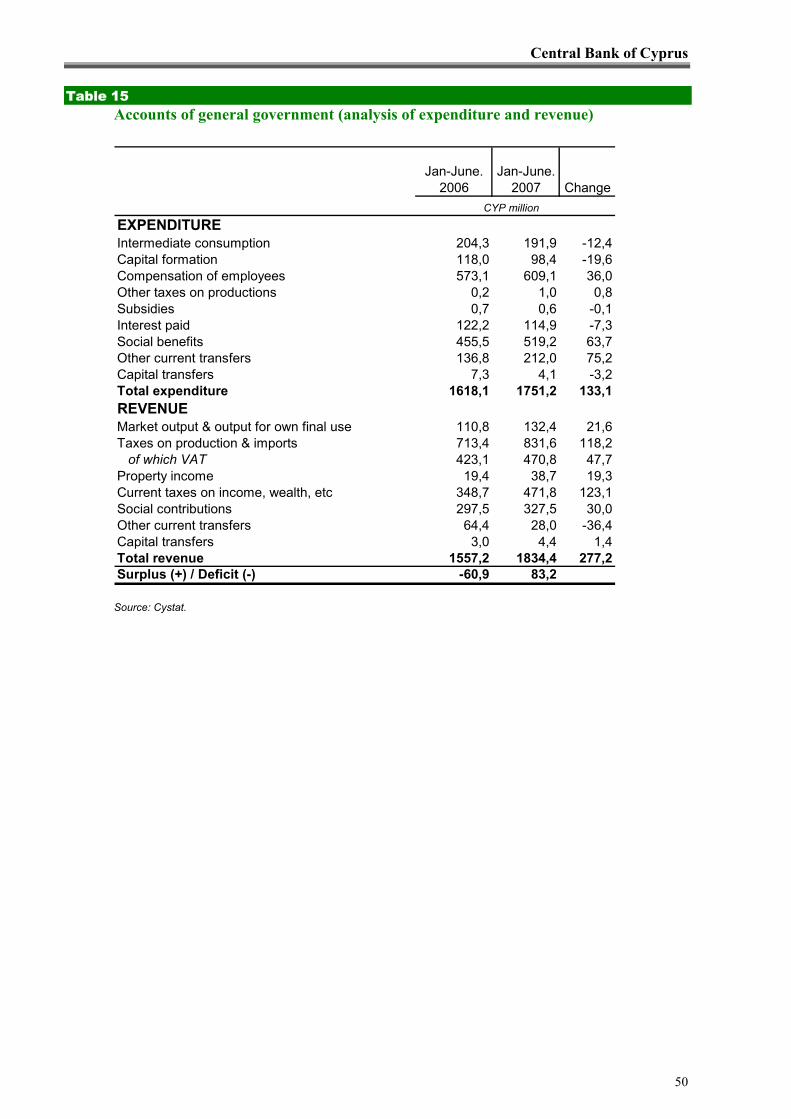
Central Bank of Cyprus
50
Table 15 Accounts of general government (analysis of expenditure and revenue)
Jan-June. 2006
Jan-June. 2007 Change
EXPENDITUREIntermediate consumption 204,3 191,9 -12,4Capital formation 118,0 98,4 -19,6Compensation of employees 573,1 609,1 36,0Other taxes on productions 0,2 1,0 0,8Subsidies 0,7 0,6 -0,1Interest paid 122,2 114,9 -7,3Social benefits 455,5 519,2 63,7Other current transfers 136,8 212,0 75,2Capital transfers 7,3 4,1 -3,2Total expenditure 1618,1 1751,2 133,1REVENUEMarket output & output for own final use 110,8 132,4 21,6Taxes on production & imports 713,4 831,6 118,2 of which VAT 423,1 470,8 47,7Property income 19,4 38,7 19,3Current taxes on income, wealth, etc 348,7 471,8 123,1Social contributions 297,5 327,5 30,0Other current transfers 64,4 28,0 -36,4Capital transfers 3,0 4,4 1,4Total revenue 1557,2 1834,4 277,2Surplus (+) / Deficit (-) -60,9 83,2
CYP million
Source: Cystat.