central bank of sri lanka...rs. 10 p a y m e n t s b u l l e t i n - f o u r t h q u a r t e r 2018...
TRANSCRIPT

P a y m e n t s B u l l e t i n - F o u r t h Q u a r t e r 2 0 1 8
Page 1
SECONDQ3
Payments and Settlements Department
Central Bank of Sri Lanka
Fourth Quarter 2018
P a y m e n t s B u l l e t i n - F o u r t h Q u a r t e r 2 0 1 8
Page 2
Contents
Topic Page
1 Currency in Circulation 3
2 Non-Cash Payments 4
2.1 Real Time Gross Settlement (RTGS) System 5
2.2 Cheques 8
2.3 Sri Lanka Interbank Payment (SLIP) System 12
2.4 Payment Cards and Mobile Phone based Payment Mechanisms 14
2.4.1 Payment Cards 14
(a) Credit Cards 15
(b) Debit Cards 17
2.4.2 Payment Card Infrastructure 18
(a) Automated Teller Machines (ATMs) 18
(b) Point of Sale (POS) Terminals 19
2.4.3 Mobile Phone based Payment Mechanisms 20
(a) Customer Account based Mobile Payment Systems 20
(b) Mobile Phone based e-money Systems 20
2.5 Internet based Payment Systems 21
2.6 Tele banking 22
2.7 Postal Instruments 22
2.8 Other 23
2.9 Common Card and Payment Switch (CCAPS) 23
(a) Common ATM Switch (CAS) 23
(b) Common Electronic Fund Transfer Switch (CEFTS) 24
(c) Shared ATM Switch (SAS) 25
3 Asian Clearing Union (ACU) 26
4 Society for Worldwide Interbank Financial Telecommunication (SWIFT) 27
5 Transactions through Payment Systems/Instruments 28
6 Key Indicators 29
7 Licensed Service Providers of Payment Cards and Mobile 30
Payment Systems
8 Regulatory Framework of Payment and Settlement Systems in Sri Lanka 32
9 Chronology of Major Events in the Payment and Settlement Systems in 33
Sri Lanka
P a y m e n t s B u l l e t i n - F o u r t h Q u a r t e r 2 0 1 8
Page 3
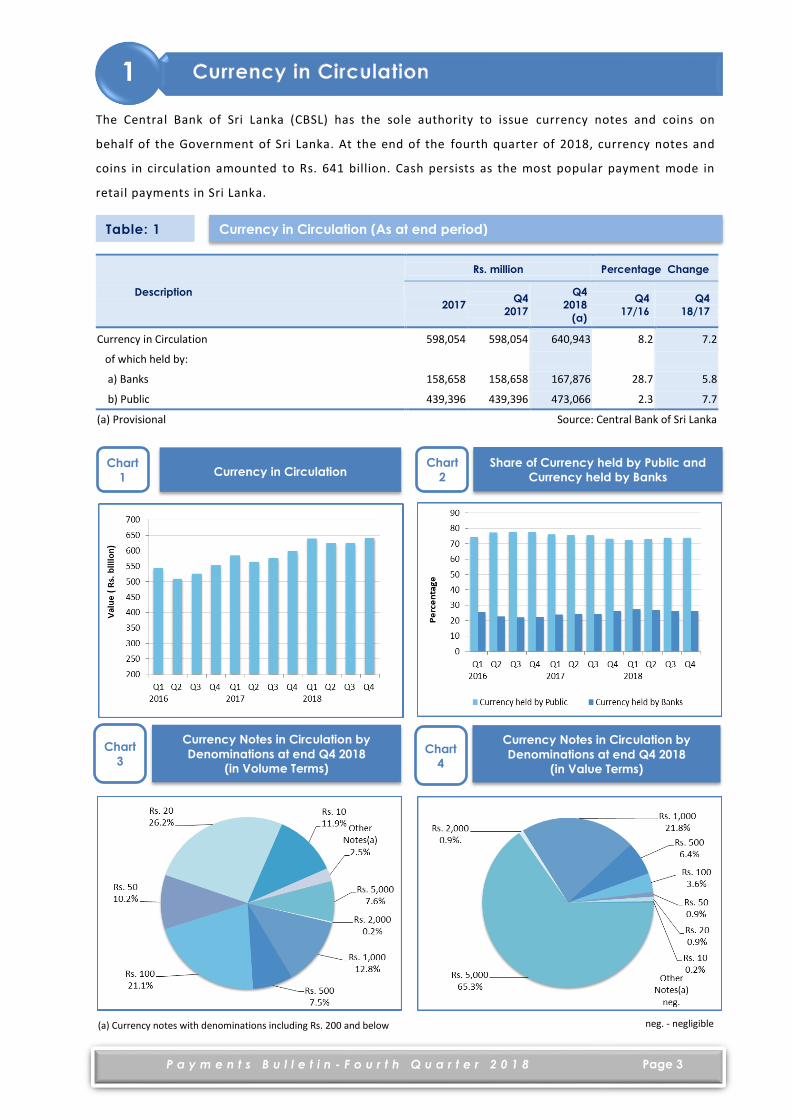
The Central Bank of Sri Lanka (CBSL) has the sole authority to issue currency notes and coins on
behalf of the Government of Sri Lanka. At the end of the fourth quarter of 2018, currency notes and
coins in circulation amounted to Rs. 641 billion. Cash persists as the most popular payment mode in
retail payments in Sri Lanka.
Description
Rs. million Percentage Change
2017 Q4
2017
Q4
2018
(a)
Q4
17/16
Q4
18/17
Currency in Circulation 598,054 598,054 640,943 8.2 7.2
of which held by:
a) Banks 158,658 158,658 167,876 28.7 5.8
b) Public 439,396 439,396 473,066 2.3 7.7
(a) Provisional Source: Central Bank of Sri Lanka
Share of Currency held by Public and
Currency held by Banks
Chart
2
Currency in Circulation Chart
1
Currency Notes in Circulation by
Denominations at end Q4 2018
(in Volume Terms)
Chart
3
Currency Notes in Circulation by
Denominations at end Q4 2018
(in Value Terms)
Chart
4
Table: 1
Currency in Circulation (As at end period)
1 Currency in Circulation
(a) Currency notes with denominations including Rs. 200 and below Rs. 10
neg. - negligible
P a y m e n t s B u l l e t i n - F o u r t h Q u a r t e r 2 0 1 8
Page 4
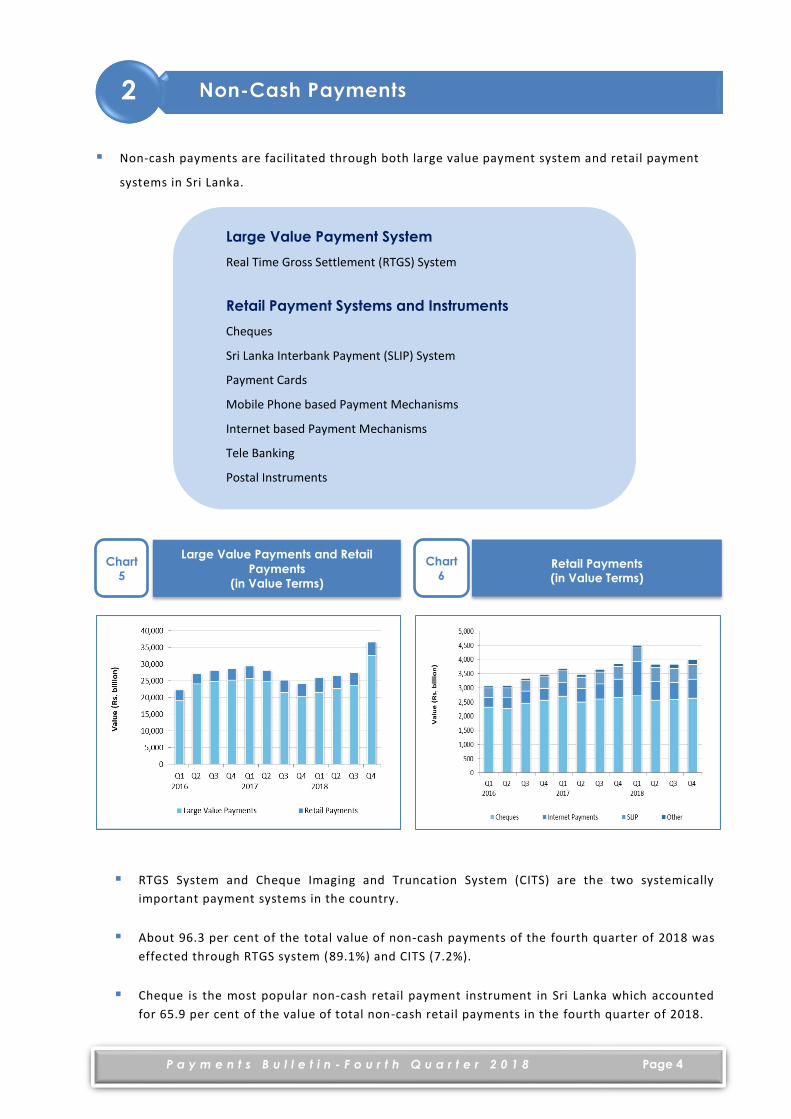
Non-cash payments are facilitated through both large value payment system and retail payment
systems in Sri Lanka.
RTGS System and Cheque Imaging and Truncation System (CITS) are the two systemically
important payment systems in the country.
About 96.3 per cent of the total value of non-cash payments of the fourth quarter of 2018 was
effected through RTGS system (89.1%) and CITS (7.2%).
Cheque is the most popular non-cash retail payment instrument in Sri Lanka which accounted
for 65.9 per cent of the value of total non-cash retail payments in the fourth quarter of 2018.
Retail Payments
(in Value Terms)
Chart
6
Large Value Payments and Retail
Payments
(in Value Terms)
Chart
5
2 Non-Cash Payments
Large Value Payment System
Real Time Gross Settlement (RTGS) System
Retail Payment Systems and Instruments
Cheques
Sri Lanka Interbank Payment (SLIP) System
Payment Cards
Mobile Phone based Payment Mechanisms
Internet based Payment Mechanisms
Tele Banking
Postal Instruments
P a y m e n t s B u l l e t i n - F o u r t h Q u a r t e r 2 0 1 8
Page 5
2.1 Real Time Gross Settlement (RTGS) System
Transactions by Type
(a) Includes Rupee Settlement of Central Bank Forex Transactions
neg. - negligible Source: Central Bank of Sri Lanka
Volume Value (Rs. billion)
Description
2017
Q4
2017
Q4
2018
Percentage
Change
Q4
18/17
2017
Q4
2017
Q4
2018
Percentage
Change
Q4
18/17
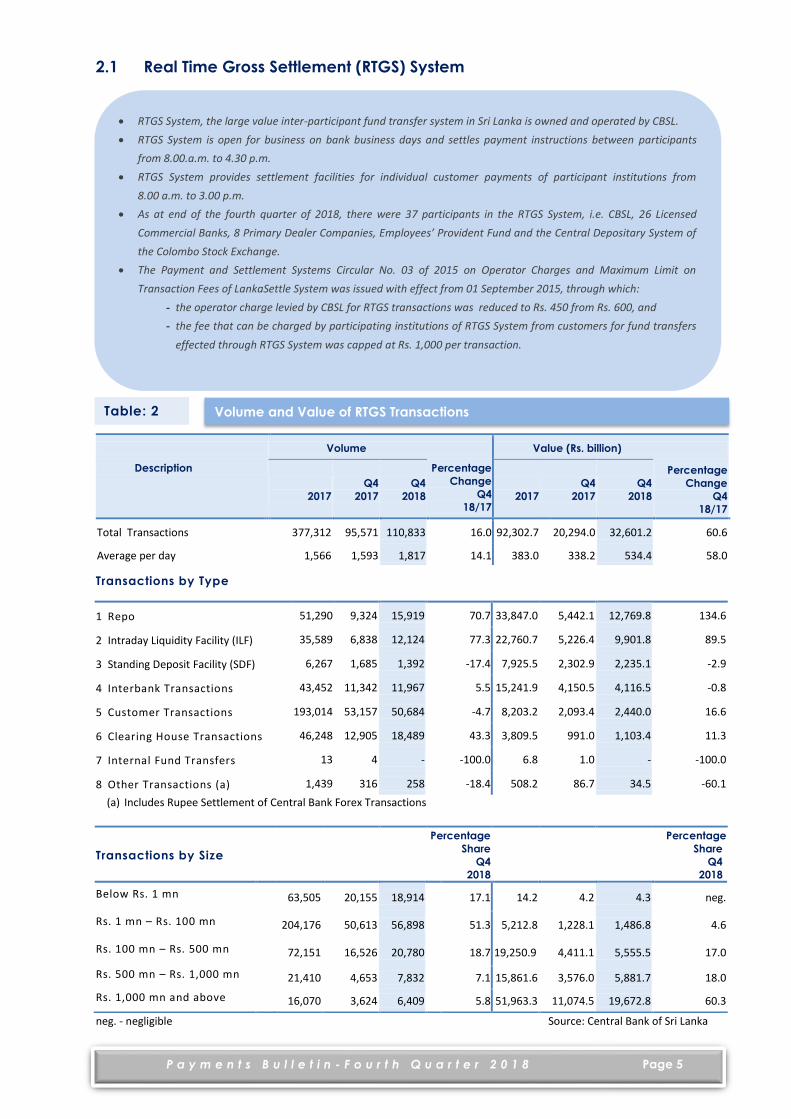
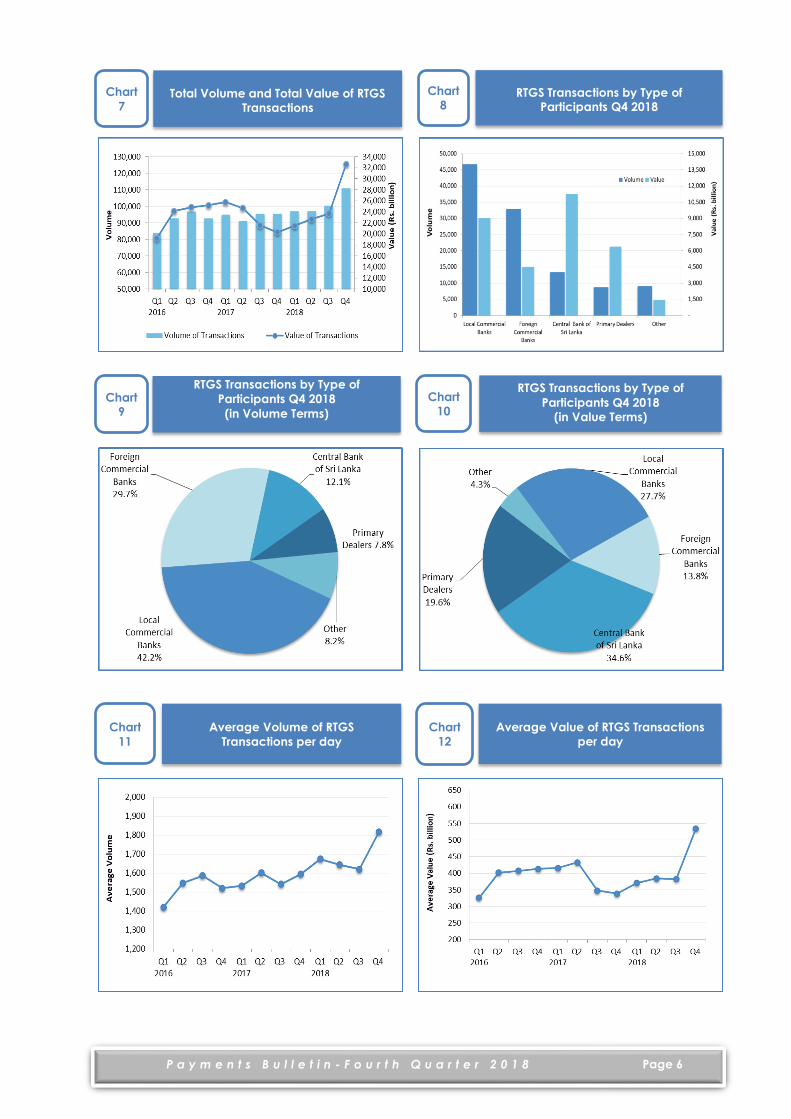
Total Transactions 377,312 95,571 110,833 16.0 92,302.7 20,294.0 32,601.2 60.6
Average per day 1,566 1,593 1,817 14.1 383.0 338.2 534.4 58.0
1 Repo 51,290 9,324 15,919 70.7 33,847.0 5,442.1 12,769.8 134.6
2 Intraday Liquidity Facility (ILF) 35,589 6,838 12,124 77.3 22,760.7 5,226.4 9,901.8 89.5
3 Standing Deposit Facility (SDF) 6,267 1,685 1,392 -17.4 7,925.5 2,302.9 2,235.1 -2.9
4 Interbank Transactions 43,452 11,342 11,967 5.5 15,241.9 4,150.5 4,116.5 -0.8
5 Customer Transactions 193,014 53,157 50,684 -4.7 8,203.2 2,093.4 2,440.0 16.6
6 Clearing House Transactions 46,248 12,905 18,489 43.3 3,809.5 991.0 1,103.4 11.3
7 Internal Fund Transfers 13 4 - -100.0 6.8 1.0 - -100.0
8 Other Transactions (a) 1,439 316 258 -18.4 508.2 86.7 34.5 -60.1
Transactions by Size
Percentage
Share
Q4
2018
Percentage
Share
Q4
2018
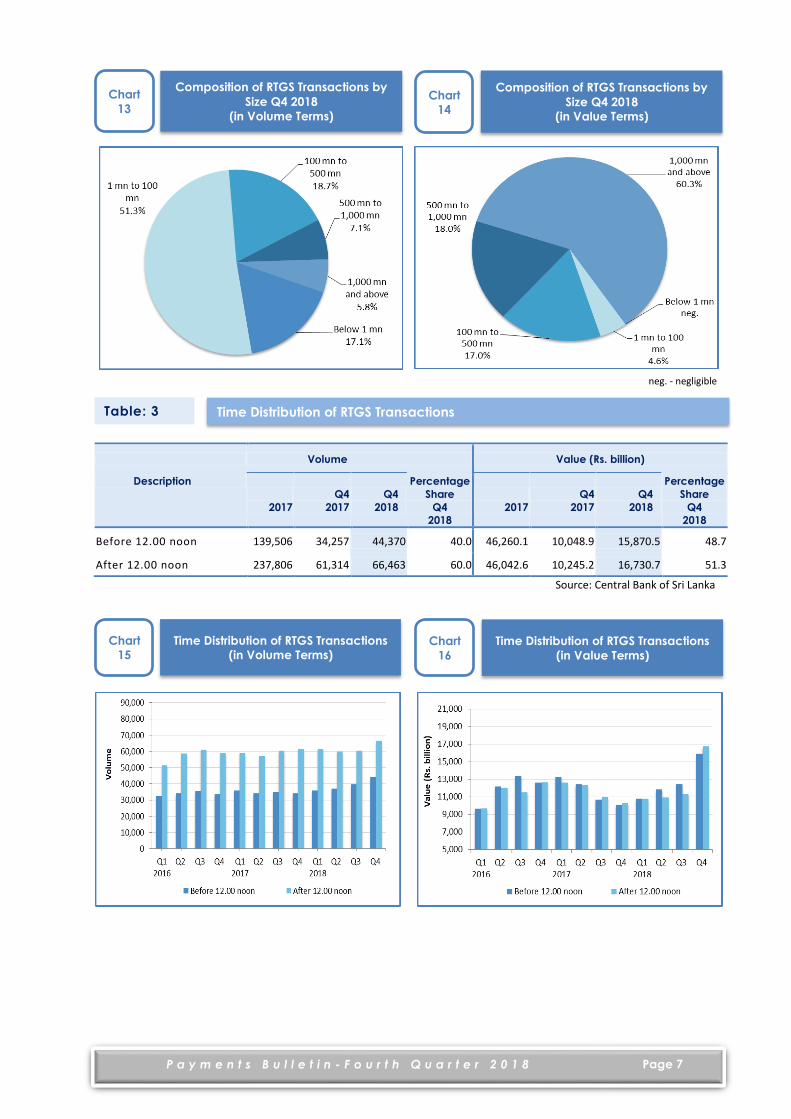
Below Rs. 1 mn 63,505 20,155 18,914 17.1 14.2 4.2 4.3 neg.
Rs. 1 mn – Rs. 100 mn 204,176 50,613 56,898 51.3 5,212.8 1,228.1 1,486.8 4.6
Rs. 100 mn – Rs. 500 mn 72,151 16,526 20,780 18.7 19,250.9 4,411.1 5,555.5 17.0
Rs. 500 mn – Rs. 1,000 mn 21,410 4,653 7,832 7.1 15,861.6 3,576.0 5,881.7 18.0
Rs. 1,000 mn and above 16,070 3,624 6,409 5.8 51,963.3 11,074.5 19,672.8 60.3
Volume and Value of RTGS Transactions
Table: 2
RTGS System, the large value inter-participant fund transfer system in Sri Lanka is owned and operated by CBSL.
RTGS System is open for business on bank business days and settles payment instructions between participants
from 8.00.a.m. to 4.30 p.m.
RTGS System provides settlement facilities for individual customer payments of participant institutions from
8.00 a.m. to 3.00 p.m.
As at end of the fourth quarter of 2018, there were 37 participants in the RTGS System, i.e. CBSL, 26 Licensed
Commercial Banks, 8 Primary Dealer Companies, Employees’ Provident Fund and the Central Depositary System of
the Colombo Stock Exchange.
The Payment and Settlement Systems Circular No. 03 of 2015 on Operator Charges and Maximum Limit on
Transaction Fees of LankaSettle System was issued with effect from 01 September 2015, through which:
- the operator charge levied by CBSL for RTGS transactions was reduced to Rs. 450 from Rs. 600, and
- the fee that can be charged by participating institutions of RTGS System from customers for fund transfers
effected through RTGS System was capped at Rs. 1,000 per transaction.
P a y m e n t s B u l l e t i n - F o u r t h Q u a r t e r 2 0 1 8
Page 6
RTGS Transactions by Type of
Participants Q4 2018
(in Volume Terms)
Chart 9
RTGS Transactions by Type of
Participants Q4 2018
(in Value Terms)
Chart
10
Total Volume and Total Value of RTGS
Transactions
Chart
7
RTGS Transactions by Type of Participants Q4 2018
Chart
8
Average Volume of RTGS
Transactions per day
Chart
11
Average Value of RTGS Transactions
per day Chart
12
P a y m e n t s B u l l e t i n - F o u r t h Q u a r t e r 2 0 1 8
Page 7
Source: Central Bank of Sri Lanka
Volume Value (Rs. billion)
Description
2017
Q4
2017
Q4
2018
Percentage
Share
Q4
2018
2017
Q4
2017
Q4
2018
Percentage
Share
Q4
2018
Before 12.00 noon 139,506 34,257 44,370 40.0 46,260.1 10,048.9 15,870.5 48.7
After 12.00 noon 237,806 61,314 66,463 60.0 46,042.6 10,245.2 16,730.7 51.3
Composition of RTGS Transactions by
Size Q4 2018
(in Volume Terms)
Chart
13
Time Distribution of RTGS Transactions
(in Volume Terms)
Chart
15 Time Distribution of RTGS Transactions
(in Value Terms)
Chart
16
Time Distribution of RTGS Transactions
Composition of RTGS Transactions by
Size Q4 2018
(in Value Terms)
Chart
14
Table: 3
neg. - negligible
P a y m e n t s B u l l e t i n - F o u r t h Q u a r t e r 2 0 1 8
Page 8
2.2 Cheques
LKR Cheque Clearing
Cheque Clearing by Size
Source: LankaClear (Pvt) Ltd.
Description
Volume (‘000)
Percentage
Change
Q4
18/17
Value (Rs. billion)
Percentage
Change
Q4
18/17
2017
Q4
2017
Q4
2018
2017
Q4
2017
Q4
2018
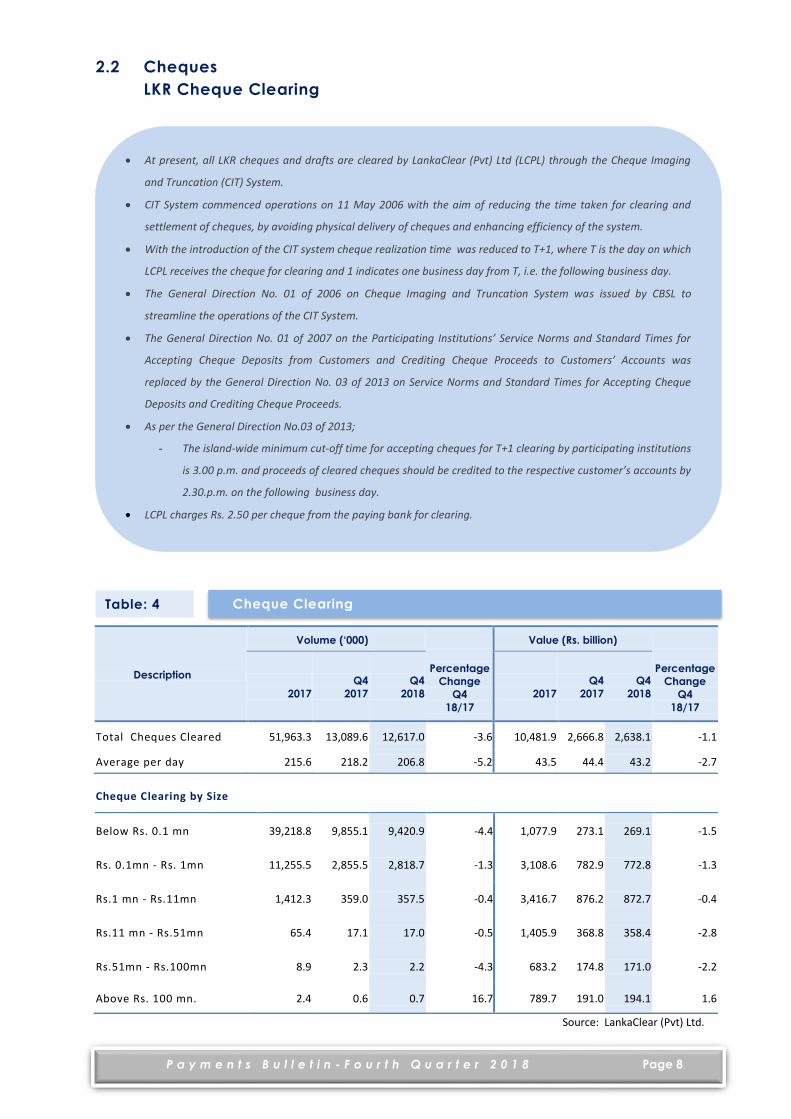
Total Cheques Cleared 51,963.3 13,089.6 12,617.0 -3.6 10,481.9 2,666.8 2,638.1 -1.1
Average per day 215.6 218.2 206.8 -5.2 43.5 44.4 43.2 -2.7
Below Rs. 0.1 mn 39,218.8 9,855.1 9,420.9 -4.4 1,077.9 273.1 269.1 -1.5
Rs. 0.1mn - Rs. 1mn 11,255.5 2,855.5 2,818.7 -1.3 3,108.6 782.9 772.8 -1.3
Rs.1 mn - Rs.11mn 1,412.3 359.0 357.5 -0.4 3,416.7 876.2 872.7 -0.4
Rs.11 mn - Rs.51mn 65.4 17.1 17.0 -0.5 1,405.9 368.8 358.4 -2.8
Rs.51mn - Rs.100mn 8.9 2.3 2.2 -4.3 683.2 174.8 171.0 -2.2
Above Rs. 100 mn. 2.4 0.6 0.7 16.7 789.7 191.0 194.1 1.6
Cheque Clearing Table: 4
At present, all LKR cheques and drafts are cleared by LankaClear (Pvt) Ltd (LCPL) through the Cheque Imaging
and Truncation (CIT) System.
CIT System commenced operations on 11 May 2006 with the aim of reducing the time taken for clearing and
settlement of cheques, by avoiding physical delivery of cheques and enhancing efficiency of the system.
With the introduction of the CIT system cheque realization time was reduced to T+1, where T is the day on which
LCPL receives the cheque for clearing and 1 indicates one business day from T, i.e. the following business day.
The General Direction No. 01 of 2006 on Cheque Imaging and Truncation System was issued by CBSL to
streamline the operations of the CIT System.
The General Direction No. 01 of 2007 on the Participating Institutions’ Service Norms and Standard Times for
Accepting Cheque Deposits from Customers and Crediting Cheque Proceeds to Customers’ Accounts was
replaced by the General Direction No. 03 of 2013 on Service Norms and Standard Times for Accepting Cheque
Deposits and Crediting Cheque Proceeds.
As per the General Direction No.03 of 2013;
- The island-wide minimum cut-off time for accepting cheques for T+1 clearing by participating institutions
is 3.00 p.m. and proceeds of cleared cheques should be credited to the respective customer’s accounts by
2.30.p.m. on the following business day.
LCPL charges Rs. 2.50 per cheque from the paying bank for clearing.
P a y m e n t s B u l l e t i n - F o u r t h Q u a r t e r 2 0 1 8
Page 9
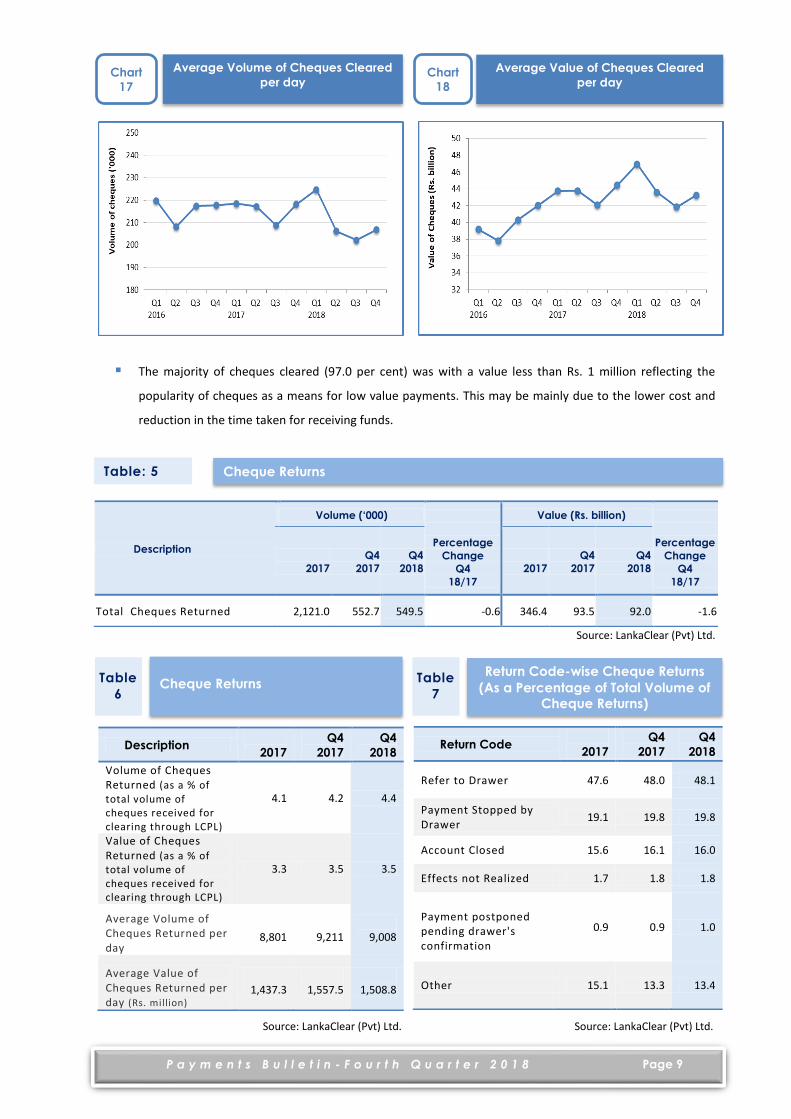
The majority of cheques cleared (97.0 per cent) was with a value less than Rs. 1 million reflecting the
popularity of cheques as a means for low value payments. This may be mainly due to the lower cost and
reduction in the time taken for receiving funds.
Source: LankaClear (Pvt) Ltd.
Description
Volume (‘000)
Percentage
Change
Q4
18/17
Value (Rs. billion)
Percentage
Change
Q4
18/17
2017
Q4
2017
Q4
2018
2017
Q4
2017
Q4
2018
Total Cheques Returned 2,121.0 552.7 549.5 -0.6 346.4 93.5 92.0 -1.6
Return Code
2017
Q4
2017
Q4
2018
Refer to Drawer 47.6 48.0 48.1
Payment Stopped by Drawer
19.1 19.8 19.8
Account Closed 15.6 16.1 16.0
Effects not Realized 1.7 1.8 1.8
Payment postponed pending drawer's confirmation
0.9 0.9 1.0
Other 15.1 13.3 13.4
Description
2017
Q4
2017
Q4
2018
Volume of Cheques Returned (as a % of total volume of cheques received for clearing through LCPL)
4.1 4.2 4.4
Value of Cheques Returned (as a % of total volume of cheques received for clearing through LCPL)
3.3 3.5 3.5
Average Volume of Cheques Returned per day
8,801
9,211
9,008
Average Value of Cheques Returned per day (Rs. million)
1,437.3
1,557.5
1,508.8
Average Volume of Cheques Cleared
per day
Chart
17
Average Value of Cheques Cleared
per day
Chart
18
Cheque Returns
Cheque Returns Return Code-wise Cheque Returns
(As a Percentage of Total Volume of Cheque Returns)
Table: 5
Table
6
Table
7
Source: LankaClear (Pvt) Ltd. Source: LankaClear (Pvt) Ltd.

P a y m e n t s B u l l e t i n - F o u r t h Q u a r t e r 2 0 1 8
Page 10
Cheque Returns by Return Code
As a Percentage of Total Cheque
Returns
Chart
23
Composition of Cheque Returns
Q4 2018 by Return Code Chart
24
Average Volume of Cheques
Returned per day
Chart
19
Total Volume of Cheque Returns as a
Percentage of Total Volume of
Cheques Received for Clearing
Chart
21
Total Value of Cheque Returns as a
Percentage of Total Value of Cheques
Received for Clearing
Chart
22
Average Value of Cheques Returned
per day
Chart
20

P a y m e n t s B u l l e t i n - F o u r t h Q u a r t e r 2 0 1 8
Page 11
US Dollar Cheque Clearing
Source: LankaClear (Pvt) Ltd.
Description
Volume
Percentage
Change
Q4
18/17
Value (US Dollar million)
Percentage
Change
Q4
18/17
2017
Q4
2017
Q4
2018
2017
Q4
2017
Q4
2018
Total Cheques Cleared 55,605 13,079 12,993 -0.7 486.2 333.3 65.7 -80.3
Cheque Clearing per day 231 218 213 -2.3 2.0 5.6 1.1 -80.4
Volume of US Dollar Cheques Cleared
Chart 25
US Dollar Cheque Clearing
Value of US Dollar Cheques Cleared
Chart 26
Table: 8
US Dollar Cheque Clearing System operated by LCPL was introduced on 1 October 2002.
The System clears ;
- US Dollar cheques/drafts issued by commercial banks in Sri Lanka payable to Sri Lankan individuals
and institutions.
- US Dollar cheques issued by Banks or Exchange Houses abroad drawn on commercial banks in Sri
Lanka.
23 Commercial Banks in Sri Lanka participate in this system and Sampath Bank PLC acts as the settlement
bank.
LCPL charges Rs. 10 per cheque/draft for clearing.

P a y m e n t s B u l l e t i n - F o u r t h Q u a r t e r 2 0 1 8
Page 12
2.3 Sri Lanka Interbank Payment (SLIP) System
Description
Volume (‘000)
Percentage
Change
Q4
18/17
Value (Rs. billion)
Percentage
Change
Q4
18/17
2017
Q4
2017
Q4
2018
2017
Q4
2017
Q4
2018
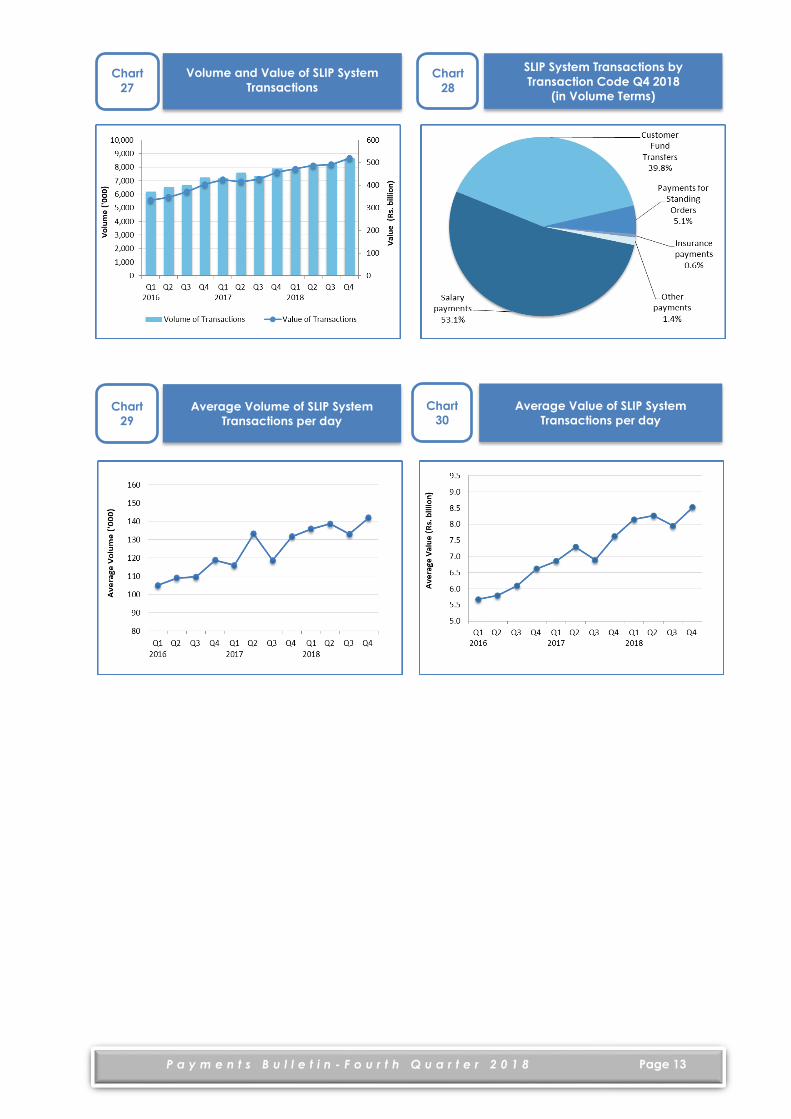
Total Transactions Cleared 30,017.8 7,894.8 8,652.0 9.6 1,725.0 457.3 519.7 13.6
Average per day 124.6 131.6 141.8 7.8 7.2 7.6 8.5 11.8
Transactions by Size
Less than Rs. 1 mn 29,771.3 7,831.0 8,580.6 9.6 1,111.3 296.2 338.8 14.4
Between Rs. 1 mn – 5 mn 246.5 63.8 71.5 12.0 613.7 161.1 180.9 12.3
Transactions by Type
Credit transactions 30,002.3 7,891.0 8,648.9 9.6 1,711.2 453.9 516.0 13.7
Debit transactions 15.5 3.8 3.1 -18.2 13.9 3.4 3.7 8.1
Source: LankaClear (Pvt) Ltd.
SLIP System which accounted for 13.0 per cent of the value of total non-cash retail payments has been
used mainly for salary payments.
Transaction Volumes and Values of SLIP System Table: 9
SLIP System is operated by LCPL.
SLIP System provides facility for settlements on T + 0 basis on each business day, for payment instructions
submitted before the cut-off time specified by the respective financial institutions.
SLIP System has the facility of accepting payment instructions for T + n (where n=0 to 14 days).
Low value transactions including customer transfers, standing orders and low value bulk payments such as
salaries are effected through this system.
A maximum limit of Rs. 5 million per transaction was imposed with effect from 29 October 2010.
As at end of the fourth quarter of 2018, there were 46 participants in the SLIP System, i.e. CBSL and 25 Licensed
Commercial Banks as primary members and, 5 Licensed Specialized Banks and 15 Finance Companies, as
secondary members.
LCPL charges Rs. 3.50 per transaction from Presenting Financial Institution.
The Payment and Settlement Systems Circular No. 02 of 2015 on Maximum Limit on Transaction Fees of Sri Lanka
Interbank Payment System was issued with effect from 01 September 2015, by which:
- CBSL imposed the maximum fee that can be charged from a customer for a fund transfer effected
through SLIP System as Rs. 50
P a y m e n t s B u l l e t i n - F o u r t h Q u a r t e r 2 0 1 8
Page 13
Average Value of SLIP System
Transactions per day
Chart
30
SLIP System Transactions by
Transaction Code Q4 2018
(in Volume Terms)
Chart
28
Volume and Value of SLIP System
Transactions
Chart
27
Average Volume of SLIP System
Transactions per day
Chart
29

P a y m e n t s B u l l e t i n - F o u r t h Q u a r t e r 2 0 1 8
Page 14
2.4 Payment Cards and Mobile Phone based Payment Mechanisms
2.4.1 Payment Cards
In order to regulate and supervise activities of service providers of payment cards and mobile phone based payment
systems, the Service Providers of Payment Card Regulations No. 1 of 2009, were issued in July 2009.
The above regulation was replaced by the Payment Cards and Mobile Payment Systems Regulations No. 1 of 2013
(Regulations) on 07 June 2013.
In terms of the Regulations, Issuers of Payment Cards, Financial Acquirers of Payment Cards, Operators of Customer
Account based Mobile Payment Systems and Operators of Mobile Phone based e-money Systems should obtain licences
from CBSL to engage in the business or function as service providers of Payment Cards and/or Mobile Payment
Systems.
As per the Regulations, service providers of payment cards include issuers of payment cards (debit cards, credit
cards, charge cards and stored value cards) and financial acquirers of payment cards.
Licensed Service Providers of Payment Cards (as at 31 December 2018)
Class of Business Number of Service
Providers
Issuers of Debit Cards 32
Issuers of Credit Cards 17
Issuers of Stored Value Cards 9
Financial Acquirers of Payment Cards 10
Source: Central Bank of Sri Lanka

P a y m e n t s B u l l e t i n - F o u r t h Q u a r t e r 2 0 1 8
Page 15
(a) Credit Cards
\\\
(a) Provisional Source: Licensed Commercial Banks Licensed Finance Companies
Description
2017
Q4
2017
Q40
20180
(a)0
Percentage Change
Q4
17/16
Q4
18/17
1 Number of cards issued during the period 290,264 85,043 90,299 6.2 6.2
2 Total number of cards in use (as at end period) 1,486,545 1,486,545 1,715,369 13.0 15.4
3 Total volume of transactions (million) 37.0 10.0 12.2 10.8 22.7
4 Total value of transactions (Rs. billion) 198.5 55.0 69.3 12.9 26.0
Credit Card Transactions
Number of New Credit Cards Issued and
Total Number of Credit Cards in Use Chart
32
Credit Card Transactions Chart
31
Table: 10
In 1989, commercial banks commenced issuing credit cards in Sri Lanka.
The Credit Card Operational Guidelines No. 1 of 2010 were issued to streamline the operations of the credit card
business.
At end of the fourth quarter 2018, 14 Licensed Commercial Banks and 3 Finance Companies had been licensed to
engage in credit card business.
Stamp duty for credit cards on usage of credit facility for the purchase of goods or services or the withdrawal of
money where the merchant country (the country in which the purchase of goods or services or the withdrawal of
money has taken place) is a country other than Sri Lanka is set at Rs. 25.00 per every Rs. 1,000.00 or part thereof
from 01 January 2016.
P a y m e n t s B u l l e t i n - F o u r t h Q u a r t e r 2 0 1 8
Page 16
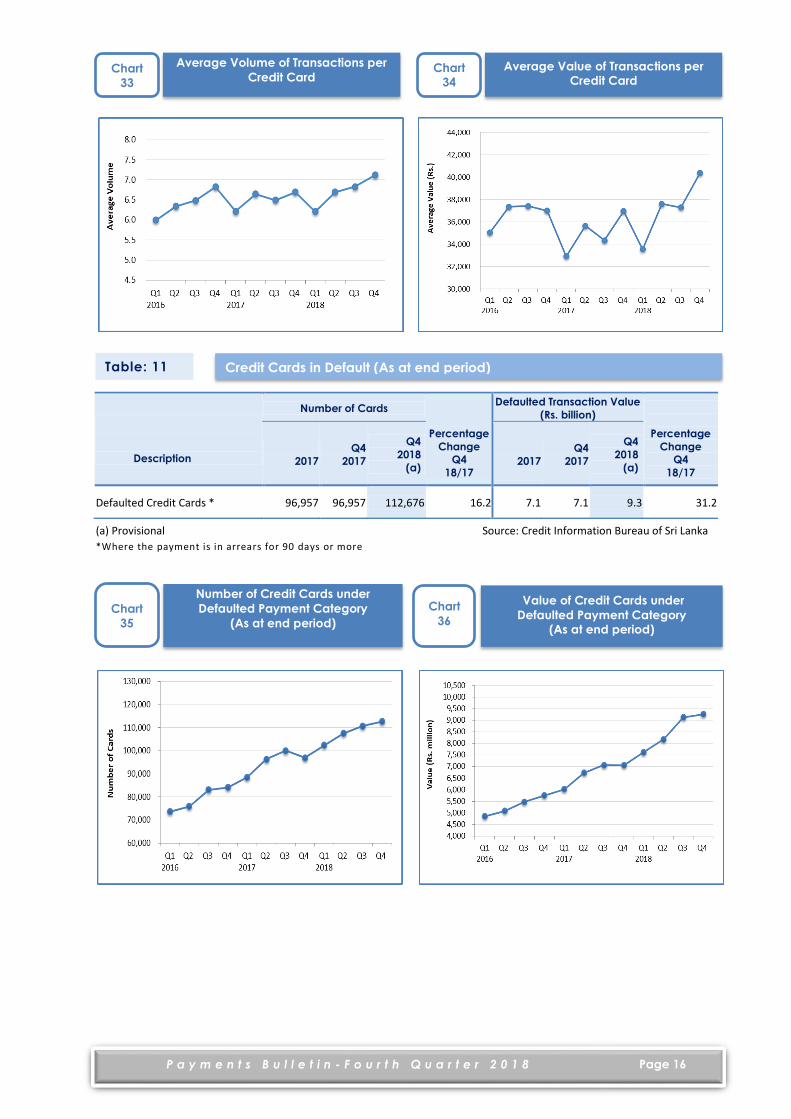
(a) Provisional Source: Credit Information Bureau of Sri Lanka
*Where the payment is in arrears for 90 days or more
Description
Number of Cards
Percentage
Change
Q4
18/17
Defaulted Transaction Value
(Rs. billion)
Percentage
Change
Q4
18/17
2017
Q4
2017
Q4
2018
(a)
2017
Q4
2017
Q4
2018
(a)
Defaulted Credit Cards * 96,957 96,957 112,676 16.2 7.1 7.1 9.3 31.2
Average Volume of Transactions per
Credit Card
Chart
33
Average Value of Transactions per
Credit Card Chart
34
Number of Credit Cards under
Defaulted Payment Category
(As at end period)
Chart
35
Value of Credit Cards under
Defaulted Payment Category
(As at end period)
Chart
36
Credit Cards in Default (As at end period) Table: 11
P a y m e n t s B u l l e t i n - F o u r t h Q u a r t e r 2 0 1 8
Page 17
(b) Debit Cards
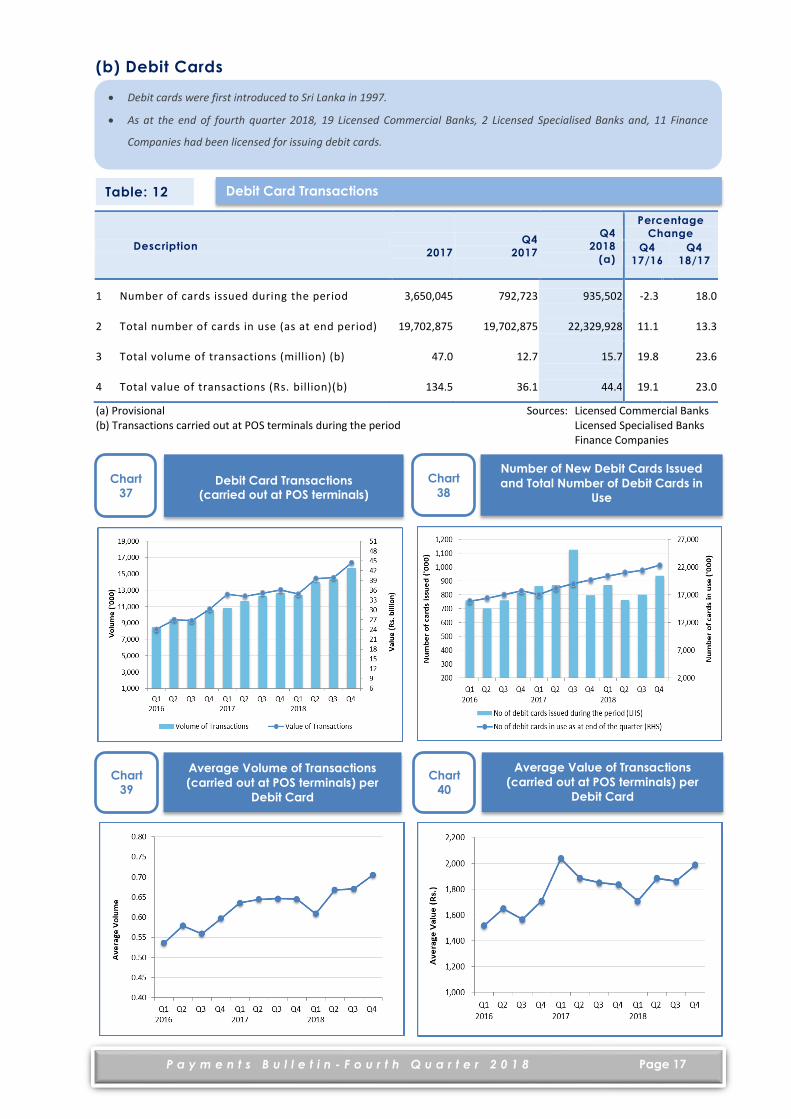
(a) Provisional Sources: Licensed Commercial Banks (b) Transactions carried out at POS terminals during the period Licensed Specialised Banks Finance Companies
Description
2017
Q4
2017
Q40
20180
(a)0
Percentage
Change
Q4
17/16
Q4
18/17
1 Number of cards issued during the period 3,650,045 792,723 935,502 -2.3 18.0
2 Total number of cards in use (as at end period) 19,702,875 19,702,875 22,329,928 11.1 13.3
3 Total volume of transactions (million) (b) 47.0 12.7 15.7 19.8 23.6
4 Total value of transactions (Rs. billion)(b) 134.5 36.1 44.4 19.1 23.0
Debit Card Transactions
Number of New Debit Cards Issued
and Total Number of Debit Cards in
Use
Chart
38
Debit Card Transactions (carried out at POS terminals)
Chart
37
Average Volume of Transactions
(carried out at POS terminals) per
Debit Card
Chart
39
Average Value of Transactions
(carried out at POS terminals) per
Debit Card
Chart
40
Table: 12
Debit cards were first introduced to Sri Lanka in 1997.
As at the end of fourth quarter 2018, 19 Licensed Commercial Banks, 2 Licensed Specialised Banks and, 11 Finance
Companies had been licensed for issuing debit cards.
P a y m e n t s B u l l e t i n - F o u r t h Q u a r t e r 2 0 1 8
Page 18
2.4.2 Payment Card Infrastructure
(a) Automated Teller Machines
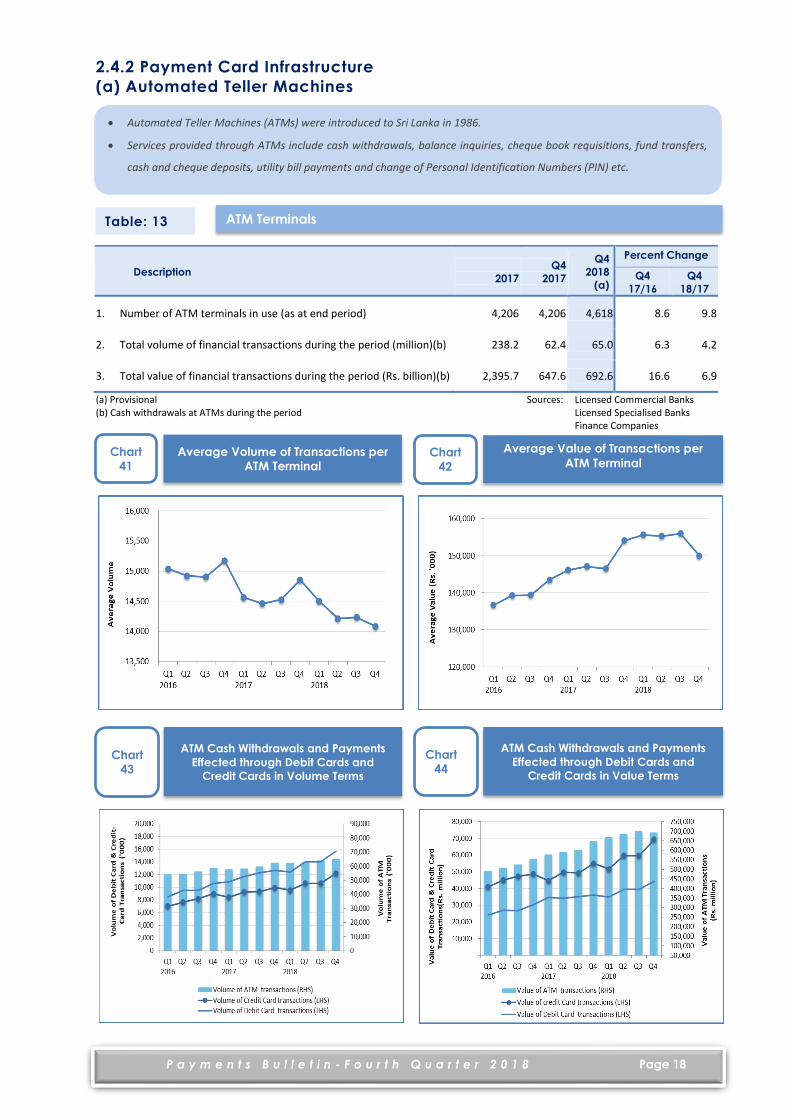
(a) Provisional Sources: Licensed Commercial Banks (b) Cash withdrawals at ATMs during the period Licensed Specialised Banks Finance Companies
Description
2017
Q4
2017
Q4
2018
(a)
Percent Change
Q4
17/16
Q4
18/17
1. Number of ATM terminals in use (as at end period) 4,206 4,206 4,618 8.6 9.8
2. Total volume of financial transactions during the period (million)(b) 238.2 62.4 65.0 6.3 4.2
3. Total value of financial transactions during the period (Rs. billion)(b) 2,395.7 647.6 692.6 16.6 6.9
ATM Terminals
Average Volume of Transactions per
ATM Terminal
Chart
41
Average Value of Transactions per
ATM Terminal
Chart
42
ATM Cash Withdrawals and Payments
Effected through Debit Cards and
Credit Cards in Volume Terms
Chart
43
ATM Cash Withdrawals and Payments
Effected through Debit Cards and
Credit Cards in Value Terms
Chart
44
Table: 13
Automated Teller Machines (ATMs) were introduced to Sri Lanka in 1986.
Services provided through ATMs include cash withdrawals, balance inquiries, cheque book requisitions, fund transfers,
cash and cheque deposits, utility bill payments and change of Personal Identification Numbers (PIN) etc.

P a y m e n t s B u l l e t i n - F o u r t h Q u a r t e r 2 0 1 8
Page 19
(b) Point of Sale Terminals
(a) Provisional Source: Licensed Financial Acquirers of Payment Cards
Description
2017
Q4
2017
Q40
20180
(a)0
Percentage Change
Q4
17/16
Q4
18/17
1 Number of POS terminals in use (as at end period) 48,828 48,828 62,652 12.6 28.3
2 Total volume of transactions during the period (million) 84.0 23.2 28.6 21.5 23.3
3 Total value of transactions during the period (Rs. billion) 432.7 121.4 154.0 15.4 26.9
Payments at POS Terminals
Average Volume of Transactions per
POS Terminal
Chart
45
Average Value of Transactions per
POS Terminal
Chart
46
Table: 14
Point of Sale (POS) terminals were introduced to Sri Lanka in 1994.
POS terminals allow customers to make payments through credit, debit and stored value cards at merchants’
outlets.
As at end of the fourth quarter of 2018, 9 Licensed Commercial Banks and 1 Private Company had been licensed to
function as Financial Acquirers of Payment Cards.
All Financial Acquirers of Payment Cards in Sri Lanka upgraded their POS terminals with the Terminal Line
Encryption technology by 31 March 2013, adhering to the directive given by CBSL to enhance the security of
payment card transactions.
In 2014, CBSL instructed all financial acquirers to ensure that merchants acquired by them do not engage in double
swiping (i.e. merchants swiping payment cards in devices other than POS terminals provided by financial acquirers)
with the intention of protecting card holder data from unauthorized use.

P a y m e n t s B u l l e t i n - F o u r t h Q u a r t e r 2 0 1 8
Page 20
2.4.3 Mobile Phone based Payment Mechanisms
(a) Customer Account based Mobile Payment Systems
(a) Provisional Source: Licensed Commercial Banks
(b) Mobile Phone based e-money Systems
Description
Volume
Percentage
Change
Q4
18/17
Value (Rs. million)
Percentage
Change
Q4
18/17
2017
Q4
2017
Q4
2018
(a)
2017
Q4
2017
Q4
2018
(a)
Total Transactions (during the period)
3,799,441 947,774 2,955,242 211.8 31,436.5 12,429.4 50,522.4 306.5
Mobile Phone Banking Table: 15
Service Providers of Mobile Payment Systems (Operators of Customer Account based Mobile Payment Systems and
Operators of Mobile Phone based e-money Systems) are required to obtain licences from CBSL to function as service
providers of mobile payment systems.
Licensed Service Providers of Mobile Payment Systems
(As at end of the fourth quarter 2018)
Class of Business Number of Licensed
Service Providers
Operators of Customer Account based Mobile Payment Systems 12
Operators of Mobile Phone based e-money Systems 2
Customer Account based Mobile Payment Systems (Mobile Phone Banking) provide the facility to customers of
licensed service providers to access their accounts through their mobile phones.
The Mobile Payments Guidelines No. 1 of 2011 were issued by CBSL to streamline the Mobile Phone Banking services.
Mobile phone based e-money systems issue monetary value upon receipt of funds and store electronically for the
purpose of using for payments.
The Mobile Payments Guidelines No. 2 of 2011 were issued to streamline the custodian account based mobile
payment services.
In June 2012, a mobile network operator obtained a licence from CBSL to operate the first mobile phone based e-
money system, while another mobile network operator was licensed and commenced operations of its mobile phone
based e-money system in November 2013.

P a y m e n t s B u l l e t i n - F o u r t h Q u a r t e r 2 0 1 8
Page 21
Source: Operators of Mobile Phone based e-money Systems
2.5 Internet based Payment Systems
Description
Volume (‘000)
Percentage
Change
Q4
18/17
Value (Rs. billion)
Percentage
Change
Q4
18/17
2017
Q4
2017
Q4
2018
(a)
2017
Q4
2017
Q4
2018
(a)
Total financial transactions (during the period)
23,065.6 6,410.8 7,625.4 18.9 2,100.6 637.9 670.4 5.1
(a) Provisional Sources: Licensed Commercial Banks
Licensed Specialised Banks
Finance Companies
Reflecting the growing popularity of Internet banking, volume and value of financial transactions effected
through Internet banking continued to increase during the fourth quarter of 2018.
This growing popularity may be mainly due to customer convenience, time saving benefits and various
promotional measures and awareness programmes carried out by the banks to enhance the usage of
Internet banking.
Internet based Payment Systems
Composition of Mobile Phone based
e-money Transactions in Q4 2018
(in Volume Terms)
Chart
47
Composition of Mobile Phone based
e-money Transactions in Q4 2018
(in Value Terms)
Chart
48
Table: 16
Internet banking which allows bank customers to access banking services in a convenient and efficient manner through
Internet was introduced in Sri Lanka in 1999.
Financial institutions offer facilities through Internet banking, for customers mainly to obtain account information,
apply or subscribe for financial products/services, perform own account/ third party fund transfers and pay utility bills.
P a y m e n t s B u l l e t i n - F o u r t h Q u a r t e r 2 0 1 8
Page 22
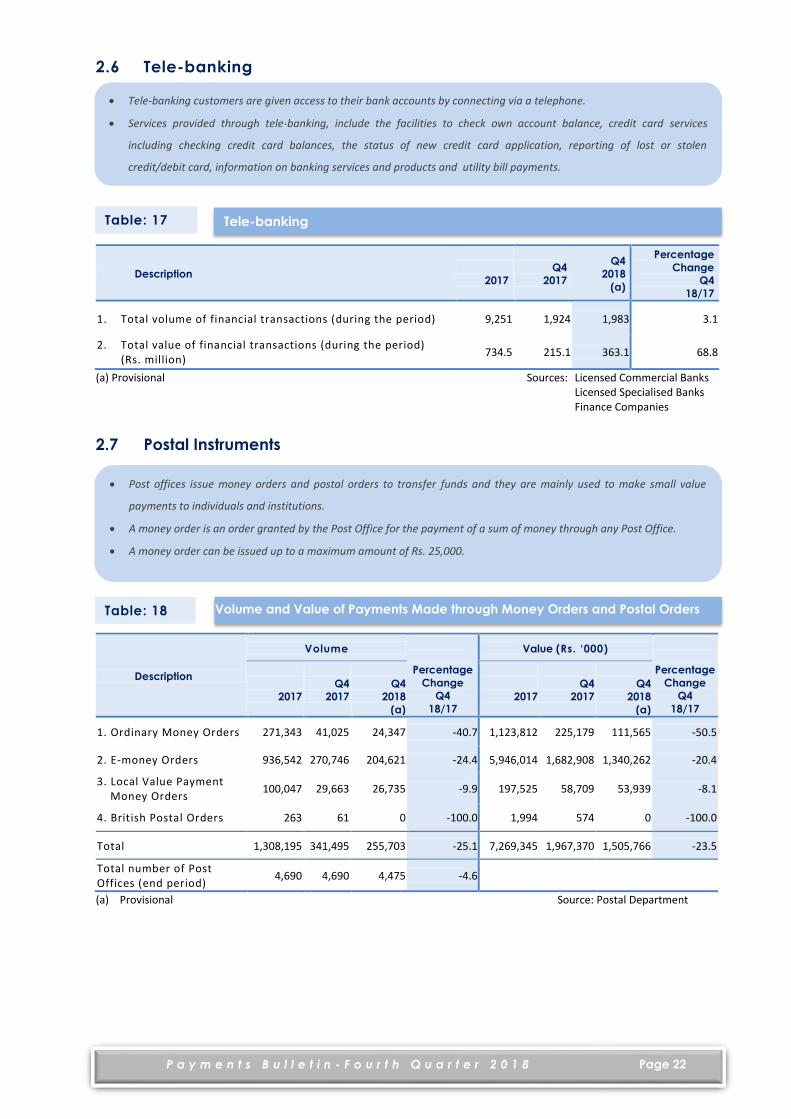
2.6 Tele-banking
(a) Provisional Sources: Licensed Commercial Banks Licensed Specialised Banks Finance Companies
2.7 Postal Instruments
Description
Volume
Percentage
Change
Q4
18/17
Value (Rs. ‘000)
Percentage
Change
Q4
18/17
2017
Q4
2017
Q4
2018
(a)
2017
Q4
2017
Q4
2018
(a)
1. Ordinary Money Orders 271,343 41,025 24,347 -40.7 1,123,812 225,179 111,565 -50.5
2. E-money Orders 936,542 270,746 204,621 -24.4 5,946,014 1,682,908 1,340,262 -20.4
3. Local Value Payment Money Orders
100,047 29,663 26,735 -9.9 197,525 58,709 53,939 -8.1
4. British Postal Orders 263 61 0 -100.0 1,994 574 0 -100.0
Total 1,308,195 341,495 255,703 -25.1 7,269,345 1,967,370 1,505,766 -23.5
Total number of Post Offices (end period)
4,690 4,690 4,475 -4.6
(a) Provisional Source: Postal Department
Description
2017
Q4
2017
Q4
2018
(a)
Percentage
Change
Q4
18/17
1. Total volume of financial transactions (during the period) 9,251 1,924 1,983 3.1
2. Total value of financial transactions (during the period) (Rs. million)
734.5 215.1 363.1 68.8
Volume and Value of Payments Made through Money Orders and Postal Orders
Tele-banking Table: 17
Table: 18
Tele-banking customers are given access to their bank accounts by connecting via a telephone.
Services provided through tele-banking, include the facilities to check own account balance, credit card services
including checking credit card balances, the status of new credit card application, reporting of lost or stolen
credit/debit card, information on banking services and products and utility bill payments.
Post offices issue money orders and postal orders to transfer funds and they are mainly used to make small value
payments to individuals and institutions.
A money order is an order granted by the Post Office for the payment of a sum of money through any Post Office.
A money order can be issued up to a maximum amount of Rs. 25,000.
P a y m e n t s B u l l e t i n - F o u r t h Q u a r t e r 2 0 1 8
Page 23
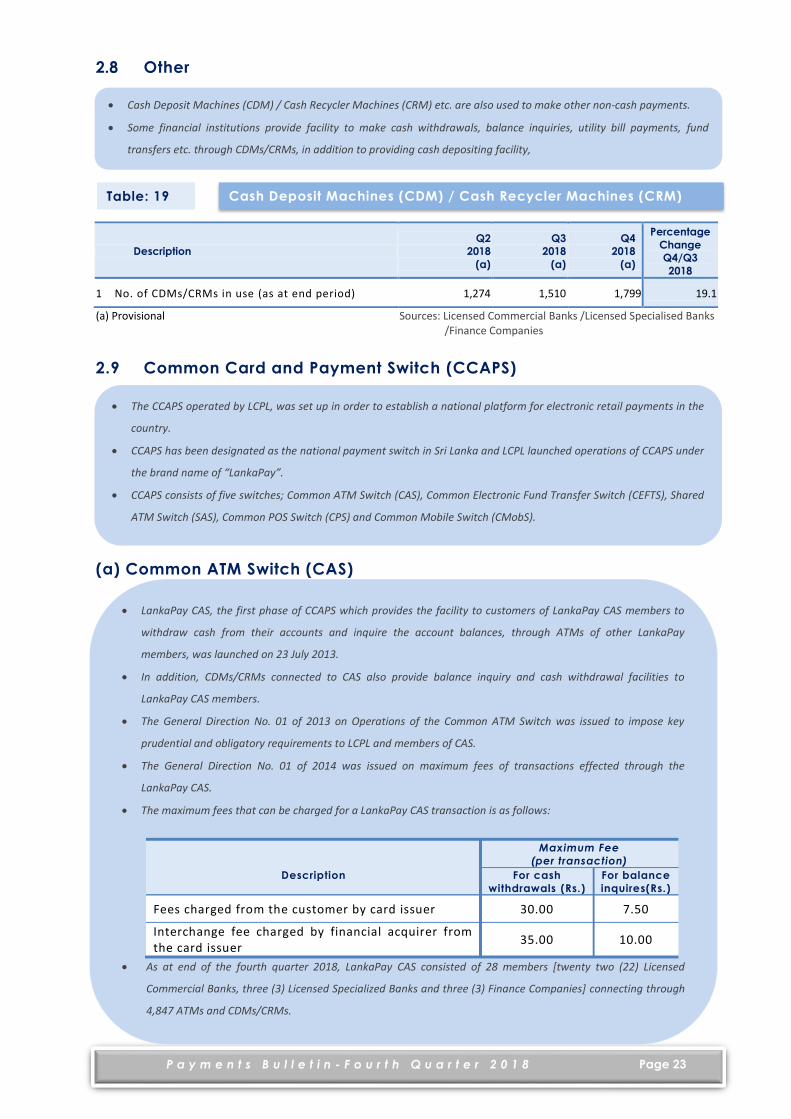
2.8 Other
(a) Provisional Sources: Licensed Commercial Banks /Licensed Specialised Banks /Finance Companies
2.9 Common Card and Payment Switch (CCAPS)
(a) Common ATM Switch (CAS)
Description
Q2
2018
(a)
Q3
2018
(a)
Q40
20180
(a)0
Percentage
Change
Q4/Q3
2018
1 No. of CDMs/CRMs in use (as at end period) 1,274 1,510 1,799 19.1
The CCAPS operated by LCPL, was set up in order to establish a national platform for electronic retail payments in the
country.
CCAPS has been designated as the national payment switch in Sri Lanka and LCPL launched operations of CCAPS under
the brand name of “LankaPay”.
CCAPS consists of five switches; Common ATM Switch (CAS), Common Electronic Fund Transfer Switch (CEFTS), Shared
ATM Switch (SAS), Common POS Switch (CPS) and Common Mobile Switch (CMobS).
LankaPay CAS, the first phase of CCAPS which provides the facility to customers of LankaPay CAS members to
withdraw cash from their accounts and inquire the account balances, through ATMs of other LankaPay
members, was launched on 23 July 2013.
In addition, CDMs/CRMs connected to CAS also provide balance inquiry and cash withdrawal facilities to
LankaPay CAS members.
The General Direction No. 01 of 2013 on Operations of the Common ATM Switch was issued to impose key
prudential and obligatory requirements to LCPL and members of CAS.
The General Direction No. 01 of 2014 was issued on maximum fees of transactions effected through the
LankaPay CAS.
The maximum fees that can be charged for a LankaPay CAS transaction is as follows:
Maximum Fee
(per transaction)
Description For cash
withdrawals (Rs.)
For balance
inquires(Rs.)
Fees charged from the customer by card issuer 30.00 7.50
Interchange fee charged by financial acquirer from the card issuer
35.00 10.00
As at end of the fourth quarter 2018, LankaPay CAS consisted of 28 members [twenty two (22) Licensed
Commercial Banks, three (3) Licensed Specialized Banks and three (3) Finance Companies] connecting through
4,847 ATMs and CDMs/CRMs.
Cash Deposit Machines (CDM) / Cash Recycler Machines (CRM) etc. are also used to make other non-cash payments.
Some financial institutions provide facility to make cash withdrawals, balance inquiries, utility bill payments, fund
transfers etc. through CDMs/CRMs, in addition to providing cash depositing facility,
Cash Deposit Machines (CDM) / Cash Recycler Machines (CRM) Table: 19

P a y m e n t s B u l l e t i n - F o u r t h Q u a r t e r 2 0 1 8
Page 24
(a) Cash withdrawals at ATMs and CDMs/CRMs during the period Source: LankaClear (Pvt) Ltd.
(b) Common Electronic Fund Transfer Switch (CEFTS)
Description
2017
Q4
2017
Q40
20180
Percentage
Change
Q4
18/17
1 Number of CAS members (as at end period) 27 27 28 3.7
2 Number of ATMs and CDMs connected to CAS (as at end period)
4,450 4,450 4,847 8.9
3 Total volume of financial transactions (‘000) (a) 32,921.2 9,261.1 11,074.8 19.6
4 Total value of financial transactions (Rs. million) (a) 264,086.6 75,956.0 96,259.2 26.7
Common ATM Switch (CAS)
Average Volume of CAS Transactions
per day
Chart
49
Average Value of CAS Transactions
per day
Chart
50
Table: 20
LankaPay CEFTS, the second phase of CCAPS, which provide the real-time, retail fund transfer facilities to
customers of LankaPay CEFTS members through payment channels such as Internet Banking, Mobile Banking,
Kiosks, Over the Counter (OTC) and Automated Teller Machines (ATM), was launched on 21 August 2015.
As at end of the fourth quarter 2018, CEFTS consisted of thirty six (36) members [twenty five (25) licensed
commercial banks three (3) licensed specialized banks and eight (8) Finance Companies].
The General Direction No. 02 of 2014 was issued by CBSL imposing key prudential and obligatory requirements
to LCPL and members of CEFTS. This was replaced by the General Direction No. 01 of 2018 on Operations of the
Common Electronic Fund Transfer Switch to facilitate increasing the number of clearing cycles in CEFTS.
Maximum fee that can be charged from a customer for a CEFTS transaction is as follows:
Fund Transfer mode
Maximum Fee
(per transaction)
(Rs.)
Effected through Internet Banking, Mobile Banking, ATMs of respective
CEFTS members
50.00
Effected through ATMs of other CEFTS members 100.00
Effected Over-the-Counter 100.00
P a y m e n t s B u l l e t i n - F o u r t h Q u a r t e r 2 0 1 8
Page 25
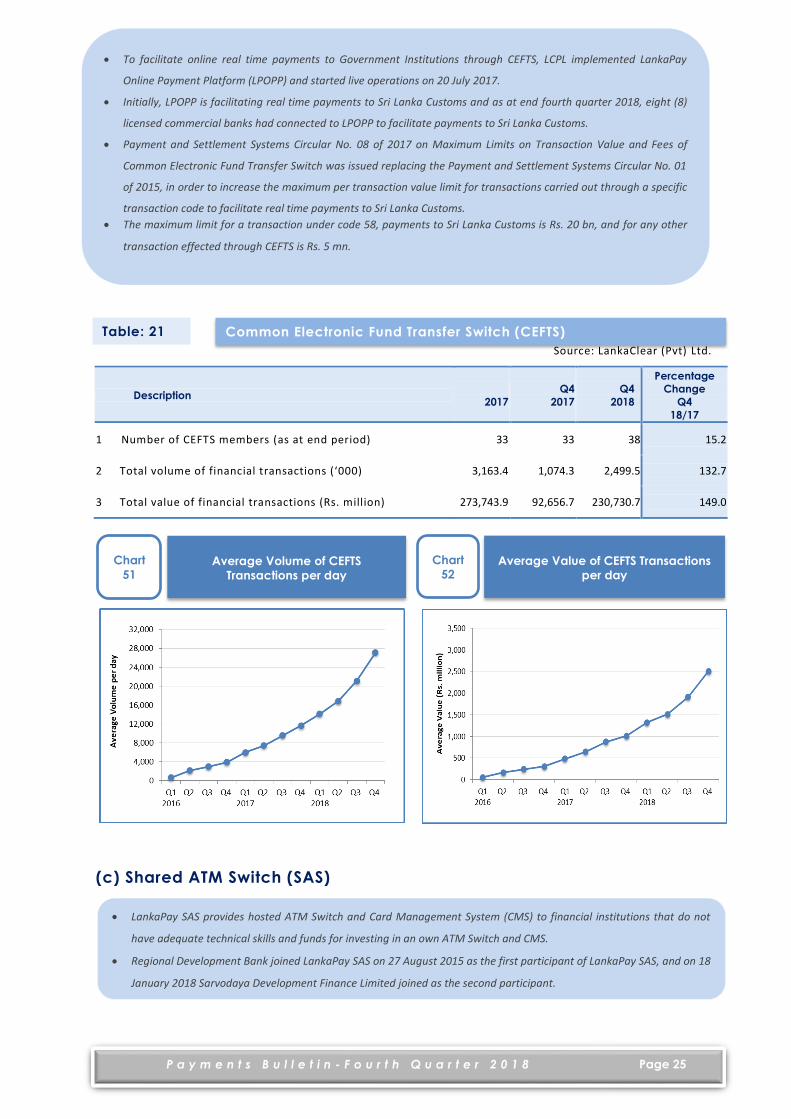
Source: LankaClear (Pvt) Ltd.
(c) Shared ATM Switch (SAS)
Description
2017
Q4
2017
Q40
20180
Percentage
Change
Q4
18/17
1 Number of CEFTS members (as at end period) 33 33 38 15.2
2 Total volume of financial transactions (‘000) 3,163.4 1,074.3 2,499.5 132.7
3 Total value of financial transactions (Rs. million) 273,743.9 92,656.7 230,730.7 149.0
Common Electronic Fund Transfer Switch (CEFTS) Table: 21
Average Volume of CEFTS
Transactions per day
Chart
51
Average Value of CEFTS Transactions
per day
Chart
52
LankaPay SAS provides hosted ATM Switch and Card Management System (CMS) to financial institutions that do not
have adequate technical skills and funds for investing in an own ATM Switch and CMS.
Regional Development Bank joined LankaPay SAS on 27 August 2015 as the first participant of LankaPay SAS, and on 18
January 2018 Sarvodaya Development Finance Limited joined as the second participant.
To facilitate online real time payments to Government Institutions through CEFTS, LCPL implemented LankaPay
Online Payment Platform (LPOPP) and started live operations on 20 July 2017.
Initially, LPOPP is facilitating real time payments to Sri Lanka Customs and as at end fourth quarter 2018, eight (8)
licensed commercial banks had connected to LPOPP to facilitate payments to Sri Lanka Customs.
Payment and Settlement Systems Circular No. 08 of 2017 on Maximum Limits on Transaction Value and Fees of
Common Electronic Fund Transfer Switch was issued replacing the Payment and Settlement Systems Circular No. 01
of 2015, in order to increase the maximum per transaction value limit for transactions carried out through a specific
transaction code to facilitate real time payments to Sri Lanka Customs.
The maximum limit for a transaction under code 58, payments to Sri Lanka Customs is Rs. 20 bn, and for any other
transaction effected through CEFTS is Rs. 5 mn.
P a y m e n t s B u l l e t i n - F o u r t h Q u a r t e r 2 0 1 8
Page 26
Description
2017
Q4
2017
Q40
2018 0
Percentage Change
Q4
17/16
Q4
18/17
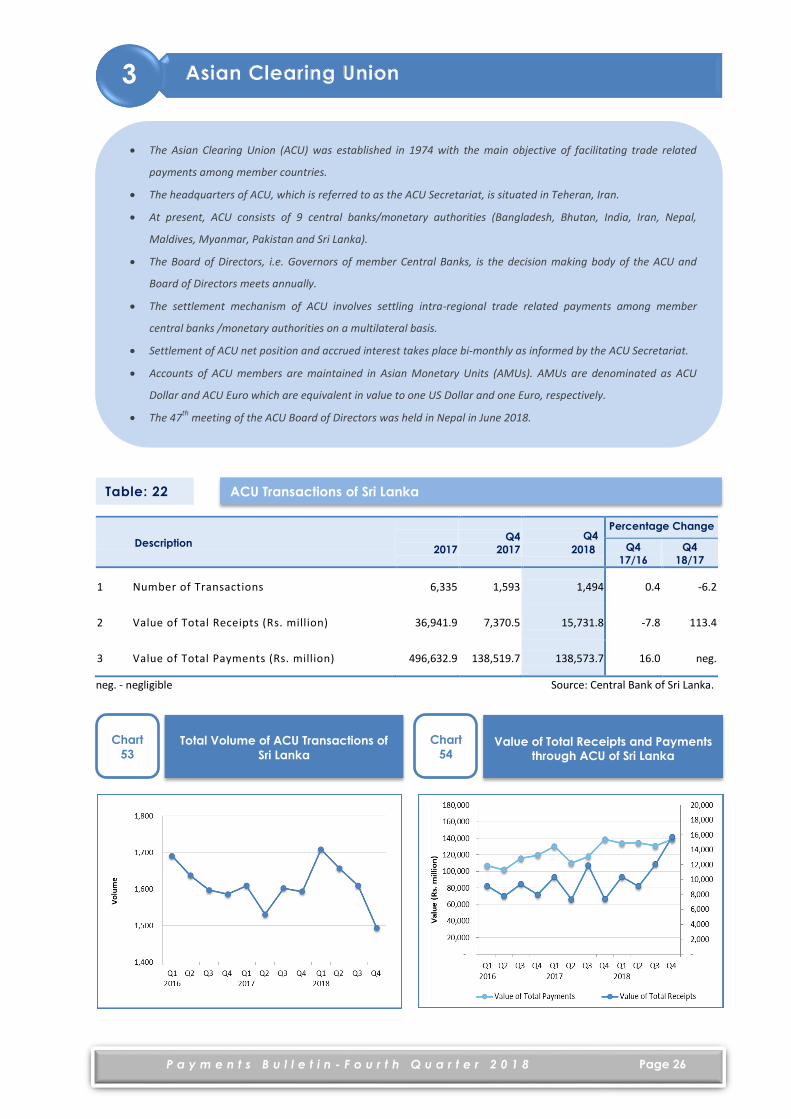
1 Number of Transactions 6,335 1,593 1,494 0.4 -6.2
2 Value of Total Receipts (Rs. million) 36,941.9 7,370.5 15,731.8 -7.8 113.4
3 Value of Total Payments (Rs. million) 496,632.9 138,519.7 138,573.7 16.0 neg.
neg. - negligible Source: Central Bank of Sri Lanka.
ACU Transactions of Sri Lanka
Total Volume of ACU Transactions of
Sri Lanka
Chart
53 Value of Total Receipts and Payments
through ACU of Sri Lanka
Chart
54
Table: 22
3 Asian Clearing Union
The Asian Clearing Union (ACU) was established in 1974 with the main objective of facilitating trade related
payments among member countries.
The headquarters of ACU, which is referred to as the ACU Secretariat, is situated in Teheran, Iran.
At present, ACU consists of 9 central banks/monetary authorities (Bangladesh, Bhutan, India, Iran, Nepal,
Maldives, Myanmar, Pakistan and Sri Lanka).
The Board of Directors, i.e. Governors of member Central Banks, is the decision making body of the ACU and
Board of Directors meets annually.
The settlement mechanism of ACU involves settling intra-regional trade related payments among member
central banks /monetary authorities on a multilateral basis.
Settlement of ACU net position and accrued interest takes place bi-monthly as informed by the ACU Secretariat.
Accounts of ACU members are maintained in Asian Monetary Units (AMUs). AMUs are denominated as ACU
Dollar and ACU Euro which are equivalent in value to one US Dollar and one Euro, respectively.
The 47th
meeting of the ACU Board of Directors was held in Nepal in June 2018.

P a y m e n t s B u l l e t i n - F o u r t h Q u a r t e r 2 0 1 8
Page 27
Source: SWIFT
Source: SWIFT
Description
Sri Lanka Worldwide
2017
Q4
2017
Q4
2018
2017
Q4
2017
Q4
2018
SWIFT users (end of period) 38 38 38 11,336 11,336 11,324
Description
2017
Q4
2017
Q4
2018
Percentage Change
Q4
17/16
Q4
18/17
1 All messages sent by domestic users 5,501,327 1,351,296 1,524,240 -2.2 12.8
Customer fund transfers messages 841,087 215,755 217,849 6.5 1.0
Bank fund transfers messages 493,212 130,394 133,072 11.9 2.1
2 All messages received by domestic users 5,702,094 1,411,441 1,546,417 -1.8 9.6
Customer fund transfers messages 1,901,223 487,120 440,910 4.1 -9.5
Bank fund transfers messages 167,558 46,562 51,507 22.6 10.6
3 Domestic SWIFT Traffic 1,935,594 440,428 526,633 -15.1 19.6
4 Global SWIFT Traffic (million) 7,076 1,837 2,040 8.8 11.1
Participation in SWIFT by Financial Institutions
SWIFT Message Flow in Sri Lanka
Table: 23
4 Society for Worldwide Interbank Financial Telecommunication
Table: 24
The Society for Worldwide Interbank Financial Telecommunication (SWIFT) is an internationally accepted
communication system which exchanges financial transaction information through standardized messages on a
secured platform.
SWIFT was launched in 1973 as a member owned cooperative. Currently, all members are considered as
shareholders of the system and the share is determined according to their usage.
SWIFT is used in more than 11,000 financial institutions over 200 countries.
Sri Lanka SWIFT participants can connect to SWIFT via two connectivity options; Direct connectivity or through
Lanka Financial Services Bureau (LFSB) Ltd.
The LFSB was established in 2007 to obtain connectivity through a service bureau and currently 26 institutions
(CBSL, 16 Licensed Commercial Banks, 7 Primary Dealer Companies, one Finance Company and the Central
Depository System of Colombo Stock Exchange) are obtaining services through LFSB.

P a y m e n t s B u l l e t i n - F o u r t h Q u a r t e r 2 0 1 8
Page 28
Payment
Systems/Instruments
2014 2015
2016 2017
2018
(a)
Large Value Payment Systems
RTGS System Volume of transactions (‘000) 317.9 322.2 366.0 377.3 405.2
Value of transactions (Rs. bn) 59,551.0 84,432.0 93,377.9 92,302.7 100,473.1
Retail Value Payment Systems
Main Cheque Clearing System (b) Volume of transactions (‘000) 48,051.8 49,325.7 51,995.8 51,963.3 50,352.2
Value of transactions (Rs. bn) 7,640.5 8,434.0 9,601.5 10,481.9 10,528.4
Sri Lanka Interbank Payment System (SLIPS) Volume of transactions (‘000) 20,421.5 23,279.3 26,646.7 30,017.8 32,943.3
Value of transactions (Rs. bn) 893.5 1,169.1 1,457.5 1,725.0 1,972.2
Credit Cards No. of cards in use (g) 1,032,833 1,145,055 1,315,915 1,486,545 1,715,369
Volume of transactions (‘000) 23,631.9 26,334.7 31,857.7 36,964.2 43,599.8
Value of transactions (Rs. bn) 134.6 154.2 182.1 198.5 241.8
Debit Cards (e) No. of cards in use (g) 13,591,317 15,243,811 17,732,516 19,702,875 22,329,928
Volume of transactions (‘000) 22,699.5 30,686.4 38,083.5 46,963.8 56,595.1
Value of transactions (Rs. bn) 61.9 83.1 108.0 134.5 158.7
ATM Terminals (f) No. of ATM Terminals (g) 3,344 3,572 3,874 4,206 4,618
Volume of transactions (‘000) 176,060.6 203,113.0 223,680.2 238,249.9 253,759.8
Value of transactions (Rs. bn) 1,337.8 1,731.5 2,082.6 2,395.7 2,744.9
POS Terminals No. of POS Terminals (g) 34,904 40,539 43,355 48,828 62,652
Volume of transactions (‘000) 45,035.6 54,604.6 70,024.0 83,988.3 102,893.4
Value of transactions (Rs. bn) 230.4 278.5 359.0 432.7 538.4
Mobile Phone Banking Volume of transactions (‘000) 717.6 1,980.3 3,433.0 3,799.4 8,168.0
Value of transactions (Rs. bn) 7.8 11.3 14.6 31.4 142.4
Internet Banking Volume of transactions (‘000) 10,817.8 13,725.2 18,163.6 23,065.6 26,978.8
Value of transactions (Rs. bn) 983.8 1,204.9 1,588.6 2,100.6 2,933.0
Tele-banking Volume of transactions (‘000) 14.2 12.5 11.1 9.3 8.3
Value of transactions (Rs. bn) 1.0 1.0 0.9 0.7 0.9
Transactions cleared through CCAPS
Common ATM Switch (CAS) (c)(f)(h) Volume of transactions (‘000) 5,679.6 12,973.4 22,803.2 32,921.2 40,464.4
Value of transactions (Rs. bn) 34.8 89.9 173.0 264.1 344.6
Common Electronic Fund Transfer Switch (CEFTS) (d) Volume of transactions (‘000) - 16.6 894.7 3,163.4 7,233.6
Value of transactions (Rs. bn) - 1.0 69.4 273.7 660.3
(a) Provisional (b) Total cheques cleared through LCPL (c) Implemented on 23 July 2013 (d) Implemented on 21 August 2015 (e) Transactions carried out at POS terminals (f) Cash withdrawals at ATMs (g) As at end period (h) Revised
5 Transactions through Payment Systems/Instruments
Total Volume and Value of Transactions
Table: 25

P a y m e n t s B u l l e t i n - F o u r t h Q u a r t e r 2 0 1 8
Page 29
Indicator
2014
2015
2016
2017
2018
(a)
1. Currency in circulation as a percentage of GDP 4.0 4.5 4.6 4.5 4.4
2. Per capita Currency in Circulation value (Rs.) 20,071 23,452 26,071 27,889 29,577
3. Currency (held by Public) as a percentage of GDP 3.2 3.5 3.6 3.3 3.3
4. Per capita RTGS transaction value (Rs.) 2,867,025 4,027,091 4,403,996 4,304,362 4,636,505
5. RTGS transactions value as a percentage of GDP 575 771 778(d) 688(d) 695
6. RTGS transactions Concentration ratio (Based on the value of top five participants)
53.5 59.2 49.9 55.1 53.6
7. Per capita Cheque usage (c) 2.3 2.4 2.5 2.4 2.3
8. Per capita Cheques transaction value (Rs.) 367,843 402,271 452,836 488,804 485,851
9. Cheque transaction value as a percentage of GDP 73.7 77.0 80.0(d) 78.1(d) 72.9
10. Per capita SLIPS transaction value (Rs.) 43,017 55,762 68,741 80,444 91,010
11. SLIPS transaction value as a percentage of GDP 8.6 10.7 12.1(d) 12.9(d) 13.6
12. Per capita Debit Card transaction value (Rs.)(e) 2,980 3,963 5,096 6,274 7,325
13. Per capita Credit Card transaction value (Rs.) 6,479 7,352 8,589 9,259 11,158
14. Per capita Internet banking transaction value (Rs.)
47,366 57,467 74,925 97,956 135,347
15. Per capita Mobile banking transaction value (Rs.) 378 539 688 1,466 6,570
16. Per capita Tele banking transaction value (Rs.) 50 48 45 34 42
17. Number of POS terminals per 1,000 inhabitants 1.7 1.9 2.0 2.3 2.9
18. Number of ATM terminals per 1,000 inhabitants 0.16 0.17 0.18 0.20 0.21
19. GDP at current Market prices (Rs. billion) (b) 10,361 10,951 11,996(d) 13,418(d) 14,450
20. Mid-Year Population (‘000) (b) 20,771 20,966 21,203 21,444 21,670
(a) Provisional
(b) Based on the summary indicators 2010 to 2018, Department of Census and Statistics, Sri Lanka
(c) Total cheques cleared through LCPL
(d) Revised
(e) Transactions carried out at POS terminals
Key Indicators
6 Key Indicators
Table: 26
P a y m e n t s B u l l e t i n - F o u r t h Q u a r t e r 2 0 1 8
Page 30
Institution
Classes of Business
Issuer of Payment
Cards
Fin
an
cia
l A
cq
uire
r o
f
Pa
ym
en
t C
ard
s
Op
era
tor
of C
ust
om
er
Ac
co
un
t B
ase
d M
ob
ile
Pa
ym
en
t Sy
ste
m
Op
era
tor
of
mo
bile
Ph
on
e
Ba
sed
e-m
on
ey
Sy
ste
m
De
bit C
ard
Cre
dit C
ard
Sto
red
Va
lue
Ca
rd
Ch
arg
e C
ard
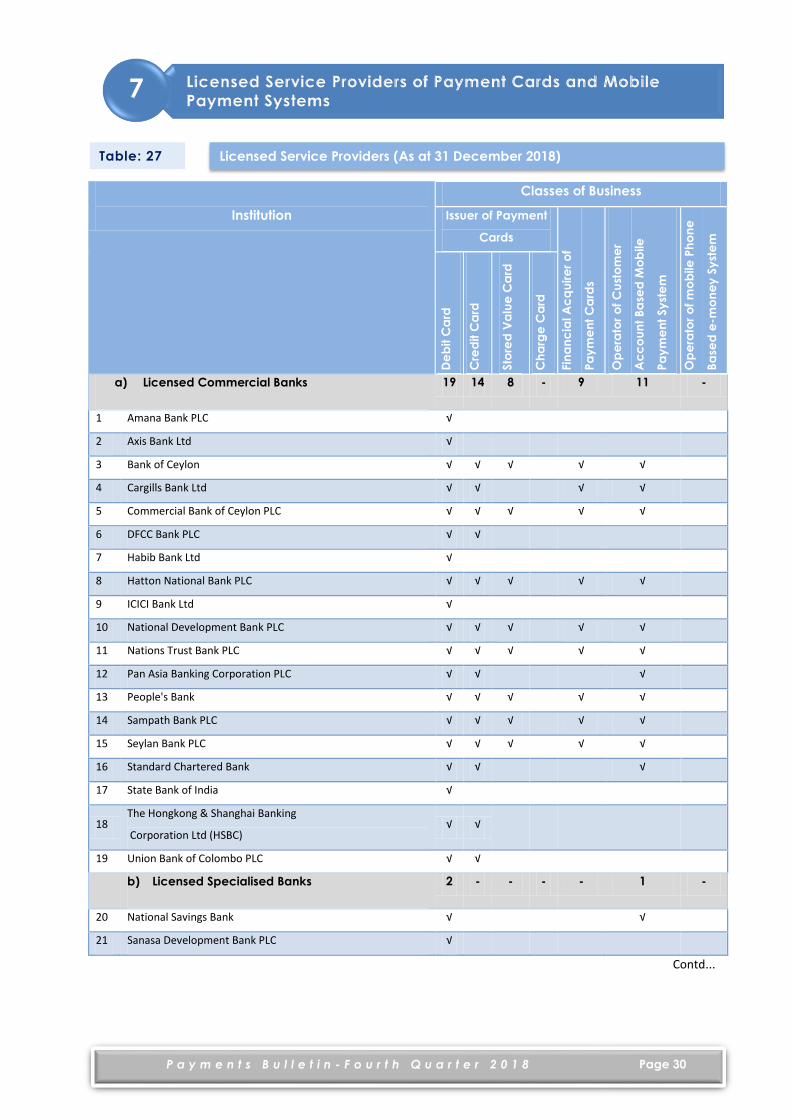
a) Licensed Commercial Banks 19 14 8 - 9 11 -
1 Amana Bank PLC √
2 Axis Bank Ltd √
3 Bank of Ceylon √ √ √
√ √
4 Cargills Bank Ltd √ √
√ √
5 Commercial Bank of Ceylon PLC √ √ √
√ √
6 DFCC Bank PLC √ √
7 Habib Bank Ltd √
8 Hatton National Bank PLC √ √ √
√ √
9 ICICI Bank Ltd √
10 National Development Bank PLC √ √ √
√ √
11 Nations Trust Bank PLC √ √ √
√ √
12 Pan Asia Banking Corporation PLC √ √
√
13 People's Bank √ √ √
√ √
14 Sampath Bank PLC √ √ √
√ √
15 Seylan Bank PLC √ √ √
√ √
16 Standard Chartered Bank √ √
√
17 State Bank of India √
18 The Hongkong & Shanghai Banking
Corporation Ltd (HSBC) √ √
19 Union Bank of Colombo PLC √ √
b) Licensed Specialised Banks 2 - - - - 1 -
20 National Savings Bank √
√
21 Sanasa Development Bank PLC √
Contd...
Licensed Service Providers (As at 31 December 2018)
Licensed Service Providers of Payment Cards and Mobile Payment Systems
7
Table: 27

P a y m e n t s B u l l e t i n - F o u r t h Q u a r t e r 2 0 1 8
Page 31
Licensed Service Providers of Payment Cards and Mobile Payment Systems
Institution
Classes of Business
Issuer of Payment
Cards
Fin
an
cia
l A
cq
uire
r o
f
Pa
ym
en
t
Ca
rds
Op
era
tor
Cu
sto
me
r A
cc
ou
nt
Ba
sed
Mo
bile
Pa
ym
en
t
Sy
ste
m
Op
era
tor
of
mo
bile
Ph
on
e
Ba
sed
e-m
on
ey
Sy
ste
m
De
bit C
ard
Cre
dit C
ard
Sto
red
Va
lue
Ca
rd
Ch
arg
e C
ard
c) Finance Companies 11 3 - - - - -
22 Central Finance Co PLC √
23 Citizens Development Business Finance PLC √ √
24 Commercial Leasing & Finance PLC √
25 L B Finance PLC √
26 LOLC Finance PLC √ √
27 Melsta Regal Finance Ltd √
28 People's Leasing & Finance PLC √
29 Senkadagala Finance PLC √
30 Singer Finance (Lanka) PLC √ √
31 The Finance Co PLC √
32 TKS Finance Ltd √
d) Non-Finance Institutions - - 1 - 1 - 2
33 Global Payments Asia - Pacific Lanka (Private) Limited
√
34 Dialog Axiata PLC
√
√
35 Mobitel (Pvt) Ltd
√
Total 32 17 9 - 10 12 2
P a y m e n t s B u l l e t i n - F o u r t h Q u a r t e r 2 0 1 8
Page 32
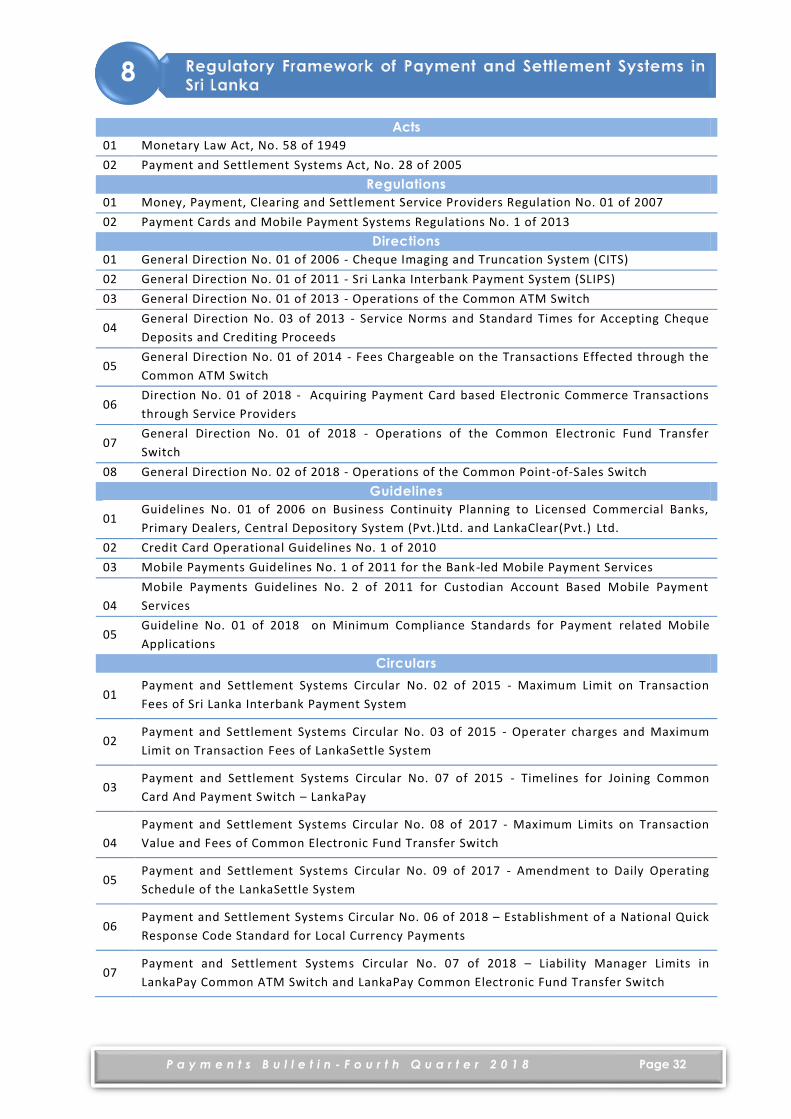
Acts
01 Monetary Law Act, No. 58 of 1949
02 Payment and Settlement Systems Act, No. 28 of 2005
Regulations
01 Money, Payment, Clearing and Settlement Service Providers Regulation No. 01 of 2007
02 Payment Cards and Mobile Payment Systems Regulations No. 1 of 2013
Directions
01 General Direction No. 01 of 2006 - Cheque Imaging and Truncation System (CITS)
02 General Direction No. 01 of 2011 - Sri Lanka Interbank Payment System (SLIPS)
03 General Direction No. 01 of 2013 - Operations of the Common ATM Switch
04 General Direction No. 03 of 2013 - Service Norms and Standard Times for Accepting Cheque
Deposits and Crediting Proceeds
05 General Direction No. 01 of 2014 - Fees Chargeable on the Transactions Effected through the
Common ATM Switch
06 Direction No. 01 of 2018 - Acquiring Payment Card based Electronic Commerce Transactions
through Service Providers
07 General Direction No. 01 of 2018 - Operations of the Common Electronic Fund Transfer
Switch
08 General Direction No. 02 of 2018 - Operations of the Common Point-of-Sales Switch
Guidelines
01 Guidelines No. 01 of 2006 on Business Continuity Planning to Licensed Commercial Banks,
Primary Dealers, Central Depository System (Pvt.)Ltd. and LankaClear(Pvt.) Ltd.
02 Credit Card Operational Guidelines No. 1 of 2010
03 Mobile Payments Guidelines No. 1 of 2011 for the Bank -led Mobile Payment Services
04
Mobile Payments Guidelines No. 2 of 2011 for Custodian Account Based Mobile Payment
Services
05 Guideline No. 01 of 2018 on Minimum Compliance Standards for Payment related Mobile
Applications
Circulars
01 Payment and Settlement Systems Circular No. 02 of 2015 - Maximum Limit on Transaction
Fees of Sri Lanka Interbank Payment System
02 Payment and Settlement Systems Circular No. 03 of 2015 - Operater charges and Maximum
Limit on Transaction Fees of LankaSettle System
03 Payment and Settlement Systems Circular No. 07 of 2015 - Timelines for Joining Common
Card And Payment Switch – LankaPay
04
Payment and Settlement Systems Circular No. 08 of 2017 - Maximum Limits on Transaction
Value and Fees of Common Electronic Fund Transfer Switch
05 Payment and Settlement Systems Circular No. 09 of 2017 - Amendment to Daily Operating
Schedule of the LankaSettle System
06 Payment and Settlement Systems Circular No. 06 of 2018 – Establishment of a National Quick
Response Code Standard for Local Currency Payments
07 Payment and Settlement Systems Circular No. 07 of 2018 – Liability Manager Limits in
LankaPay Common ATM Switch and LankaPay Common Electronic Fund Transfer Switch
8 Regulatory Framework of Payment and Settlement Systems in Sri Lanka
P a y m e n t s B u l l e t i n - F o u r t h Q u a r t e r 2 0 1 8
Page 33
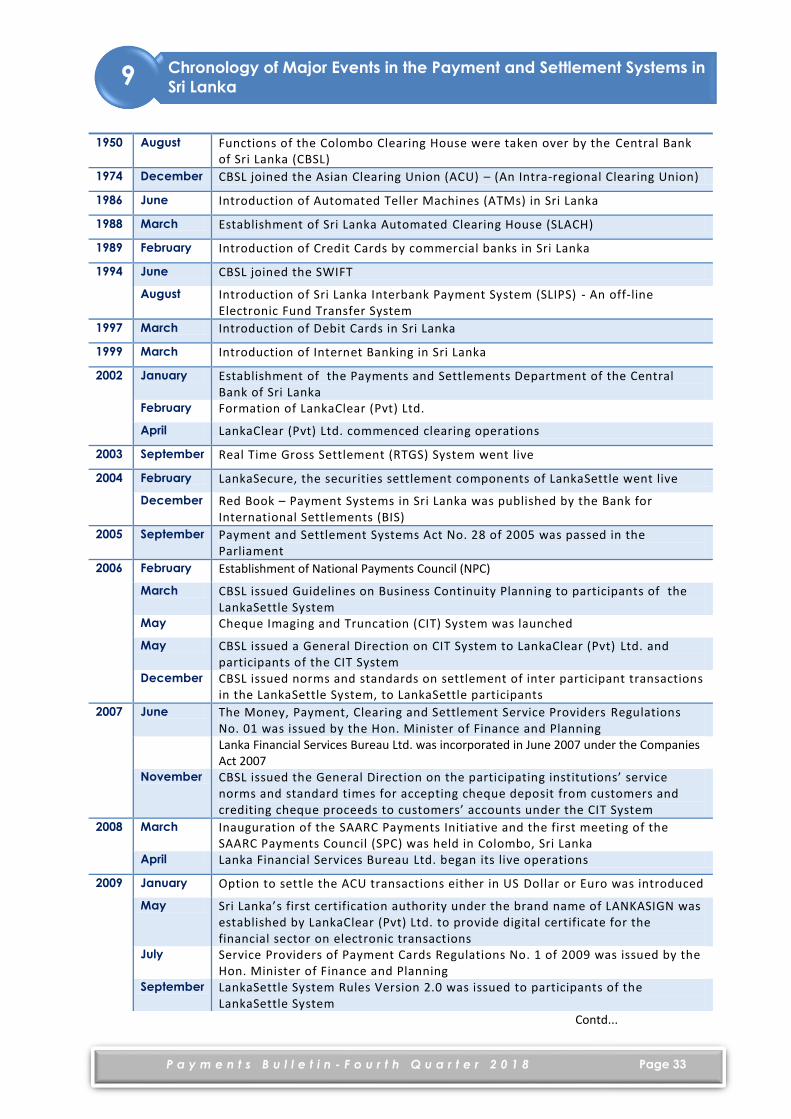
Contd...
1950 August Functions of the Colombo Clearing House were taken over by the Central Bank of Sri Lanka (CBSL)
1974 December CBSL joined the Asian Clearing Union (ACU) – (An Intra-regional Clearing Union)
1986 June Introduction of Automated Teller Machines (ATMs) in Sri Lanka
1988 March Establishment of Sri Lanka Automated Clearing House (SLACH)
1989 February Introduction of Credit Cards by commercial banks in Sri Lanka
1994 June CBSL joined the SWIFT
August Introduction of Sri Lanka Interbank Payment System (SLIPS) - An off-line Electronic Fund Transfer System
1997 March Introduction of Debit Cards in Sri Lanka
1999 March Introduction of Internet Banking in Sri Lanka
2002 January Establishment of the Payments and Settlements Department of the Central Bank of Sri Lanka
February Formation of LankaClear (Pvt) Ltd.
April LankaClear (Pvt) Ltd. commenced clearing operations
2003 September Real Time Gross Settlement (RTGS) System went live
2004 February LankaSecure, the securities settlement components of LankaSettle went live
December Red Book – Payment Systems in Sri Lanka was published by the Bank for International Settlements (BIS)
2005 September Payment and Settlement Systems Act No. 28 of 2005 was passed in the Parliament
2006 February Establishment of National Payments Council (NPC)
March CBSL issued Guidelines on Business Continuity Planning to participants of the LankaSettle System
May Cheque Imaging and Truncation (CIT) System was launched
May CBSL issued a General Direction on CIT System to LankaClear (Pvt) Ltd. and participants of the CIT System
December CBSL issued norms and standards on settlement of inter participant transactions in the LankaSettle System, to LankaSettle participants
2007 June The Money, Payment, Clearing and Settlement Service Providers Regulations No. 01 was issued by the Hon. Minister of Finance and Planning
Lanka Financial Services Bureau Ltd. was incorporated in June 2007 under the Companies Act 2007
November CBSL issued the General Direction on the participating institutions’ service norms and standard times for accepting cheque deposit from customers and crediting cheque proceeds to customers’ accounts under the CIT System
2008 March Inauguration of the SAARC Payments Initiative and the first meeting of the SAARC Payments Council (SPC) was held in Colombo, Sri Lanka
April Lanka Financial Services Bureau Ltd. began its live operations
2009 January Option to settle the ACU transactions either in US Dollar or Euro was introduced
May Sri Lanka’s first certification authority under the brand name of LANKASIGN was established by LankaClear (Pvt) Ltd. to provide digital certificate for the financial sector on electronic transactions
July Service Providers of Payment Cards Regulations No. 1 of 2009 was issued by the Hon. Minister of Finance and Planning
September LankaSettle System Rules Version 2.0 was issued to participants of the LankaSettle System
9 Chronology of Major Events in the Payment and Settlement Systems in
Sri Lanka
P a y m e n t s B u l l e t i n - F o u r t h Q u a r t e r 2 0 1 8
Page 34
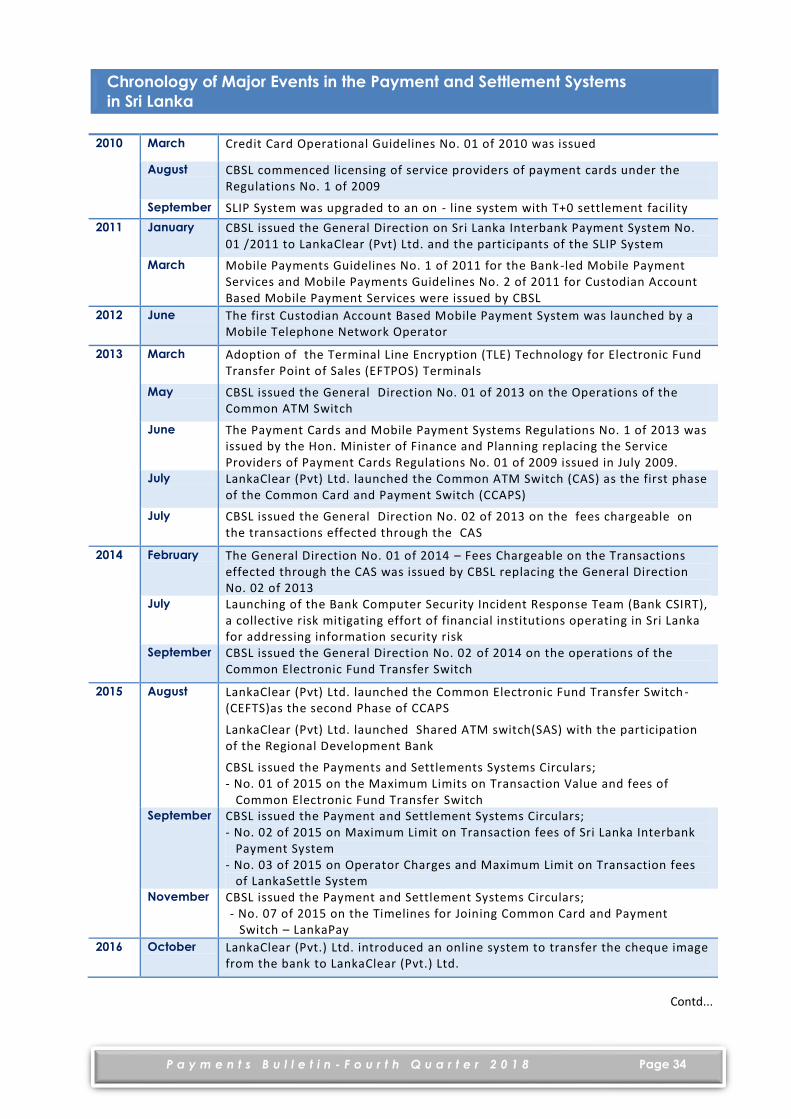
Contd...
2010 March Credit Card Operational Guidelines No. 01 of 2010 was issued
August CBSL commenced licensing of service providers of payment cards under the Regulations No. 1 of 2009
September SLIP System was upgraded to an on - line system with T+0 settlement facility
2011 January CBSL issued the General Direction on Sri Lanka Interbank Payment System No. 01 /2011 to LankaClear (Pvt) Ltd. and the participants of the SLIP System
March Mobile Payments Guidelines No. 1 of 2011 for the Bank -led Mobile Payment Services and Mobile Payments Guidelines No. 2 of 2011 for Custodian Account Based Mobile Payment Services were issued by CBSL
2012 June The first Custodian Account Based Mobile Payment System was launched by a Mobile Telephone Network Operator
2013 March Adoption of the Terminal Line Encryption (TLE) Technology for Electronic Fund Transfer Point of Sales (EFTPOS) Terminals
May CBSL issued the General Direction No. 01 of 2013 on the Operations of the Common ATM Switch
June The Payment Cards and Mobile Payment Systems Regulations No. 1 of 2013 was issued by the Hon. Minister of Finance and Planning replacing the Service Providers of Payment Cards Regulations No. 01 of 2009 issued in July 2009.
July LankaClear (Pvt) Ltd. launched the Common ATM Switch (CAS) as the first phase of the Common Card and Payment Switch (CCAPS)
July CBSL issued the General Direction No. 02 of 2013 on the fees chargeable on the transactions effected through the CAS
2014 February The General Direction No. 01 of 2014 – Fees Chargeable on the Transactions effected through the CAS was issued by CBSL replacing the General Direction No. 02 of 2013
July Launching of the Bank Computer Security Incident Response Team (Bank CSIRT), a collective risk mitigating effort of financial institutions operating in Sri Lanka for addressing information security risk
September CBSL issued the General Direction No. 02 of 2014 on the operations of the Common Electronic Fund Transfer Switch
2015 August LankaClear (Pvt) Ltd. launched the Common Electronic Fund Transfer Switch - (CEFTS)as the second Phase of CCAPS
LankaClear (Pvt) Ltd. launched Shared ATM switch(SAS) with the participation of the Regional Development Bank
CBSL issued the Payments and Settlements Systems Circulars; - No. 01 of 2015 on the Maximum Limits on Transaction Value and fees of
Common Electronic Fund Transfer Switch September CBSL issued the Payment and Settlement Systems Circulars;
- No. 02 of 2015 on Maximum Limit on Transaction fees of Sri Lanka Interbank Payment System
- No. 03 of 2015 on Operator Charges and Maximum Limit on Transaction fees of LankaSettle System
November CBSL issued the Payment and Settlement Systems Circulars; - No. 07 of 2015 on the Timelines for Joining Common Card and Payment
Switch – LankaPay
2016 October LankaClear (Pvt.) Ltd. introduced an online system to transfer the cheque image from the bank to LankaClear (Pvt.) Ltd.
Chronology of Major Events in the Payment and Settlement Systems
in Sri Lanka
P a y m e n t s B u l l e t i n - F o u r t h Q u a r t e r 2 0 1 8
Page 35
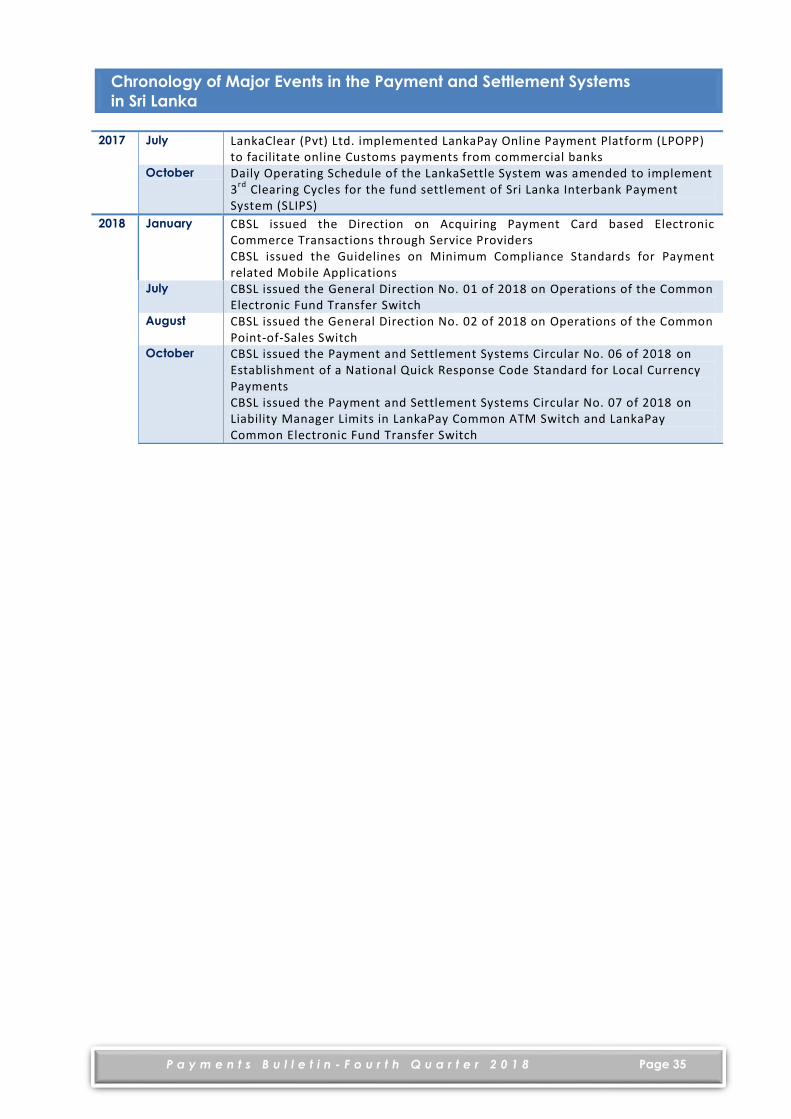
2017 July LankaClear (Pvt) Ltd. implemented LankaPay Online Payment Platform (LPOPP) to facilitate online Customs payments from commercial banks
October Daily Operating Schedule of the LankaSettle System was amended to implement 3
rd Clearing Cycles for the fund settlement of Sri Lanka Interbank Payment
System (SLIPS)
2018 January CBSL issued the Direction on Acquiring Payment Card based Electronic Commerce Transactions through Service Providers CBSL issued the Guidelines on Minimum Compliance Standards for Payment related Mobile Applications
July CBSL issued the General Direction No. 01 of 2018 on Operations of the Common Electronic Fund Transfer Switch
August CBSL issued the General Direction No. 02 of 2018 on Operations of the Common Point-of-Sales Switch
October CBSL issued the Payment and Settlement Systems Circular No. 06 of 2018 on Establishment of a National Quick Response Code Standard for Local Currency Payments CBSL issued the Payment and Settlement Systems Circular No. 07 of 2018 on Liability Manager Limits in LankaPay Common ATM Switch and LankaPay Common Electronic Fund Transfer Switch
Chronology of Major Events in the Payment and Settlement Systems
in Sri Lanka