central bank of nigeria stability report.pdf · cbn financial stability report ... the foreign...
TRANSCRIPT

CENTRAL BANK OF NIGERIA
FINANCIAL STABILITYREPORT
FINANCIAL STABILITYREPORT
JUNE 2013JUNE 2013

CBN FINANCIAL STABILITY REPORT June 2013
T a b l e o f C o n t e n t s
iii
LIST OF TABLES .. .. .. .. .. .. .. .. .. vi
LIST OF FIGURES .. .. .. .. .. .. .. .. vii
LIST OF ABBREVIATIONS AND ACRONYMS .. .. .. .. .. ix
DEFINITION AND ROLE OF FINANCIAL STABILITY .. .. .. .. xii
GOVERNORS STATEMENT .. .. .. .. .. .. .. xiii
DEPUTY GOVERNORS REMARKS .. .. .. .. .. .. xiv
EXECUTIVE SUMMARY .. .. .. .. .. .. .. .. xv
1.0 MACROECONOMIC DEVELOPMENTS AND FINANCIAL SYSTEM STABILITY 1
1.1
1.1.1
1.1.2
1.1.2.1
1.1.2.2
1.2
1.2.1
1.2.2
1.2.3
1.2.4
2.0 DEVELOPMENTS IN THE FINANCIAL SYSTEM .. .. .. .. 11
2.1
2.1.1
2.1.1.1
2.1.1.2
2.1.1.3
2.1.2
2.1.3
2.1.4
2.1.5
2.2
2.2.1
2.2.2
2.2.3
2.3
2.3.1
2.3.2
2.3.3
2.3.4
2.4
2.5
2.5.1
2.5.2
Global Economic and Financial Developments .. .. 1
Output.. .. .. .. .. .. .. 1
Inflation .. .. .. .. .. .. 2
Oil Prices .. .. .. .. .. 3
Monetary Policy Rates .. .. .. 3
Domestic Developments .. .. .. .. .. 5
Output.. .. .. .. .. .. .. 5
Inflation .. .. .. .. .. .. 7
Interest Rates .. .. .. .. .. .. 7
Fiscal Operations .. .. .. .. .. 8
Monetary and Credit Developments .. .. .. .. 11
Aggregate Credit to the Economy .. .. .. 11
Claims on the Federal Government .. .. 12
Claims on the Private Sector .. .. .. 12
Consumer Credit .. .. .. .. 12
Sectoral Classification of Private Sector Credit .. 13
Reserve Money (RM) .. .. .. .. .. 14
Maturity Structure of Bank Deposits and Credits .. 14
Market Structure of the Banking Industry .. .. 15
The Banking Sector .. .. .. .. .. .. 16
Cross-border Collaboration .. .. .. .. 17
Implementation of the New Banking Model .. .. 17
Non-Interest (Islamic) Banking .. .. .. 17
Other Financial Institutions (OFIs) .. .. .. .. 18
Mortgage Refinancing .. .. .. .. 18
Microfinance Banks (MFBs) .. .. .. .. 18
Primary Mortgage Banks (PMBs) .. .. .. 19
Finance Companies (FCs) .. .. .. .. 19
Financial Inclusion .. .. .. .. .. .. 19
Financial Markets .. .. .. .. .. .. 19
The Money Market .. .. .. .. .. 19
The Foreign Exchange Market .. .. .. 20
iv
CBN FINANCIAL STABILITY REPORT June 2013
iv
The Capital Market .. .. .. .. .. 21
The Bond Market .. .. .. .. 21
FGN Bonds .. .. .. .. .. 22
Sub-national Bonds .. .. .. .. 23
Corporate Bonds .. .. .. .. 23
The Equity Market .. .. .. .. 25
The Securities and Exchange Commission .. .. .. 25
The Insurance Sector .. .. .. .. .. .. 26
Real Sector Intervention Programmes .. .. .. 26
The Nigeria Incentive-based Risk Sharing System
for Agricultural Lending (NIRSAL) .. .. .. 26
The Commercial Agriculture Credit Scheme (CACS) 27
The Agricultural Credit Guarantee Scheme (ACGS).. 27
The Small and Medium Enterprises Credit
Guarantee Scheme (SMECGS) .. .. .. 27
The Power and Aviation Intervention Fund (PAIF) .. 27
Entrepreneurship Development Centres (EDCs) .. 28
The External Sector .. .. .. .. .. .. 28
Macro-Prudential Supervision .. .. .. .. .. 31
Financial Soundness Indicators .. .. .. 31
Asset-based Indicators .. .. .. 31
Capital-based Indicators .. .. .. 32
Income and Expense-based Indicators .. 33
The Banking Industry Stress Test .. .. .. 33
The Liquidity Stress Test .. .. .. 33
The Solvency Stress Test .. .. .. 37
Analysis of Test Results.. .. .. .. .. 39
Credit Risk .. .. .. .. .. 39
Liquidity Risk .. .. .. .. .. 40
Interest Rate Risk .. .. .. .. 41
Exchange Rate Risk .. .. .. .. 42
Foreign Exchange (FX) Trading Risk .. .. 42
Enhancement of the Framework and
Tools for Supervision .. .. .. .. .. 42
Supervision of Banks and Other Financial Institutions.. .. 43
Banks and Discount Houses .. .. .. .. 43
Commercial Banks .. .. .. .. 43
Non-Interest (Islamic) Banks .. .. .. 43
Merchant Banks .. .. .. .. 43
Discount Houses .. .. .. .. 43
Other Financial Institutions .. .. .. .. .. 44Microfinance Banks (MFBs) .. .. .. .. 44
Primary Mortgage Banks (PMBs) .. .. .. 44
Finance Companies (Fcs) .. .. .. .. 45
Bureaux de Change (BDCs) .. .. .. .. 45
2.5.3
2.5.3.1
2.5.3.2
2.6
2.7
2.8
2.8.1
2.8.2
2.8.3
2.8.4
2.8.5
2.8.6
2.9
3 REGULATORY AND SUPERVISORY ACTIVITIES .. .. .. .. 31
3.1
3.1.1
3.1.1.1
3.1.1.2
3.1.1.3
3.1.2
3.1.2.1
3.1.2.2
3.1.3
3.1.3.1
3.1.3.2
3.1.3.3
3.1.3.4
3.1.3.5
3.1.4
3.2
3.2.1
3.2.1.1
3.2.1.2
3.2.1.3
3.2.1.4
3.3
3.3.1
3.3.2
3.3.3
3.3.4
v
CBN FINANCIAL STABILITY REPORT June 2013
v
Compliance with International Standards .. .. .. 45
Anti-Money Laundering/Combating
the Financing of Terrorism .. .. .. .. 45
International Financial Reporting
Standards and Basel II/III .. .. .. .. 45
The Asset Management Corporation of Nigeria (AMCON) .. 46
Key Risks in the Financial System .. .. .. .. 46
Credit Risk .. .. .. .. .. .. 46
Liquidity Risk .. .. .. .. .. .. 47
Market Risk .. .. .. .. .. .. 47
Operational Risk .. .. .. .. .. 47
Reputational Risk .. .. .. .. .. 48
Credit Information Bureaux .. .. .. .. .. 48
The Credit Risk Management System (CRMS) .. 48
Private Credit Bureaux (PCBs) .. .. .. 49
The Financial Services Regulation Coordinating
Committee (FSRCC) .. .. .. .. .. .. 49
Consumer Protection .. .. .. .. .. .. 49
The Payments System Vision 2020 .. .. .. .. 51
The Real-Time Gross Settlement (RTGS) System .. .. 51
The NIBSS Instant Payment (NIP) .. .. .. .. 52
NIBSS Electronic Fund Transfer (NEFT) .. .. .. .. 52
Cheque Clearing .. .. .. .. .. .. 53
Electronic Card Transactions .. .. .. .. .. 53
ATM Transactions .. .. .. .. .. 54
Mobile Banking .. .. .. .. .. 54
Points of Sale Transactions .. .. .. .. 54
Web (Internet) Transactions .. .. .. .. 55
3.4
3.4.1
3.4.2
3.5
3.6
3.6.1
3.6.2
3.6.3
3.6.4
3.6.5
3.7
3.7.1
3.7.2
3.8
3.9
4 DEVELOPMENTS IN THE PAYMENTS SYSTEM .. .. .. .. 51
4.1
4.2
4.3
4.4
4.5
4.6
4.6.1
4.6.2
4.6.3
4.6.4
5 OUTLOOK .. .. .. .. .. .. .. .. 57
L i s t o f T a b l e s
vi
CBN FINANCIAL STABILITY REPORT June 2013
vi
Table 1.1:
Table 1.2:
Table 1.3:
Table 1.4:
Table 1.5:
Table 2.1:
Table 2.2:
Table 2.3:
Table 2.4:
Table 2.5:
Table 2.6:
Table 2.7:
Table 3.1:
Table 3.2:
Table 3.3:
Table 3.4:
Table 3.5:
Table 3.6:
Table 3.7:
Table 3.8:
Table 3.9:
Table 3.10:
World Output Growth Projections (2012 - 2014) .. .. .. 2
Global Inflation (Consumer Prices) .. .. .. .. 2
Inflation Rates for Selected Countries .. .. .. .. 3
Summary of Policy Rates Across Selected Countries
(July 2012 -June 2013) .. .. .. .. .. .. 4
Percentage Changes in Real GDP by Sector .. .. .. 6
Sectoral Allocation of Credit .. .. .. .. .. 13
Deposit Structure of Banks .. .. .. .. .. 16
Sub-national Bonds Issued, January - June 2013 .. .. .. 23
Corporate Bonds Issued, January - June 2013 .. .. .. 23
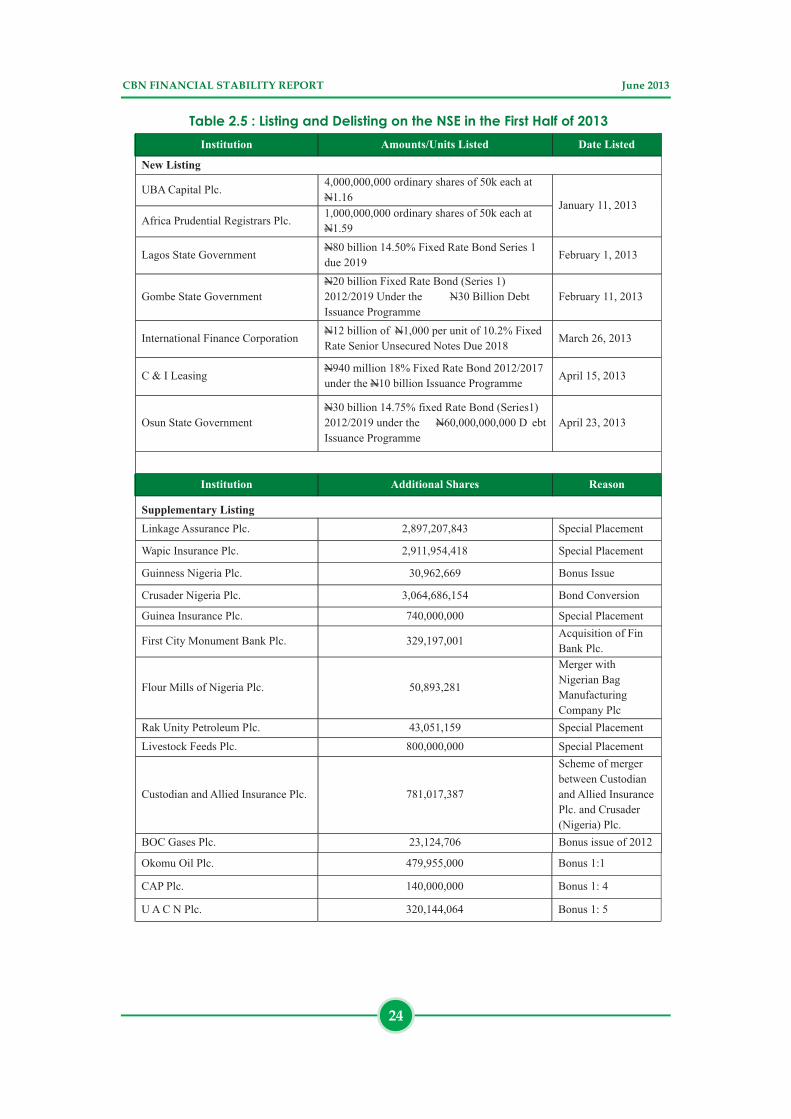
Listing and Delisting on the NSE in the First Half of 2013 .. .. 24
CRGs Issued, January - June, 2013 .. .. .. .. 27
Analysis of Projects Financed by CACS, January-June 2013 .. 27
Selected Financial Soundness Indicators (FSIs)
of the Nigerian Banking Industry .. .. .. .. .. 33
Assets Unencumbered .. .. .. .. .. .. 34
Implied Cash Flow Analysis .. .. .. .. .. 35
Baseline CAR and LR .. .. .. .. .. .. 37
Stress Test Results - Credit Risk .. .. .. .. .. 40
Stress Test Results - Liquidity Risk .. .. .. .. .. 41
Stress Test Results - Interest Rate Risk .. .. .. .. 41
Stress Test Results - Exchange Rate Risk .. .. .. .. 42
Stress Test Results - FX Trading Risk .. .. .. .. 42
Composite Risk Rating of Discount Houses .. .. .. 43
CBN FINANCIAL STABILITY REPORT June 2013
L i s t o f F i g u r e s
vii
Gross Domestic Product .. .. .. .. .. 5
Share of Oil and Non-oil Sectors in Real GDP .. .. .. 6
Share of Total GDP (%) .. .. .. .. .. .. 6
Inflationary Trend (Year-on-Year) .. .. .. .. 7
Money Market Interest Rates and MPR.. .. .. .. 8
Lending and Deposit Rates .. .. .. .. .. 8
Federal Government Fiscal Operations .. .. .. 9
Trend in Monetary Aggregates .. .. .. .. .. 11
Credit to the Economy .. .. .. .. .. .. 12
Consumer Credit .. .. .. .. .. .. 13
Sectoral Allocation of Credit .. .. .. .. .. 14
Distribution of Bank Loans and Advances by Maturity,
June 2011 - June 2013 .. .. .. .. .. .. 15
Structure of Bank Deposits, June 2011 - June 2013 .. .. 15
Market Concentration Ratios of Banks (Assets) .. .. .. 16
Inter-bank Rate Movements .. .. .. .. .. 20
WDAS, Inter-bank and BDC Rates, June 2013 .. .. .. 21
Yield Curve for Nigeria .. .. .. .. .. .. 22
Bonds Outstanding at end-June 2013 and end-December 2012 25
Banking Industry NPLs to Gross Loans .. .. .. .. 31
Banking Industry Liquidity Indicators .. .. .. .. 32
Banking Industry Capital Adequacy Indicators .. .. 32
Rollover Risk, Pre- and Post-shock .. .. .. .. 35
Industry and Individual Bank Pre-shock Liquidity Ratio Positions 36
Industry Position after 1-5 day and Cumulative 30-day Shocks 36
Individual Bank Positions after 5-day and
Cumulative 30-day Shocks .. .. .. .. .. 37
Banks in Each Bucket of CAR .. .. .. .. .. 38
Banks in Each Bucket of LR .. .. .. .. .. 38
Baseline CARs and LRs (%) .. .. .. .. .. 39
Baseline ROA and ROE (%) .. .. .. .. .. 39
Credit Concentration Risk .. .. .. .. .. 40
Trend of Banking Industry NPLs .. .. .. .. .. 47
CRMS Statistics as at end-June 2013 .. .. .. .. 48
CBN RTGS Transactions, January - June 2013 .. .. .. 52
Value and Volume of NIP Transactions, January - June 2013 .. 52
Value and Volume of NEFT Transactions, January - June 2013 53
Value and Volume of Cheques Cleared, January - June 2013 53
Volume of Electronic Card Transactions, January - June 2013 54
Value of Electronic Card Transactions, January - June 20132 .. 54
Figure 1.1:
Figure 1.2:
Figure 1.3:
Figure 1.4:
Figure 1.5:
Figure 1.6:
Figure 1.7:
Figure 2.1:
Figure 2.2:
Figure 2.3:
Figure 2.4:
Figure 2.5:
Figure 2.6:
Figure 2.7:
Figure 2.8:
Figure 2.9:
Figure 2.10:
Figure 2.11:
Figure 3.1:
Figure 3.2:
Figure 3.3:
Figure 3.4:
Figure 3.5:
Figure 3.6:
Figure 3.7:
Figure 3.8:
Figure 3.9:
Figure 3.10:
Figure 3.11:
Figure 3.12:
Figure 3.13:
Figure 3.14:
Figure 4.1:
Figure 4.2:
Figure 4.3:
Figure 4.4:
Figure 4.5:
Figure 4.6:

CBN FINANCIAL STABILITY REPORT June 2013
Boxes
viii
Box 1: Competency Framework for the Nigerian Banking Industry .. .. 59
CBN FINANCIAL STABILITY REPORT June 2013
List of Abbreviations and Acronyms
ix
AACBs
AADFIs
ACGSF
ACSS
AFC
AGRA
AIPs
AMCON
AML/CFT
ASCE
ASeM
ASI
ATMs
BCEAO
BDCs
BOA
BOFIA
BOI
BRICS
BSE Sensex
CAC40
CACS
CAR
CBN
CIBN
CIFTS
CR5
CR6
CRMS
CSWAMZ
D-8
DAX
DFIs
DMBs
DMO
EGX CASE30
EBAs
EMV
FATF
FCs
FCT
Association of African Central Banks
Association of African Development Finance Institutions
Agricultural Credit Guarantee Scheme Fund
Agricultural Credit Support Scheme
African Finance Corporation
Alliance for a Green Revolution in Africa
Approvals-in-Principle
Asset Management Corporation of Nigeria
Anti-Money Laundering and Combating the Financing of Terrorism
Abuja Securities and Commodity Exchange
Alternative Securities Market
All Share Index (Nigerian Stock Exchange Index)
Automated Teller Machines
The African Union
Banque Centrale des Etats de l'Afrique de l'Ouest (Central Bank of West
African States)
Bureaux de Change
Bank of Agriculture
Banks and Other Financial Institutions Act 1991 (as amended)
Bank of Industry
Brazil, Russia, India, China, and South Africa
Bombay Stock Exchange (Indian Stock Index)
Cotation Assistée en Continu (French Stock Index)
Commercial Agricultural Credit Scheme
Capital Adequacy Ratio
Central Bank of Nigeria
Chartered Institute of Bankers of Nigeria
CBN Interbank Fund Transfer System
Concentration Ratio (of the five largest banks)
Concentration Ratio (of the six largest banks)
Credit Risk Management System
College of Supervisors of the West African Monetary Zone
Group of Eight Developing Countries
DeutscherAktien Index (German Stock Index)
Development Finance Institutions
Deposit Money Banks
Debt Management Office
Egyptian Stock Index (Cairo and Alexandria Stock Exchange)
Eligible Bank Assets
Euro MasterCard Visa
Financial Action Task Force
Finance Companies
Federal Capital Territory
AU

CBN FINANCIAL STABILITY REPORT June 2013
x
FGN
FMBN
FMF
FSIs
FSRCC
FTSE 100
GDP
GSE
HHI
IFC
IFRS
IFSB
IGBC
IILMC
IMF
JSE
KYC
L/C
LTROs
M1
M2
MCP
MDAs
MENA
MFBs
MFIs
MICEX
ML/FT
MoUs
MPR
NACRDB
NAICOM
NCC
NDIC
NEXIM
NFIU
NGAAP+
Nikkei 225
NIBSS
NIPOST
NIRSAL
NPLs
NSE
NSE 20
OBB
OFIs
Federal Government of Nigeria
Federal Mortgage Bank of Nigeria
Federal Ministry of Finance
Financial Soundness Indicators
Financial Services Regulation Coordinating Committee
Financial Times Stock Exchange Index (UK Stock Index)
Gross Domestic Product
Ghanaian Stock Exchange Index
Herfindahl-Hirschman Index
Islamic Finance Council
International Financial Reporting Standards
Islamic Financial Services Board
Indice de la Bolsa de Valores de Columbia (Columbian Stock Index)
International Islamic Liquidity Management Corporation
International Monetary Fund
Johannesburg Stock Exchange (South African Stock Index)
Know Your Customer
Letter of Credit
Longer-term Refinancing Operations
Narrow Money Supply
Broad Money Supply
Microfinance Certification Programme
Ministries, Departments and Agencies
Middle East and North African countries
Microfinance Banks
Microfinance Institutions
Moscow Inter-Bank Currency Exchange (Russian Stock Index)
Money Laundering and Financing of Terrorism
Memoranda of Understanding
Monetary Policy Rate
Nigerian Agricultural Co-operative and Rural Development Bank
National Insurance Commission
Nigerian Communications Commission
Nigeria Deposit Insurance Corporation
Nigerian Export-Import Bank
Nigerian Financial Intelligence Unit
Nigerian Generally Accepted Accounting Principles
Japanese Stock Index
Nigerian Interbank Settlement System
Nigerian Postal Services
Nigerian Incentive-based Risk Sharing System for Agricultural Lending
Non-Performing Loans
Nigerian Stock Exchange
Nairobi Stock Exchange (Kenyan Stock Index)
Open Buy Back
Other Financial Institutions

CBN FINANCIAL STABILITY REPORT June 2013
xi
PAIF
PCBs
PENCOM
PFAs
PFCs
PMIs
PoS
PSV 2020
ROA
ROE
ROSCAs
RTGS
S&P
SEC
SMEs
SMECGS
SROs
SSA
TSX
USAID
WAMZ
WDAS
WEO
Power and Aviation Infrastructure Fund
Private Credit Bureaux
National Pension Commission of Nigeria
Pension Fund Administrators
Pension Fund Custodians
Primary Mortgage Institutions
Point of Sale
Payments System Vision 2020
Return on Asset
Return on Equity
Rotating Savings and Credit Associations
Real-Time Gross Settlement System
Standard and Poor's
Securities and Exchange Commission
Small and Medium Enterprises
Small and Medium Enterprises Credit Guarantee Scheme
Self-Regulatory Organisations
Sub-Saharan Africa
Toronto Stock Exchange
United States Agency for International Development
West African Monetary Zone
Wholesale Dutch Auction System
World Economic Outlook
CBN FINANCIAL STABILITY REPORT June 2013
Definition and Function of Financial Stability
xii
'Financial stability' is the resilience of the financial system to unanticipated adverse
shocks, while enabling the continuing smooth functioning of the financial system's
intermediation process. A stable financial system contributes to broader economic
growth and rising living standards. The financial system performs one of the most
important functions in the welfare of its citizens by supporting the ability of households
and firms to hold or transfer financial assets with confidence.
CBN FINANCIAL STABILITY REPORT June 2013
G o v e r n o r ’ s S t a t e m e n t
xiii
The efforts of the regulatory and fiscal authorities in addressing the challenges of the
global economic and financial crises to achieve higher growth and employment were
evident in the first half of 2013. The projected weaker global demand, slower growth in
key emerging markets and slow recovery of the Eurozone would require the monetary
authorities to sustain the implementation of monetary and macro-prudential policies
to achieve financial system stability.
The Nigerian economy recorded some impressive macroeconomic achievements in
the first half of 2013 despite some challenges. In specific terms, the country recorded
strong GDP growth, single digit inflation, exchange rate stability, capital market
recovery and growth in external reserves. As well, it maintained a stable banking
system. However, oil production was less than expected owing to supply disruptions.
Also, the high proportion of foreign portfolio investments (FPIs) in the financial markets
presented a potential risk in the event of sudden capital reversals.
In response to these developments, the authorities have taken appropriate measures,
including keeping the deficit within the threshold of the Fiscal Responsibility Act,
building up foreign reserves and containing the insurgency in some parts of the North-
East Region of the country, as well as setting up a Presidential Committee to address
the challenge of crude oil theft. I am confident that these measures would serve to
stabilise the system and pave the way for enhanced economic activities.
Sanusi Lamido Sanusi, CON
Governor, Central Bank of Nigeria
CBN FINANCIAL STABILITY REPORT June 2013
D e p u t y G o v e r n o r ’ s R e m a r k s
xiv
The FSR continues to focus on strategic financial system stability challenges while
providing insights on the efforts of the CBN to entrench a stable financial system. This
edition highlights CBN's policy on financial inclusion which incorporates electronic
banking, agent banking and a cash-less economy. It also covers the Bank's efforts at
strengthening the financial system, including the take-off of the Nigerian Incentive-
based Risk Sharing System for Agricultural Lending (NIRSAL) Plc, reforms in the
mortgage sector and the various real sector intervention initiatives.
The mortgage finance sector, hitherto constrained by the near-absence of long-term
funding, received a boost with the grant by the CBN of approval-in-principle for the
incorporation of the Nigeria Mortgage Refinance Company (NMRC) in June 2013. The
Company will intermediate between mortgage originators and the capital market to
access long-term funds to refinance mortgage loan portfolios.
The announcement by AMCON, in May 2013, to redeem maturing bonds held by
private investors and restructure those held by the CBN into a 10-year bond has
enhanced confidence in the market.
It is my expectation that stakeholders will find this edition of the FSR useful in assessing
the risks in the financial system and the efforts to mitigate them.
We would appreciate your feedback on this Report to: [email protected].
Dr. Kingsley C. Moghalu, OON
Deputy Governor, Financial System Stability
CBN FINANCIAL STABILITY REPORT June 2013
E x e c u t i v e S u m m a r y
xv
Global output was projected to grow at 3.1 per cent in 2013, the same rate as in 2012,
owing to weak demand and growth in major emerging economies, persisting crisis in
the Euro area, and weak expansion of the US economy. These factors, combined with
improved supply of commodities, were also significant in moderating the global
inflation rate to a projected 1.5 per cent in 2013, from the 2.0 per cent recorded in 2012.
Crude oil price was projected to decline to an average of US$100.09 per barrel in 2013
with possible reduced earnings for Nigeria, given her high dependence on crude oil
exports.
In the first half of 2013, monetary policy rates remained low in most advanced
economies, as the US Federal Reserve, the Banks of England, Canada and Japan and
the European Central Bank held interest rates at between 0.25 and 1.00 per cent. In
most developing and emerging economies, monetary policy remained
accommodating.
In Nigeria, economic growth remained impressive in the first half of 2013, with
projected GDP growth of 6.56 and 6.18 per cent in the first and second quarters of
2013, respectively. The non-oil sector continued to drive growth, contributing 87.1 per
cent to GDP in the review period. Although oil production declined, oil contributed
12.9 per cent to the gross output. The CBN maintained its tight monetary policy stance,
which significantly moderated inflationary pressures, with the year-on-year headline
inflation rate decelerating to single-digit in the review period. Also, money market rates
fell marginally. Rates at the foreign exchange market were relatively stable. Gross
external reserves rose by US$1.13 billion to US$44.96 billion at end-June 2013, which was
adequate to finance11 months of imports.
The dominance of a few banks in the industry continued in the first half of 2013. The
maturity mismatch and the near-absence of long-term deposits continued to
constrain the ability of banks to create long-tenor risk assets necessary for economic
development. The asset quality of banks declined slightly but remained within the
maximum threshold of 5.0 per cent. On the other hand, the level of capitalization of the
banks improved during the period.
The results of the examination of banks and other financial institutions showed
improvement in risk ratings. The CBN granted an approval-in-principle for the
incorporation of the Nigeria Mortgage Refinance Company (NMRC), a private-sector
led second-tier, non-deposit taking financial institution, to enhance liquidity in the
mortgage sub-sector. The CBN also continued the implementation of its financial
inclusion strategy, which targets a reduction of the current financial exclusion rate of
46.3 per cent to 20 per cent in 2020. Also, AMCON announced its planned redemption
of bonds held by private investors at maturity while the revised Guide to Bank Charges
became effective from April 1, 2013.
CBN FINANCIAL STABILITY REPORT June 2013
xvi
In the payments system, some significant milestones were achieved, including the
nationwide commencement of cheque truncation, a reduction in the clearing cycle
to T+1, as well as an extension of the third party cheque encashment limit of 150,000,
nationwide.
This edition of the FSR is divided into five sections. Section one reviews global and
domestic economic and financial developments, highlighting key stability issues.
Section two chronicles developments in the financial system; while section three
covers regulatory and supervisory activities. Key developments in the payments
system are highlighted in section four. Finally, section five provides the outlook for the
financial system.
N
CBN FINANCIAL STABILITY REPORT June 2013
M A C R O E C O N O M I C D E V E L O P M E N T S A N D F I N A N C I A L S Y S T E M S T A B I L I T Y1.0
1.1 Global Economic and Financial
Developments
1.1.1 Output
The projected growth in global output for
2013 was reviewed downwards to 3.1 per
cent in July, the same as was achieved in
2012. The annualized global growth rose
marginally to 2.5 per cent during the first
half of 2013, the same as was recorded in
the second half of 2012. The lower-than-
expected growth was attributable to
weak domestic demand and sluggish
growth in major emerging economies,
persisting crisis in the Euro area and weak
recovery of the US economy. Downside
risks to global growth remained, due to
the continued slowdown in economic
activities in the emerging markets and
tighter financial conditions, following the
envisaged tapering of the US economic
stimulus package.
Real GDP growth in advanced
economies was projected at 1.20 per
cent in 2013, as achieved in 2012, due to
protracted recession in the Euro area.
This position would be moderated by the
expected growth of 1.75 per cent in the
US and a strong consumption-driven
growth of 2.0 per cent in Japan in 2013.
The projected growth in the US was
based on an expected improvement in
private demand occasioned by the
recovery in the US mortgage market and
supportive financial conditions. The
projection for Japan was predicated on
a stimulus package designed to boost
confidence and private demand.
Economic growth in emerging and
developing economies was projected
to increase slightly to 5.0 per cent in 2013,
from 4.9 per cent in 2012. The marginal
increase in 2013 was attributed to low
commodity prices and weak demand. In
China, growth was expected to remain
at 7.8 per cent in 2013 as in 2012, due to
slowing manufacturing growth, weak
external demand and tight credit
conditions that prevailed since 2012.
India was expected to grow at 5.6 per
cent in 2013, compared with 3.2 per cent
in 2012. The International Monetary Fund
(IMF) forecasts for Brazil, Russia, India,
China and South Africa(BRICS) indicated
a decline in the range of 0.25 to 0.75 per
cent in 2013, as the outlook for
commodi ty expor t ing count r ies
dampened, due to falling commodity
prices.
Real GDP growth in Latin America was
also projected at 3.0 per cent in 2013, the
same as recorded in 2012. Growth in
Brazil was projected to increase to 2.5 per
cent in 2013, from 0.9 per cent in 2012,
while growth in Mexico was projected to
decline to 2.9 per cent in 2013, from 3.9
per cent in 2012.
In Sub-Sahara Africa (SSA), growth was
also yet to recover fully following the
decline in 2012 to 4.9 percent from 5.4
per cent recorded in 2011. In 2013, it was
forecast at 5.1 per cent which was still
below the level in 2011. The slow recovery
in growth in SSA was attributed partly to
weak external demand and domestic
challenges in the region's two largest
economies (Nigeria and South Africa).
Growth in the Middle East and North
Africa (MENA) region was projected to
decline to 3.1 per cent in 2013, from 4.4
per cent in 2012, due to political and
social instability (Table 1.1).
1
CBN FINANCIAL STABILITY REPORT June 2013
2
Table 1.1: World Output Growth and Projections (2012-2013)
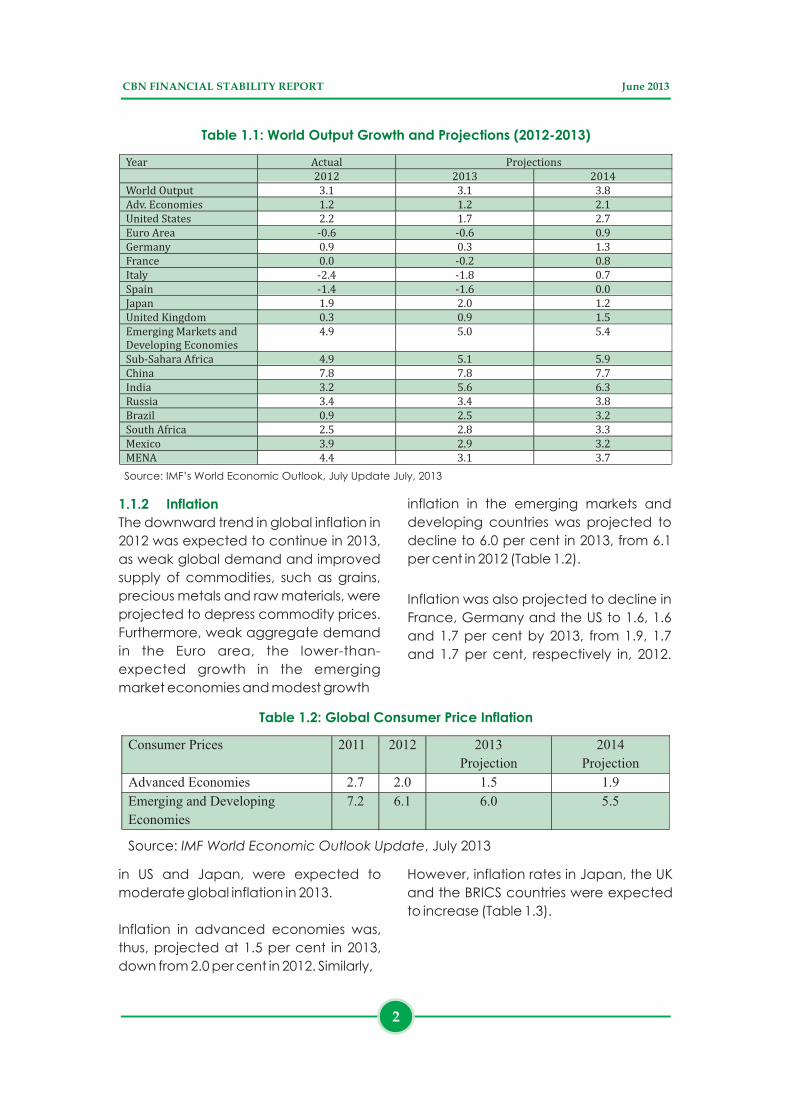
1.1.2 Inflation
The downward trend in global inflation in
2012 was expected to continue in 2013,
as weak global demand and improved
supply of commodities, such as grains,
precious metals and raw materials, were
projected to depress commodity prices.
Furthermore, weak aggregate demand
in the Euro area, the lower-than-
expected growth in the emerging
market economies and modest growth
Table 1.2: Global Consumer Price Inflation
in US and Japan, were expected to
moderate global inflation in 2013.
Inflation in advanced economies was,
thus, projected at 1.5 per cent in 2013,
down from 2.0 per cent in 2012. Similarly,
Year Actual
Projections
2012
2013
2014
World Output
3.1
3.1
3.8
Adv. Economies
1.2
1.2
2.1
United States
2.2
1.7
2.7
Euro Area
-0.6
-0.6
0.9
Germany
0.9
0.3
1.3
France
0.0
-0.2
0.8
Italy -2.4
-1.8
0.7
Spain -1.4
-1.6
0.0
Japan 1.9 2.0 1.2
United Kingdom 0.3 0.9 1.5 Emerging Markets and Developing Economies
4.9 5.0 5.4
Sub-Sahara Africa
4.9
5.1
5.9
China 7.8
7.8
7.7 India 3.2
5.6
6.3
Russia
3.4
3.4
3.8
Brazil 0.9
2.5
3.2
South Africa
2.5
2.8
3.3
Mexico 3.9
2.9
3.2MENA 4.4 3.1 3.7
Source: IMF’s World Economic Outlook, July Update July, 2013
Consumer Prices
2011
2012 2013
Projection
2014
Projection
Advanced Economies 2.7 2.0 1.5 1.9
Emerging and Developing
Economies
7.2 6.1 6.0 5.5
Source: IMF World Economic Outlook Update, July 2013
Inflation was also projected to decline in
France, Germany and the US to 1.6, 1.6
and 1.7 per cent by 2013, from 1.9, 1.7
and 1.7 per cent, respectively in, 2012.
However, inflation rates in Japan, the UK
and the BRICS countries were expected
to increase (Table 1.3).
inflation in the emerging markets and
developing countries was projected to
decline to 6.0 per cent in 2013, from 6.1
per cent in 2012 (Table 1.2).
CBN FINANCIAL STABILITY REPORT June 2013
3
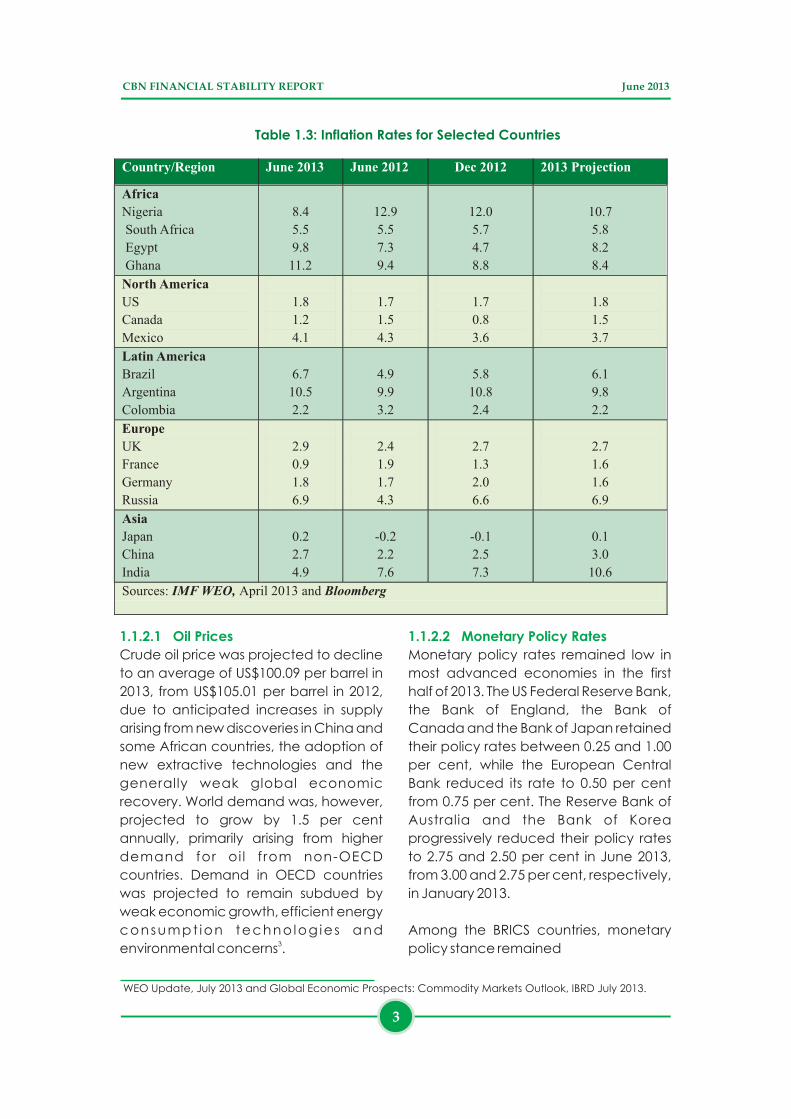
1.1.2.1 Oil Prices
Crude oil price was projected to decline
to an average of US$100.09 per barrel in
2013, from US$105.01 per barrel in 2012,
due to anticipated increases in supply
arising from new discoveries in China and
some African countries, the adoption of
new extractive technologies and the
generally weak global economic
recovery. World demand was, however,
projected to grow by 1.5 per cent
annually, primarily arising from higher
demand for oi l f rom non-OECD
countries. Demand in OECD countries
was projected to remain subdued by
weak economic growth, efficient energy
consumpt ion techno log ies and 3environmental concerns .
1.1.2.2 Monetary Policy Rates
Monetary policy rates remained low in
most advanced economies in the first
half of 2013. The US Federal Reserve Bank,
the Bank of England, the Bank of
Canada and the Bank of Japan retained
their policy rates between 0.25 and 1.00
per cent, while the European Central
Bank reduced its rate to 0.50 per cent
from 0.75 per cent. The Reserve Bank of
Australia and the Bank of Korea
progressively reduced their policy rates
to 2.75 and 2.50 per cent in June 2013,
from 3.00 and 2.75 per cent, respectively,
in January 2013.
Among the BRICS countries, monetary
policy stance remained
WEO Update, July 2013 and Global Economic Prospects: Commodity Markets Outlook, IBRD July 2013.
Table 1.3: Inflation Rates for Selected Countries
Country/Region June 2013 June 2012 Dec 2012 2013 Projection
Africa Nigeria
South Africa
Egypt
Ghana
8.4 5.5 9.8
11.2
12.9 5.5 7.3
9.4
12.0 5.7 4.7
8.8
10.7 5.8 8.2
8.4
North America
US
Canada Mexico
1.8
1.2 4.1
1.7
1.5 4.3
1.7
0.8 3.6
1.8
1.5 3.7 Latin America
Brazil
Argentina
Colombia
6.7
10.5
2.2
4.9
9.9
3.2
5.8
10.8
2.4
6.1
9.8
2.2
Europe
UK
France
Germany
Russia
2.9
0.9
1.8
6.9
2.4
1.9
1.7
4.3
2.7
1.3
2.0
6.6
2.7
1.6
1.6
6.9
Asia
Japan
China
India
0.2
2.7
4.9
-0.2
2.2
7.6
-0.1
2.5
7.3
0.1
3.0
10.6
Sources: IMF WEO, April 2013 and Bloomberg
CBN FINANCIAL STABILITY REPORT June 2013
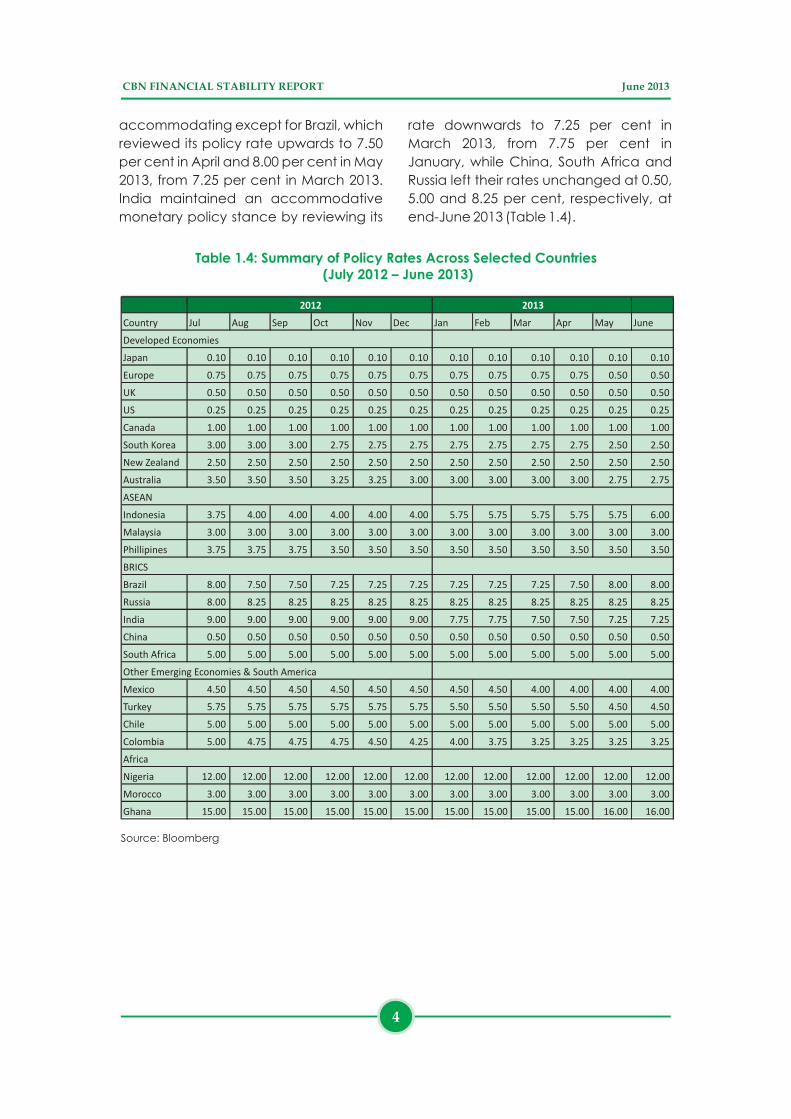
accommodating except for Brazil, which
reviewed its policy rate upwards to 7.50
per cent in April and 8.00 per cent in May
2013, from 7.25 per cent in March 2013.
India maintained an accommodative
monetary policy stance by reviewing its
Source: Bloomberg
4
rate downwards to 7.25 per cent in
March 2013, from 7.75 per cent in
January, while China, South Africa and
Russia left their rates unchanged at 0.50,
5.00 and 8.25 per cent, respectively, at
end-June 2013 (Table 1.4).
Table 1.4: Summary of Policy Rates Across Selected Countries (July 2012 – June 2013)
Country Jul Aug Sep Oct Nov Dec Jan Feb Mar Apr May June
Developed Economies
Japan 0.10
0.10
0.10
0.10
0.10
0.10
0.10
0.10
0.10
0.10
0.10
0.10
Europe 0.75
0.75
0.75
0.75
0.75
0.75
0.75
0.75
0.75
0.75
0.50
0.50
UK 0.50
0.50
0.50
0.50
0.50
0.50
0.50
0.50
0.50
0.50
0.50
0.50
US 0.25
0.25
0.25
0.25
0.25
0.25
0.25
0.25
0.25
0.25
0.25
0.25
Canada 1.00
1.00
1.00
1.00
1.00
1.00
1.00
1.00
1.00
1.00
1.00
1.00
South Korea 3.00
3.00
3.00
2.75
2.75
2.75
2.75
2.75
2.75
2.75
2.50
2.50
New Zealand 2.50
2.50
2.50
2.50
2.50
2.50
2.50
2.50
2.50
2.50
2.50
2.50
Australia 3.50
3.50
3.50
3.25
3.25
3.00
3.00
3.00
3.00
3.00
2.75
2.75
ASEAN
Indonesia 3.75 4.00 4.00 4.00 4.00 4.00 5.75 5.75 5.75 5.75 5.75 6.00
Malaysia 3.00 3.00 3.00 3.00 3.00 3.00 3.00 3.00 3.00 3.00 3.00 3.00
Phillipines 3.75 3.75 3.75 3.50 3.50 3.50 3.50 3.50 3.50 3.50 3.50 3.50
BRICS
Brazil 8.00 7.50 7.50 7.25 7.25 7.25 7.25 7.25 7.25 7.50 8.00 8.00 Russia 8.00
8.25
8.25
8.25
8.25
8.25
8.25
8.25
8.25
8.25
8.25
8.25
India 9.00
9.00
9.00
9.00
9.00
9.00
7.75
7.75
7.50
7.50
7.25
7.25
China 0.50
0.50
0.50
0.50
0.50
0.50
0.50
0.50
0.50
0.50
0.50
0.50
South Africa 5.00
5.00
5.00
5.00
5.00
5.00
5.00
5.00
5.00
5.00
5.00
5.00
Other Emerging Economies & South America
Mexico 4.50
4.50
4.50
4.50
4.50
4.50
4.50
4.50
4.00
4.00
4.00
4.00
Turkey 5.75
5.75
5.75
5.75
5.75
5.75
5.50
5.50
5.50
5.50
4.50
4.50
Chile 5.00
5.00
5.00
5.00
5.00
5.00
5.00
5.00
5.00
5.00
5.00
5.00
Colombia 5.00
4.75
4.75
4.75
4.50
4.25
4.00
3.75
3.25
3.25
3.25
3.25
Africa
Nigeria 12.00
12.00
12.00
12.00
12.00
12.00
12.00
12.00
12.00
12.00
12.00
12.00
Morocco 3.00
3.00
3.00
3.00
3.00
3.00
3.00
3.00
3.00
3.00
3.00
3.00
Ghana 15.00
15.00
15.00
15.00
15.00
15.00
15.00
15.00
15.00
15.00
16.00
16.00
20132012

CBN FINANCIAL STABILITY REPORT June 2013
1.2 Domestic Developments
1.2.1 Output
Domestic economic growth remained
impressive in the first half of 2013, despite
the slight decline from its level in the
preceding quarter. The development
was att r ibutable to the s table
macroeconomic environment and
better coordination of monetary and
fiscal policies. In real terms, GDP growth
was 6.56 and 6.18 per cent in the first and
second quarters of 2013, compared with
6.39 and 6.99 per cent, respectively,
recorded in second and fourth quarters
of 2012. In the second quarter of 2013,
the non-oil sector recorded a growth of
7.36 per cent in real terms and
contributed 87.1 per cent to real GDP,
compared with the growth of 7.89 and
7.63 per cent, respectively, in the first
quarter of 2013 and the corresponding
quarter of 2012. The growth in the non-oil
sector was driven by the growth in
a c t i v i t i e s r e c o r d e d i n t h e
telecommunications and postal services
(22.12%), building and construction
(14.87%), hotels and restaurants
(13.69%), solid minerals (11.84%), business
and other services (11.33%), real estate
(10.88%), manufacturing (6.81%) and
agricultural (4.52%) sectors.
The oil sector recorded a real growth rate
of -1.15 per cent and contributed 12.9
per cent to GDP in the second quarter of
2013, compared with a growth rate and
contribution of -0.54 and -0.78 per cent,
respectively, recorded in the first quarter
of 2013 and the corresponding quarter of
2012. The 12.9 per cent contribution to
GDP was, however, lower than the
respective 14.75 and 13.86 per cent
contributions recorded in the first quarter
of 2013 and the corresponding quarter of
2012. The decline in the growth rate of
the oil sector was attributed to low
production levels occasioned by oil
theft, pipeline vandalism and other
operational challenges. While these
challenges are being addressed by
Government, the emergence of other
African countries as oil producers
portends increased competition and the
risk of lower returns from Nigeria's oil
exports.
Figure 1.1 Gross Domestic Product
Source: National Bureau of Statistics
5
0
50
Q1 12 Q2 12 Q3 12 Q4 12 Q1 13 Q2 13
Nb
illi
on
Crop Production Crude petroleum and nat res. Building & Const
Wholesale and Retail Trade Telecommunications Real Estate
100
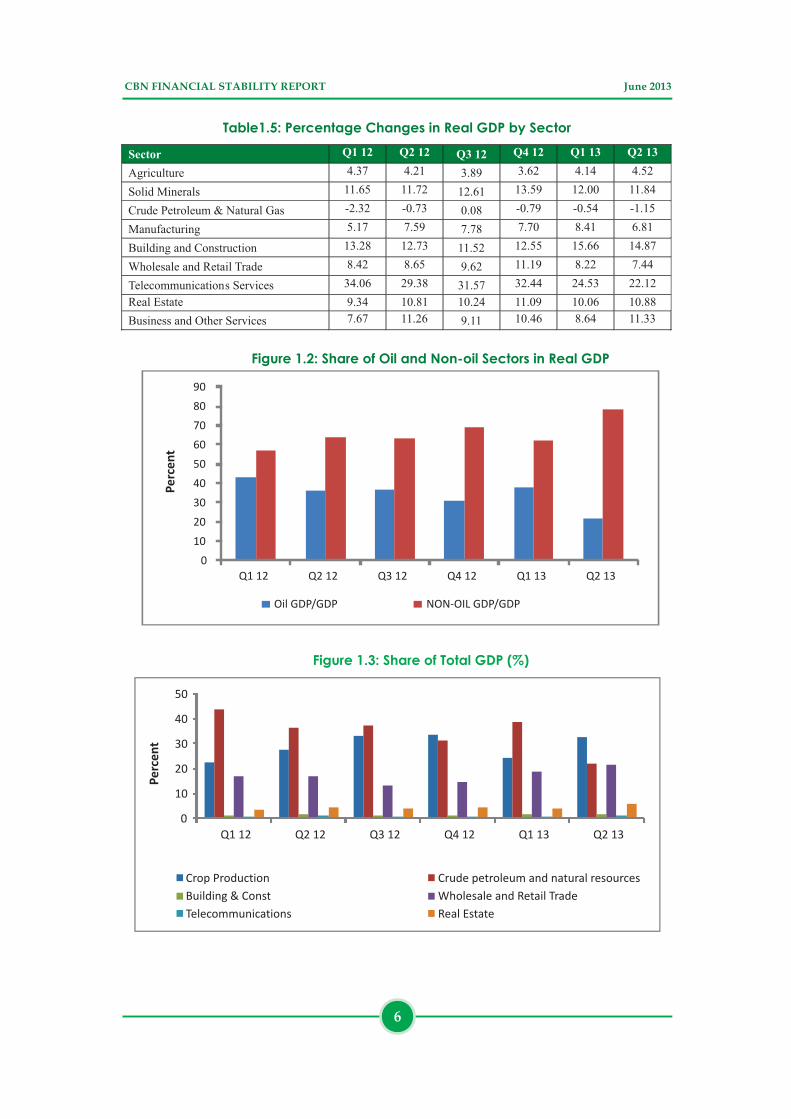
Table1.5: Percentage Changes in Real GDP by Sector
Sector
Q1 12
Q2 12
Q3 12
Q4 12
Q1 13
Q2 13
Agriculture
4.37
4.21
3.89
3.62
4.14 4.52
Solid Minerals 11.65
11.72
12.61
13.59 12.00
11.84
Crude Petroleum & Natural Gas -2.32 -0.73 0.08 -0.79 -0.54 -1.15
Manufacturing 5.17 7.59 7.78 7.70 8.41 6.81
Building and Construction 13.28 12.73 11.52 12.55 15.66 14.87
Wholesale and Retail Trade 8.42 8.65 9.62
11.19 8.22 7.44
Telecommunications
Services
34.06
29.38 31.57
32.44
24.53
22.12
Real Estate
9.34
10.81
10.24
11.09 10.06
10.88
Business and Other Services
7.67
11.26
9.11
10.46 8.64
11.33
0
10
20
30
40
50
60
70
80
90
Q1 12 Q2 12 Q3 12 Q4 12 Q1 13 Q2 13
Pe
rce
nt
Oil GDP/GDP NON-OIL GDP/GDP
0
10
20
30
40
50
Q1 12 Q2 12 Q3 12 Q4 12 Q1 13 Q2 13
Crop Production Crude petroleum and natural resources
Building & Const Wholesale and Retail Trade
Telecommunications Real Estate
Figure 1.2: Share of Oil and Non-oil Sectors in Real GDP
Figure 1.3: Share of Total GDP (%)
Pe
rce
nt
CBN FINANCIAL STABILITY REPORT June 2013
6

CBN FINANCIAL STABILITY REPORT June 2013
1.2.2 Inflation
Inflationary pressures moderated in the
first half of 2013, partly in response to the
tight monetary policy stance of the CBN
and the stability in the supply of
petroleum products. Year-on-year
headline inflation decelerated to 8.4 per
cent in June 2013, from 12.0 per cent in
December 2012. Also, core and food
inflation declined to 5.5 and 9.6 per cent,
from their respective rates of 13.7 and
10.2 per cent in December 2012. Key risks
to inflation in the short to medium term
include possible accelerated fiscal
releases in the latter part of the year and
the upward review of electricity tariffs.
The CBN maintained its policy rate at
12.00 per cent during the review period.
Consequently, interest rates were
relatively stable in the money market,
though lower than their levels in the
second half of 2012. The average inter-
bank call and open buyback (OBB) rates
stood at 11.55 and 11.36 per cent in the
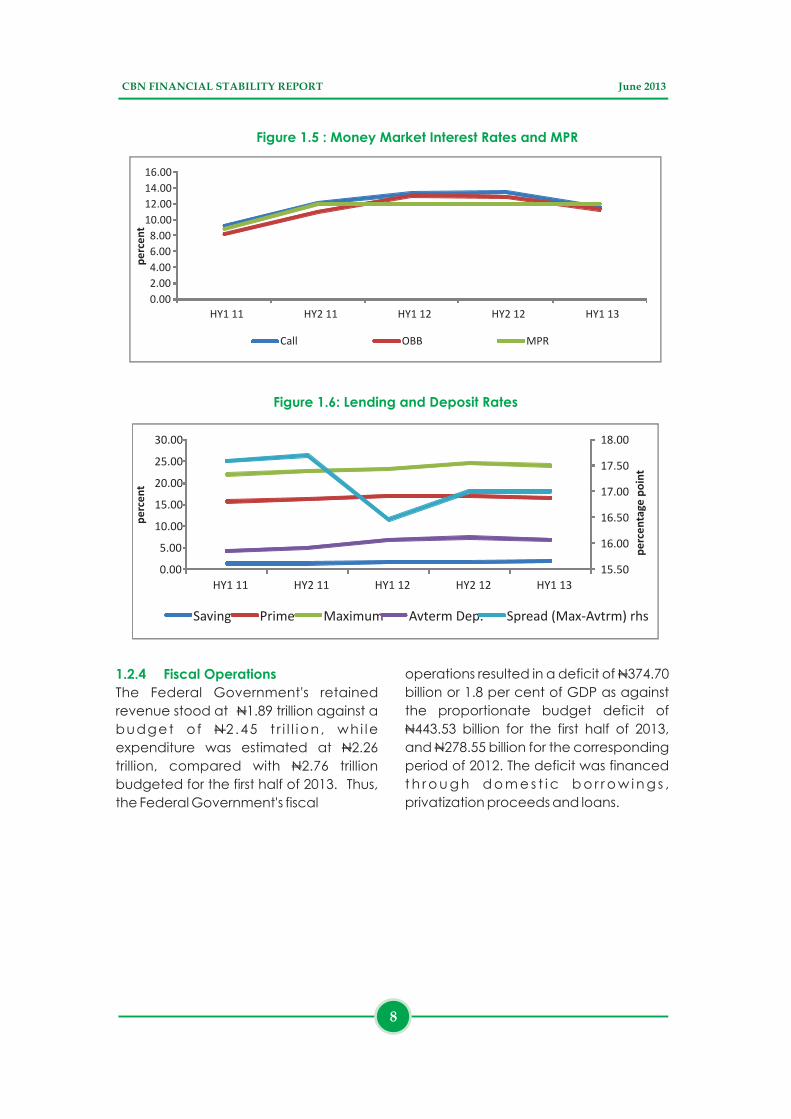
1.2.3 Interest Rates
Figure 1.4: Inflationary Trend (Year-on-Year)
0
2
4
6
8
10
12
14
16
Q1 12 Q2 12 Q312 Q412 Q1 13 Q2 13
Pe
rce
nt
Head line (Y-o-Y) Core (Y-o-Y) Food (Y-o-Y)
first half of 2013, down from 13.44 and
12.87 per cent respectively in the second
half of 2012. Average term deposit rate
also fell to 6.87 per cent, from 7.51 per
cent in the second half of 2012. Prime
and maximum lending rates fell by 0.43
a n d 0 . 3 4 p e r c e n t a g e p o i n t s ,
respectively, to 16.58 and 24.18 per cent
in the review period. Thus, the spread
between the maximum lending and the
average term deposit rates stood at
17.31 percentage points, a 0.3
percentage point higher than the level in
the second half of 2012. With the inflation
rate at 8.4 per cent in June 2013, most
deposit rates were negative in real terms,
while lending and most money market
rates were positive in real terms. The
negative real rate of return on deposits
acts as a disincentive to savings. Thus, as
part of the ongoing efforts to improve the
savings culture, the CBN revised the
Guide to Bank Charges, effective April 1,
2013, requiring banks to pay a minimum
of 30 per cent of MPR on savings
accounts, among others.
7
CBN FINANCIAL STABILITY REPORT June 2013
Figure 1.5 : Money Market Interest Rates and MPR
0.00
2.00
4.00
6.00
8.00
10.00
12.00
14.00
16.00
HY1 11 HY2 11 HY1 12 HY2 12 HY1 13
pe
rce
nt
Call OBB MPR
Figure 1.6: Lending and Deposit Rates
15.50
16.00
16.50
17.00
17.50
18.00
0.00
5.00
10.00
15.00
20.00
25.00
30.00
HY1 11 HY2 11 HY1 12 HY2 12 HY1 13
pe
rce
nta
ge p
oin
t
Saving Prime Maximum Avterm Dep. Spread (Max-Avtrm) rhs
pe
rce
nt
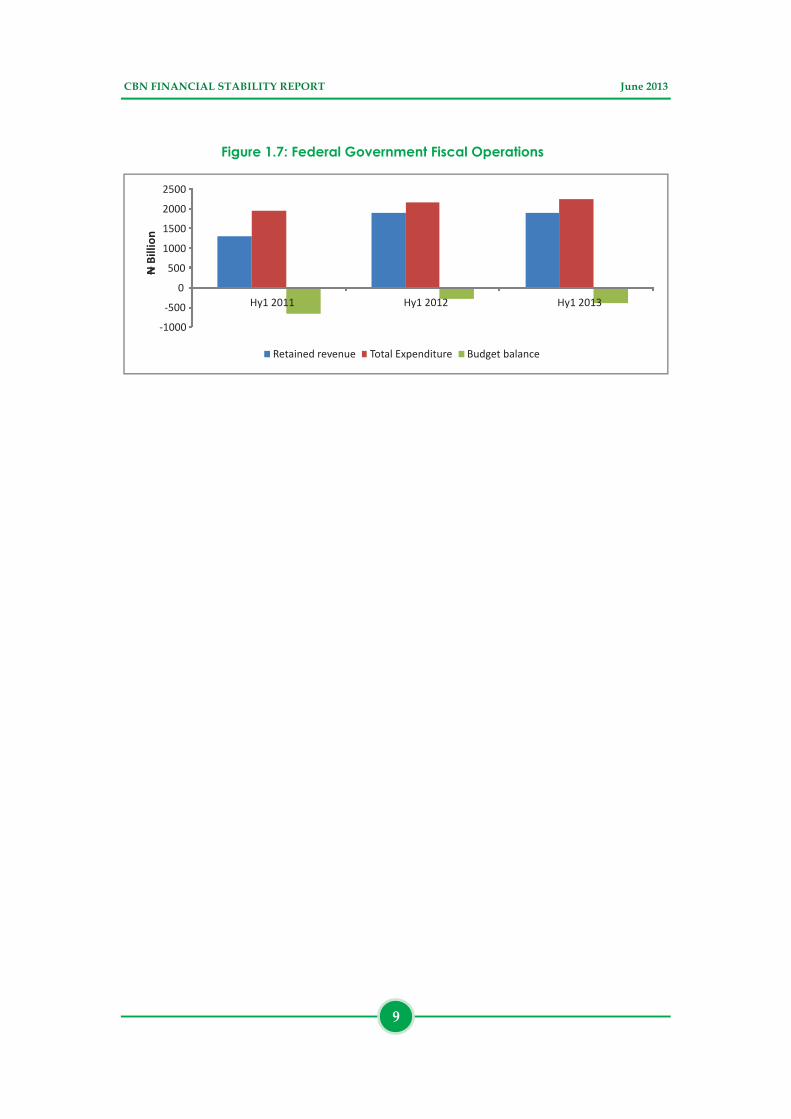
1.2.4 Fiscal Operations
The Federal Government's retained
revenue stood at N1.89 trillion against a
budget o f N2 .45 t r i l l ion , wh i le
expenditure was estimated at N2.26
trillion, compared with N2.76 trillion
budgeted for the first half of 2013. Thus,
the Federal Government's fiscal
operations resulted in a deficit of N374.70
billion or 1.8 per cent of GDP as against
the proportionate budget deficit of
N443.53 billion for the first half of 2013,
and N278.55 billion for the corresponding
period of 2012. The deficit was financed
t h r o u g h d o m e s t i c b o r r o w i n g s ,
privatization proceeds and loans.
8
CBN FINANCIAL STABILITY REPORT June 2013
Figure 1.7: Federal Government Fiscal Operations
-1000
-500
0
500
1000
1500
2000
2500
Hy1 2011 Hy1 2012 Hy1 2013
N B
illio
n
Retained revenue Total Expenditure Budget balance
9

DEVELOPMENTS IN THE FINANCIAL SYSTEM2.0
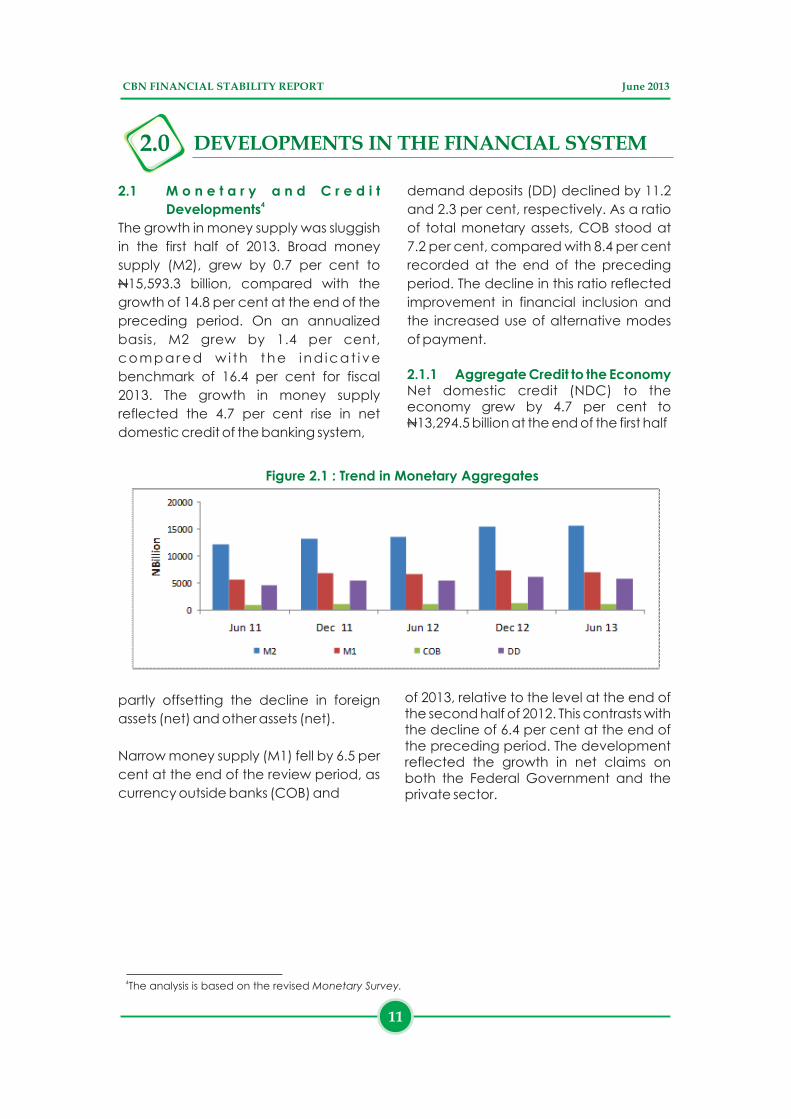
2.1 M o n e t a r y a n d C r e d i t 4Developments
The growth in money supply was sluggish
in the first half of 2013. Broad money
supply (M2), grew by 0.7 per cent to
N15,593.3 billion, compared with the
growth of 14.8 per cent at the end of the
preceding period. On an annualized
basis, M2 grew by 1.4 per cent,
compared w i th the ind icat i ve
benchmark of 16.4 per cent for fiscal
2013. The growth in money supply
reflected the 4.7 per cent rise in net
domestic credit of the banking system,
Figure 2.1 : Trend in Monetary Aggregates
partly offsetting the decline in foreign
assets (net) and other assets (net).
Narrow money supply (M1) fell by 6.5 per
cent at the end of the review period, as
currency outside banks (COB) and
demand deposits (DD) declined by 11.2
and 2.3 per cent, respectively. As a ratio
of total monetary assets, COB stood at
7.2 per cent, compared with 8.4 per cent
recorded at the end of the preceding
period. The decline in this ratio reflected
improvement in financial inclusion and
the increased use of alternative modes
of payment.
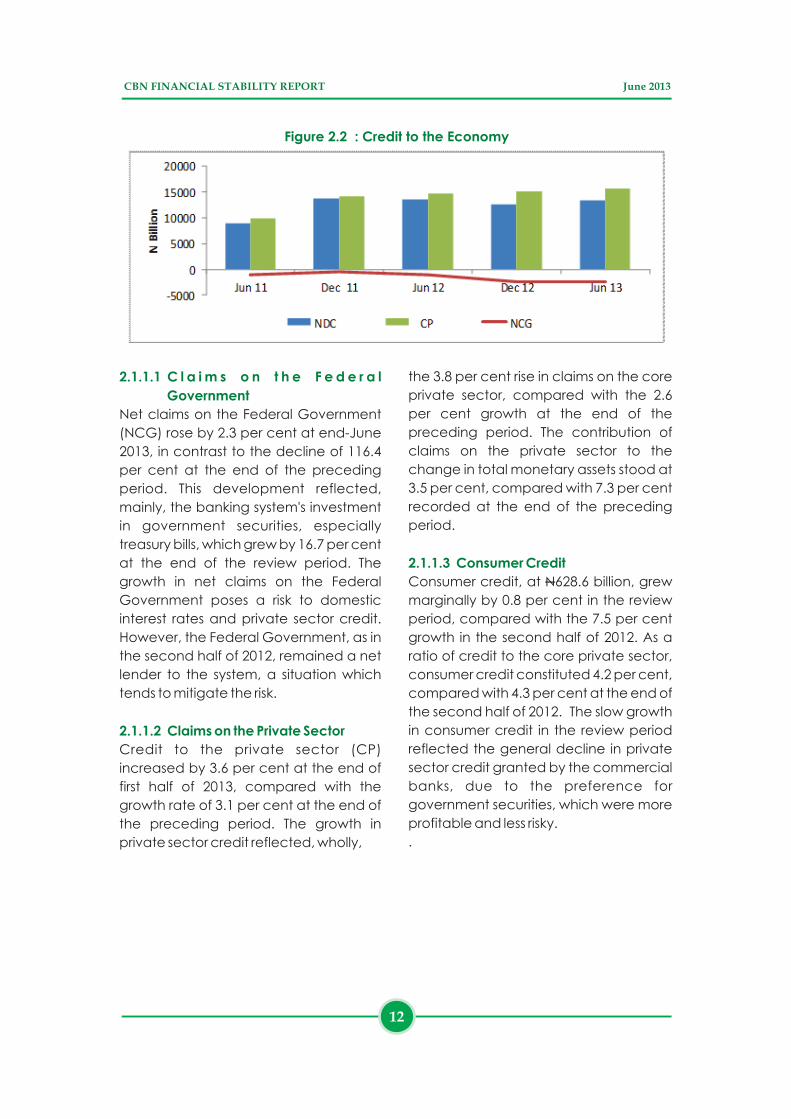
Net domestic credit (NDC) to the economy grew by 4.7 per cent to N13,294.5 billion at the end of the first half
2.1.1 Aggregate Credit to the Economy
of 2013, relative to the level at the end of the second half of 2012. This contrasts with the decline of 6.4 per cent at the end of the preceding period. The development reflected the growth in net claims on both the Federal Government and the private sector.
4 The analysis is based on the revised Monetary Survey.
CBN FINANCIAL STABILITY REPORT June 2013
11
2.1.1.1 C l a i m s o n t h e F e d e r a l
Government
2.1.1.2 Claims on the Private Sector
Net claims on the Federal Government
(NCG) rose by 2.3 per cent at end-June
2013, in contrast to the decline of 116.4
per cent at the end of the preceding
period. This development reflected,
mainly, the banking system's investment
in government securities, especially
treasury bills, which grew by 16.7 per cent
at the end of the review period. The
growth in net claims on the Federal
Government poses a risk to domestic
interest rates and private sector credit.
However, the Federal Government, as in
the second half of 2012, remained a net
lender to the system, a situation which
tends to mitigate the risk.
Credit to the private sector (CP)
increased by 3.6 per cent at the end of
first half of 2013, compared with the
growth rate of 3.1 per cent at the end of
the preceding period. The growth in
private sector credit reflected, wholly,
the 3.8 per cent rise in claims on the core
private sector, compared with the 2.6
per cent growth at the end of the
preceding period. The contribution of
claims on the private sector to the
change in total monetary assets stood at
3.5 per cent, compared with 7.3 per cent
recorded at the end of the preceding
period.
Consumer credit, at N628.6 billion, grew
marginally by 0.8 per cent in the review
period, compared with the 7.5 per cent
growth in the second half of 2012. As a
ratio of credit to the core private sector,
consumer credit constituted 4.2 per cent,
compared with 4.3 per cent at the end of
the second half of 2012. The slow growth
in consumer credit in the review period
reflected the general decline in private
sector credit granted by the commercial
banks, due to the preference for
government securities, which were more
profitable and less risky.
.
2.1.1.3 Consumer Credit
Figure 2.2 : Credit to the Economy
CBN FINANCIAL STABILITY REPORT June 2013
12
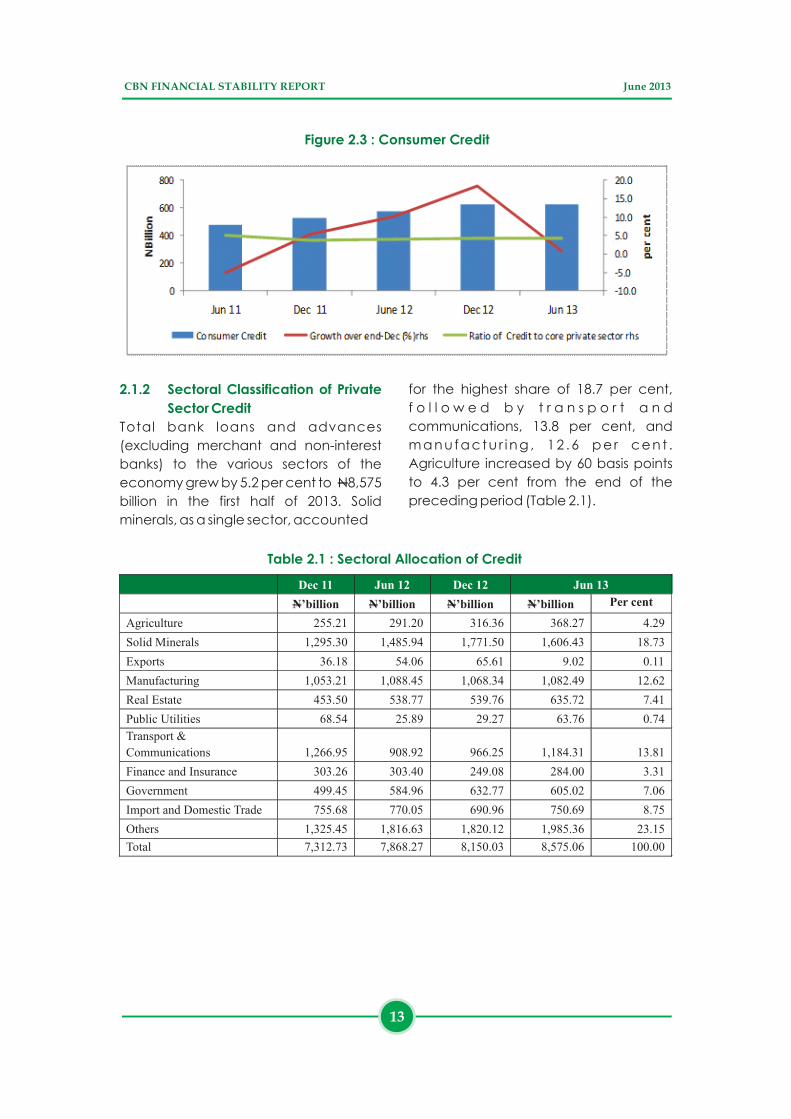
2.1.2 Sectoral Classification of Private
Sector Credit
Total bank loans and advances
(excluding merchant and non-interest
banks) to the various sectors of the
economy grew by 5.2 per cent to N8,575
billion in the first half of 2013. Solid
minerals, as a single sector, accounted
for the highest share of 18.7 per cent,
f o l l o w e d b y t r a n s p o r t a n d
communications, 13.8 per cent, and
manufactu r ing , 12 .6 pe r cent .
Agriculture increased by 60 basis points
to 4.3 per cent from the end of the
preceding period (Table 2.1).
Figure 2.3 : Consumer Credit
Dec 11
Jun 12
Dec 12
Jun 13
N’billion
N’billion
N’billion
N’billion Per cent
Agriculture
255.21
291.20
316.36
368.27
4.29
Solid Minerals
1,295.30
1,485.94
1,771.50
1,606.43
18.73
Exports
36.18
54.06
65.61
9.02
0.11
Manufacturing 1,053.21 1,088.45 1,068.34 1,082.49 12.62
Real Estate 453.50 538.77 539.76 635.72 7.41
Public Utilities 68.54 25.89 29.27 63.76 0.74
Transport &
Communications 1,266.95 908.92 966.25 1,184.31 13.81
Finance and Insurance
303.26
303.40
249.08
284.00
3.31
Government
499.45
584.96
632.77
605.02
7.06
Import and Domestic Trade
755.68
770.05
690.96
750.69
8.75
Others
1,325.45
1,816.63
1,820.12
1,985.36
23.15
Total 7,312.73 7,868.27 8,150.03 8,575.06 100.00
Table 2.1 : Sectoral Allocation of Credit
CBN FINANCIAL STABILITY REPORT June 2013
13
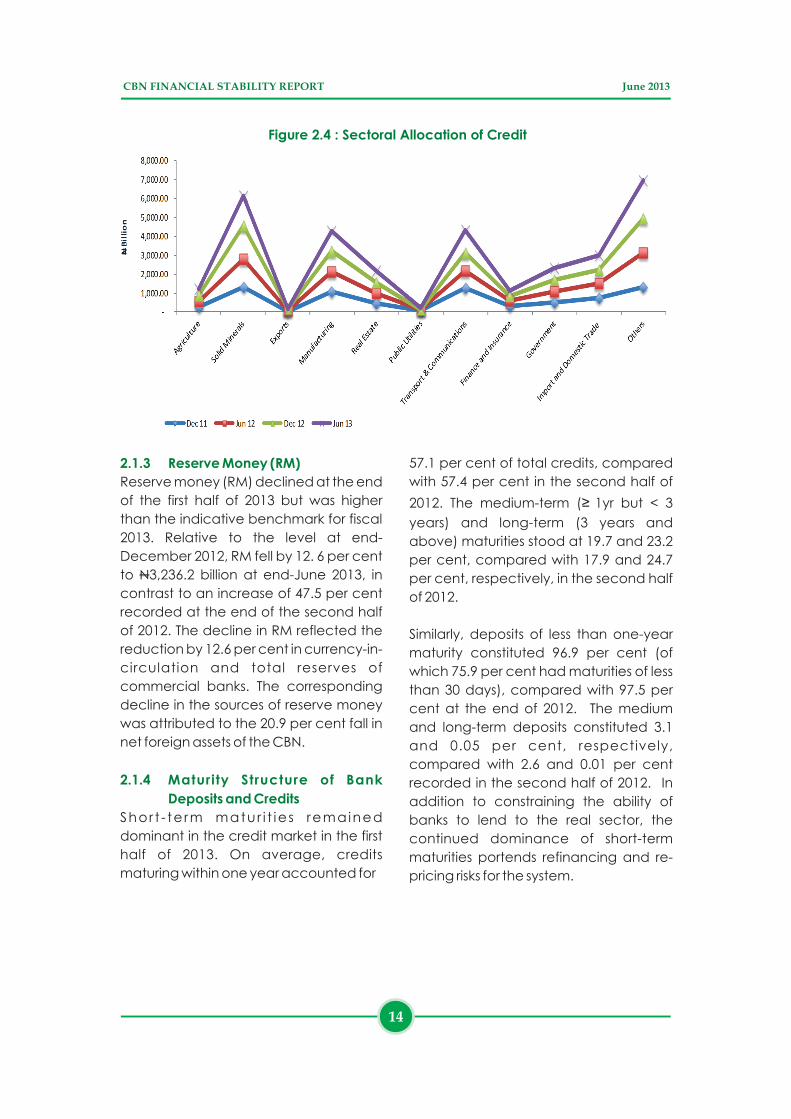
Figure 2.4 : Sectoral Allocation of Credit
2.1.3 Reserve Money (RM)
2.1.4 Maturity Structure of Bank
Deposits and Credits
Reserve money (RM) declined at the end
of the first half of 2013 but was higher
than the indicative benchmark for fiscal
2013. Relative to the level at end-
December 2012, RM fell by 12. 6 per cent
to N3,236.2 billion at end-June 2013, in
contrast to an increase of 47.5 per cent
recorded at the end of the second half
of 2012. The decline in RM reflected the
reduction by 12.6 per cent in currency-in-
circulation and total reserves of
commercial banks. The corresponding
decline in the sources of reserve money
was attributed to the 20.9 per cent fall in
net foreign assets of the CBN.
Shor t - te rm matur i t ies remained
dominant in the credit market in the first
half of 2013. On average, credits
maturing within one year accounted for
57.1 per cent of total credits, compared
with 57.4 per cent in the second half of
2012. The medium-term (≥ 1yr but < 3
years) and long-term (3 years and
above) maturities stood at 19.7 and 23.2
per cent, compared with 17.9 and 24.7
per cent, respectively, in the second half
of 2012.
Similarly, deposits of less than one-year
maturity constituted 96.9 per cent (of
which 75.9 per cent had maturities of less
than 30 days), compared with 97.5 per
cent at the end of 2012. The medium
and long-term deposits constituted 3.1
and 0.05 per cent, respectively,
compared with 2.6 and 0.01 per cent
recorded in the second half of 2012. In
addition to constraining the ability of
banks to lend to the real sector, the
continued dominance of short-term
maturities portends refinancing and re-
pricing risks for the system.
CBN FINANCIAL STABILITY REPORT June 2013
14
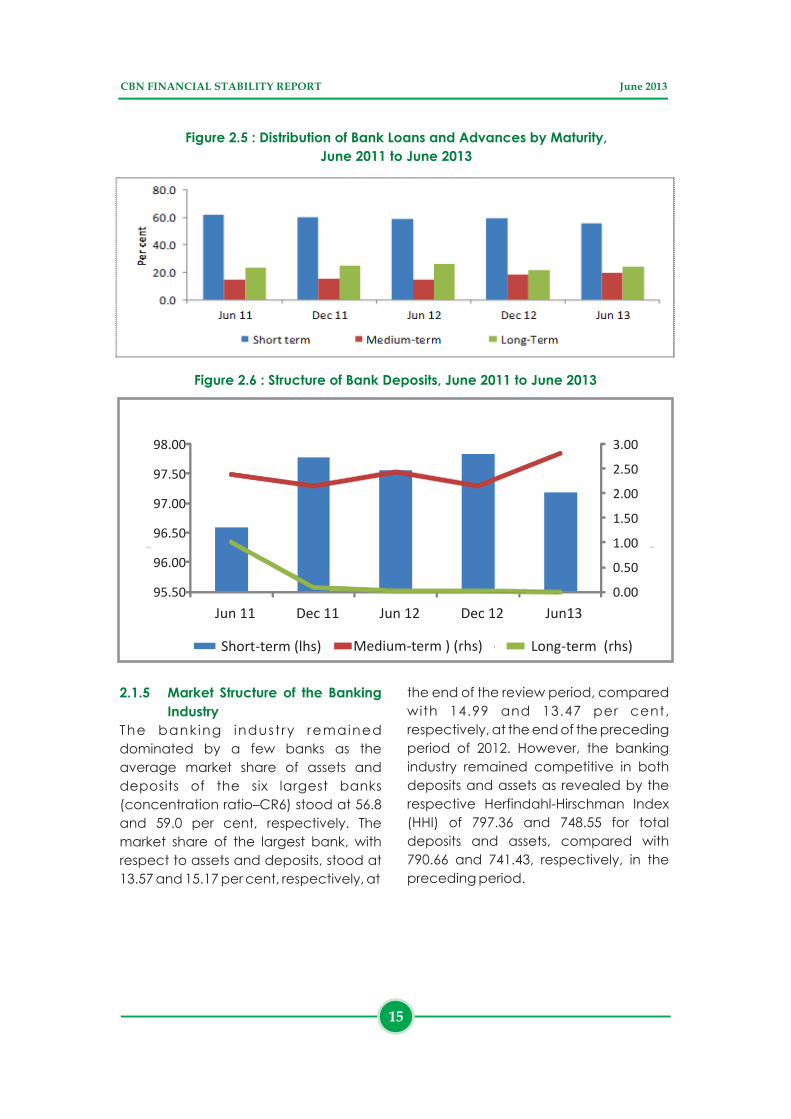
Figure 2.5 : Distribution of Bank Loans and Advances by Maturity,
June 2011 to June 2013
Figure 2.6 : Structure of Bank Deposits, June 2011 to June 2013
0.00
0.50
1.00
1.50
2.00
2.50
3.00
95.50
96.00
96.50
97.00
97.50
98.00
Jun 11 Dec 11 Jun 12 Dec 12 Jun13
Per centPer cent
Short-term (lhs) Medium-term ) (rhs)
Long-term (rhs)
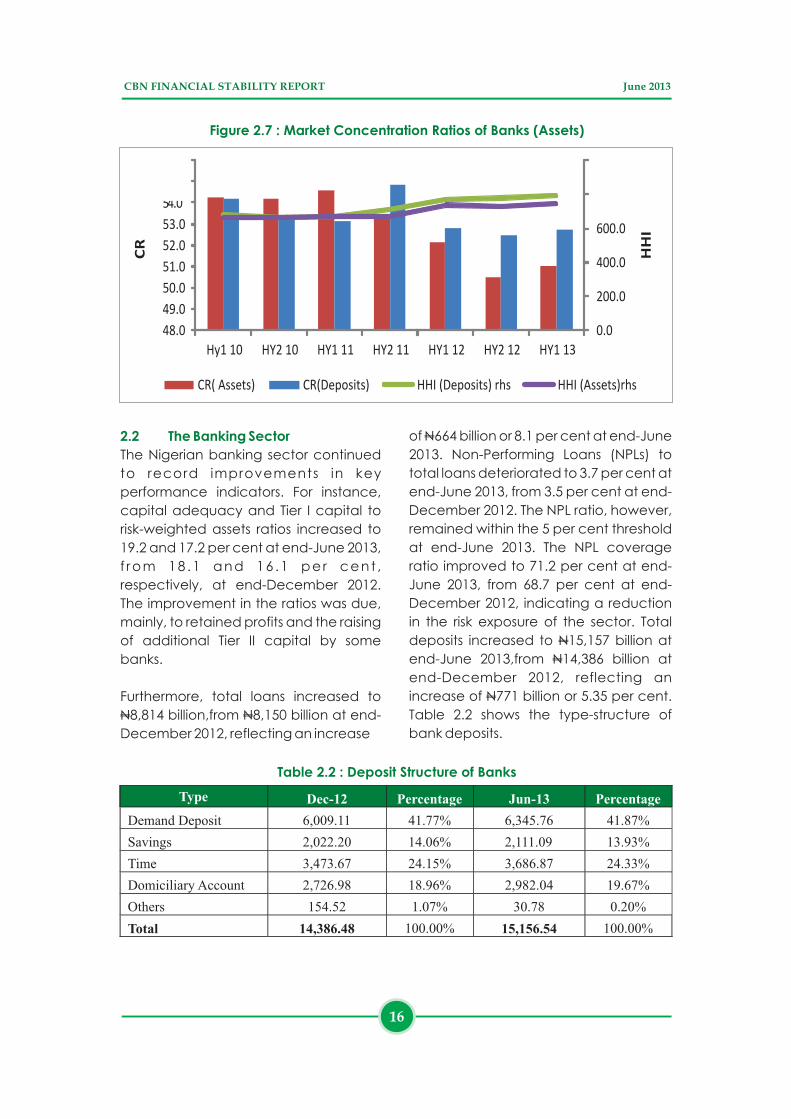
2.1.5 Market Structure of the Banking
Industry
The banking indust ry remained
dominated by a few banks as the
average market share of assets and
deposits of the six largest banks
(concentration ratio–CR6) stood at 56.8
and 59.0 per cent, respectively. The
market share of the largest bank, with
respect to assets and deposits, stood at
13.57 and 15.17 per cent, respectively, at
the end of the review period, compared
with 14.99 and 13.47 per cent,
respectively, at the end of the preceding
period of 2012. However, the banking
industry remained competitive in both
deposits and assets as revealed by the
respective Herfindahl-Hirschman Index
(HHI) of 797.36 and 748.55 for total
deposits and assets, compared with
790.66 and 741.43, respectively, in the
preceding period.
CBN FINANCIAL STABILITY REPORT June 2013
15
0.0
200.0
400.0
600.0
48.0
49.0
50.0
51.0
52.0
53.0
Hy1 10 HY2 10 HY1 11 HY2 11 HY1 12 HY2 12 HY1 13
HH
I
CR( Assets) CR(Deposits) HHI (Deposits) rhs HHI (Assets)rhs
Figure 2.7 : Market Concentration Ratios of Banks (Assets)C
R
2.2 The Banking Sector
The Nigerian banking sector continued
to record improvements in key
performance indicators. For instance,
capital adequacy and Tier I capital to
risk-weighted assets ratios increased to
19.2 and 17.2 per cent at end-June 2013,
f rom 18 .1 and 16 .1 per cent ,
respectively, at end-December 2012.
The improvement in the ratios was due,
mainly, to retained profits and the raising
of additional Tier II capital by some
banks.
Furthermore, total loans increased to
N8,814 billion,from N8,150 billion at end-
December 2012, reflecting an increase
of N664 billion or 8.1 per cent at end-June
2013. Non-Performing Loans (NPLs) to
total loans deteriorated to 3.7 per cent at
end-June 2013, from 3.5 per cent at end-
December 2012. The NPL ratio, however,
remained within the 5 per cent threshold
at end-June 2013. The NPL coverage
ratio improved to 71.2 per cent at end-
June 2013, from 68.7 per cent at end-
December 2012, indicating a reduction
in the risk exposure of the sector. Total
deposits increased to N15,157 billion at
end-June 2013,from N14,386 billion at
end-December 2012, reflecting an
increase of N771 billion or 5.35 per cent.
Table 2.2 shows the type-structure of
bank deposits.
Type
Dec-12
Percentage
Jun-13
Percentage
Demand Deposit
6,009.11
41.77%
6,345.76
41.87%
Savings
2,022.20
14.06%
2,111.09
13.93%
Time 3,473.67 24.15% 3,686.87 24.33%
Domiciliary Account 2,726.98 18.96% 2,982.04 19.67%
Others 154.52 1.07% 30.78 0.20%
Total 14,386.48 100.00% 15,156.54 100.00%
Table 2.2 : Deposit Structure of Banks
CBN FINANCIAL STABILITY REPORT June 2013
16
Un-audited total profits of the banking
industry for the first half of 2013 stood at
N300.5 billion, a 22.95 per cent increase
over the N244.4 billion achieved in the
second half of 2012. Interest income,
which increased by 13.47 per cent,
largely accounted for the higher profit
level.
The industry liquidity ratio stood at 67.8
per cent compared with 68.0 per cent at
end-December 2012. All banks met the
30 per cent minimum regulatory liquidity
ratio throughout the review period.
During the review period, the CBN
executed an MoU with the Bank of
Tanzania, and was in discussions with the
Central Bank of Sudan and the Swiss
Financial Market Authority with the aim
of executing MoUs on supervision and
information sharing. Also, the CBN
continued its collaboration with
regulatory authorities in the sub-region
towards the harmonization of supervisory
standards in West Africa.
At end-June 2013, ten (10) banks had
complied with the requirement for
divestment from non-banking activities,
in line with the Regulation on the Scope
of Banking Activities and Ancillary
Matters. Six (6) of the compliant banks
were issued with commercial banking
licences, while four (4) were being
considered for the issuance of licences.
Three (3) other banks opted for a holding
company structure and were granted
approval to restructure their operations.
At end-June 2013, two (2) of the three (3)
banks had fully complied with the
provisions of the Regulation and were
granted holding company licences as
other financial institutions, while the third
2.2.1 Cross-border Collaboration
2.2.2 Implementation of the New
Banking Model
bank was granted an extension of the
deadline for compliance. However,
seven (7) other banks were yet to fully
comply.
To effectively regulate and supervise
non-interest financial institutions (NIFIs),
the CBN inaugurated a seven-member
Financial Regulation Advisory Council of
Experts (FRACE) during the review period,
c h a r g e d w i t h t h e f o l l o w i n g
responsibilities:
! Provision of expert opinion and
assistance on matters referred to it by
the CBN and other regulatory
agencies in the financial sector;
! Validation and endorsement of new
products and services being offered
by NIFIs to ensure compliance with
the provisions of Islamic commercial
jurisprudence;
! Resolution of differences of opinion
a m o n g d i f f e r e n t a d v i s o r y
committees of experts (ACEs) of NIFIs
and members of the same ACE;
! Provision of support to the CBN in
respect of questions or queries that
may be raised regarding the Shariah
compliance of financial products,
instruments and institutions; and
! Study of Islamic jurisprudence-related
problems facing the relevant
institutions and stakeholders of the
finance industry and providing expert
opinion on them.
Further to the issuance of the Guidelines
for the Operation of NIFI Instruments at
the CBN, implementation processes for
the approved liquidity management
products, namely, CBN Safe Custody
Account (CSCA), otherwise called
Wadiah Accounts, CBN Non-Interest
Notes (CNIN) and CBN Non-Interest
Assets-backed Security (CNI-ABS), were
developed.
2.2.3 Non-Interest (Islamic) Banking
CBN FINANCIAL STABILITY REPORT June 2013
17
2.3 Other Financial Institutions (OFIs)
2.3.1 Mortgage Refinancing
S ign i f icant deve lopments were
recorded in the Other Financial
Institutions (OFIs) sub-sector in the first
half of 2013. These were driven by efforts
to enhance OFIs' contribution to the
growth of the real sector as well as
mainstreaming informal sector operators
for greater financial inclusion.
During the review period, the CBN
granted an approval-in-principle for the
incorporation of the Nigeria Mortgage
Refinance Company(NMRC). The
Company would operate as a
specialized second-tier, mono-line
institution that would provide short-term
liquidity and/or medium- to long-term
funding or guarantees to mortgage
originators and housing finance lenders.
I t would also purchase el igible
mortgages and issue bonds to finance
purchases. In the first phase of its
operations, the Company would re-
finance mortgage loans of member
institutions, using shareholders' equity
and the World Bank's US$300 million IDA
line of credit at 0.75 per cent of 40 years
tenor. From the second phase, the
NMRC would be funding its operations
from a combination of the balance of
the IDA line of credit and by issuing
bonds in the capital market. The NMRC's
authorized capital of N6.0 billion has
been fully subscribed to by primary
mortgage banks, commercial banks, the
IFC, the Nigeria Sovereign Wealth
Investment Authority and the Ministry of
Finance Incorporated. Also, in readiness
for the establishment, licensing and
subsequent supervision of the Company
and others that might follow, the CBN, in
March 2013, approved the Regulatory
and Supervisory Framework for the
Operations of a Mortgage Re-finance
Company as an exposure draft, for
inputs and comments from other key
stakeholders.
The establishment of the NMRC and
ultimately the securitization process that
they would facilitate is expected to
address the funding mismatch in, and
c h a n n e l m o r e f u n d s t o , t h e
mortgage/housing finance sub-sector.
Access to f inance through the
microfinance banks (MFBs) improved
during the review period. Total assets of
the MFBs increased by 25.2 per cent to
N278.9 billion at end-June 2013, from
N222.8 billion at end-December 2012.
The paid-up share capital and
loans/advances also increased by 14.0
and 46.1 per cent to N69.2 billion and
N141.7 billion, respectively, at end-June
2013. Similarly, aggregate reserves
increased to N5.8 billion at end-June
2013, from a negative N7.4 billion at end-
December, 2012, reflecting a significant
turnaround in thei r operat ional
performance.
The M ic ro f inance Cer t i f icat ion
Programme (MCP), designed to bridge
the observed skill gap of operators of
microfinance banks, entered its third
year in 2013. In the period under review,
650 and 439 participants attended the
Levels 1 and 2 of the Programme,
respectively, with 238 completing the
Certification Programme by passing the
Level 2 Programme. As at June 30, 2013,
a total of 8,182 operators had
participated in the training sessions
designed to prepare them for the 2-level
examinations of the Chartered Institute
of Bankers of Nigeria (CIBN). Out of the
5,100 candidates that had sat for the
examinations, 1,657 successfully passed
at both levels, which qualified them for
induction as Certified Microfinance
2.3.2 Microfinance Banks (MFBs)
CBN FINANCIAL STABILITY REPORT June 2013
18
Bankers. During the review period, 531
non-executive directors of MFBs
attended the certification Module for
Directors bringing the total number of
participants in this module to 1,406.
The total assets of Primary Mortgage
Banks (PMBs) rose by 6.2 per cent to
N369.6 billion at end-June 2013, from
N348.1 billion at end-December 2012.
The paid-up capital also increased by
10.7 per cent to N69.6 billion at end-June
2013, from N62.9 bill ion at end-
December 2012. This reflected the
institutions' efforts to comply with the
new capital regime of N2.5 billion and N5
billion for state and national PMBs,
respectively, with a compliance
deadline of December 31, 2013.
Similarly, loans and advances increased
by 6.9 per cent to N129.3 billion at end-
June 2013, from N120.9 billion at end-
December 2012. However, reserves and
deposit liabilities decreased by 26.5 and
3.7 per cent, respectively, to N8.6 billion
and N164.8 billion at end-June 2013, from
N11.7 billion and N171.1 billion at end-
December 2012.
The total assets of the FCs increased by
4.9 per cent to N82.1 billion at end-June
2013, from N78.3 bill ion at end-
December 2012. Similarly, the paid-up
capital and loans/advances increased
by 2.9 and 16.4 per cent to N14.2 billion
and N27.7 billion, respectively, at end-
June 2013. Total borrowings also
increased by 3.2 per cent to N49.1 billion
at end-June 2013, from N47.6 billion at
end-December 2012.
The financial inclusion strategy targets a
2.3.3 Primary Mortgage Banks (PMBs)
52.3.4 Finance Companies (FCs)
2.4 Financial Inclusion
reduction of the current financial
exclusion rate of 46.3 per cent to 20 per
cent by 2020. Pursuant to the
implementation of the financial inclusion
strategy, the CBN launched a pilot
financial inclusion project in Borno State
in the review period. The project is
expected to leverage on the existing
bank branches, in addition to 26
Nigerian Postal Service outlets, for the
provision of improved financial services
in the State.
The strategy also includes the promotion
of financial literacy through the:
a) Establishment of a Financial Literacy
Steering Committee and a Financial
L i t e r a c y I m p l e m e n t a t i o n
Committee;
b) Setting up of a technical committee
for the conduct of a National
Baseline Survey for Financial Literacy;
and
c) Sensitization of students from
institutions of higher learning on the
child and youth finance initiative.
6The Bank also issued Guidelines on
agent banking in February 2013 to fast-
track the delivery of banking services
through the use of agent platforms, such
as POS, ATMs and mobile phones.
Movements in money market rates were
influenced by liquidity conditions in the
banking system during the review
period. Both the inter-bank call and
Open Buy-back (OBB) rates were
relatively stable around the MPR corridor
throughout the first half of 2013. The rates
peaked at monthly averages of 12.15
and 11.89 per cent in May 2013 for the
2.5 Financial Markets
2.5.1 The Money Market
5 End-December 2012 figures were revised.
CBN FINANCIAL STABILITY REPORT June 2013
19
6Guidelines for the Regulation of Agent Banking and Agent Banking Relationships in Nigeria

inter-bank call and the OBB segments,
respectively. The fiscal operations of
government, the conduct of open
market operations, as well as foreign
exchange auctions by the Bank were
the dominant factors that influenced the
banking system's net liquidity levels and
the movement in rates.
During the first half of 2013, weighted
average OBB and inter-bank call rates
declined by 1.56 and 1.86 percentage
points to 11.31 and 11.58 per cent, from
12.87 and 13.44 per cent, respectively, at
end-December 2012. The development
was attributed to the effectiveness of
interventions through open market
operations.
Rates at the foreign exchange market
2.5.2 The Foreign Exchange Market
JANUARY FEBRUARY MARCH APRIL MAY JUNE
Inter-bank 11.84 11.78 10.39 11.25 12.15 12.05
OBB 11.71 11.66 10.29 10.62 11.89 11.66
SDF 10.00 10.00 10.00 10.00 10.00 10.00
MBR 12.00 12.00 12.00 12.00 12.00 12.00
SLF 14.00 14.00 14.00 14.00 14.00 14.00
9.00
10.00
11.00
12.00
13.00
14.00
15.00
Intt
er-
ban
k, O
BB
, SD
F, M
PR
& S
LF R
ate
s (%
)
Figure 2.8 : Inter-bank Rate Movements
were relatively stable in the review
period. At the Wholesale Dutch Auction
System (WDAS) segment, the average
foreign exchange rate appreciated by
0.01 per cent to close at N157.3041/$,
while the average inter-bank and BDC
rates for the first half of 2013 depreciated
by 0.53 and 0.25 per cent, to close at
N 1 5 8 . 1 8 2 8 / $ a n d N 1 5 9 . 6 6 2 5 / $ ,
respectively. The stability in the WDAS
segment was attributable to CBN's
sustained supply. The depreciation at the
inter-bank and BDC segments of the
market was associated with increased
demand pressure in May and June,
following the announcement by the US
Federal Reserve Chairman on the
“tapering of the asset purchase
program”.
CBN FINANCIAL STABILITY REPORT June 2013
20
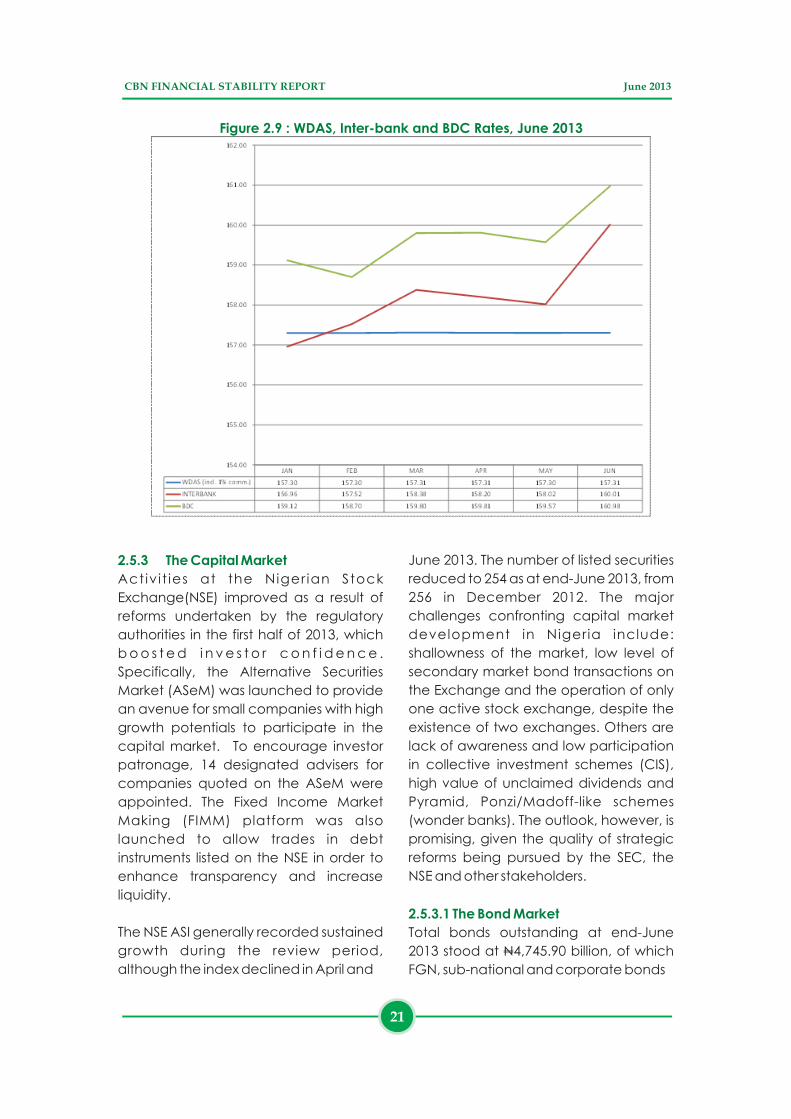
Figure 2.9 : WDAS, Inter-bank and BDC Rates, June 2013
2.5.3 The Capital Market
Activ it ies at the Niger ian Stock
Exchange(NSE) improved as a result of
reforms undertaken by the regulatory
authorities in the first half of 2013, which
b o o s t e d i n v e s t o r c o n f i d e n c e .
Specifically, the Alternative Securities
Market (ASeM) was launched to provide
an avenue for small companies with high
growth potentials to participate in the
capital market. To encourage investor
patronage, 14 designated advisers for
companies quoted on the ASeM were
appointed. The Fixed Income Market
Making (FIMM) platform was also
launched to allow trades in debt
instruments listed on the NSE in order to
enhance transparency and increase
liquidity.
The NSE ASI generally recorded sustained
growth during the review period,
although the index declined in April and
June 2013. The number of listed securities
reduced to 254 as at end-June 2013, from
256 in December 2012. The major
challenges confronting capital market
development in Nigeria include:
shallowness of the market, low level of
secondary market bond transactions on
the Exchange and the operation of only
one active stock exchange, despite the
existence of two exchanges. Others are
lack of awareness and low participation
in collective investment schemes (CIS),
high value of unclaimed dividends and
Pyramid, Ponzi/Madoff-like schemes
(wonder banks). The outlook, however, is
promising, given the quality of strategic
reforms being pursued by the SEC, the
NSE and other stakeholders.
Total bonds outstanding at end-June
2013 stood at N4,745.90 billion, of which
FGN, sub-national and corporate bonds
2.5.3.1 The Bond Market
CBN FINANCIAL STABILITY REPORT June 2013
21
constituted N4,032.90 billion (84.98%),
N498.00 billion (10.49%) and N215.00
billion (4.53%), respectively. Those levels
r e f l e c t e d o n l y m i n o r c h a n g e s
compared with the N4,650.11 billion
outstanding at end-December 2012,
made up of FGN, sub-national and
corporate bonds valued N4,080.05 billion
(87.74%), N368.00 billion (7.91%) and
N202.06 billion (4.35%), respectively. The
share of FGN bonds declined by 2.76
percentage points as bond issuances by
state governments and the private
sector increased.
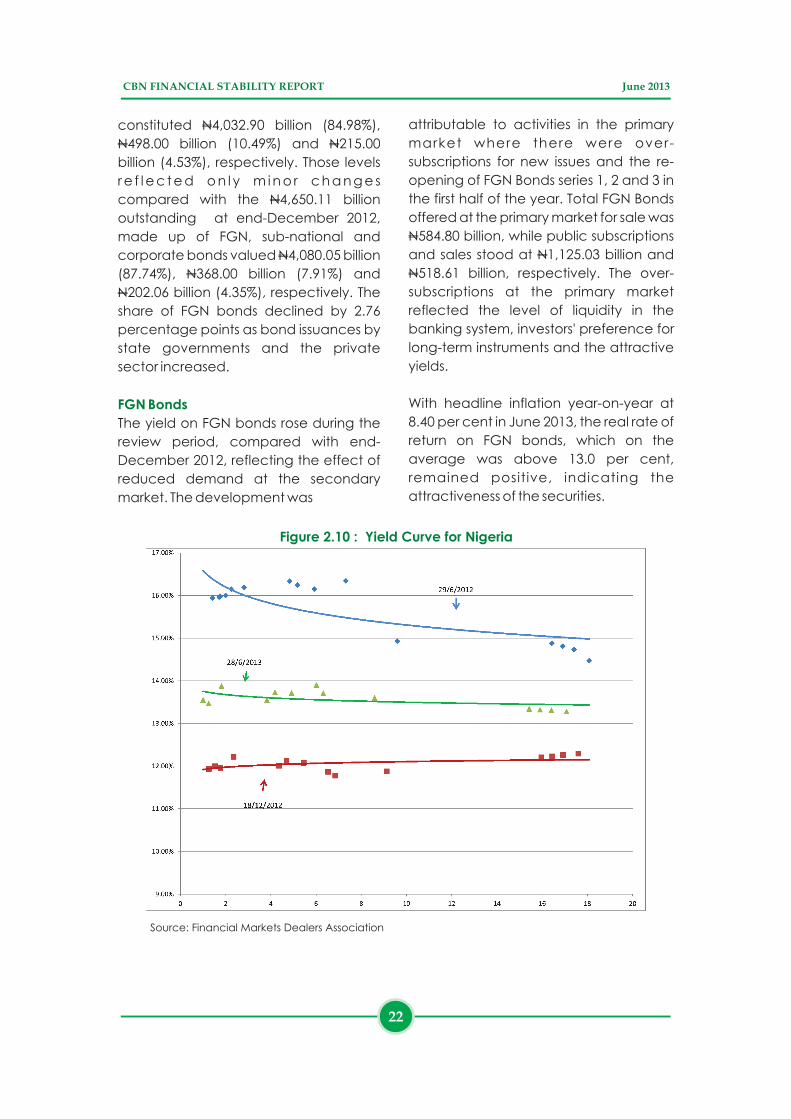
The yield on FGN bonds rose during the
review period, compared with end-
December 2012, reflecting the effect of
reduced demand at the secondary
market. The development was
FGN Bonds
attributable to activities in the primary
market where there were over-
subscriptions for new issues and the re-
opening of FGN Bonds series 1, 2 and 3 in
the first half of the year. Total FGN Bonds
offered at the primary market for sale was
N584.80 billion, while public subscriptions
and sales stood at N1,125.03 billion and
N518.61 billion, respectively. The over-
subscriptions at the primary market
reflected the level of liquidity in the
banking system, investors' preference for
long-term instruments and the attractive
yields.
With headline inflation year-on-year at
8.40 per cent in June 2013, the real rate of
return on FGN bonds, which on the
average was above 13.0 per cent,
remained positive, indicating the
attractiveness of the securities.
Figure 2.10 : Yield Curve for Nigeria
Source: Financial Markets Dealers Association
CBN FINANCIAL STABILITY REPORT June 2013
22

The yield curve was relatively flat, with a
spread of 0.003 per cent, reflecting
investors' expectations that the rates
would remain relatively stable in the
near to medium term.
In the first half of 2013, three state
Sub-national Bonds
governments issued bonds valued
N130.00 billion, as against none in the
second half of 2012. Thus, the total
outstanding bonds held by 15 state
governments stood at N498.00 billion at
end-June 2013, compared to N368.00
billion at end-December 2012.
Table 2.3 : Sub-national Bonds Issued, January – June 2013
State Government
Bond Features Value (N'
Billion) Date Listed
Lagos 14.50% Fixed Rate Bond Series 1 due
2019 80.00 1-Feb-13
Gombe
Fixed Rate Bond (Series 1) 2012/2019
Under the N30 Bill ion Debt Issuance
Programme
20.00
11-Feb-13
Osun
14.75% Fixed Rate Bond (Series1)
2012/2019 under the N60 Billion Debt
Issuance Programme
30.00
23-Apr-13
Total
130.00
Corporate Bonds
Two corporate bonds were issued during
the review period by C & I Leasing Plc.
and a supra-national body, the
International Finance Corporation (IFC),
with total value N12.94 billion, compared
to N31.10 billion issued in the second half
of 2012. Total outstanding corporate
bonds stood at N215.00 billion at end
June 2013, while the listed corporate
bonds increased to 23 by 21 companies.
Table 2.4 : Corporate Bonds Issued, January – June 2013
Company
Description
Value (N'
Billion)
Date Listed
International Finance
Corporation
10.2% Fixed Rate Se nior Unsecured
Notes Due 2018 12.00
26-Mar-13
C & I Leasing Plc. 18% Fixed Rate Bond 2012/2017 under
the N10 Billion Issuance Programme 0.94 15-Apr-13
Total 12.94
CBN FINANCIAL STABILITY REPORT June 2013
23
Institution
Amounts/Units Listed
Date Listed
New Listing
UBA Capital Plc.
4,000,000,000 ordinary shares of 50k each at
N1.16
January 11, 2013
Africa Prudential Registrars Plc.
1,000,000,000 ordinary shares of 50k each at
N1.59
Lagos State Government
N80 billion 14.50% Fixed Rate Bond Series 1
due 2019
February 1, 2013
Gombe State Government
N20 billion Fixed Rate Bond (Series 1)
2012/2019 Under the N30 Billion Debt
Issuance Programme
February 11, 2013
International Finance Corporation
N12 billion of N1,000 per unit of 10.2% Fixed
Rate Senior Unsecured Notes Due 2018
March 26, 2013
C & I Leasing
N940 million 18% Fixed Rate Bond 2012/2017
under the N10 billion Issuance Programme
April 15, 2013
Osun State Government
N30 billion 14.75% fixed Rate Bond (Series1)
2012/2019 under the N60,000,000,000 D ebt
Issuance Programme April 23, 2013
Institution Additional Shares Reason
Supplementary Listing Linkage Assurance Plc.
2,897,207,843
Special Placement
Wapic Insurance Plc.
2,911,954,418
Special Placement
Guinness Nigeria Plc.
30,962,669
Bonus Issue
Crusader Nigeria Plc.
3,064,686,154
Bond Conversion
Guinea Insurance Plc.
740,000,000
Special Placement
First City Monument Bank Plc.
329,197,001
Acquisition of Fin
Bank Plc.
Flour Mills of Nigeria Plc.
50,893,281
Merger with
Nigerian Bag
Manufacturing
Company Plc
Rak Unity Petroleum Plc.
43,051,159
Special Placement
Livestock Feeds Plc.
800,000,000
Special Placement
Custodian and Allied Insurance Plc.
781,017,387
Scheme of merger
between Custodian
and Allied Insurance
Plc. and Crusader
(Nigeria) Plc.
BOC Gases Plc.
23,124,706
Bonus issue of 2012
Okomu Oil Plc.
479,955,000
Bonus 1:1
CAP Plc.
140,000,000
Bonus 1: 4
U A C N Plc.
320,144,064
Bonus 1: 5
CBN FINANCIAL STABILITY REPORT June 2013
24
Table 2.5 : Listing and Delisting on the NSE in the First Half of 2013
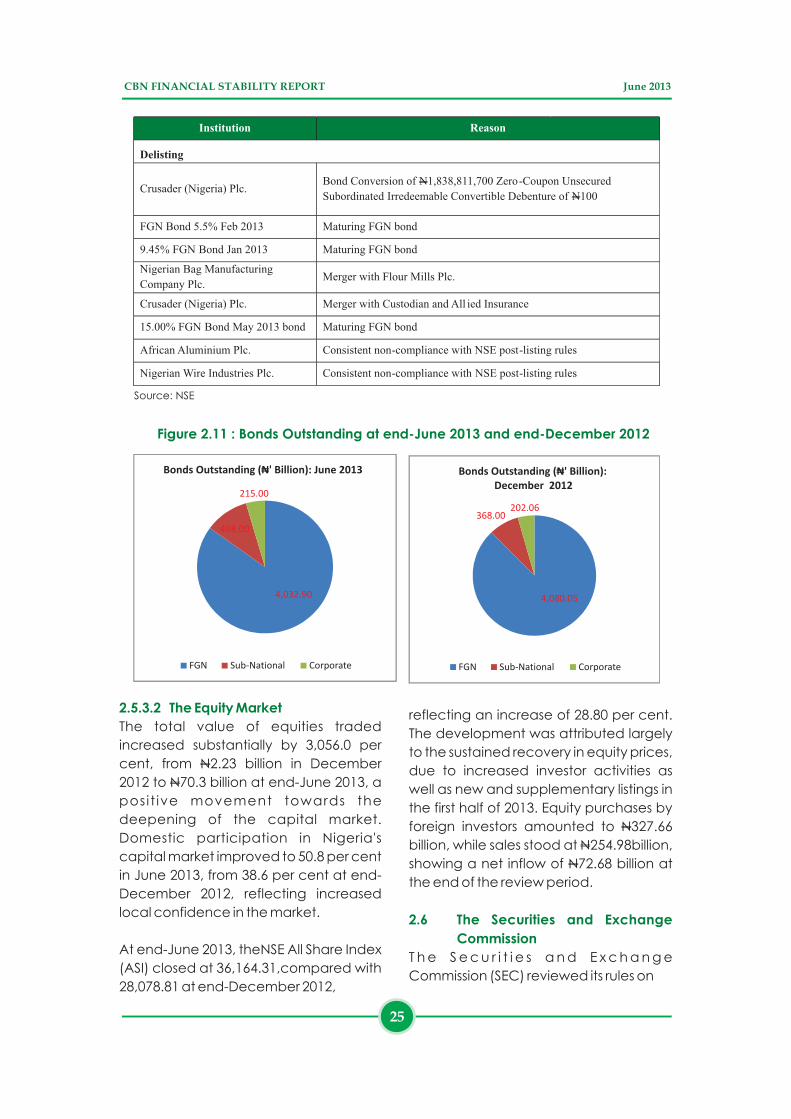
Institution Reason
Delisting
Crusader (Nigeria) Plc.
Bond Conversion of N1,838,811,700 Zero-Coupon Unsecured
Subordinated
Irredeemable Convertible Debenture of N100
FGN Bond 5.5% Feb 2013
Maturing FGN bond
9.45% FGN Bond Jan 2013
Maturing FGN bond
Nigerian Bag Manufacturing
Company Plc. Merger with Flour Mills Plc.
Crusader (Nigeria) Plc. Merger with Custodian and All ied Insurance
15.00% FGN Bond May 2013 bond Maturing FGN bond
African Aluminium Plc.
Consistent non-compliance with NSE post-listing rules
Nigerian Wire Industries Plc.
Consistent non-compliance with NSE post-listing rules
Figure 2.11 : Bonds Outstanding at end-June 2013 and end-December 2012
4,032.90
498.00
215.00
Bonds Outstanding (N' Billion): June 2013
FGN Sub-National Corporate
4,080.05
368.00 202.06
Bonds Outstanding (N' Billion): December 2012
FGN Sub-National Corporate
2.5.3.2 The Equity Market
The total value of equities traded
increased substantially by 3,056.0 per
cent, from N2.23 billion in December
2012 to N70.3 billion at end-June 2013, a
posit ive movement towards the
deepening of the capital market.
Domestic participation in Nigeria's
capital market improved to 50.8 per cent
in June 2013, from 38.6 per cent at end-
December 2012, reflecting increased
local confidence in the market.
At end-June 2013, theNSE All Share Index
(ASI) closed at 36,164.31,compared with
28,078.81 at end-December 2012,
reflecting an increase of 28.80 per cent.
The development was attributed largely
to the sustained recovery in equity prices,
due to increased investor activities as
well as new and supplementary listings in
the first half of 2013. Equity purchases by
foreign investors amounted to N327.66
billion, while sales stood at N254.98billion,
showing a net inflow of N72.68 billion at
the end of the review period.
T h e S e c u r i t i e s a n d E x c h a n g e
Commission (SEC) reviewed its rules on
2.6 The Securities and Exchange
Commission
CBN FINANCIAL STABILITY REPORT June 2013
25
Source: NSE
Real Estate Investment Trusts (REITs) to
provide for the use of a Deed of Trust
Structure for holding real estate
assets.The revised rules allow the trustees
of the REITs to hold an equitable interest
in the underlying property, with the legal
owner declaring himself as the trustee
holding the asset of the Trust at the
absolute disposal and for the benefit of
the beneficiaries. This is expected to
alleviate the constraints regarding the
transfer of legal titles and also protect
the interest of investors.
At end-June 2013, the regulatory
purview of the National Insurance
Commission of Nigeria (NAICOM)
covered 2,250 agents, 579 brokers, 57
insurance companies, 2 reinsurance
companies, and 66 loss adjusters. The
Commission initiated measures that
improved the insurance sector,
especially in its micro-insurance and
Takaful operations. These included the
release of Takaful insurance guidelines,
with a provision for a stand-alone Takaful
company and its collaboration with GIZ
(German International Development
Agency) and some other partners to
conduct a diagnostic study on micro-
insurance in Nigeria. The Commission
also worked in collaboration with
ECOWAS and WAMI to deepen
insurance integration in West Africa.
Meanwhile, it became a full member of
the standard-setting organisation –the
Islamic Financial Services Board (IFSB).
Most significantly, during the review
period, the Commission commenced
the enforcement of sanctions against
insurance operators who violated the
2.7 The Insurance Sector
“no premium no cover” directive and
settled twenty-seven (27) cases with
claims totalling N347.0 million.
Furthermore, the Commission published
a notice to the effect that the registration
of new insurance brokers would thence
forth be carried out in two batches
annually. Consequently, the first batch of
operating licences would be issued to
successful applicants on June 30th of
each year, while the second batch
would be issued on December 31st of the
same year.
During the review period, NIRSAL, which
was initiated to de-risk agricultural
lending and unlock financial resources
for the agricultural value chain
development in Nigeria, accomplished
the following:
! Collaborated with GIZ to secure a
N176.0 million grant for four value chain
crops (tomato, rice, cocoa and cotton)
in twelve (12) states;
! Signed a tripartite Memorandum of
Understanding (MoU) with USAID and the
Federal Ministry of Agriculture and Rural
Development on technical partnership
to facilitate access to a US$100 million
USAID fund; and
! Issued Credit Risk Guarantees (CRGs)
valued at N6.741 billion in favour of
twenty three counter parties (Table 2.6).
2.8 R e a l S e c t o r I n t e r v e n t i o n
Programmes
2.8.1 The Nigeria Incentive-based Risk
Sharing System for Agricultural
Lending (NIRSAL)
CBN FINANCIAL STABILITY REPORT June 2013
26
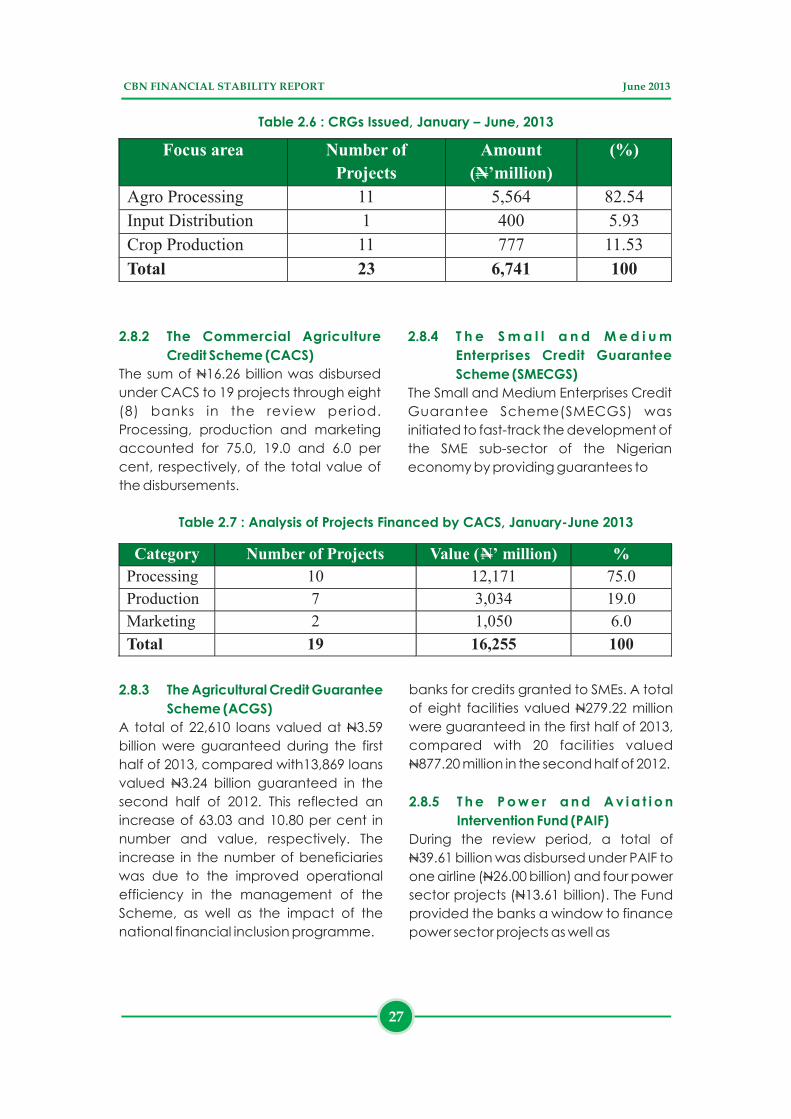
Focus area Number of
Projects
Amount
(N’million)
(%)
Agro Processing 11 5,564 82.54
Input Distribution 1 400 5.93
Crop Production 11 777 11.53
Total 23 6,741 100
Table 2.6 : CRGs Issued, January – June, 2013
2.8.2 The Commercial Agriculture
Credit Scheme (CACS)
The sum of N16.26 billion was disbursed
under CACS to 19 projects through eight
(8) banks in the review period.
Processing, production and marketing
accounted for 75.0, 19.0 and 6.0 per
cent, respectively, of the total value of
the disbursements.
2.8.3 The Agricultural Credit Guarantee
Scheme (ACGS)
A total of 22,610 loans valued at N3.59
billion were guaranteed during the first
half of 2013, compared with13,869 loans
valued N3.24 billion guaranteed in the
second half of 2012. This reflected an
increase of 63.03 and 10.80 per cent in
number and value, respectively. The
increase in the number of beneficiaries
was due to the improved operational
efficiency in the management of the
Scheme, as well as the impact of the
national financial inclusion programme.
Table 2.7 : Analysis of Projects Financed by CACS, January-June 2013
Category Number of Projects Value (N’ million) %
Processing 10 12,171 75.0
Production 7 3,034 19.0
Marketing 2 1,050 6.0
Total 19 16,255 100
2.8.4 T h e S m a l l a n d M e d i u m
Enterprises Credit Guarantee
Scheme (SMECGS)
The Small and Medium Enterprises Credit
Guarantee Scheme(SMECGS) was
initiated to fast-track the development of
the SME sub-sector of the Nigerian
economy by providing guarantees to
banks for credits granted to SMEs. A total
of eight facilities valued N279.22 million
were guaranteed in the first half of 2013,
compared with 20 facilities valued
N877.20 million in the second half of 2012.
During the review period, a total of
N39.61 billion was disbursed under PAIF to
one airline (N26.00 billion) and four power
sector projects (N13.61 billion). The Fund
provided the banks a window to finance
power sector projects as well as
2.8.5 T h e P o w e r a n d A v i a t i o n
Intervention Fund (PAIF)
CBN FINANCIAL STABILITY REPORT June 2013
27
restructure and refinance outstanding
facilities in the aviation sector on a long-
term basis of 10 to 15 years at a
concessionary interest rate of 7.0 per
cent. The PAIF helped in relieving the
banks of the burden of NPLs on their
balance sheets and improved the credit
rating of the beneficiary institutions,
thereby providing them access to
additional funds for their operations.
During the review period, three new
centres, Maiduguri, Makurdi and
Calabar, commenced operations,
bringing the number of EDCs to six. At
end-June 2013, a total of 43,209
participants had been trained by the
EDCs, comprising 12,694 in Kano,18,167
in Lagos,10,967 in Onitsha, 571 in
Makurdi, 673 in Maiduguri and 137 in
Calabar. Out of the total trained, 1,743
accessed loans from banks to start and
expand their businesses. In total, 11,421
jobs and 4,856 businesses had been
created under the EDC programme
since 2007. The low rate of job creation
was attributed to the reluctance of
financial institutions to finance start-ups,
which they considered to be of high risk.
Meanwhile, the CBN has taken several
measures, such as the introduction of
the financial inclusion programme, the
establishment of a national collateral
registry and the involvement of state
governments in the Scheme, to address
the challenge.
The overall position of the external sector
remained robust, in spite of the mixed
outcomes, during the first half of 2013. It
recorded an estimated overall balance
of payments surplus of N177.13 billion,
compared with N437.37 billion in the
corresponding half of 2012. The
2.8.6 Entrepreneurship Development
Centres (EDCs)
2.9 The External Sector
development was attributed to the
robust current account and increased
inflow of foreign capital during the review
period. The current account recorded an
estimated surplus of N1,604.19 billion
reflecting, largely, high crude oil prices at
the international market, lower import
bills, and repatriation of investment
income, as well as significant inflow of
remittances. The price of Nigeria's
reference crude oil (the Bonny Light, 37o
API) averaged US$110.29, while the
import bill fell by 16.6 per cent.
The estimated capital and financial
account recorded a net liability of
N574.98 billion in the first half of 2013,
compared with a net asset of N228.26
billion recorded in the first half of 2012.
Gross external reserves rose to US$44.96
billion at end-June 2013, from US$43.83
b i l l i on at end-December 2012 ,
representing an increase of 2.58 per cent.
The marginal accretion to reserves, when
compared with the level in the second
half of 2012, was due to reductions in
receipts from oil and gas, oil-related
taxes, value added tax (VAT), education
tax and interest on reserve management
operations. A breakdown of the external
reserves indicated that 85.08 per cent
was held in US Dollars, 5.62 per cent in
Euro, 1.93 per cent in Renminbi, 1.69 per
cent in Pound Sterling, 5.60 per cent in
SDR and 0.08 per cent in other currencies
at end-June 2013.
The country's external reserves could
finance 11.32 months of imports at end-
June 2013. This was higher than the 10.05
months of imports cover at end-
December 2012 and the international
benchmark of 3 months.
Total foreign exchange inflow during the
first half of 2013 was US$19.75 billion,
CBN FINANCIAL STABILITY REPORT June 2013
28
compared with US$24.61 bi l l ion
recorded in the second half of 2012,
reflecting a decrease of US$ 4.86 billion
or 19.74 per cent. Total outflow in the
review period was US$18.81 billion, and
was higher than the US$15.90 billion
recorded in the second half of 2012 by
CBN FINANCIAL STABILITY REPORT June 2013
29
US$2.91 billion or 18.30 per cent.The net
inflow in the review period was US$1.13
billion, including unrealised exchange
rate gain of US$0.193 billion compared
with US$8.41 billion in the second half of
2012, which included unrealised
exchange rate loss of US$0.30 billion.

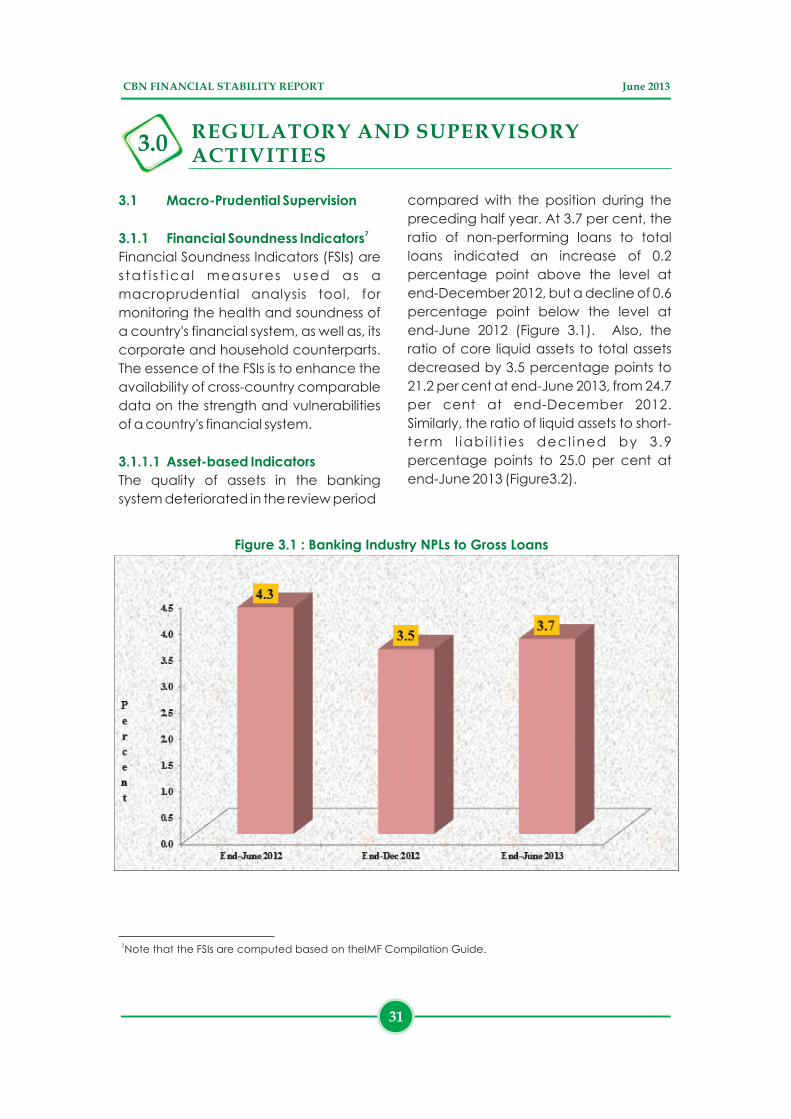
3.0REGULATORY AND SUPERVISORY ACTIVITIES
3.1 Macro-Prudential Supervision
73.1.1 Financial Soundness Indicators
3.1.1.1 Asset-based Indicators
Financial Soundness Indicators (FSIs) are
s tat i s t ica l measures used as a
macroprudential analysis tool, for
monitoring the health and soundness of
a country's financial system, as well as, its
corporate and household counterparts.
The essence of the FSIs is to enhance the
availability of cross-country comparable
data on the strength and vulnerabilities
of a country's financial system.
The quality of assets in the banking
system deteriorated in the review period
compared with the position during the
preceding half year. At 3.7 per cent, the
ratio of non-performing loans to total
loans indicated an increase of 0.2
percentage point above the level at
end-December 2012, but a decline of 0.6
percentage point below the level at
end-June 2012 (Figure 3.1). Also, the
ratio of core liquid assets to total assets
decreased by 3.5 percentage points to
21.2 per cent at end-June 2013, from 24.7
per cent at end-December 2012.
Similarly, the ratio of liquid assets to short-
term l iabi l i t ies decl ined by 3.9
percentage points to 25.0 per cent at
end-June 2013 (Figure3.2).
7 Note that the FSIs are computed based on theIMF Compilation Guide.
Figure 3.1 : Banking Industry NPLs to Gross Loans
CBN FINANCIAL STABILITY REPORT June 2013
31
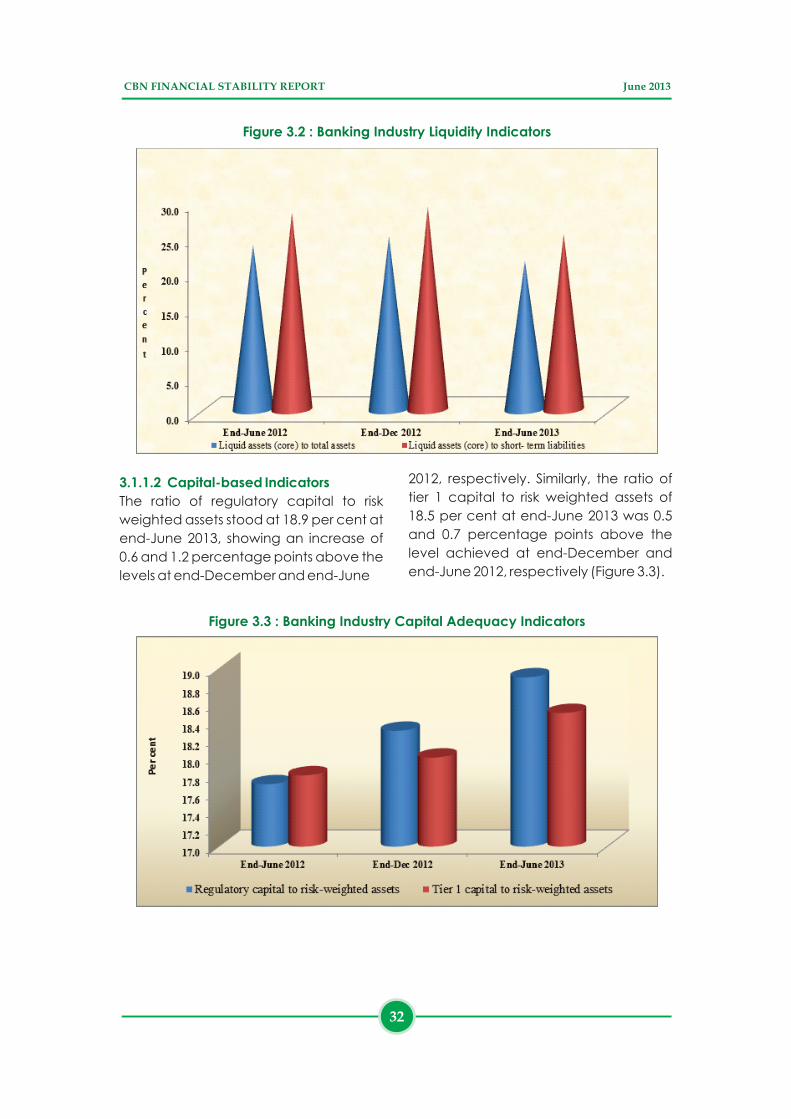
3.1.1.2 Capital-based Indicators
The ratio of regulatory capital to risk
weighted assets stood at 18.9 per cent at
end-June 2013, showing an increase of
0.6 and 1.2 percentage points above the
levels at end-December and end-June
Figure 3.2 : Banking Industry Liquidity Indicators
2012, respectively. Similarly, the ratio of
tier 1 capital to risk weighted assets of
18.5 per cent at end-June 2013 was 0.5
and 0.7 percentage points above the
level achieved at end-December and
end-June 2012, respectively (Figure 3.3).
Figure 3.3 : Banking Industry Capital Adequacy Indicators
CBN FINANCIAL STABILITY REPORT June 2013
32
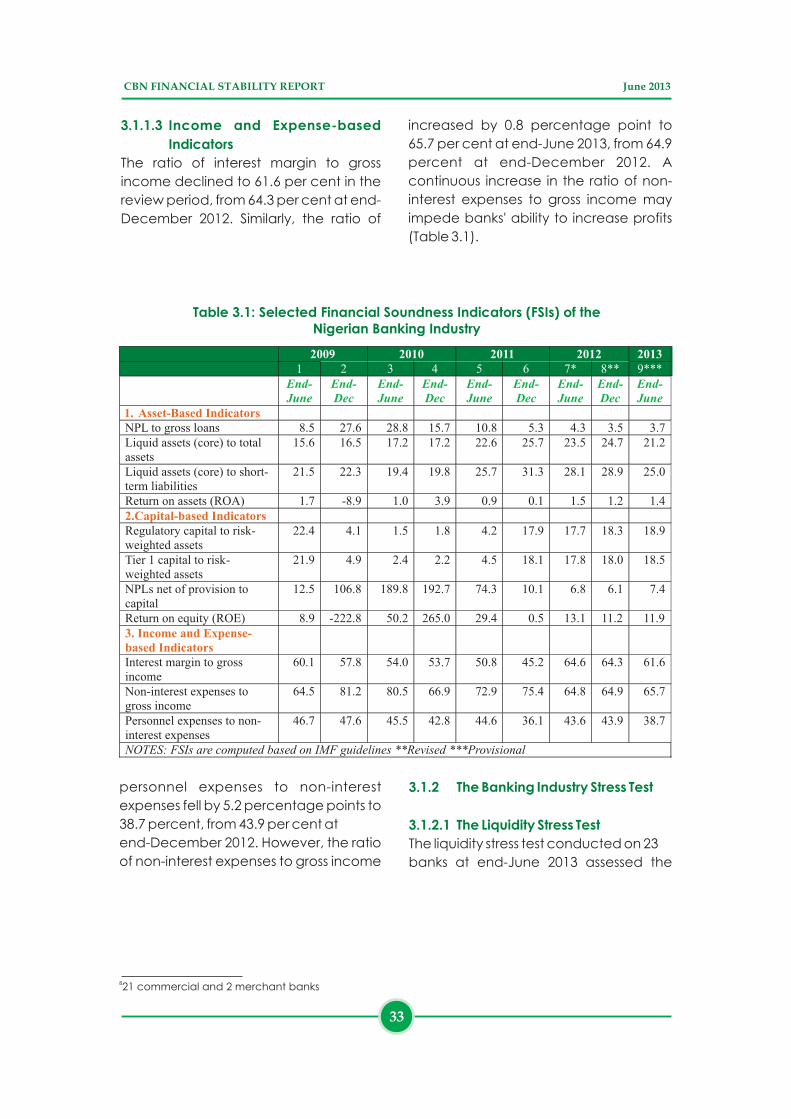
3.1.1.3 Income and Expense-based
Indicators
The ratio of interest margin to gross
income declined to 61.6 per cent in the
review period, from 64.3 per cent at end-
December 2012. Similarly, the ratio of
personnel expenses to non-interest
expenses fell by 5.2 percentage points to
38.7 percent, from 43.9 per cent at
end-December 2012. However, the ratio
of non-interest expenses to gross income
2009 2010 2011 2012 20131 2 3 4 5 6 7* 8** 9***
End-June
End-Dec
End-June
End-Dec
End-June
End-Dec
End-June
End-Dec
End-June
1. Asset-Based Indicators
NPL to gross loans
8.5
27.6
28.8
15.7
10.8
5.3
4.3
3.5 3.7Liquid assets (core) to total assets
15.6
16.5
17.2
17.2
22.6
25.7
23.5
24.7 21.2
Liquid assets (core) to short-
term liabilities
21.5
22.3
19.4
19.8
25.7
31.3
28.1
28.9 25.0
Return on assets (ROA)
1.7
-8.9
1.0
3.9
0.9
0.1
1.5
1.2 1.42.Capital-based Indicators
Regulatory capital to risk-weighted assets
22.4
4.1
1.5
1.8
4.2
17.9
17.7
18.3 18.9
Tier 1 capital to risk-weighted assets
21.9
4.9
2.4
2.2
4.5
18.1
17.8
18.0 18.5
NPLs net of provision to capital
12.5 106.8 189.8 192.7 74.3 10.1 6.8 6.1 7.4
Return on equity (ROE)
8.9
-222.8
50.2
265.0
29.4 0.5
13.1
11.2 11.9
3. Income and Expense-based Indicators
Interest margin to gross income
60.1
57.8
54.0
53.7
50.8
45.2
64.6
64.3 61.6
Non-interest expenses to gross income
64.5
81.2
80.5
66.9
72.9
75.4
64.8
64.9 65.7
Personnel expenses to non-interest expenses
46.7 47.6 45.5 42.8 44.6 36.1 43.6 43.9 38.7
NOTES: FSIs are computed based on IMF guidelines **Revised ***Provisional
Table 3.1: Selected Financial Soundness Indicators (FSIs) of the Nigerian Banking Industry
increased by 0.8 percentage point to
65.7 per cent at end-June 2013, from 64.9
percent at end-December 2012. A
continuous increase in the ratio of non-
interest expenses to gross income may
impede banks' ability to increase profits
(Table 3.1).
3.1.2 The Banking Industry Stress Test
3.1.2.1 The Liquidity Stress Test
The liquidity stress test conducted on 23
banks at end-June 2013 assessed the
821 commercial and 2 merchant banks
CBN FINANCIAL STABILITY REPORT June 2013
33
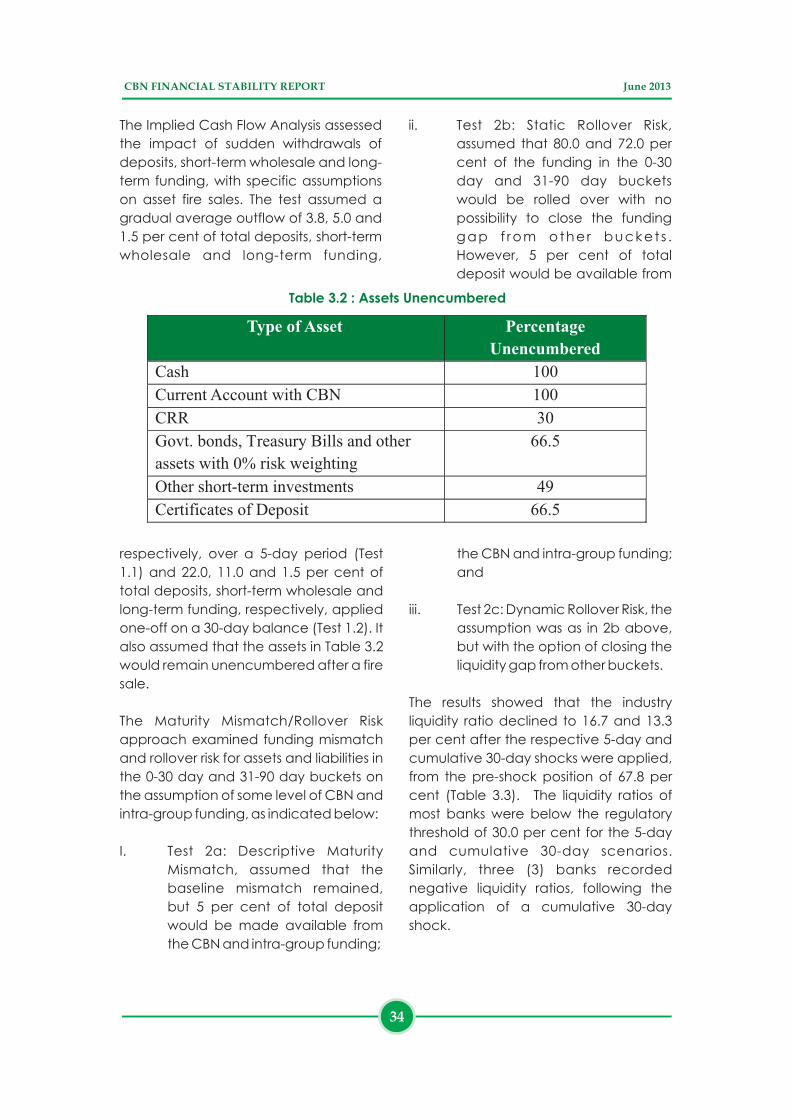
The Implied Cash Flow Analysis assessed
the impact of sudden withdrawals of
deposits, short-term wholesale and long-
term funding, with specific assumptions
on asset fire sales. The test assumed a
gradual average outflow of 3.8, 5.0 and
1.5 per cent of total deposits, short-term
wholesale and long-term funding,
respectively, over a 5-day period (Test
1.1) and 22.0, 11.0 and 1.5 per cent of
total deposits, short-term wholesale and
long-term funding, respectively, applied
one-off on a 30-day balance (Test 1.2). It
also assumed that the assets in Table 3.2
would remain unencumbered after a fire
sale.
The Maturity Mismatch/Rollover Risk
approach examined funding mismatch
and rollover risk for assets and liabilities in
the 0-30 day and 31-90 day buckets on
the assumption of some level of CBN and
intra-group funding, as indicated below:
I. Test 2a: Descriptive Maturity
Mismatch, assumed that the
baseline mismatch remained,
but 5 per cent of total deposit
would be made available from
the CBN and intra-group funding;
Table 3.2 : Assets Unencumbered
Type of Asset Percentage
Unencumbered
Cash 100
Current Account with CBN 100 CRR 30 Govt. bonds, Treasury Bills and other
assets with 0% risk weighting
66.5
Other short-term investments
49
Certificates of Deposit 66.5
ii. Test 2b: Static Rollover Risk,
assumed that 80.0 and 72.0 per
cent of the funding in the 0-30
day and 31-90 day buckets
would be rolled over with no
possibility to close the funding
gap f rom other bucket s .
However, 5 per cent of total
deposit would be available from
the CBN and intra-group funding;
and
iii. Test 2c: Dynamic Rollover Risk, the
assumption was as in 2b above,
but with the option of closing the
liquidity gap from other buckets.
The results showed that the industry
liquidity ratio declined to 16.7 and 13.3
per cent after the respective 5-day and
cumulative 30-day shocks were applied,
from the pre-shock position of 67.8 per
cent (Table 3.3). The liquidity ratios of
most banks were below the regulatory
threshold of 30.0 per cent for the 5-day
and cumulative 30-day scenarios.
Similarly, three (3) banks recorded
negative liquidity ratios, following the
application of a cumulative 30-day
shock.
CBN FINANCIAL STABILITY REPORT June 2013
34

Table 3.3 : Implied Cash Flow Analysis
Total Number of
Banks tested
Number of Banks with < 30% liquidity ratio
June 2013
23
June 2013
(23 Banks)
Mar 2013
(20 Banks)
Dec 2012
(20 Banks)
Sept 2012
(20 Banks)
System LR
Liquidity Shortfall
to make 30% LR
(N’billion)
Test 1.1: Impl ied
Cash Flow Test
(5 Days)
Day 1 9 4 5 14 36.7% Nil
Day 2 11 9 10 14 32.3% Nil
Day 3 12
11
12
14
27.6%
567.33
Day 4 14
14
15
15
22.5%
1,011.44
Day 5 16
15
15
16
16.7%
1,436.42
Test 1.2:
Implied
Cash Flow Test
(30 Days)
18
17
17
19
13.3%
1,688.22
Figure 3.4 : Rollover Risk, Pre- and Post-shock
CBN FINANCIAL STABILITY REPORT June 2013
35
However, under the three scenarios used
for the maturity mismatch test, the
rollover risk in the 30-day bucket showed
that the banks were adequately
funded(Figure 3.4). The overall banking
industry was resilient to liquidity shocks,
though a few banks were found to be
vulnerable.
Less than30 days
(N'billion)
31-90 days(N'billion)
90 -180days
(N'billion)
180360days
(N'billion)
1-3 years(N'billion)
above 3years
(N'billion)
Pre-shock 7,003 -218.8 -1130.09 -788.93 -2,018 -3,263
Test 2a 8,593.98 1,372.39 461.10 803.26 -426.76 -1,671.79
Test 2b 6,191.13 -723.01 -1271.96 -963.74 -2,222.68 -3,262.98
Test 2c 33.87 -64.24 -70.53 -141.44 -512.17 -1,594.47
-4,000
-2,000
0
2,000
4,000
6,000
8,000
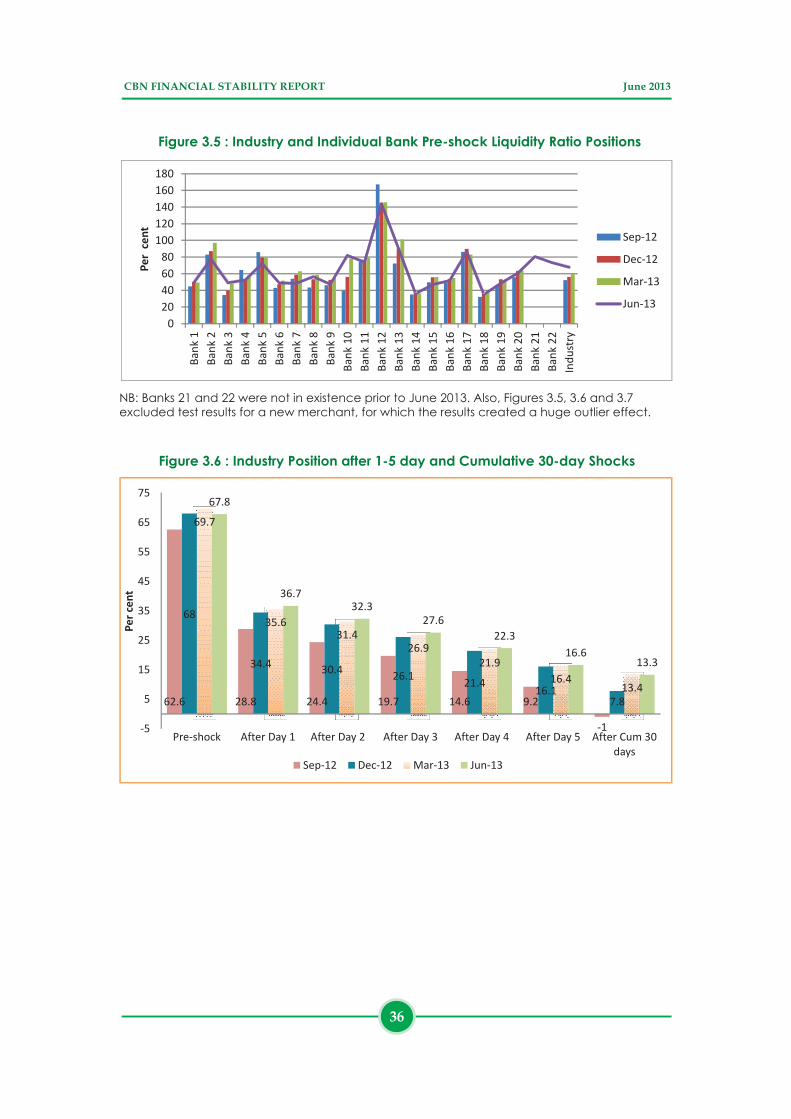
Figure 3.6 : Industry Position after 1-5 day and Cumulative 30-day Shocks
62.6 28.8 24.4 19.7 14.6 9.2
-1
68
34.4 30.4 26.1 21.4 16.1 7.8
69.7
35.6 31.4
26.9 21.9
16.4 13.4
67.8
36.7
32.3
27.6
22.3
16.6 13.3
-5
5
15
25
35
45
55
65
75
Pre-shock After Day 1 After Day 2 After Day 3 After Day 4 After Day 5 After Cum 30days
Pe
r ce
nt
Sep-12 Dec-12 Mar-13 Jun-13
CBN FINANCIAL STABILITY REPORT June 2013
36
0
20
40
60
80
100
120
140
160
180
Ban
k 1
Ban
k 2
Ban
k 3
Ban
k 4
Ban
k 5
Ban
k 6
Ban
k 7
Ban
k 8
Ban
k 9
Ban
k 1
0
Ban
k 1
1
Ban
k 1
2
Ban
k 1
3
Ban
k 1
4
Ban
k 1
5
Ban
k 1
6
Ban
k 1
7
Ban
k 1
8
Ban
k 1
9
Ban
k 2
0
Ban
k 2
1
Ban
k 2
2
Ind
ust
ry
Pe
r c
en
t
Sep-12
Dec-12
Mar-13
Jun-13
Figure 3.5 : Industry and Individual Bank Pre-shock Liquidity Ratio Positions
NB: Banks 21 and 22 were not in existence prior to June 2013. Also, Figures 3.5, 3.6 and 3.7 excluded test results for a new merchant, for which the results created a huge outlier effect.

Figure 3.7 : Individual Bank Positions after 5-day and Cumulative 30-day Shocks
-25
-5
15
35
55
75
95
115
135
155
Ban
k 1
Ban
k 2
Ban
k 3
Ban
k 4
Ban
k 5
Ban
k 6
Ban
k 7
Ban
k 8
Ban
k 9
Ban
k 1
0
Ban
k 1
1
Ban
k 1
2
Ban
k 1
3
Ban
k 1
4
Ban
k 1
5
Ban
k 1
6
Ban
k 1
7
Ban
k 1
8
Ban
k 1
9
Ban
k 2
0
Ban
k 2
1
Ban
k 2
2
LR %
Day 30 Day 5 Pre-shock
CBN FINANCIAL STABILITY REPORT June 2013
37
3.1.2.2 The Solvency Stress Test
The Baseline Position
The banking industry solvency stress test
assessed the resilience of the industry
based on historical worst case and
hypothetical strained macroeconomic
situations.
The pre-shock CAR for the banking
industry as a whole and for large, 9medium and small banks stood at 18.69,
18.86,18.25 and 18.33 per cent,
respectively. These reflected increases of
0.33, 0.80, 1.32 and 1.40 percentage
points over end-December 2012
positions. Similarly, the pre-shock liquidity
ratios for the banking industry, large,
medium and small banks rose by 14.14,
19.47, 3.15 and 3.07 percentage points to
69.70, 70.22, 75.45 and 68.47 per cent,
respectively, compared with the end-
December 2012 position (Table 3.4).
9Large banks (assets≥N1.00 trillion); Medium (assets≥N500 billion<N1.00 trillion); and Small (assets<N500 billion)
Table 3.4 : Baseline CAR and LR
Ratio Banking
Industry
Large
Banks
Medium
Banks
Small
Banks
June-2013 CAR 18.69 18.86 18.25 18.33
Dec-2012 CAR 18.36 18.06 20.32 16.93
June-2013 Liquidity Ratio (LR) 69.7 70.22 75.45 68.47
Dec-2012 Liquidity Ratio (LR) 55.56 50.75 62.30 72.38

16
5
1 1
Banks with CAR above15%
Banks with CAR above10% but < 15%
Banks with CAR below10% but> 5%
Banks with CAR below5% but> 0%
Banks with CAR above 15% Banks with CAR above 10% but < 15%
Banks with CAR below 10% but> 5% Banks with CAR below 5% but> 0%
Figure 3.8 : Banks in Each Bucket of CAR
Figure 3.9 : Banks in Each Bucket of LR
18
5
>40% <40% but >30% <30% but >20% <20%
>40% <40% but >30% <30% but >20% <20%
CBN FINANCIAL STABILITY REPORT June 2013
38
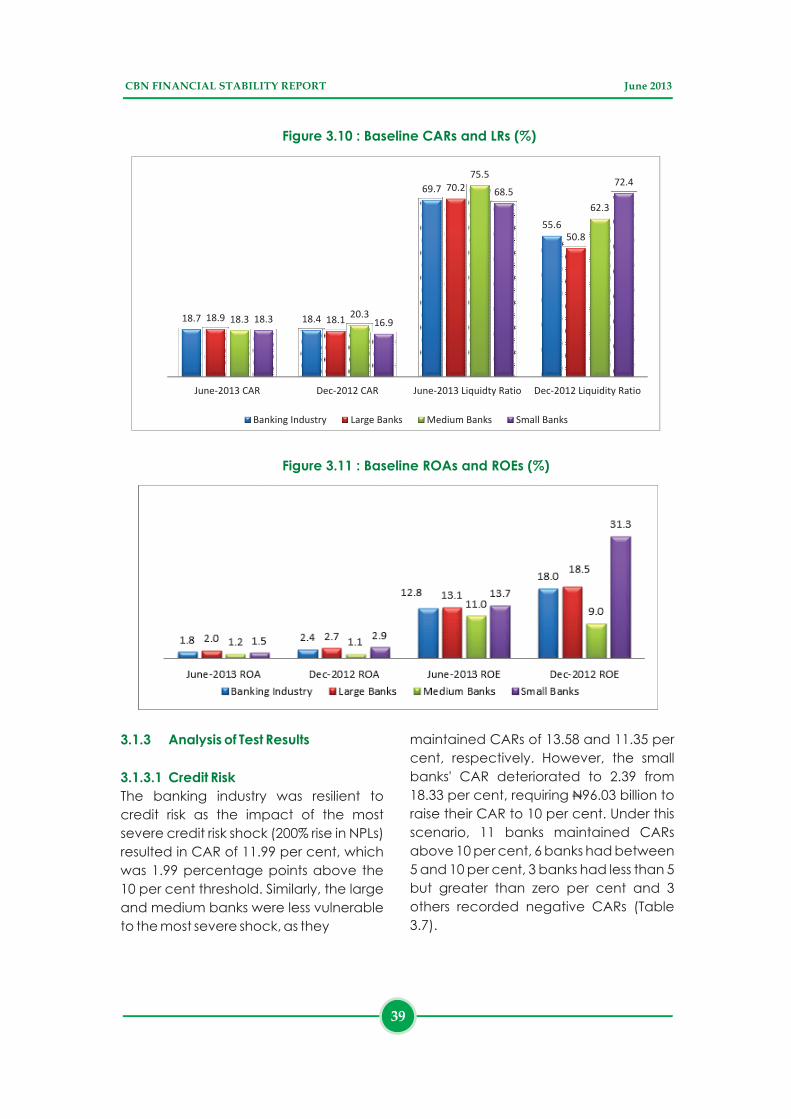
Figure 3.10 : Baseline CARs and LRs (%)
18.7
18.4
69.7
55.6
18.9
18.1
70.2
50.8
18.3
20.3
75.5
62.3
18.3
16.9
68.5
72.4
June-2013 CAR Dec-2012 CAR June-2013 Liquidty Ratio Dec-2012 Liquidity Ratio
Banking Industry Large Banks Medium Banks Small Banks
Figure 3.11 : Baseline ROAs and ROEs (%)
3.1.3 Analysis of Test Results
3.1.3.1 Credit Risk
The banking industry was resilient to
credit risk as the impact of the most
severe credit risk shock (200% rise in NPLs)
resulted in CAR of 11.99 per cent, which
was 1.99 percentage points above the
10 per cent threshold. Similarly, the large
and medium banks were less vulnerable
to the most severe shock, as they
maintained CARs of 13.58 and 11.35 per
cent, respectively. However, the small
banks' CAR deteriorated to 2.39 from
18.33 per cent, requiring N96.03 billion to
raise their CAR to 10 per cent. Under this
scenario, 11 banks maintained CARs
above 10 per cent, 6 banks had between
5 and 10 per cent, 3 banks had less than 5
but greater than zero per cent and 3
others recorded negative CARs (Table
3.7).
CBN FINANCIAL STABILITY REPORT June 2013
39
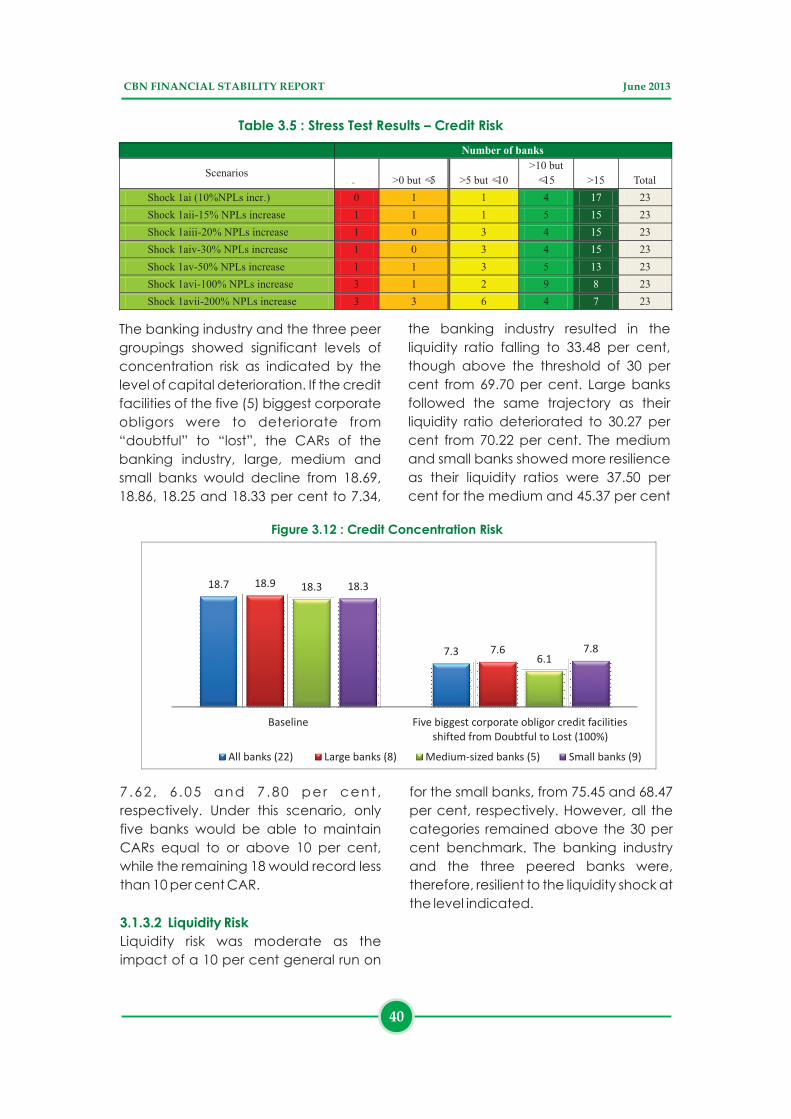
Table 3.5 : Stress Test Results – Credit Risk
Number of banks
Scenarios
≤ 0%
>0 but ≤5
>5 but ≤10 >10 but
≤15
>15
Total
Shock 1ai (10%NPLs incr.)
0
1
1
4
17
23
Shock 1aii-15% NPLs increase 1 1 1 5 15 23
Shock 1aiii-20% NPLs increase 1 0 3 4 15 23
Shock 1aiv-30% NPLs increase 1 0 3 4 15 23
Shock 1av-50% NPLs increase
1
1
3
5
13
23
Shock 1avi-100% NPLs increase
3
1
2
9
8
23
Shock 1avii-200% NPLs increase
3
3
6
4 7
23
The banking industry and the three peer
groupings showed significant levels of
concentration risk as indicated by the
level of capital deterioration. If the credit
facilities of the five (5) biggest corporate
obligors were to deteriorate from
“doubtful” to “lost”, the CARs of the
banking industry, large, medium and
small banks would decline from 18.69,
18.86, 18.25 and 18.33 per cent to 7.34,
7 .62 , 6 .05 and 7 .80 per cent ,
respectively. Under this scenario, only
five banks would be able to maintain
CARs equal to or above 10 per cent,
while the remaining 18 would record less
than 10 per cent CAR.
Liquidity risk was moderate as the
impact of a 10 per cent general run on
3.1.3.2 Liquidity Risk
Figure 3.12 : Credit Concentration Risk
18.7
7.3
18.9
7.6
18.3
6.1
18.3
7.8
Baseline Five biggest corporate obligor credit facilitiesshifted from Doubtful to Lost (100%)
All banks (22) Large banks (8) Medium-sized banks (5) Small banks (9)
the banking industry resulted in the
liquidity ratio falling to 33.48 per cent,
though above the threshold of 30 per
cent from 69.70 per cent. Large banks
followed the same trajectory as their
liquidity ratio deteriorated to 30.27 per
cent from 70.22 per cent. The medium
and small banks showed more resilience
as their liquidity ratios were 37.50 per
cent for the medium and 45.37 per cent
for the small banks, from 75.45 and 68.47
per cent, respectively. However, all the
categories remained above the 30 per
cent benchmark. The banking industry
and the three peered banks were,
therefore, resilient to the liquidity shock at
the level indicated.
CBN FINANCIAL STABILITY REPORT June 2013
40
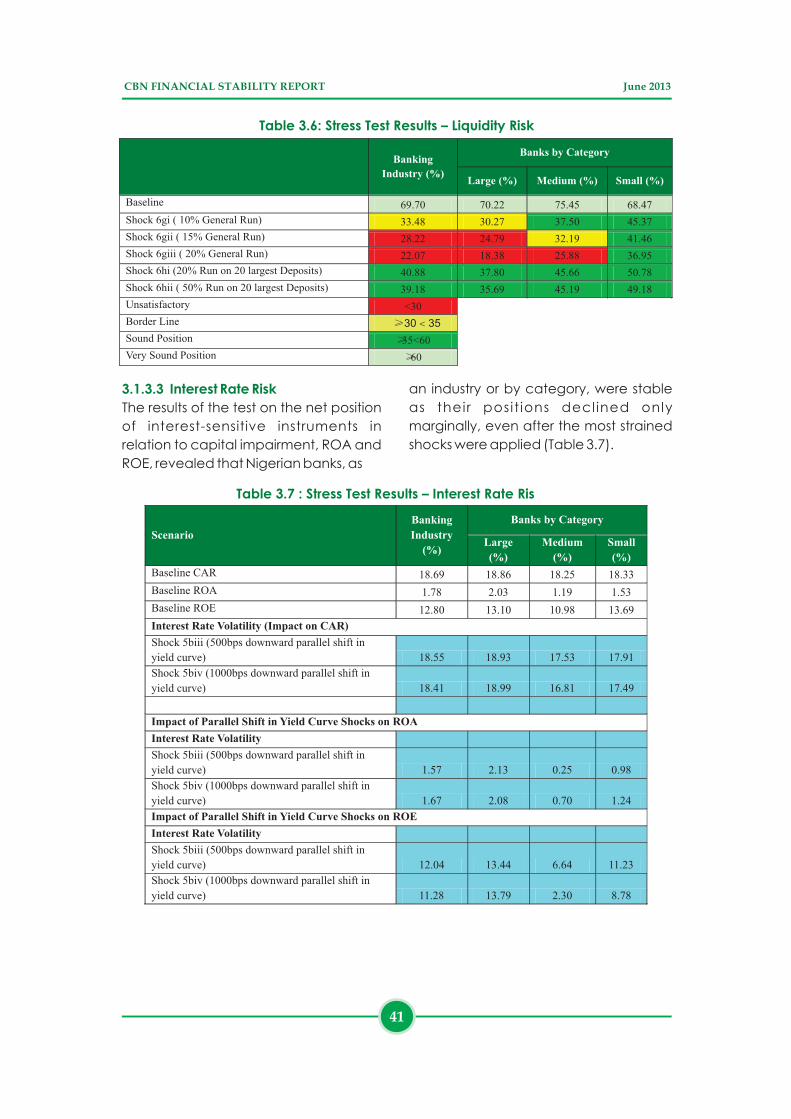
Banking
Industry
(%)
Banks by Category
Large
(%)
Medium
(%)
Small (%)
Baseline 69.70
70.22
75.45
68.47
Shock 6gi ( 10% General Run)
33.48
30.27
37.50
45.37
Shock 6gii ( 15% General Run) 28.22 24.79 32.19 41.46
Shock 6giii ( 20% General Run) 22.07 18.38 25.88 36.95
Shock 6hi (20% Run on 20 largest Deposits) 40.88
37.80
45.66
50.78
Shock 6hii ( 50%
Run on 20 largest Deposits)
39.18
35.69
45.19
49.18
Unsatisfactory
<30
Border Line
≥30 < 35
Sound Position
≥35<60
Very Sound Position
≥60
Table 3.6: Stress Test Results – Liquidity Risk
3.1.3.3 Interest Rate Risk
The results of the test on the net position
of interest-sensitive instruments in
relation to capital impairment, ROA and
ROE, revealed that Nigerian banks, as
an industry or by category, were stable
as their posit ions decl ined only
marginally, even after the most strained
shocks were applied (Table 3.7).
Scenario
Banking
Industry
(%)
Banks
by Category
Large
(%)
Medium
(%)
Small
(%)
Baseline CAR
18.69
18.86
18.25
18.33
Baseline ROA
1.78
2.03
1.19
1.53
Baseline ROE
12.80
13.10
10.98
13.69
Interest Rate Volatility (Impact on CAR)
Shock 5biii (500bps downward parallel shift in
yield curve)
18.55
18.93
17.53
17.91
Shock 5biv (1000bps downward parallel shift in
yield curve) 18.41 18.99 16.81 17.49
Impact of Parallel Shift in Yield Curve Shocks on ROA Interest Rate Volatility
Shock 5biii (500bps downward parallel shift in
yield curve)
1.57
2.13
0.25
0.98
Shock 5biv (1000bps downward parallel shift in
yield curve)
1.67
2.08
0.70
1.24
Impact of Parallel Shift in Yield Curve Shocks on ROE
Interest Rate Volatility
Shock 5biii (500bps downward parallel shift in
yield curve)
12.04
13.44
6.64
11.23
Shock 5biv (1000bps downward parallel shift in
yield curve)
11.28
13.79
2.30
8.78
Table 3.7 : Stress Test Results – Interest Rate Ris
CBN FINANCIAL STABILITY REPORT June 2013
41
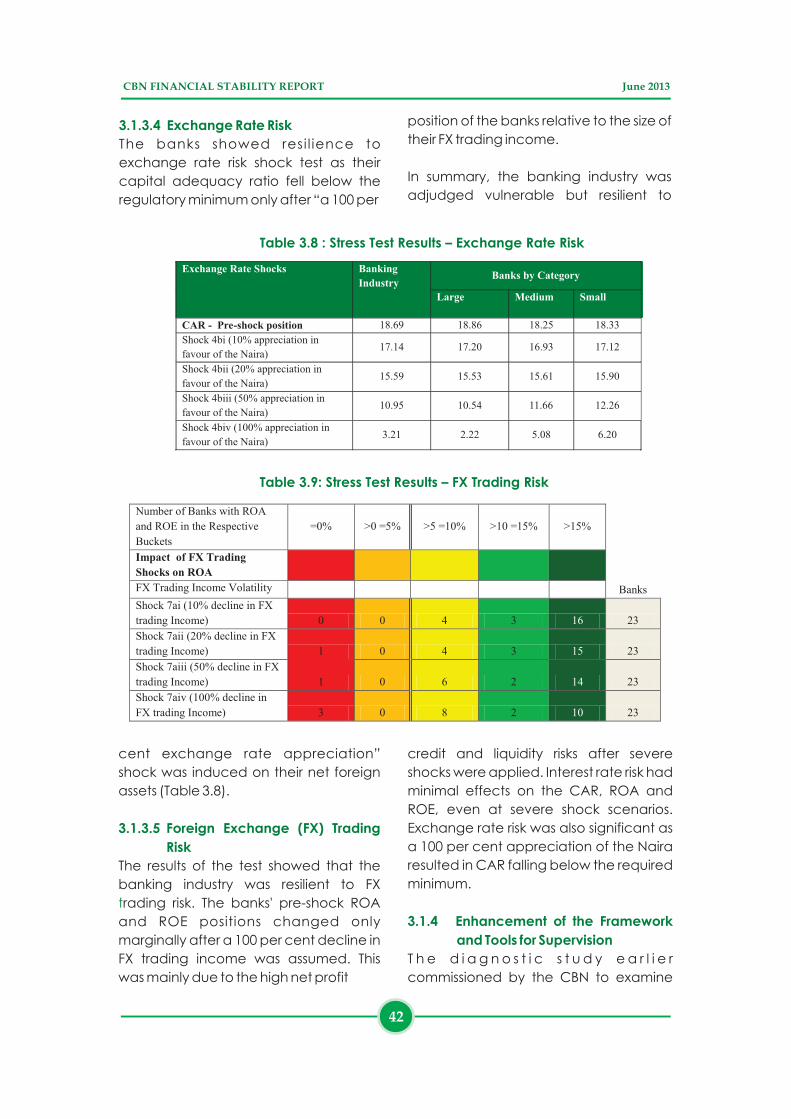
3.1.3.4 Exchange Rate Risk
The banks showed resi l ience to
exchange rate risk shock test as their
capital adequacy ratio fell below the
regulatory minimum only after “a 100 per
cent exchange rate appreciation”
shock was induced on their net foreign
assets (Table 3.8).
The results of the test showed that the
banking industry was resilient to FX
rading risk. The banks' pre-shock ROA
and ROE positions changed only
marginally after a 100 per cent decline in
FX trading income was assumed. This
was mainly due to the high net profit
3.1.3.5 Foreign Exchange (FX) Trading
Risk
t
Exchange Rate Shocks
Banking
Industry
Banks by Category
Large
Medium
Small
CAR - Pre-shock position
18.69
18.86
18.25
18.33
Shock 4bi (10% appreciation in
favour of the Naira) 17.14 17.20 16.93 17.12
Shock 4bii (20% appreciation in
favour of the Naira)
15.59 15.53 15.61 15.90
Shock 4biii (50% appreciation in
favour of the Naira)
10.95
10.54
11.66
12.26
Shock 4biv (100% appreciation in
favour of the Naira)
3.21
2.22
5.08
6.20
Table 3.8 : Stress Test Results – Exchange Rate Risk
Number of Banks with ROA
and ROE in the Respective
Buckets
=0% >0 =5% >5 =10% >10 =15% >15%
Impact of FX Trading
Shocks on ROA
FX Trading Income Volatility Banks
Shock 7ai (10% decline in FX
trading Income) 0 0 4 3 16 23
Shock 7aii (20% decline in FX
trading Income) 1 0 4 3 15 23
Shock 7aiii (50% decline in FX
trading Income) 1 0 6 2 14 23
Shock 7aiv (100% decline in
FX trading Income) 3 0 8 2 10 23
Table 3.9: Stress Test Results – FX Trading Risk
position of the banks relative to the size of
their FX trading income.
In summary, the banking industry was
adjudged vulnerable but resilient to
credit and liquidity risks after severe
shocks were applied. Interest rate risk had
minimal effects on the CAR, ROA and
ROE, even at severe shock scenarios.
Exchange rate risk was also significant as
a 100 per cent appreciation of the Naira
resulted in CAR falling below the required
minimum.
T h e d i a g n o s t i c s t u d y e a r l i e r
commissioned by the CBN to examine
3.1.4 Enhancement of the Framework
and Tools for Supervision
CBN FINANCIAL STABILITY REPORT June 2013
42
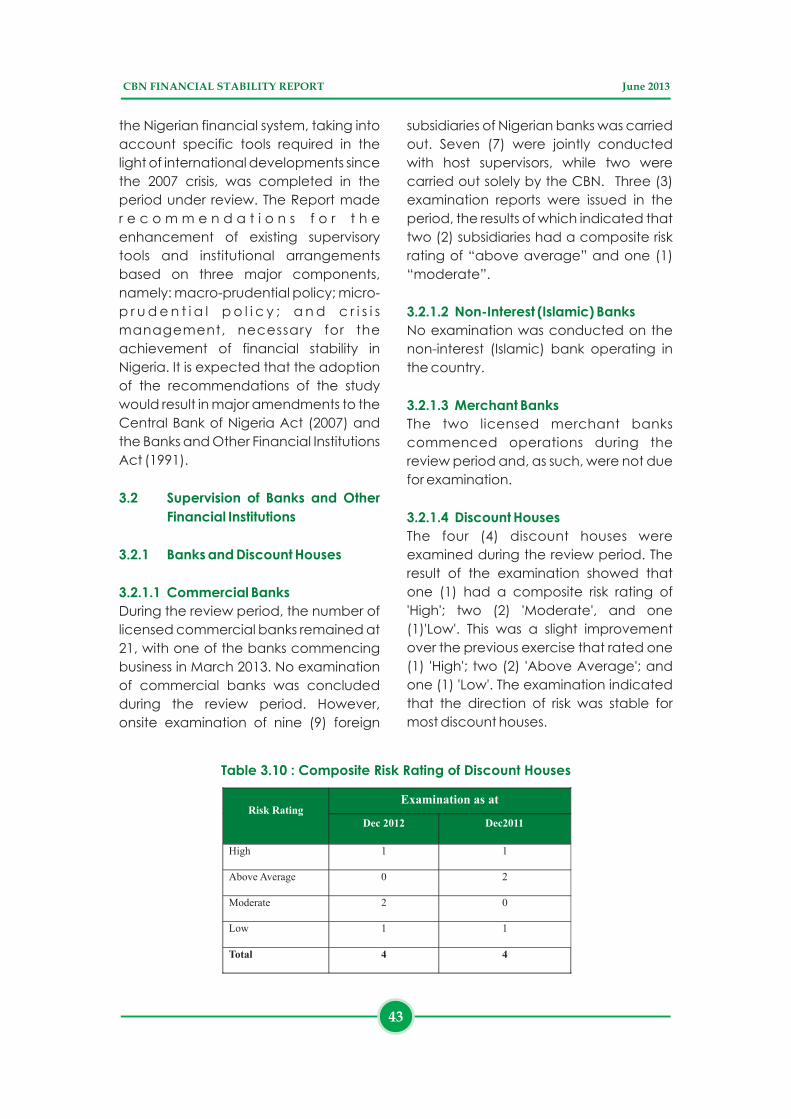
the Nigerian financial system, taking into
account specific tools required in the
light of international developments since
the 2007 crisis, was completed in the
period under review. The Report made
r e c o m m e n d a t i o n s f o r t h e
enhancement of existing supervisory
tools and institutional arrangements
based on three major components,
namely: macro-prudential policy; micro-
p r u d e n t i a l p o l i c y ; a n d c r i s i s
management, necessary for the
achievement of financial stability in
Nigeria. It is expected that the adoption
of the recommendations of the study
would result in major amendments to the
Central Bank of Nigeria Act (2007) and
the Banks and Other Financial Institutions
Act (1991).
During the review period, the number of
licensed commercial banks remained at
21, with one of the banks commencing
business in March 2013. No examination
of commercial banks was concluded
during the review period. However,
onsite examination of nine (9) foreign
3.2 Supervision of Banks and Other
Financial Institutions
3.2.1 Banks and Discount Houses
3.2.1.1 Commercial Banks
subsidiaries of Nigerian banks was carried
out. Seven (7) were jointly conducted
with host supervisors, while two were
carried out solely by the CBN. Three (3)
examination reports were issued in the
period, the results of which indicated that
two (2) subsidiaries had a composite risk
rating of “above average” and one (1)
“moderate”.
No examination was conducted on the
non-interest (Islamic) bank operating in
the country.
The two licensed merchant banks
commenced operations during the
review period and, as such, were not due
for examination.
The four (4) discount houses were
examined during the review period. The
result of the examination showed that
one (1) had a composite risk rating of
'High'; two (2) 'Moderate', and one
(1)'Low'. This was a slight improvement
over the previous exercise that rated one
(1) 'High'; two (2) 'Above Average'; and
one (1) 'Low'. The examination indicated
that the direction of risk was stable for
most discount houses.
3.2.1.2 Non-Interest (Islamic) Banks
3.2.1.3 Merchant Banks
3.2.1.4 Discount Houses
Risk Rating
Examination as at
Dec 2012
Dec2011
High 1 1
Above Average
0
2
Moderate
2
0
Low
1
1
Total
4
4
Table 3.10 : Composite Risk Rating of Discount Houses
CBN FINANCIAL STABILITY REPORT June 2013
43
Improved board and management
oversight and enhanced internal
controls and risk management practices
were the major factors that moderated
the risk rating of the two discount houses
rated “Above Average” in 2011.
Conversely, the discount house
previously rated high risk in 2011 further
d e t e r i o r a t e d . T h e c o n t i n u e d
deterioration of the financial health of
this discount house constituted a
potential risk to the discount house sub-
sector. However, regulatory measures
have been put in place to mitigate the
risk of contagion.
The capital of three (3) discount houses
had improved to 'Acceptable' from
'Needs Improvement' since the previous
examination. A discount house was,
however, expected to inject additional
capital for its continued operations.
The earnings performance of two
discount houses was upgraded from
“Needs Improvement”, during the
previous period to “Acceptable”.
However, the high proportion of Local
Contractors Bonds which were on “held-
to-maturity,” had the potential of
i n c r e a s i n g t h e i r l i q u i d i t y r i s k .
N e v e r t h e l e s s , d i s c o u n t h o u s e s
continued to play their important
intermediation role in fixed income
securities, thereby providing the
financial industry with liquidity.
At end-June 2013, there were 903
licensed MFBs, representing an increase
of 21 over the number at end-
December 2012. Routine examination
was conducted on 262 of the MFBs. The
outcome was mixed. Several MFBs
recorded improvements in
3.3 Other Financial Institutions
3.3.1 Microfinance Banks (MFBs)
performance, while others witnessed
deterioration in operational results. Poor
asset quality remained the bane of the
MFBs. Spot checks were also conducted
to confirm the status of 123 other MFBs
that had earlier been observed to be
inactive. To reduce the high credit risk in
the sub-sector, the CBN, in conjunction
with the Financial Institutions Training
Centre (FITC), organized enterprise risk
management (ERM) workshops for
microfinance banks. The key objective
of the workshops was to mentor MFBs on
the imperatives of adopting sound risk
management principles.
At end-June 2013, only 10 of the 82
licensed PMBs met the new minimum
capital threshold of N2.5 billion while a
total of 18 applications for no-objection
approval of merger plans were received
by the CBN. The deadl ine for
compliance with the new capital
requirement remains end-December
2013. As a pre-emptive measure, an
inter-agency committee to review
developments in the sub-sector and
advise on appropriate distress resolution
strategies was set-up by the CBN/NDIC
Executive Committee on Supervision.
While the exercise did not point at any
grave or immediate threat to the larger
financial system, it nonetheless revealed
a number of major downside risks for
each of the industry's stakeholders:
creditors, shareholders, depositors and
other counterparties. The risks were
identified to include those arising from
the exposure of the payments system
and the larger financial system to PMBs,
and possible financial disintermediation
resulting from loss of customers' deposits
and investors' funds, as well as an
anticipated severe strain on the deposit
insurance guarantee fund. The
3.3.2 Primary Mortgage Banks (PMBs)
CBN FINANCIAL STABILITY REPORT June 2013
44
identified risks are expected to be
adequately addressed by the existing
distress resolution framework.
The number of FCs reduced to 65 at end-
June 2013, from 66 at end-December
2012, as one surrendered its licence.
As part of the stakeholder consultations
to finalise the Finance Companies
Reform Initiatives, the CBN held
interactive sessions with the Finance
Houses Association of Nigeria (FHAN)
and the Equipment Leasing Association
of Nigeria (ELAN) during the review
period. Following this, the reviewed
operating guidelines for finance
companies were finalised.
The surveillance team of the Inter-
agency Committee on Illegal Fund
Managers (wonder banks) sealed off the
premises of two i l legal f inance
companies in the first half of 2013. Also,
hearing on the criminal cases against
the directors of two other illegal finance
companies was reopened during the
period. Furthermore, a comprehensive
approach to contain the menace of
“wonder banks” was approved during
the period.
The number of BDCs at end-June 2013
was 2,458,compared with 2,278 at end-
December 2012. Spot-checks were
conducted on 60 BDCs during the
rev iew per iod to conf i rm thei r
compliance with existing regulations.
The exercise revealed improvements in
the operation of BDCs over the observed
position in 2011 and 2012. Infractions,
such as FX sales above approved limits,
insufficient documentation, and failure
to endorse customers' international
passports with the amounts of FX
3.3.3 Finance Companies (FCs)
3.3.4 Bureaux de Change (BDCs)
purchased, however, pers i s ted.
Appropriate sanctions were meted out
to the erring institutions.
In the drive to de-list Nigeria from the
FATF grey list, the CBN:
! Issued circulars to banks and OFIs on
“Additional Know Your Customer
(KYC) requirements in respect of
D e s i g n a t e d N o n - F i n a n c i a l
B u s i n e s s e s a n d P r o f e s s i o n s
(DNFBPs)”;
! Issued circulars to banks and OFIs on
Section 2 of the Money Laundering
Prohibition Act: “Duty to report
International Transfer of Funds -
T r a n s p o r t a t i o n o f C a s h o r
Negotiable Instruments in excess of
US$10,000 or its equivalent”;
! C i r c u l a t e d U n i t e d N a t i o n s '
Consolidated Lists of persons/entities
involved with terrorism financing or
terrorist activities to financial
institutions; and
! Issued circulars and notifications to
banks and other financial institutions
in respect of other acts of terrorist
financing.
The CBN cont inued to monitor
compliance with extant circulars
through on-site and off-site supervision.
Banks, discount houses and 13 other
financial institutions prepared their
financial statements for the year ended
December 31, 2012, in line with the
implementation roadmap for adoption
3.4 Compliance with International
Standards
3.4.1 A n t i - M o n e y L a u n d e r i n g /
Combating the Financing of
Terrorism
3.4.2 International Financial Reporting
Standards and Basel II/III
CBN FINANCIAL STABILITY REPORT June 2013
45

of International Financial Reporting
Standards (IFRS). Three banks that had
hitherto prepared IFRS-compliant
financial statements, in response to
i n t e r n a t i o n a l r e g u l a t o r y f i l i n g
r e q u i r e m e n t s w e r e a c c o r d e d
recognition as early adopters while
others were first-time adopters of IFRS
specifications.
Training programmes were conducted
for regulators of the financial sector to
enhance their capacity to supervise in
an IFRS regime. Furthermore, the
CBN/NDIC continued the process of
developing an IFRS-compliant reporting
system.
On Basel II/III, workshops were held to
sensitize CBN/NDIC Examiners, as well as
Chief Risk Officers (CROs) of banks, on
the new Basel II/III Regulatory Framework
for Prudential Supervision of the Nigerian
Banking System. The Framework requires
all banks to commence a parallel run of
Base l I I m in imum computat ion
requirements, using Standardized
Approaches for credit and market risk,
while the Basic Indicator Approach
would be used for operational risk. The
Framework was being reviewed,
following responses received on the
exposure draft.
The Eligible Bank Assets (EBAs) acquired
by the Asset Management Corporation
of Nigeria (AMCON) stood at N2.72
trillion at end-June 2013, compared with
N2.77 trillion at end-December 2012.
EBAs valued at N322 billion were
restructured during the period, of which
53.18 per cent were performing, while
3.5 T h e A s s e t M a n a g e m e n t
Corporation of Nigeria (AMCON)
46.82 per cent were non-performing.
Total recoveries for the first half of 2013
amounted to N109.40 billion, compared
with N23.61 billion at end-December
2012.
AMCON did not issue additional bonds
during the review period. Thus ,the total
face value of bonds issued at end-June
2013 remained at N5.59 trillion.
In May 2013, the Corporation announced
its plan to redeem bonds held by the
private sector at maturity, while those
held by the CBN would be restructured
into a 10-year bond at 6 per cent. The
cash generated from recoveries and
contributions to the Banking Sector
Resolution Cost Fund would be used to
redeem the bonds at maturity.
Credit risk has been largely contained in
the Nigerian banking system, due to the
act iv i t ies o f AMCON. However ,
concentration risk remained a challenge,
as the top 50 and 100 obligors accounted
for 32.57 and 40.76 per cent, respectively,
of gross credit at end-June 2013.
The asset quality of banks declined
marginally during the first half of 2013, as
the NPL ratio increased to 3.65 per cent,
compared with 3.47 per cent at end-
December 2012. The NPL ratio of the
industry, however, remained well within
the regulatory ceiling of 5.0 per cent
(Figure 3.13).The NPLs increased by 13.75
per cent to N321.8 billion at end-June
2013, from N282.9 billion at end-
December 2012.
3.6 Key Risks in the Financial System
3.6.1 Credit Risk
CBN FINANCIAL STABILITY REPORT June 2013
46
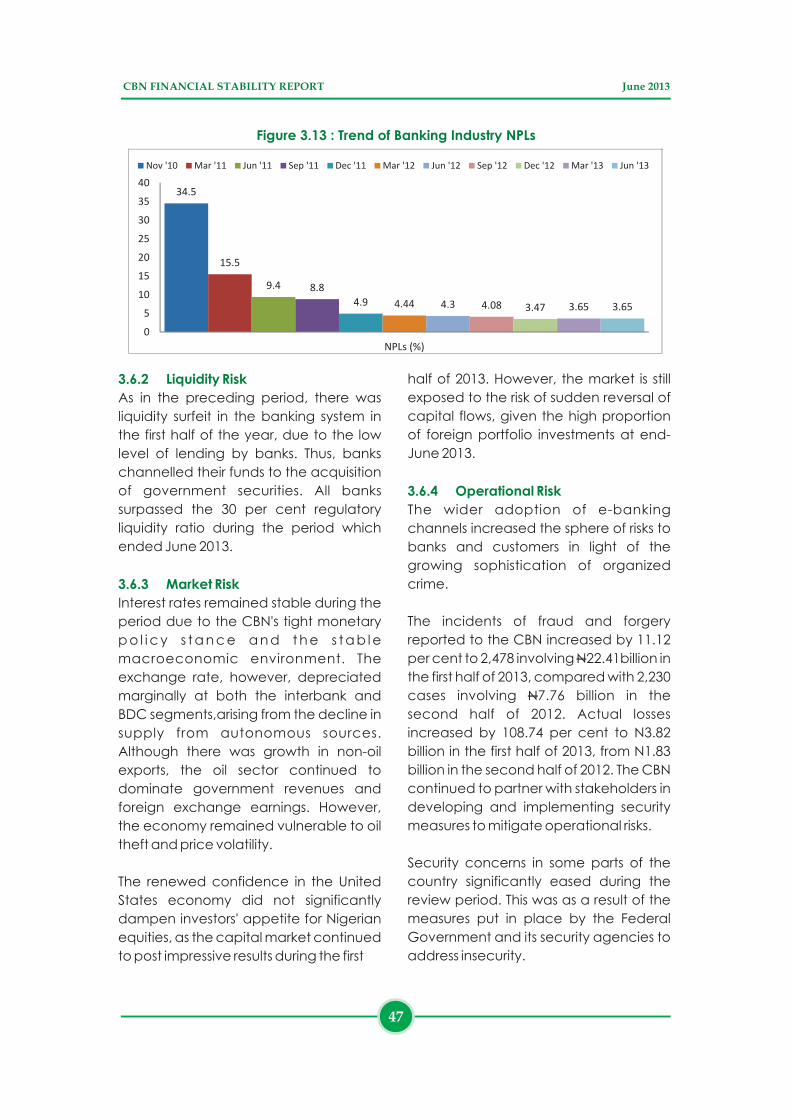
Figure 3.13 : Trend of Banking Industry NPLs
34.5
15.5
9.4 8.8
4.9
4.44
4.3
4.08 3.47
3.65
3.65
0
5
10
15
20
25
30
35
40
NPLs (%)
Nov '10 Mar '11 Jun '11 Sep '11 Dec '11 Mar '12 Jun '12 Sep '12 Dec '12 Mar '13 Jun '13
3.6.2 Liquidity Risk
3.6.3 Market Risk
As in the preceding period, there was
liquidity surfeit in the banking system in
the first half of the year, due to the low
level of lending by banks. Thus, banks
channelled their funds to the acquisition
of government securities. All banks
surpassed the 30 per cent regulatory
liquidity ratio during the period which
ended June 2013.
Interest rates remained stable during the
period due to the CBN's tight monetary
p o l i c y s t a n c e a n d t h e s t a b l e
macroeconomic environment. The
exchange rate, however, depreciated
marginally at both the interbank and
BDC segments,arising from the decline in
supply from autonomous sources.
Although there was growth in non-oil
exports, the oil sector continued to
dominate government revenues and
foreign exchange earnings. However,
the economy remained vulnerable to oil
theft and price volatility.
The renewed confidence in the United
States economy did not significantly
dampen investors' appetite for Nigerian
equities, as the capital market continued
to post impressive results during the first
half of 2013. However, the market is still
exposed to the risk of sudden reversal of
capital flows, given the high proportion
of foreign portfolio investments at end-
June 2013.
The wider adoption of e-banking
channels increased the sphere of risks to
banks and customers in light of the
growing sophistication of organized
crime.
The incidents of fraud and forgery
reported to the CBN increased by 11.12
per cent to 2,478 involving N22.41billion in
the first half of 2013, compared with 2,230
cases involving N7.76 billion in the
second half of 2012. Actual losses
increased by 108.74 per cent to N3.82
billion in the first half of 2013, from N1.83
billion in the second half of 2012. The CBN
continued to partner with stakeholders in
developing and implementing security
measures to mitigate operational risks.
Security concerns in some parts of the
country significantly eased during the
review period. This was as a result of the
measures put in place by the Federal
Government and its security agencies to
address insecurity.
3.6.4 Operational Risk
CBN FINANCIAL STABILITY REPORT June 2013
47
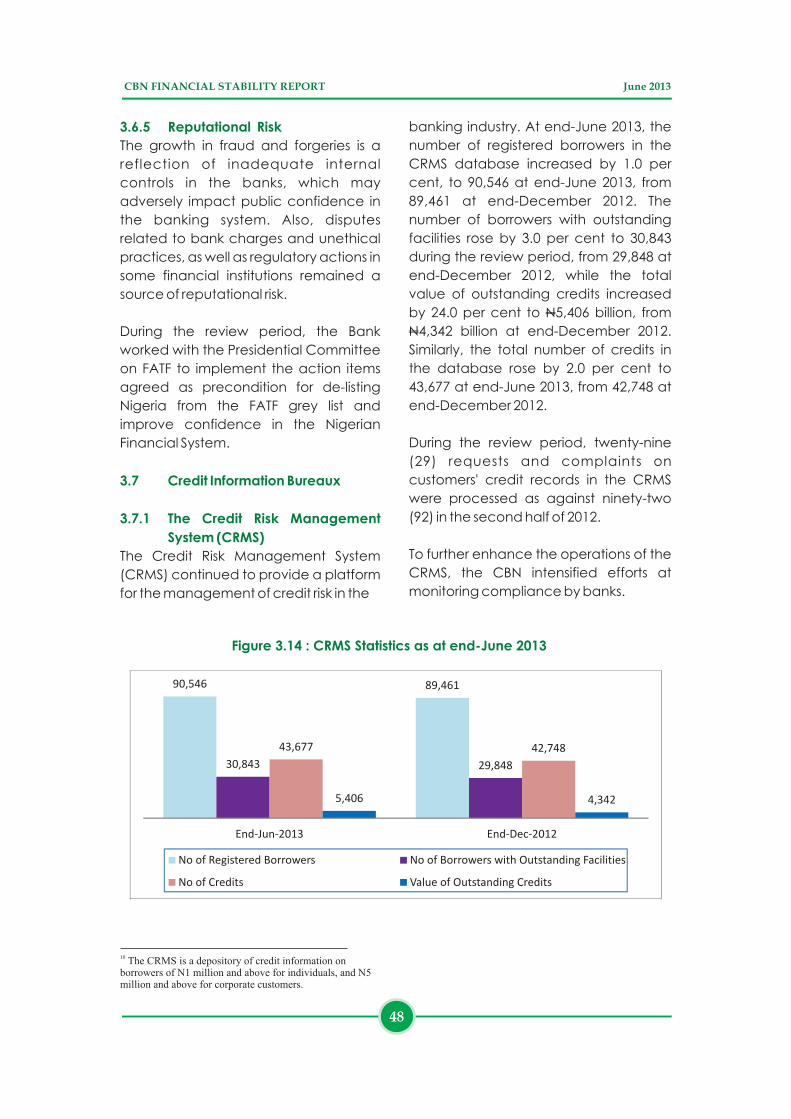
3.6.5 Reputational Risk
3.7 Credit Information Bureaux
3.7.1 The Credit Risk Management
System (CRMS)
The growth in fraud and forgeries is a
reflection of inadequate internal
controls in the banks, which may
adversely impact public confidence in
the banking system. Also, disputes
related to bank charges and unethical
practices, as well as regulatory actions in
some financial institutions remained a
source of reputational risk.
During the review period, the Bank
worked with the Presidential Committee
on FATF to implement the action items
agreed as precondition for de-listing
Nigeria from the FATF grey list and
improve confidence in the Nigerian
Financial System.
The Credit Risk Management System
(CRMS) continued to provide a platform
for the management of credit risk in the
banking industry. At end-June 2013, the
number of registered borrowers in the
CRMS database increased by 1.0 per
cent, to 90,546 at end-June 2013, from
89,461 at end-December 2012. The
number of borrowers with outstanding
facilities rose by 3.0 per cent to 30,843
during the review period, from 29,848 at
end-December 2012, while the total
value of outstanding credits increased
by 24.0 per cent to N5,406 billion, from
N4,342 billion at end-December 2012.
Similarly, the total number of credits in
the database rose by 2.0 per cent to
43,677 at end-June 2013, from 42,748 at
end-December 2012.
During the review period, twenty-nine
(29) requests and complaints on
customers' credit records in the CRMS
were processed as against ninety-two
(92) in the second half of 2012.
To further enhance the operations of the
CRMS, the CBN intensified efforts at
monitoring compliance by banks.
Figure 3.14 : CRMS Statistics as at end-June 2013
10 The CRMS is a depository of credit information on borrowers of N1 million and above for individuals, and N5 million and above for corporate customers.
CBN FINANCIAL STABILITY REPORT June 2013
48
90,546 89,461
30,843
29,848
43,677 42,748
5,406
4,342
End-Jun-2013 End-Dec-2012
No of Registered Borrowers No of Borrowers with Outstanding Facilities
No of Credits Value of Outstanding Credits
3.7.2 Private Credit Bureaux (PCBs)
3.8 The Financial Services Regulation
C o o r d i n a t i n g C o m m i t t e e
(FSRCC)
The Private Credit Bureaux (PCBs)
continued to complement the CBN
CRMS in the credit administration
process. At end-June 2013, the number
of PCBs in the system remained three
while their activities were buoyed by
increased patronage by both financial
and non-financial institutions. Similarly,
the number of borrowers in their
database increased to 21.08 million from
19.71 million at end-December 2012.
Despite the modest growth, the PCBs
faced some challenges, which included
absence of a unique identifier and poor
information-sharing.
The Financial Services Regulation
Coordinating Committee (FSRCC) held
its 49th meeting on April 12, 2013 at which
vital decisions to enhance financial
system stability were taken. Specifically,
the framework for consol idated
supervision principles and a roadmap for
the implementation of consolidated
supervision in the Nigerian financial
services industry were approved for
implementation. Meanwhile, training on
consolidated supervision for staff of
member agencies has been planned for
early December 2013.
The charter of the FSRCC was amended
to accord with its financial stability
mandate. The Committee also carried
out a holistic review of the financial
system with a view to determining the
impact of the various sectoral reforms
carried out from 2009 to date. The
Harmonization and Coordinating Sub-
Committee commenced the gap
analysis of the Code of Corporate
Governance issued by all Member
Agencies for the purpose of suggesting
improvements to strengthen them.
Seven hundred and fifty nine (759)
complaints were received in the first half
of 2013, reflecting an increase of 36.8 per
cent over the 555 received in the second
half of 2012. The total refunds to
petitioners amounted to N1.45 billion,
compared with N2.20 billion recorded in
the second half of 2012.
During the review period, a desk circular,
the Financial Literacy Framework, which
provides a roadmap for financial literacy
to promote financial inclusion, was
issued. A monitoring exercise was also
carried out to assess banks' compliance
with the requirements of the help desk
circular and complaints management
requirements. The findings revealed that
banks had deployed more resources
into customer enlightenment, as well as
c o m p l a i n t s m a n a g e m e n t a n d
resolution, with a view to improving
public confidence in the banking
system.
3.9 Consumer Protection
CBN FINANCIAL STABILITY REPORT June 2013
49

4.0DEVELOPMENTS IN THE PAYMENTSSYSTEM
In furtherance of its activities towards the
development of the National Payments
System, the CBN, during the period
under review:
! Commenced a nationwide
cheque truncation system to
enhance the efficiency of
cheque clearing and settlement
which resulted in a reduction of
both the clearing cycle to T+1
from T+2, and the float in the
banking system;
! Implemented the N150,000 limit
for encashment of third-party
cheques nationwide, to promote
e-payment, minimize fraud and
other risks associated with paper-
based instruments;
! Granted commercial licences to
two (2) additional mobile money
operators, which brought the
total number to 18;
! Licensed a third-party processor
(TPP) company; and
! Issued Guidelines on Agent
Banking and Agent Banking
Relationships in Nigeria.
In continuation of the implementation of
the Payments System Vision 2020 (PSV
2020), the CBN:
4.1 The Payments System Vision 2020
! Completed the installation of the
new RTGS software and carried
out the users' acceptance tests in
preparation for the system to go
live in the last quarter of 2013. The
new RTGS System is expected to
reduce liquidity risk, minimise
credit risk, and increase the
efficiency of treasury operations
of financial institutions; and
! Commenced the review of the
payment systems infrastructure
(RTGS, ACH, Cheques, Cards,
Instant Payment and Mobile
money)consistent with the new
Bank for International Settlements
(BIS)Principles for Financial
Market Infrastructure. This is to
strengthen the existing payments
system infrastructure.
The volume and value of inter-bank
transfers through the Real-Time Gross
Settlement (RTGS) System declined to
197,220 and N55,005.31 billion at end-
J u n e 2 0 1 3 , f r o m 2 1 3 , 8 2 5 a n d
N57,285.87billion, respectively, at end-
December 2012, reflecting a decrease
of 7.8 and 4.0 per cent, respectively, in
volume and value. The decreases were
attributed to increased use of other
alternative payment platforms, such as
the NIBSS Instant Payment and web-
based payments.
4.2 The Real-Time Gross Settlement
(RTGS) System
CBN FINANCIAL STABILITY REPORT June 2013
51

4.3 The NIBSS Instant Payment (NIP)
The volume and value of NIBSS Instant
Payment (NIP) rose to 5,924,602 and
N4,178.76 billion at end-June 2013, from
3,293,216 and N2,872.77 b i l l ion
respectively, at end-December 2012,
reflecting increases of 79.90 and 45.46
per cent, respectively, in volume and
value, respectively. The significant rise
was attributed to the growing usage of
the scheme as a result of the
implementation of the cash-less policy of
the CBN.
Figure 4.1 : CBN RTGS Transactions, January to June 2013
Figure 4.2: Value and Volume of NIP Transactions, January to June 2013
0
200
400
600
800
1,000
1,200
1,400
0
100
200
300
400
500
600
700
800
900
JAN FEB MAR APR MAY JUN
Nu
mb
er
of
tran
sact
ion
s in
'00
0
N' b
illio
n
Volume Value
4.4 NIBSS Electronic Fund Transfer
(NEFT)
The volume and value of NIBSS Electronic
Fund Transfer (NEFT) transactions
decreased to 13,918,838 and N6,738.14
billion at end-June 2013, from 15,143,752
and N6,845.40 billion, respectively, at
end-December 2012, reflecting a
decline of 8.09 and 1.57 per cent,
respectively, in volume and value.
CBN FINANCIAL STABILITY REPORT June 2013
52
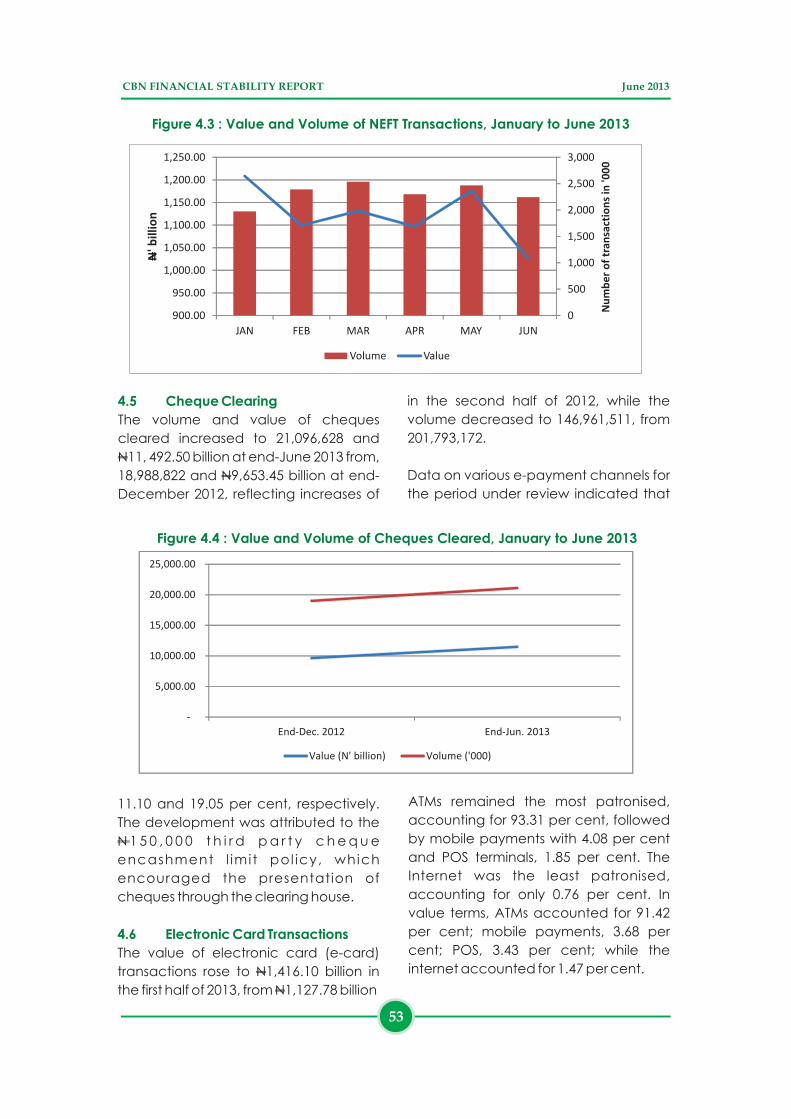
0
500
1,000
1,500
2,000
2,500
3,000
900.00
950.00
1,000.00
1,050.00
1,100.00
1,150.00
1,200.00
1,250.00
JAN FEB MAR APR MAY JUN
Nu
mb
er
of
tran
sact
ion
s in
'00
0
N' b
illio
n
Volume Value
Figure 4.3 : Value and Volume of NEFT Transactions, January to June 2013
4.5 Cheque Clearing
The volume and value of cheques
cleared increased to 21,096,628 and
N11, 492.50 billion at end-June 2013 from,
18,988,822 and N9,653.45 billion at end-
December 2012, reflecting increases of
Figure 4.4 : Value and Volume of Cheques Cleared, January to June 2013
11.10 and 19.05 per cent, respectively.
The development was attributed to the
N 1 5 0 , 0 0 0 t h i r d p a r t y c h e q u e
encashment l imit pol icy, which
encouraged the presentation of
cheques through the clearing house.
The value of electronic card (e-card)
transactions rose to N1,416.10 billion in
the first half of 2013, from N1,127.78 billion
4.6 Electronic Card Transactions
in the second half of 2012, while the
volume decreased to 146,961,511, from
201,793,172.
Data on various e-payment channels for
the period under review indicated that
ATMs remained the most patronised,
accounting for 93.31 per cent, followed
by mobile payments with 4.08 per cent
and POS terminals, 1.85 per cent. The
Internet was the least patronised,
accounting for only 0.76 per cent. In
value terms, ATMs accounted for 91.42
per cent; mobile payments, 3.68 per
cent; POS, 3.43 per cent; while the
internet accounted for 1.47 per cent.
CBN FINANCIAL STABILITY REPORT June 2013
53
-
5,000.00
10,000.00
15,000.00
20,000.00
25,000.00
End-Dec. 2012 End-Jun. 2013
Value (N' billion) Volume ('000)

Figure 4.5: Volume of Electronic Card Transactions, January to June 2013
Figure 4.6: Value of Electronic Card Transactions, January to June 2013
ATM POS INTERNET MOBILE
ATM POS INTERNET MOBILE
4.6.1 ATM Transactions
4.6.2 Mobile Banking
The number of ATMs stood at 11,702 at
end-June 2013 as against the revised
figure of 10,727 at end-December 2012,
reflecting an increase of 9.09 percent.
The volume of ATM transactions
decreased by 30.6 per cent to
136,663,013 during the first half of 2013,
from 196,995,507 in the second half of
2012. However, the value of transactions
rose to N1,286.35 billion at end-June
2013, from N1,046.62 billion in the second
half of 2012, showing an increase of 22.9
per cent.
The volume and value of mobile
payments increased during the review
period to 5,982,225 and N51.79 billion,
from 1,668,113 and N25.50 billion,
respectively, in the second half of 2012,
indicating increases of 258.6 and 103.0
per cent, respectively, in volume and
value. The significant rise was as a result
of the increase in the number of mobile
payment operators, as well as improved
public awareness in the use of mobile
banking services.
The volume of points of sale (POS)
transactions increased by 64.4 per cent
to 3,207,788 in the first half of 2013,
compared with 1,951,252 in the second
half of 2012. Similarly, the value rose by
53.0 per cent to N57.2 billion over the
level recorded in the preceding half
year. The increase in volume and value
4.6.3 Points of Sale Transactions
CBN FINANCIAL STABILITY REPORT June 2013
54

was due to sustained public awareness
and acceptance of its usage.
The volume of web-based transactions
in the first half of 2013 was 1,108,485,
indicating a decline of 5.9 per cent,
4.6.4 Web (Internet) Transactions
compared with 1,178,300 in the second
half of 2012. However, the value rose by
13.1 per cent to N20.7 billion, from N18.3
billion in the preceding period. The fall in
volume was due to users' preference for
other payment channels.
CBN FINANCIAL STABILITY REPORT June 2013
55

5.0OUTLOOK
Global output is projected to remain 11subdued in the second half of 2013 , as a
result of lower-than-expected demand,
slower growth in developed economies
and protracted recession in the Euro
zone. Emerging markets are also
projected to experience a slowdown in
growth. Arising from these projections,
the demand for Nigeria's crude oil could
be adversely affected. The above
developments, in addition to challenges
in the oil-producing areas, could
contribute to low accretion to external
reserves.
Furthermore, the potential reversal of the
US quantitative easing and increase in
yields on financial assets could weaken
credit lines, thus adversely impacting the
balance sheets of domestic banks.
These developments could trigger some
portfolio reversals and exert pressure on
the foreign exchange and capital
markets in Nigeria.
Also, the continued implementation of
the US oil-independence policy could
reduce demand for Nigeria's crude and,
when combined with a likely fall in oil
prices, would negatively impact
government revenue and system
liquidity.
Money market rates are expected to
remain stable in the second half of 2013,
albeit at relatively higher levels than
what obtained in the f i rst half.
Expectations of an increased liquidity
surfeit in the system would likely be
contained by tight monetary policy in
order to maintain price stability.
11IMF WEO Update, July 2013
CBN FINANCIAL STABILITY REPORT June 2013
57

The recurrence of instability in the Nigerian financial system exposed the
dearth of skills and executive capacity in the banking industry. The gaps
manifested in the following, among others:
! Poor understanding of basic banking operations;
! Poor understanding of banking regulations;
! Knowledge gaps in financial markets and treasury management;
and
! Unethical conduct and unprofessional practices.
The reasons advanced for these inadequacies include the lack of
competency standards for practitioners in the industry. The development of
staff competencies became imperative in addressing the inadequacies,
thus underscoring the need to strengthen the training of the new generation
of banking professionals to develop and deliver satisfactory banking
products and services to the consumers.
Against this background, the CBN, in conjunction with the Bankers'
Committee, decided to consciously redirect the banking industry towards
the path of entrenching a sequenced competency development
programme. The Competency Framework seeks to ensure that workers
possess the qualifications, skills and experience relevant to the jobs that they
are engaged to perform and also prescribes minimum requirements for
officers engaged in control functions. The primary goal of the Framework is to
provide reasonable assurance that a job holder is fit, proper and carries on
satisfactorily the responsibilities of the office he/she occupies.
Specifically, the Competency Framework seeks to achieve the following
objectives:
! Define the minimum knowledge, skills and competencies needed for
operators and regulators to perform their various jobs optimally;
! Standardize capacity and competency development, with a view to
nurturing and producing a knowledgeable, skilled and competent
workforce for the Nigerian banking industry;
! Provide standards for training, certification, evaluation and
accreditation to ensure the provision of quality training in the Nigerian
banking industry;
BOX 1Competency Framework for the Nigerian Banking Industry
CBN FINANCIAL STABILITY REPORT June 2013
59
CBN FINANCIAL STABILITY REPORT June 2013
60
! Identify competency gaps and develop required learning
interventions to bridge the identified gaps; and
! Establish a system of assessing and tracking compliance with defined
standards.
The Framework identifies roles that are of operational or regulatory
significance and designates such roles as control functions. The control
functions are broadly grouped into two – 'significant influence functions' and
'customer functions'. Currently, there are 35 control functions in the
Framework.

