central versus flank eruptions in oceanic volcanic islands
TRANSCRIPT

HAL Id: insu-00827722https://hal-insu.archives-ouvertes.fr/insu-00827722
Submitted on 29 May 2013
HAL is a multi-disciplinary open accessarchive for the deposit and dissemination of sci-entific research documents, whether they are pub-lished or not. The documents may come fromteaching and research institutions in France orabroad, or from public or private research centers.
L’archive ouverte pluridisciplinaire HAL, estdestinée au dépôt et à la diffusion de documentsscientifiques de niveau recherche, publiés ou non,émanant des établissements d’enseignement et derecherche français ou étrangers, des laboratoirespublics ou privés.
Storage conditions and eruptive dynamics of centralversus flank eruptions in volcanic islands: the case of
Tenerife (Canary Islands, Spain)Joan Andújar, Fidel Costa, Bruno Scaillet
To cite this version:Joan Andújar, Fidel Costa, Bruno Scaillet. Storage conditions and eruptive dynamics of central versusflank eruptions in volcanic islands: the case of Tenerife (Canary Islands, Spain). Journal of Volcanologyand Geothermal Research, Elsevier, 2013, 260, pp.62-79. �10.1016/j.jvolgeores.2013.05.004�. �insu-00827722�

1
Storage conditions and eruptive dynamics of central versus flank
eruptions in volcanic islands: the case of Tenerife (Canary Islands,
Spain)
Joan Andújara,*
, Fidel Costab, Bruno Scaillet
a
a. Université d’Orléans, ISTO, UMR 7327, 45071, Orléans, France ; CNRS/INSU,
ISTO, UMR 7327, 45071 Orléans, France ; BRGM, ISTO, UMR 7327, BP 36009,
45060 Orléans, France.
b. Earth Observatory of Singapore, Nanyang Technological University, Singapore
639798, Singapore
* Corresponding author: Joan Andújar.
phone number: (+33) 2 38 25 53 87
Fax: (+33) 02 38 63 64 88
e-mail address: [email protected]
Fidel Costa e-mail address: [email protected]
Bruno Scaillet e-mail address: [email protected]
KEY WORDS: Phase equilibria, phonolite, experimental petrology, eruptive dynamic,
flank eruption, central eruption, Tenerife, Teide.

2
Abstract
We report the results of phase equilibrium experiments on a phonolite produced during
one of the most voluminous flank eruptions (ca. 1 km3) of the Teide-Pico Viejo complex
(Tenerife Island). Combined with previous experimental and volcanological data we
address the factors that control the structure of the phonolitic plumbing system of Teide-
Pico Viejo stratovolcanoes. The Roques Blancos phonolite erupted ca 1800 BP and
contains 14 wt % phenocrysts, mainly anorthoclase, biotite, magnetite, diopside and
lesser amounts of ilmenite. Crystallization experiments were performed at temperatures
of 900ºC, 850ºC and 800ºC, in the pressure range 200 MPa to 50 MPa. The oxygen
fugacity (fO2) was varied between NNO+0.3 (0.3 log units above to the Ni-NiO solid
buffer) to NNO-2, whilst dissolved water contents varied from 7 wt% to 1.5 wt%. The
comparison between natural and experimental phase proportions and compositions,
including glass, indicates that the phonolite magma was stored prior to eruption at
900±15ºC, 50±15MPa, with about 2.2 wt% H2O dissolved in the melt, at an oxygen
fugacity of NNO-0.5 (±0.5). The difference in composition between the rim and the
cores of the natural anorthoclase phenocrysts suggests that the phonolite was heated by
about 50ºC before the eruption, upon intrusion of a hotter tephriphonolitic magma. The
comparison between the storage conditions of Roques Blancos and those inferred for
other phonolites of the Teide-Pico Viejo volcanic complex shows that flank eruptions
are fed by reservoirs located at relatively shallow depths (1-2 km) compared to those
feeding Teide central eruptions (5 km).

3
1. Introduction
Understanding the plumbing system beneath volcanic edifices is crucial to
constrain the parameters that control the evolution of ascending magmas and for
anticipating the future eruptive behaviour of the volcano. The use of dense geophysical
and geochemical monitoring networks deployed on highly active volcanes (i.e., Etna
volcano; Bonacorso et al. 2004) allows to gain information concerning the movement
and likely levels of magma storage. Monitoring data combined with petrological studies
(e.g., Kahl et al., 2011) enables to better reconstruct the geometry of the plumbing
system beneath the volcanic edifice of an on-going eruption, and thus construct more
robust eruptive scenarios in the short time frame.
However, real time monitoring techniques do not easily allow to understand the
mid (e.g., hundred years) to long-term (thousands of year or more) evolution of the
volcanic system, or the variation of eruptive dynamics (ie.; variation in eruptive style
during a single event or between eruptions) with time. This is particularly true for
volcanoes with low eruption frequency, which are characterised by long periods of
dormancy during which little, if any, geophysical or geochemical signals can be
recorded, making their interpretations difficult whenever the system awakes. The
volcanological record often bears witness of significant variations in the eruptive styles
(alternation between sustained explosive Plinian eruptions, transient explosive and
purely effusive activity), and in vent location (central and flank eruptions; i.e., Corsaro
et al., 2007; Ablay and Martí, 2000), which may in part reflect the complexity of the
plumbing system. In such cases, only the study of past eruptions and the distribution of
eruptive centres can provide insights on both the long-term evolution of the volcanic
edifices and on the factors that control the eruptive dynamic.
This is the case of Tenerife in the Canary Islands, a volcanic island that has
slowly evolved from a primitive to highly differentiated edifice. The spatial and
temporal distribution of its recent volcanism demonstrates that the island is highly
active (Martí et al., 2008), yet eruptions are spaced in time, events being separated by
x100-1000 years (Carracedo et al., 2007; Martí et al., 2008). Tenerife island hosts the
active Teide-Pico Viejo volcano, which is characterised by emission of magmas from
either central (Teide main vent) or flank vents. Despite a diversity of eruptive styles
during the last 35 kyrs, erupted magmas have similar phonolitic compositions (Ablay et
al., 1995; Ablay et al., 1998; Rodríguez-Badiola et al, 2006; Carracedo and Rodríguez-

4
Badiola, 2006; Carracedo et al., 2007; Martí et al., 2008; Wiesmaier et al., 2012).
Recent numerical simulations performed on this volcanic complex suggest that the main
factors controlling the vent location at Teide-Pico Viejo are the shape of the reservoir
and the stress field distribution around it which can be affected by the presence of a
second magma chamber (Martí and Geyer, 2009). Such a possibility is supported by the
petrological and geochronological data of recent phonolitic eruptions (Ablay et al.,
1998; Carracedo et al., 2007; Andújar and Scaillet, 2012a). The relative position
between the reservoirs also exerts an important control on the final trajectory of the
injected dykes and hence in the final location (central or flank) of the vent (Martí and
Geyer, 2009). Since the depths of such reservoirs feeding flank eruptions at Teide-Pico
Viejo are poorly constrained (Andújar and Scaillet, 2012a), we have performed phase
equilibrium experiments on a representative phonolite of the Roques Blancos, one of the
most recent flank dome eruptions occurred at this volcanic island.
2. Geological setting
The evolution and stratigraphy of Teide stratovolcano have been the focus of
several studies (i.e., Araña, 1971; Martí et al., 1994; Ablay et al., 1998; Martí and
Gudmunsson, 2000; Ablay and Martí, 2000; Rodríguez-Badiola et al., 2006; Carracedo
et al., 2007; Wiesmaier et al., 2012). We first summarise the main aspects concerning
the structural and volcanological evolution of the actual volcanic complex of Teide and
Pico Viejo stratovolcanoes.
The post-shield volcanism of Tenerife has been characterised by the repetitive
development of compositionally evolved centres including 3 caldera collapses (Martí et
al., 1994; Ablay et al., 1998; Carracedo et al., 2007). The products of the last and most
recent eruptive cycle (< 200 kyr) built the twin stratovolcano of Teide and Pico Viejo (T-
PV). The most recent volcanism includes that of the main T-PV cones which is
characterised by the emission of significant volumes of phonolitic magmas, and the
volumetrically smaller and more mafic eruptions from the rifts (Martí et al., 1994;
Ablay and Martí, 2000; Carracedo et al., 2007; Martí et al., 2008). The extrusion of
mafic to intermediate magmas dominated the first stages of the construction of the T-PV
volcanic complex until 35 ka ago. Then, phonolitic magmas started to erupt and became
the predominant erupted composition till today (Ablay et al., 1998; Rodríguez-Badiola
et al., 2006; Carracedo et al., 2007). During the last 35 ka, magma emission occurred

5
either at central Pico Teide or from the numerous flank vents (up to 10), of which the
Montaña Blanca, Roques Blancos, Pico Cabras and Montaña Rajada events are the most
important ones (Fig.1b; Ablay and Martí, 2000; Rodríguez-Badiola et al., 2006;
Carracedo et al., 2007).
Although such satellite eruptions are volumetrically smaller (generally ≤ 0.2
km3) relative to those from the central Teide vent (generally ≥ 0.3 km
3), they are
characterised by a sustained explosive activity and fall-out deposits together with the
emission of thick lava flows (García et al., 2012; Martí et al., 2012). The explosive
activity of these flank eruptions includes the sub-Plinian event of Montaña Blanca
(Ablay et al., 1995; Ablay and Martí, 2000; Rodríguez-Badiola et al., 2006; Martí et al.,
2008; Andújar and Scaillet, 2012a), and El Boqueron flank eruption (García et al.,
2012). In addition to these episodes, two more phonolitic explosive flank events have
been recently identified (Martí et al., 2012; O. García unpublished data). In contrast,
phonolitic volcanism from Teide proper is less explosive, and alternates between pure
effusive activity that generated thick lava flows and transient explosive activity, which
has produced scoria and spatter deposits (Ablay and Martí, 2000; Martí et al., 2008).
However, it is unclear why some eruptions proceed through the central Teide cone while
others occur on its flanks, and how does this relate to the more explosive activity from
the flank events. Here we provide petrological constraints to explain these observations
by determining the pre-eruptive conditions of the Roques Blancos dome, one of the
most significant flank eruptions in the recent history of Teide-Pico Viejo volcanic
complex, in terms of the erupted volume and extension of the lava flows (Fig.1; Balcells
and Hernández-Pacheco, 1989; Carracedo and Rodríguez-Badiola, 2006; Martí et al,
2008).
3. The Roques Blancos eruption
The Roques Blancos event occurred in two eruptive episodes, the oldest one
(1974 BP) from a satellite dome located at the NW side of Pico Viejo stratovolcano at
about 2800 m asl (above sea level) and, a second eruption occurring at 1714 BP from a
dome located a few hundred meters below the first vent (2500-2600 m asl; Fig. 1;
Balcells and Hernández-Pacheco, 1989; Carracedo and Rodríguez-Badiola, 2006;
Carracedo et al., 2007). These eruptions emitted about 0.8 to 1 km3 of highly evolved
phonolitic magma which covered a surface of about 15 km2 and generated lava that
flowed over a height difference of about 3000 m, reaching the seaside in the Northern

6
part of Tenerife Island (Carracedo and Rodríguez-Badiola 2006; Martí et al., 2012).
Both phonolitic products are petrologically and geochemically very similar (Fig.1;
Balcells and Hernández-Pacheco, 1989; Ablay, 1997; Ablay et al., 1998; Ablay and
Martí, 2000; Carracedo and Rodríguez-Badiola, 2006; Carracedo et al., 2007; Martí et
al., 2008).
3.1. Pre-eruptive conditions of Roques Blancos magma from petrological observations
Several blocks of lava were collected at 2500 m asl from one of the main lava
flows of the 1714 BP Roques Blancos youngest dome (Fig.1). The freshest rock blocks
were selected as starting material for performing phase equilibrium experiments, whole-
rock, and electron microprobe analyses (EMPA) of the different phases (Table 1). The
bulk-rock composition, as determined by ICP-MS, is a typical phonolite (59.4 wt%
SiO2, 15.4 Na2O+K2O; Le Maitre et al., 1989; Table 1) representative of the Roques
Blancos flows (Balcells and Hernández-Pacheco, 1989; Ablay et al., 1998; Carracedo
and Rodríguez-Badiola, 2006).
Modal point counting of three thin sections (3000 points each) was combined
with mineral densities to obtain the weight percent (wt%) of the different phases. The
sample has 14 wt % phenocrysts, mainly anorthoclase (13.7 wt%; An4-3, Ab69-65, Or32-
27), minor amounts of biotite (0.3 wt%; Mg#62-63; Mg#=100[Mg/(Mg+Fe*)]),
magnetite (0.3 wt%; Mg# 5), diopside (0.1 wt%; Mg# 68-70; En39-41,Fs9-11,Wo50) and
ilmenite (0.1 wt%). Phenocrysts are set in a highly crystalline groundmass made of
microlites of alkali feldspar, magnetite, clinopyroxene, in addition to glass (Table 1,
Fig.2). Mass-balance calculations were used to obtain the composition of the residual
melt that was in equilibrium with phenocrysts by combining the whole-rock and mineral
phase compositions. As anticipated owing to the low phenocryst content, the resulting
melt is phonolitic (59.2 wt% SiO2, 17.0 wt% Na2O+K2O) with a composition similar to
that of the bulk-rock (Table 1).
Backscattered electron images (BSE) of the sample show that most anorthoclase
phenocrysts show prominent bright rims and dissolution surfaces, while clinopyroxene
displays oscillatory zoning and some dissolution surfaces, and some Fe-Ti oxides
present exsolution textures whereas others do not. In contrast, biotite appears to be
homogeneous on BSE. Elemental mapping of Ba and EMPA traverses of anorthoclase
reveal core to rim zonations (cores at An2.5-4 and BaO 0.1-0.2 wt%, toward more

7
calcium-and Ba-rich rims of An7-8 and up to 0.4 wt%, respectively; Fig.3). In detail,
many crystals show complex rims: (1) the outermost rims (e.g., last 10-20 m) have
extremely high Fe and Ti, high Ca, and very low Ba, possibly resulting from fast
growth, during which incompatible elements are incorporated at higher than equilibrium
concentrations, and compatible ones at lower than equilibrium concentrations (e.g.,
Albarède and Bottinga, 1972). (2) Inside this outer rim, crystals still have a high Fe, Ti,
Ca and Ba zones, compared to the core. There is a dissolution zone between the inner
part and the outer rims of the crystals. These observations suggests that there was a
change in the pre-eruptive conditions just prior to eruption, ie magma reheating upon a
recharge event, followed by a fast crystal growth stage.
Pre-eruptive temperatures and fO2 for the 1714 BP Roques Blancos phonolite
were determined by using six co-existing Fe-Ti oxides and the thermo-oxybarometric
model of Sauerzapf et al. (2008). Results yield temperatures of 895±5°C and a log fO2
of -12.2, equivalent to an oxygen fugacity of 0.2 log units below the Ni-NiO solid buffer
(NNO-0.2; Table 1). As there are currently no constraints on storage pressure or volatile
content of the Roques Blancos phonolite, the ranges of pressure and volatile content
covered in the experiments were guided by previous results obtained on similar
compositions of the same volcanic complex (Andújar et al., 2010; Andújar and Scaillet,
2012a).
4. Experimental work
We have performed phase-equilibrium experiments following a methodology
similar to that used for constraining the storage conditions of active volcanoes such as
Stromboli, Vesuvius, St. Pedro volcanoes (e.g., Di Carlo et al., 2006; Scaillet et al.,
2008; Costa et al., 2004) and taking in account the recommendations in the application
of phase equilibrium experiments to volcanic rocks as laid down by Pichavant et al.
(2007).
4.1. Preparation of the starting material
Pieces of the phonolitic lava were finely ground in an agate mortar and then
melted in a Pt crucible at 1400ºC during 5 hours in open-air atmosphere. The sample
was quenched in a water container at room temperature, glass chips recovered ground
again and re-melted. Chips of the resulting starting glass were analysed by the EMP and
compared to the bulk-rock composition, showing that it is homogeneous with no

8
significant Na or Fe loss compared to the starting rock (Table 1). The dry glass was then
ground for obtaining a powder that was used as starting material for hydrothermal
experiments and stored in an oven at 120ºC.
4.2. Experimental equipment and procedures
A total of 55 crystallization experiments were performed at the experimental
laboratory of ISTO (Orléans, France) in a vertically operating Internally Heated
Pressure Vessel (IHPV), using Ar as pressurising medium which was mixed with
different amounts of H2 at room temperature in order to achieve different fO2 (Scaillet et
al., 1992). A transducer calibrated against a Heise Bourdon gauge with an uncertainty of
±2 MPa was used for recording total pressure. Experiments were performed using
double-winding molybdenum and kanthal furnaces which produce near-isothermal
conditions (gradient <2-3ºC/cm) along a 3 cm long hot spot. S- or K-type
thermocouples with an accuracy of ±5ºC were used to record experimental temperature
and a rapid-quench technique was systematically used which allows isobaric quenches
at high cooling rates (>100ºC/s) (e.g., Martel et al., 1999; Di Carlo et al., 2006). In all
runs reported here, the drop quench was successful as indicated by the rise in total
pressure upon the falling of the sample holder into the cold (bottom) part of the vessel.
Experiments were mainly conducted at 850 ºC and 900 ºC, pressures of 200,
150, 100, and 50 MPa and at fO2 NNO+0.3 to NNO-2. The effect of temperature on
phase relationships and compositions was studied by conducting experiments at 800ºC,
200 and 100 MPa at NNO. One run was also performed at NNO-1 at 850 ºC and 100
MPa so as to study the effect of oxygen fugacity on phase equilibria at this temperature
(Table 2).
4.2.1. Capsule preparation
H2O-saturated and undersaturated charges were prepared using 1.5 cm long, 2.5 mm
inner diameter, 0.2 mm wall thickness Au capsules. Distilled H2O was first loaded, then
silver oxalate as the source of CO2 for H2O-undersaturated charges, and finally the glass
powder was introduced. Capsules were weighed and then welded using a graphite arc
welder. After welding, capsules were re-weighed and if no significant weight loss
occurred (difference < 0.0004 g), they were left in an oven for a few hours at 100ºC, to
ensure homogeneous H2O distribution. In all charges the H2O+CO2 mass and
fluid/silicate ratio were kept constant (3±0.5 mg of H2O+CO2, and 30 mg silicate). We

9
have explored various starting H2O/CO2 ratios at a given T-P conditions: XH2Oin,
defined as the H2O/(H2O+CO2) molar ratio, was varied in the range 1-0.48 (Table 2).
For each run, one capsule containing a Ni-Pd-O alloy sensor, prepared following the
procedure of Taylor et al. (1992), was added to monitor the fH2 during the experiment. A
typical run consisted of loading the vessel with six capsules (each with the same starting
material but different XH2Oin) and the Ni-Pd-O sensor capsule, all of them experiencing
the same T-P-fH2 conditions (Table 2).
Depending on pressure and temperature, the run duration varied between 7 and 18
days (Table 2). Runs were terminated by first using the drop quench device and then
switching off the power supply. After the experiment, capsules were checked for leaks,
opened, and half of the run product was mounted with epoxy resin and polished for
optical observation, and subsequent EMP and SEM analyses. The same procedure was
followed for the capsules containing the metallic sensors and the subsequent EMP
analysis of the metallic pellet allowed the determination of the fO2 of the system
(Pownceby and O’Neill, 1994; see below).
4.2.2. Water content, fH2, fO2 in the capsules
The use of different mixtures of H2O+CO2 in the capsules allowed us to explore
different water fugacities, hence, different melt H2O content in the experiments (Table
2). In experiments conducted at 900ºC and at H2O-saturated conditions, the size of glass
pools was large enough for determining the amount of dissolved water by Fourier
transform infra-red (FTIR) spectroscopy. The composition of the natural phonolite
resembles that used by Carroll and Blank (1997) for determining the solubility of water
in phonolitic melts. Thus, we have used the same analytical conditions and parameters
(e.g., extinction coefficients 5200 4500) to determine the water concentration in the
glass (Table 3). The small size of the glass pools in experiments run at 850-800ºC did
not allow for water determination using FTIR. In such cases, we have calculated the
water content of the experimental charges by using the H2O solubility model of Papale
et al. (2006).
Once the water content of the glass in H2O-saturated charges is known, the water
content of charges held at the same temperature and pressure but at XH2Oin<1, was
calculated by multiplying the water content determined at H2O-saturated conditions by
the initial mole fraction of water loaded in the capsule (XH2Oin, Table 2).
10
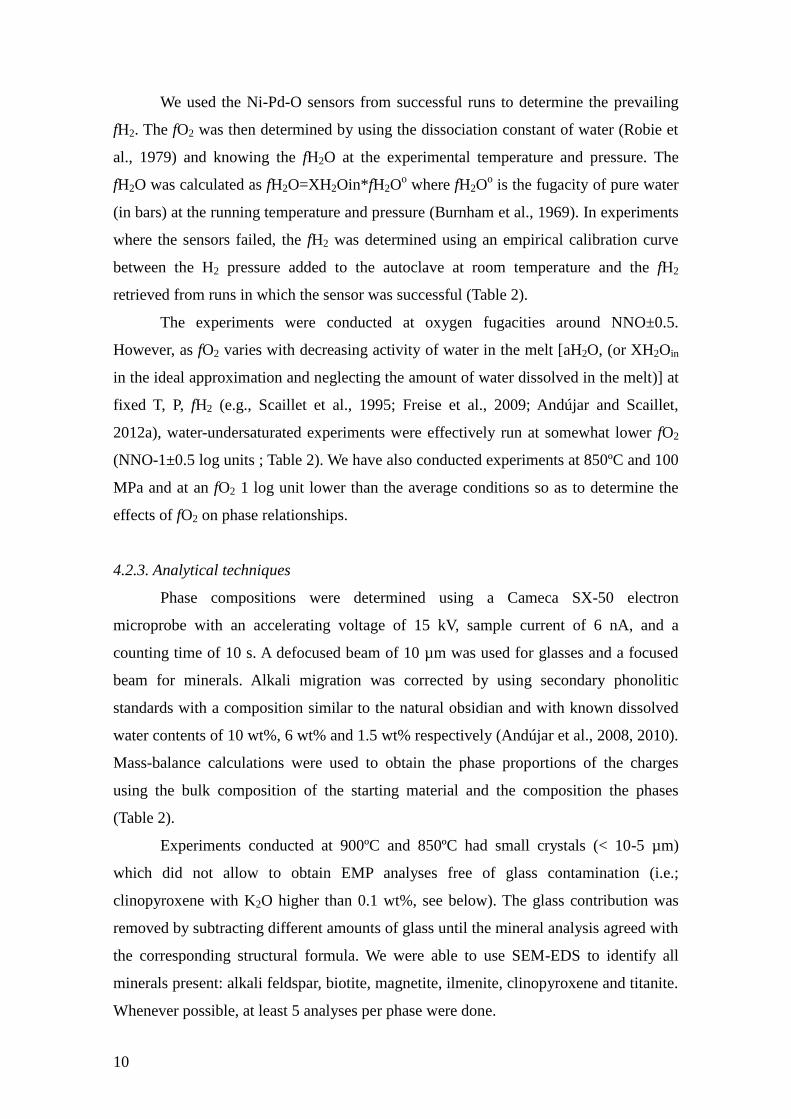
We used the Ni-Pd-O sensors from successful runs to determine the prevailing
fH2. The fO2 was then determined by using the dissociation constant of water (Robie et
al., 1979) and knowing the fH2O at the experimental temperature and pressure. The
fH2O was calculated as fH2O=XH2Oin*fH2Oo where fH2O
o is the fugacity of pure water
(in bars) at the running temperature and pressure (Burnham et al., 1969). In experiments
where the sensors failed, the fH2 was determined using an empirical calibration curve
between the H2 pressure added to the autoclave at room temperature and the fH2
retrieved from runs in which the sensor was successful (Table 2).
The experiments were conducted at oxygen fugacities around NNO±0.5.
However, as fO2 varies with decreasing activity of water in the melt [aH2O, (or XH2Oin
in the ideal approximation and neglecting the amount of water dissolved in the melt)] at
fixed T, P, fH2 (e.g., Scaillet et al., 1995; Freise et al., 2009; Andújar and Scaillet,
2012a), water-undersaturated experiments were effectively run at somewhat lower fO2
(NNO-1±0.5 log units ; Table 2). We have also conducted experiments at 850ºC and 100
MPa and at an fO2 1 log unit lower than the average conditions so as to determine the
effects of fO2 on phase relationships.
4.2.3. Analytical techniques
Phase compositions were determined using a Cameca SX-50 electron
microprobe with an accelerating voltage of 15 kV, sample current of 6 nA, and a
counting time of 10 s. A defocused beam of 10 µm was used for glasses and a focused
beam for minerals. Alkali migration was corrected by using secondary phonolitic
standards with a composition similar to the natural obsidian and with known dissolved
water contents of 10 wt%, 6 wt% and 1.5 wt% respectively (Andújar et al., 2008, 2010).
Mass-balance calculations were used to obtain the phase proportions of the charges
using the bulk composition of the starting material and the composition the phases
(Table 2).
Experiments conducted at 900ºC and 850ºC had small crystals (< 10-5 µm)
which did not allow to obtain EMP analyses free of glass contamination (i.e.;
clinopyroxene with K2O higher than 0.1 wt%, see below). The glass contribution was
removed by subtracting different amounts of glass until the mineral analysis agreed with
the corresponding structural formula. We were able to use SEM-EDS to identify all
minerals present: alkali feldspar, biotite, magnetite, ilmenite, clinopyroxene and titanite.
Whenever possible, at least 5 analyses per phase were done.

11
4.2.4. Attainment of equilibrium
The crystallization experiments show textural and compositional features similar
to those observed in crystallization experiments conducted on phonolitic compositions
(e.g., Freise et al., 2003; Scaillet et al., 2008; Andújar et al., 2008, 2010; Fig. 2b). These
features include: (1) a homogeneous distribution of the phases within the charges, (2)
euhedral crystals, (3) homogeneous phase compositions, including glass (Fig. 2), and
(4) the smooth variation of phase proportions and compositions with changes in
experimental conditions. The duration of our experiments (1 to 2 weeks) is within the
range of that applied in other studies, including for phonolitic systems (Berndt et al.,
2001; Freise et al., 2003; Harms et al., 2004; Scaillet et al., 2008), for which close to
equilibrium conditions were also proposed (see also Scaillet and Evans 1999; Costa et
al., 2004; Andújar et al., 2008, 2010, and Pichavant et al., 2007).
5. Experimental results
5.1. Phase relations
The main features of the phase relations are shown in a series of polybaric-
isothermal (Fig. 4a-c) or isobaric-polythermal (Fig. 4d) sections. At 900ºC the liquidus
phase is biotite at all investigated pressures and melt water content (H2Omelt). Biotite
crystallization is followed by the co-crystallization of magnetite plus ilmenite, then
alkali feldspar with decreasing H2Omelt. Clinopyroxene has a narrow stability field and
only appears at H2Omelt < 2.5 wt% at 900 ºC. At about 850ºC, magnetite and ilmenite
become the liquidus phases and biotite co-crystallization occurs at H2Omelt < 6 wt%
(Fig. 4). At 850 ºC the stabilities of alkali feldspar and clinopyroxene increase towards
higher H2Omelt (between 4 and 5 wt%). At 800 ºC major phase changes occur, with co-
crystallization of magnetite, clinopyroxene and biotite at liquidus conditions. Alkali
feldspar is less affected and still crystallizes for a H2Omelt of 5 wt%, similar to
conditions at 850ºC. At 800ºC, ilmenite disappears and is replaced by titanite. The
stability field of titanite is poorly constrained but the results show that under the T-fO2
conditions explored it only appears at >150 MPa (Figs. 4c and 4d).
Despite the small fO2 range that we have investigated we find significant changes
in phase stabilities with fO2. A decrease from NNO to NNO-0.5 at 850ºC and 100 MPa,
increases the clinopyroxene stability to slightly higher H2Omelt (from 4 wt% at NNO to

12
4.6 wt% at NNO-0.5) and moves the alkali feldspar field towards lower H2Omelt (Fig. 4,
Table 2).
5.2. Phase proportions
Calculated phase proportions show that, as expected, crystallinity increases with
decreasing temperature, decreasing H2Omelt and increasing pressure (Fig. 4, Table 2). At
900ºC the crystal content is < 5 wt% for H2Omelt between 6 and 3 wt%, at all studied
pressures. For H2Omelt of about 1 to 3 wt% the crystal content increases to > 30 wt%. At
850ºC and H2Omelt in the range 6.5 - 5 wt% the crystal contents are < 5 wt%, but
crystallinities increase to up to 30 wt% when H2Omelt decreases to about 1 wt%
(between 200 and 100 MPa). The abrupt and strong increase in crystallinity is enhanced
at 50 MPa, where small variations in H2Omelt (±0.5 wt%) increase the crystal content by
about 10 wt%. Charges run at 800ºC, 200 MPa, and close to water saturation conditions
have crystal contents of 5 wt%, increasing up to 25 wt% when H2Omelt decreases by
only 0.5 wt%. Moreover, at such temperature and for a given H2Omelt, a decrease in
pressure from 200 to 100 MPa increases the crystal content by about 15 wt%. The large
changes in crystallinities with varying H2Omelt are essentially controlled by the amounts
of alkali feldspar, whereas in charges with low crystal content (< 5 wt%) biotite,
magnetite and ilmenite are the main crystallizing phases (Fig. 4, Table 2).
5.3. Mineral compositions
5.3.1. Ilmenite and magnetite
Ilmenite and magnetite were identified by SEM-EDS but they were often too
small for reliable electron microprobe analysis to be performed. We nevertheless
analysed Fe-Ti oxides in 7 charges, whose compositions have been corrected out from
the glass contribution (less than 3 % of contamination) and the results are shown in
Table 4. Magnetite FeO* and TiO2 contents range between 77-79 wt%, and 17-14 wt%,
respectively, with an Mg# of 3-4. Ilmenite crystallizing at 850ºC and at H2Omelt 4-5 wt%
has TiO2 contents in the range 49-51 wt%, while its FeO* varies from 45 to 42 wt%,
depending on H2Omelt (Table 4).
5.3.2. Biotite
13
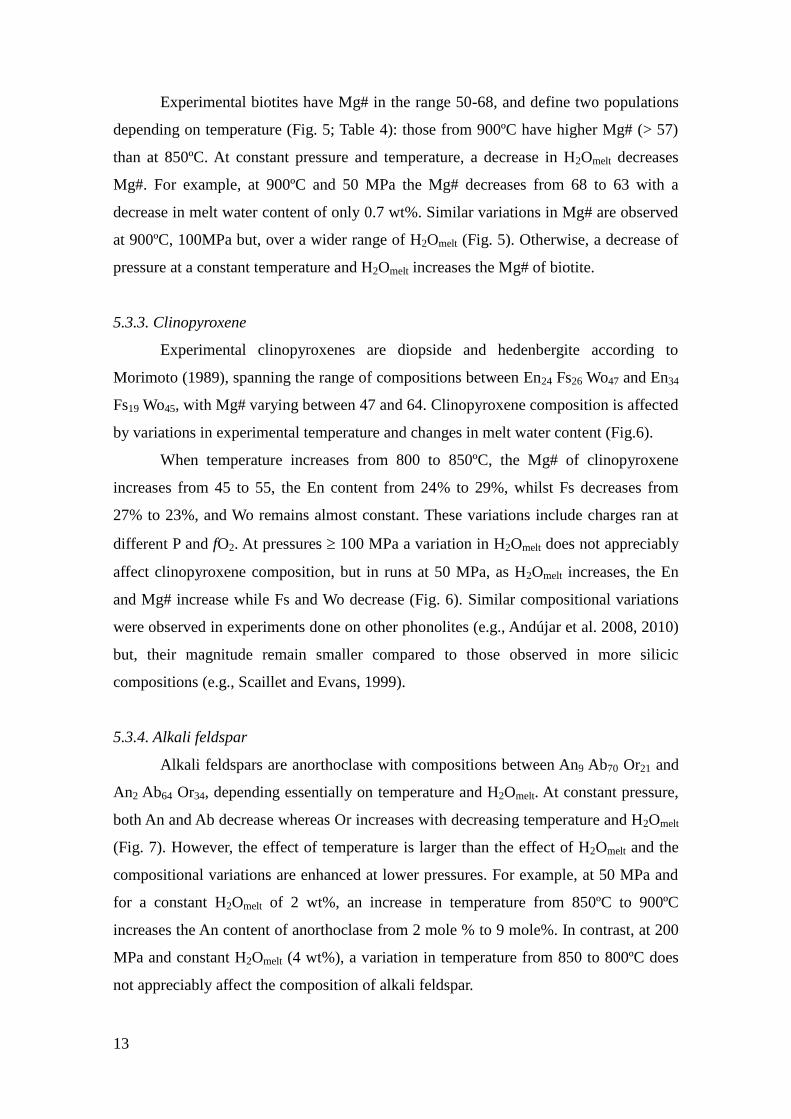
Experimental biotites have Mg# in the range 50-68, and define two populations
depending on temperature (Fig. 5; Table 4): those from 900ºC have higher Mg# (> 57)
than at 850ºC. At constant pressure and temperature, a decrease in H2Omelt decreases
Mg#. For example, at 900ºC and 50 MPa the Mg# decreases from 68 to 63 with a
decrease in melt water content of only 0.7 wt%. Similar variations in Mg# are observed
at 900ºC, 100MPa but, over a wider range of H2Omelt (Fig. 5). Otherwise, a decrease of
pressure at a constant temperature and H2Omelt increases the Mg# of biotite.
5.3.3. Clinopyroxene
Experimental clinopyroxenes are diopside and hedenbergite according to
Morimoto (1989), spanning the range of compositions between En24 Fs26 Wo47 and En34
Fs19 Wo45, with Mg# varying between 47 and 64. Clinopyroxene composition is affected
by variations in experimental temperature and changes in melt water content (Fig.6).
When temperature increases from 800 to 850ºC, the Mg# of clinopyroxene
increases from 45 to 55, the En content from 24% to 29%, whilst Fs decreases from
27% to 23%, and Wo remains almost constant. These variations include charges ran at
different P and fO2. At pressures 100 MPa a variation in H2Omelt does not appreciably
affect clinopyroxene composition, but in runs at 50 MPa, as H2Omelt increases, the En
and Mg# increase while Fs and Wo decrease (Fig. 6). Similar compositional variations
were observed in experiments done on other phonolites (e.g., Andújar et al. 2008, 2010)
but, their magnitude remain smaller compared to those observed in more silicic
compositions (e.g., Scaillet and Evans, 1999).
5.3.4. Alkali feldspar
Alkali feldspars are anorthoclase with compositions between An9 Ab70 Or21 and
An2 Ab64 Or34, depending essentially on temperature and H2Omelt. At constant pressure,
both An and Ab decrease whereas Or increases with decreasing temperature and H2Omelt
(Fig. 7). However, the effect of temperature is larger than the effect of H2Omelt and the
compositional variations are enhanced at lower pressures. For example, at 50 MPa and
for a constant H2Omelt of 2 wt%, an increase in temperature from 850ºC to 900ºC
increases the An content of anorthoclase from 2 mole % to 9 mole%. In contrast, at 200
MPa and constant H2Omelt (4 wt%), a variation in temperature from 850 to 800ºC does
not appreciably affect the composition of alkali feldspar.

14
5.4. Glass
Residual glass compositions are reported in Table 5. The Na2O+K2O is between
15 and 18 wt%, and SiO2 contents range between 61.7 and 58.3 wt% (reported
compositions were re-calculated to 100% anhydrous; Table 5; Fig. 8). According to Le
Maitre et al. (1989), all experimental glasses are phonolitic and mildly per-alkaline
(molar Na+K/Al between 1.1 and 1.3). The glass composition varies according to
changes in intensive parameters and thus with phase proportions. For a given pressure
and temperature, SiO2 displays a complex trend of increase and then decrease with
decreasing H2Omelt (Fig 8a). For a constant temperature, the highest SiO2 enrichment is
displaced towards higher H2Omelt with increasing pressure, though the effect is more
pronounced at < 900ºC (Fig. 8). The SiO2 variation is controlled by the onset of alkali
feldspar crystallization, although the maximum SiO2 enrichment depends also on the
relative abundances of oxides and biotite (Table 2). Glasses from charges at 200 MPa
and 900ºC with biotite present have slightly lower SiO2 (60.5 wt%) than at 850ºC (61.5
wt%), where magnetite-ilmenite prevail over biotite (Figs.4 and 8). At a given H2Omelt,
the SiO2 content increases by about 0.5-1 wt% with an increase of 50ºC and of 50 MPa.
A decrease in temperature of 50ºC at a given pressure and H2Omelt, leads to a
decrease of TiO2, MgO and CaO contents by about 50% relative, whereas both Na2O
and K2O slightly increase. A decrease in pressure leads to an increase in MgO and a
decrease in CaO contents. However, at 50 MPa, compositional changes with intensive
variables are different from those observed at higher pressures. Residual glasses at
900ºC have higher MgO contents than at 850ºC. Moreover, a decrease in H2Omelt
increases the MgO content of the glass. Such compositional variations have been also
documented in other experiments performed on similar compositions at low pressure
(e.g., Andújar and Scaillet, 2012a). The effect of fO2 on glass compositions is small,
reflecting the limited range of fO2 investigated. However, experiments conducted at
more reducing conditions (NNO-2) yield glasses with lower TiO2, MgO and CaO and
higher SiO2, Al2O3 and K2O contents than those synthesised at NNO.
6. Discussion
6.1. Natural versus experimental data: constraints on the pre-eruptive conditions of
Roques Blancos

15
The comparison between the mineral assemblage of the natural phonolite (14 wt
% of phenocrysts, mainly alkali feldspar, but also clinopyroxene, biotite and Fe-Ti
oxides) and those from experiments provides first-order constraints on the magma pre-
eruptive conditions. At temperatures between 850 and 900ºC the crystal content and
phase assemblage of the natural phonolite have been reproduced at pressures between
75 and 25 MPa, and H2Omelt 2.0-4.0 wt% (Fig. 4). Lower temperatures (e.g. 800 ºC) can
be ruled out because of the much higher crystal content and absence of ilmenite in the
explored ranges of H2Omelt and pressures. Pressures higher than about 75 MPa can also
be ruled out because clinopyroxene only occurs at crystal contents higher than in the
natural phonolite. We have not performed experiments at < 50 MPa, but extrapolation of
the crystallinity and phase equilibrium relationships obtained at 50 MPa also suggests
much higher crystallinities at pressures significantly lower than 50 MPa. To refine and
test the robustness of such constraints we use below the compositions of mineral and
glass.
Natural magnetite has a Mg# of 5 whereas our two experimental magnetites
from experiments conducted at 850ºC, 100 and 50 MPa, and H2Omelt of about 3 wt%
have Mg# of 3 to 4. Magnetite composition varies with temperature and fO2 (e.g,
Andújar et al. 2008, 2010) and thus, the slightly higher Mg# of the natural magnetite
suggests higher temperatures (e.g., > 850ºC) or/and more oxidizing conditions (e.g., fO2
> NNO). We have reproduced the TiO2 content of the natural ilmenite at 850ºC, 200
MPa and H2Omelt of 5.5 wt%, although these conditions are different from those inferred
above.
Experimental biotites crystallizing between 50 and 200 MPa at 900ºC, and
H2Omelt between 1.5-4.5 wt% encompass the Mg# of natural biotites (Mg# 63, Fig. 5).
However, at this temperature only experiments performed at 50 MPa and H2Omelt < 2.5
wt% reproduce the phase assemblage and crystal content of the natural phonolite. At
850ºC the experimental biotites have lower Mg# than those from the phonolite.
We have successfully reproduced the rim and core compositions of the natural
alkali feldspars. Their Ca-rich rims (An7-8) are reproduced at 900ºC, 50 MPa and H2Omelt
2 wt% while cores (the bulk of crystals, see Fig 3), which range from An2.5 to An4, are
reproduced at 850ºC, 50 MPa and H2Omelt between 2-3 wt% (Fig. 7). These results
support our pressure estimate of 50 MPa for the storage conditions prior to eruption but
indicate also that crystallization of natural feldspars occurred at two different
conditions: the Ca-poor cores crystallized at 850ºC, whilst the Ca-rich rim crystallized

16
at 900ºC. Such a temperature difference suggests a change in the storage temperature of
the reservoir just prior to eruption which, as we show below, is also consistent with
biotite and Fe-Ti oxide reequilibration.
We have not obtained EMP analyses of clinopyroxene in charges produced at
900ºC due to the small size of crystals; however, the compositional trends displayed by
the experimental clinopyroxenes support this temperature for natural clinopyroxene
crystallization. At 850ºC, 50 MPa and H2Omelt of 2 wt%, both the Mg# and En content
of natural clinopyroxene are closely reproduced yet, Fs and Wo are slightly different.
However, an increase of temperature of 50ºC will produce a 5% moles increase in the
En content and Mg# of clinopyroxenes but also, a 5% moles decrease in the Fs content,
producing a clinopyroxene similar to the natural one (Fig.6; see previous section).
The comparison between natural and experimental phase relationships and
mineral compositions therefore suggests pre-eruptive conditions for the Roques Blancos
phonolite to be 850-900ºC, 50 MPa, and melt water contents between 2 to 2.5 wt%
(Ptotal< PH2O). At such conditions the SiO2, CaO, Na2O, MgO, TiO2 and K2O contents
of the residual melt are closely reproduced (Table 1; Fig. 8). Only FeO* and Al2O3
contents are different (but almost within error if analytical uncertainties are considered)
than those from experiments conducted at 850-900ºC and 50 MPa (Fig. 8).
We do not have enough experimental data from different fO2 (i.e., biotite, Fe-Ti
oxides) to make a precise determination of the pre-eruptive oxygen fugacity. However,
the fact that we have successfully reproduced the phase assemblage, crystal content and
phase compositions of the natural phonolite at an fO2NNO suggests that such an fO2
broadly prevailed in the reservoir. Moreover, the Mg# of the natural biotite (which is
highly sensitive to fO2) is reproduced at an fO2NNO-1; hence a pre-eruptive fO2
between NNO and NNO-1 appears to be a good redox estimate for the natural
phonolite, in accord with constraints obtained from natural magnetite-ilmenite pairs
(Table 1) and with those obtained previously for other phonolites from Tenerife (Ablay
et al., 1998; Andújar et al., 2008, 2010; Andújar and Scaillet, 2012a). On the basis of the
foregoing discussion we conclude that prior to eruption the Roques Blancos phonolite
was stored at 50±15 MPa, 875oC ± 25
oC , with H2Omelt 2-2.5 wt%, at an fO2 of NNO-
0.5 (±0.5). Although the pre-eruptive H2Omelt is rather low, the low pressure of magma
storage implies that any coexisting fluid phase in the reservoir will be dominated by
H2O (ie XH2O>0.5). Evidence for dissolved pre-eruptive CO2 is generally lacking in
phonolite magmas (e.g., Andujar and Scaillet, 2012a,b), including at Tenerife, which

17
shows that, if present, CO2 must reside primarily in the vapor phase, albeit in moderate
amounts to be compatible with our inferred H2Omelt.
6.2. Evidence for late magma reheating upon mixing before eruption
Many Roques Blancos alkali feldspars are characterised by a reverse
compositional zoning with An-rich rims and Or-poor cores (Fig. 3). We have
successfully reproduced such An-rich compositions at 900ºC, 50 MPa, 2 wt% H2Omelt
whereas cores are reproduced at the same pressure and H2Omelt but at a lower T, 850°C
(Figs. 4 and 7). Reverse zoning in feldspars are generally interpreted as arising from
crystallisation of a more Ca-rich melt, often related to mixing with a more mafic magma
(e.g., Couch et al. 2001, Martel et al, 2006). Alternatively, experimental works have
shown that such Ca-rich rims can be also produced by increasing temperature without
interaction with a mafic body (e.g., Rutherford et al., 1985; Couch et al., 2001), by
increasing pressure at water-saturated conditions (Rutherford and Devine 2008), or by
an increase in water activity via the preferential loss of a CO2 (Holloway, 1976). To
discriminate between the different possibilities, it is useful to compare changes in An
content with changes in other minor elements as shown by Triebold et al. (2006) and
Ruprecht and Wörner (2007). These authors suggest that a process of magma mixing
can be identified in feldspars when the An enrichment is accompanied by an increase in
Fe content whereas when Fe remains constant, only an increase in temperature can
explain the Ca-rich compositions. The compositional traverses show that the increase in
the An content towards the rims of the crystals is indeed coupled with an increase in the
FeO*, TiO2 and BaO which suggests that such Ca-rich rims record the income of a more
mafic and higher temperature melt, as proposed by Triebold et al. (2006) and Ruprecht
and Wörner (2007). This hypothesis is also supported by our experimental results: the
observed CaO-FeO*-TiO2 enrichment of the alkali feldspar rims cannot be explained
only by a single shift in temperature or water activity because in each case, the stability
field, phase proportions and composition of phases like biotite, magnetite, or
clinopyroxene will be also modified. In detail, at 900ºC for reproducing the low Ca-
cores of feldspars, crystal contents > 30 wt% and H2Omelt <1.7 wt% are required (fig. 4).
Then, to generate the An7-8 rims, H2Omelt should increase to 2.5 wt% and the crystal
content should be reduced by ~50% to achieve the 14 wt% phenocryst of the phonolite
(Fig. 4). The presence of resorbed textures in feldspars cores and clinopyroxenes (Fig.
3) is compatible with such an hypothesis; however, although the rise in temperature or

18
H2Omelt will increase the Ca content of the coexisting melt, producing a shift in the An
content, it will keep FeO* and TiO2 concentrations constant, a trend unlike the rimward
enrichment in these elements observed in natural feldspars (Fig. 8). The above lines of
evidence thus suggest that the most likely mechanism for explaining the compositional
zonation of alkali feldspars is mixing with a hotter and more mafic magma. In such a
scenario, the observation that only biotite and Fe-Ti oxides compositions record the
conditions following the intrusion of the more mafic and hotter melt can be explained
by their much faster kinetics of intracrystalline diffusion compared to other minerals
(e.g., Cherniak and Dimanov, 2010; Van Orman and Crispin, 2010). Although we do not
have detailed compositional zoning in clinopyroxene to further check this hypothesis,
the BSE images show multiple growth zones with dissolution surfaces, which is
consistent with an open-system evolution with abrupt changes in temperature and
composition.
Magma mixing and mingling are common processes occurring at Tenerife, as
recorded by the existence of mingled-mixed products or by reversely zoned phenocrysts
(Araña et al., 1994; Ablay et al., 1998; Neumann et al., 1999, Triebold et al, 2006), as
discussed above. The steep increase in Ba recorded in the alkali feldspars (Fig. 3)
provides insights into the composition of the mafic end-member. According to Ablay et
al. (1998), among the mafic magmas erupted in the last 30 kyr, tephriphonolites are the
most Ba-enriched, in particular those erupted from Pico Viejo vent, which can contain
up to 1400 ppm of Ba. Estimated pre-eruptive temperatures of such tephriphonolites are
in the range 1020-1040°C (Ablay et al., 1998; Neumann et al., 1999), hence they are hot
enough to increase temperature, at least locally, yielding Ca-rich overgrowth on alkali
feldspars of the Roques Blancos phonolite when entering in the reservoir, although in
detail the thermal effects will depend on the relative masses of juxtaposed magmas.
According to these observations, the following sequence of events for the late
magmatic evolution of the Roques Blancos magma reservoir prior to the eruption can be
proposed. The phonolite was ponding at depths between 1-2 km and at temperatures
around 850°C, where the bulk of crystallization of the alkali feldspars occurred yielding
the Ca and Ba poor cores. Intrusion of a hotter tephriphonolitic melt into the more
evolved magma increased the temperature of the resident phonolite and enriched the
residual melt in Ca, Ti, Fe and Ba from which the outer rims of feldspar crystallized,
while biotite and Fe-Ti oxides quickly re-equilibrated. The arrival of this hotter and

19
more mafic intrusion might have triggered the eruption some time later (e.g., Folch and
Martí, 1998).
6.3. Central versus flank eruptions in Tenerife and their relation to different eruptive
styles
The volcanic activity of the last 30 kyr of the Teide-Pico Viejo complex is
characterised by the eruption of intermediate to phonolitic magmas which
volumetrically predominated over the basaltic ones (Ablay et al., 1998; Carracedo et al.,
2007, Martí et al., 2008). The phonolitic eruptions alternate between central Pico Teide
and Pico Viejo vents and several flank domes located around the stratovolcanoes, with
these last dominating the evolution of the actual volcanic system in terms of number of
events (Ablay and Martí, 2000; Carracedo and Rodríguez-Badiola, 2006; Rodríguez-
Badiola et al., 2006; Carracedo et al., 2007). Flank dome eruptions share several
physical, petrographic, geochemical, and volcanological features. Phonolitic domes are
located at heights between 2000 and 3000 m a.s.l. over the steep flanks of the Teide-
Pico Viejo stratovolcanoes: generally they are volumetrically smaller than eruptions
occurring from the central vents (Ablay, 1997; Martí et al., 2008; Carracedo et al., 2007;
Martí et al., 2012) and are characterised by the emission of thick phonolitic lava flows.
They typically have also an explosive phase that produces significant fall-out deposits,
as documented for the eruptions of Montaña Blanca and El Boquerón (Ablay et al.
1995; Andújar and Scaillet, 2012a; García et al., 2012)
Previous estimates of the storage conditions of flank dome eruptions in Tenerife
were done using thermo-barometric models (Ablay, 1997; Ablay et al., 1995; Ablay et
al., 1998). Coexisting Fe-Ti oxides of Arenas Blancas, Montaña Las Lajas, and Montaña
Blanca flank eruptions yield temperatures in the range 775-900°C (Ablay, 1997; Ablay
et al., 1995; Ablay et al., 1998). These authors also measured water contents of melt
inclusions trapped in clinopyroxenes from Montaña Majua and Montaña Blanca flank
dome eruptions, reporting values of 1.2 - 2.5 wt%, and 3 - 4.5 wt%, respectively. Using
the volatile content and the water solubility model of Carroll and Blank (1997), Ablay et
al. (1995) inferred a storage pressure of 100 MPa for the Montaña Blanca eruption. New
experimental results by Andújar and Scaillet (2012a) using the products of the sub-
plinian phase of the Montaña Blanca eruption suggest instead that this magma was
stored at 850±15°C, 50±15 MPa, 2.5±0.5 wt% H2Omelt. This phase of the eruption
involved the emission of a crystal-poor phonolitic magma (1 to 4 wt% of phenocrysts)

20
with a composition similar to that of Roques Blancos. We have calculated the magma
viscosities of these two phonolites (models of Giordano et al., 2008, and Scaillet et al.
1998; Andújar and Scaillet, 2012b) and have found about the same values (104.1
Pa*s).
This and their similar storage conditions, which are close to water-saturation according
to available H2O-solubility models in phonolitic melts (Carroll and Blank, 1997;
Schmidt and Behrens, 2008), indicate that both magmas would respond similarly upon
decompression. The explosive nature of the Montaña Blanca eruption suggests that it is
likely that the beginning of the Roques Blancos eruption had a short-lived highly
explosive initial phase, which is in agreement with the recent identification of fall-out
deposits associated with this eruption (O. García unpublished data).
The physical and petrological features shared between the most recent satellite
phonolitic eruptions of Teide-Pico Viejo (Fig. 1) and that of Montaña Blanca, El
Boquerón and Roques Blancos, all point towards a shallow origin for these flank
eruptions, which appear to have been fed by reservoirs located at depths of 1-2 km
below the surface. These shallow values contrast with those experimentally determined
for central eruptions occurring from Teide proper, which were constrained to be about 5
km below the actual summit of Pico Teide volcano (Andújar et al., 2010). In figure 9 we
have projected the depths for the Roques Blancos, Montaña Blanca and central Teide
phonolitic magmas. It shows that phonolitic magmas can be stored at various depths in
Tenerife, up to very close to the surface (~1-2 km below the surface), suggesting that the
phonolite storage region of Teide is not characterised by one single and large reservoir,
but instead by various isolated, possibly transient, magma pockets that can coexist
simultaneously, re-enforcing and supporting previous observations obtained from
petrological data and modelling efforts (Ablay et al., 1998; Andújar and Scaillet, 2012a;
Martí and Geyer, 2009). The characteristics of the actual plumbing system beneath
Teide-Pico Viejo where several phonolitic shallow reservoirs can co-exist , as well as
the difference in storage depths, can thus explain the multiple shifts between central and
lateral eruptions documented to occur at this stratovolcano (Martí and Geyer, 2009).
7. Conclusions
Crystallization experiments on a phonolitic product of the Roques Blancos
eruption, a representative flank eruption of the large Teide stratovolcano, show that it
was stored at shallow depths (about 50 MPa or 1-2 km) below the edifice with about 2.5
wt % water dissolved in the melt. The main petrological features (crystal content, phase

21
assemblage, phase compositions) of the natural phonolite are reproduced at 900°C,
though the composition of Ca-poor cores of alkali feldspar record lower temperatures of
about 850°C. The zoning pattern of natural alkali feldspars show that they have high Ba,
Ti, and Fe rims which, we suggest, record a late and transient reheating following
mixing of the resident magma with a more mafic melt. Such shallow and water-rich
storage conditions were also determined for another flank and Plinian eruption of Teide
and contrast with the deeper reservoir inferred for predominantly effusive eruptions of
magmas emitted from the central Teide cone. Such differences in storage depths and
locations illustrate the complexity of the magma plumbing system that may currently
exist below Teide, which does not appear to be fed from a single large reservoir. Instead,
the evidence call for multiple isolated small magma reservoirs, whose level of assembly
in upper crust is in part controlled by the feedback existing between the evolution and
growth of the aerial cone built/destroyed during eruptions and the local stress field at
depth.
The results from the current work should help improve hazard assessment at
Tenerife, along with the forecasting the future behaviour of phonolitic magmas stored
below Teide-Pico Viejo volcanic system. In particular, the new constraints we provide
about both pre-eruptive H2Omelt of phonolites and their storage depths may help in
providing a first estimate of the explosive/effusive potential of these magmas by using
the location of tremors during an on-going eruption at central parts of the island.
Nevertheless, we stress that the explosive vs non-explosive character of alkali-rich
magmas can be easily changed by additional factors (ie, influx of other volatile species
like CO2, degassing, interaction with meteoric water, mixing with mafic compositions
within the conduit); and will be always subordinated to the composition of the
ascending magma, which is so far virtually impossible to know with the available
monitoring tools.
Acknowledgements
J.A. thanks M. Pompilio and A. Burgisser for their scientific discussions that improved
previous versions of the manuscript. L. Ramon, O. Rouer and I. Di Carlo are thanked
for their technical support. Comments from J.M. Castro greatly helped to improve the
manuscript. This work was funded by “Beatriu de Pinós” fellowship BPA-00072 and a
fellowship grant from the University of Orléans. Joan Martí is thanked by providing the

22
logistical support during rock sampling at Tenerife, as well as for the comments and
editorial handling of the paper.
References
Ablay, G. J., Ernst, G. G. J., Martí, J., Sparks, R.S.J, 1995. The 2ka subplinian eruption
of Montaña Blanca, Tenerife. Bull. Volcanol. 57, 337-355.
Ablay, G. J., 1997. Evolution of the Teide-Pico Viejo volcanic complex and magmatic
system (Tenerife, Canary Islands). Department of Geology. Bristol, University of
Bristol. 336 pp.
Ablay, G. J., Carroll, M.R., Palmer, M.R., Martí, J., Sparks, R.S.J., 1998. Basanite-
Phonolite Lineages of the Teide-Pico Viejo Volcanic Complex, Tenerife, Canary
Islands. J. Petrol. 39, 905-936.
Ablay, G. J., Martí, J., 2000. Stratigraphy, structure, and volcanic evolution of the Pico
Teide-Pico Viejo formation, Tenerife, Canary Islands. J. Volcanol. Geotherm. Res.
103, 175-208.
Andújar, J., Costa, F., Martí, J., Wolff, J.A., Caroll, M.R., 2008. Experimental
constraints on pre-eruptive conditions of phonolitic magma from the caldera-forming
El Abrigo eruption, Tenerife (Canary islands). Chem. Geol. 257, 173-191
Andújar, J., Costa, F., Martí, J., 2010. Magma storage conditions of the last eruption of
Teide volcano (Canary Islands, Spain). Bull. Volcanol. 72, 381-395.
Andújar, J., Scaillet, B., 2012a. Experimental constraints on parameters controlling the
difference in the eruptive dynamic of phonolitic magmas: the case from Tenerife
(Canary Islands). J. Petrol. http://dx.doi.org/10.1093/petrology/EGS033
Andújar, J., Scaillet, B., 2012b. Relationships between pre-eruptive conditions and
eruptive styles of phonolite–trachyte magmas. Lithos 152, 122-131.
Araña, V., 1971. Litología y estructura del Edificio Cañadas, Tenerife (Islas Canarias).
Estudios Geologicos 27, 95-135.
Araña, V., Martí, J., Aparicio, A., García-Cacho, L., Carcía-García, R., 1994. Magma
mixing in alkaline magmas: An example from Tenerife, Canary Islands, Lithos 32, 1–
19.

23
Balcells, R., Hernández-Pacheco, A., 1989. El domo-colada de Roques Blancos. In:
Araña, V. and Coello, J. (eds) Los volcanes y la caldera del Parque Nacional del
Teide (Tenerife, Islas Canarias). Madrid: ICONA, pp. 235-253.
Berndt, J., Holtz, F., Koepke, J., 2001. Experimental constraints on storage conditions in
the chemically zoned phonolitic magma chamber of the Laacher See volcano.
Contrib. Mineral. Petrol. 140,469-486.
Bonaccorso, A., Calvari, S., Coltelli, M., Del Negro, C., and Falsaperla, S. (Eds.), 2004.
Mt. Etna: Volcano Laboratory, Geophysical Monograph series vol. 143, 369 PP.,
ISSN: 0065-8448; ISBN: 0-87590-408-4.
Burnham, C. W., Holloway, J. R., Davis, N. F., 1969. Thermo-dynamic properties of
water to 1000°C and 10 000 bar. Geol. Soc. Amer. Spec. Pap. 132, 1–96.
Carracedo, J. C., Rodríguez-Badiola, E., 2006. Los domos y domos-colada del complejo
volcanico del Teide. In: Carracedo, J. C. (ed.) Los volcanes del parque nacional del
Teide. Madrid: serie técnica Organización de Parques Nacionales, Ministerio de
Medio Ambiente, pp. 213-238.
Carracedo, J.C., Rodríguez-Badiola, E., Guillou, H., Paterne, M., Scaillet, S., Pérez-
Torrado, F. J., Paris, R., Fra-Paelo, U., Hansen, A., 2007. Eruptive and structural
history of Teide volcano and rift zones of Tenerife, Canary Islands. Geol. Soc. Am.
Bull. 119, 1027-1051.
Carroll, M. R., Blank, J.G., 1997. The solubility of H2O in phonolitic melts. Am.
Mineral. 82, 549-556.
Cherniak, D. J., Dimanov, A., 2010. Diffusion in Pyroxene, Mica and Amphibole Rev.
Mineral. Geochem. 72, 641-690.
Corsaro, R.A., Miraglia, L., Pompilio, M., 2007. Petrologic evidence of a complex
plumbing system feeding the July-August 2001 eruption of Mt. Etna, Sicily, Italy.
Bulletin of Volcanology 69, 401-421.
Costa, F., Scaillet, B., Pichavant, M., 2004. Petrological and experimental constraints on
the Pre-eruption conditions of Holocene dacite from Volcán San Pedro (36ºS,
Chilean Andes) and the im portance of sulphur in silicic subduction-related magmas.
J. Petrol. 45, 855-881.
Couch, S., Sparks, R.S.J., Carroll, M.R., 2001. Mineral disequilibrium in lavas
explained by convective self-mixing in open magma chamber. Nature 441,1037-
1039.

24
Deer, W.A.; Howie, R.A., Zussman, J., 1972. Rock forming minerals: Framework
silicates 4, 435 pp.
Di Carlo, I., Pichavant, M., Rotolo, S.G., Scaillet, B., 2006. Experimental crystallization
of a High-K arc basalt: the golden pumice, Stromboli volcano (Italy). J. Petrol. 47,
1317-1343.
Freise, M., Holtz, F., Nowak, M., Scoates J.S., Strauss, H., 2009. Differentiation and
crystallization conditions of basalts from the Kerguelen large igneous province: an
experimental study . Contrib. Mineral. Petrol. 158, 505–527.
Freise, M., Holtz, F., Koepke, J., Scoates, J., Leyrit, H., 2003. Experimental constraints
on the storage conditions of phonolites from kerguelen Archipielago. Contrib.
Mineral. Petrol. 145, 659-672.
Folch, A., Martí, J., 1999. The generation of overpressure in felsic magma chambers by
replenishment. Earth Planet. Sci. Lett. 163, 301-314.
García, O., Bonadonna, C., Martí, J., Pioli, L., 2012. The 5,660 yr BP boquerón
explosive eruption, Teide-Pico Viejo complex, Tenerife. Bull. Volcanol. DOI.
10.1007/s00445-012-0646-5
Harms, E., Gardner., J.E., Schmincke, H.U., 2004. Phase equilibria of the lower Laacher
See Tephra (East Eifel, Germany): constrainsts on pre-eruptive storage conditions of
a phonolitic magma reservoir. J. Volcanol. Geotherm. Res. 134, 135-148.
Holloway, J.R., 1976. Fluids in the evolution of granitic magmas: consequences of finite
CO2 solubility. Geol. Soc. Am. Bull. 87, 1513-1518.
Kahl, M., Chakraborty, S., Costa, F, Pompilio, M., 2011. Dynamic plumbing system
beneath volcanoes revealed by kinetic modeling, and the connection to monitoring
data: An example from Mt. Etna. Earth. Planet. Sci. Lett. 308, 11-22.
Le Maitre, R.W., Bateman, P., Dudek, A., Keller, J., La Meyre Le Bas, M.J., Sabine,
P.A., Schmid, R., Sorensen, H., Streckeisen, A., Wooley, A.R., Zanettin, B., 1989. A
classification of igneous rocks and glossary of terms. Blackwell Scientific
Publications, 193 pp. Oxford.
Martel, C., Pichavant, M., Holtz, F., Scaillet, B., 1999. Effects of fO2 and H2O on
andesite phase relations between 2 and 4 kbar. J. Geophys. Res. 104, 29,453-29,470.
Martel, C., Ali, A.R., Poussineau, S., Gourgaud, A., Pichavant, M., 2006. Basalt-
inherited microlites in silicic magmas: Evidence from Mount Pelée (Martinique,
French West Indies). Geology 34, 905-908.

25
Martí J., Mitjavila J., Araña, V., 1994. Stratigraphy, structure and geochronology of the
Las Cañadas caldera (Tenerife, Canary Island). Geol. Mag. 131,715-727.
Martí, J., Gudmundsson, A., 2000. The Las Cañadas caldera (Tenerife, Canary Islands):
an overlapping collapse caldera generated by magma-chamber migration. J.
Volcanol. Geotherm. Res. 103, 161-173.
Martí, J., Geyer, A., Andújar, J., Teixidó, F., Costa, F., 2008. Assessing the potential for
future explosive activity from Teide-Pico Viejo. J. Volcanol. Geotherm. Res. 178,
529-542.
Martí, J., Geyer, A., 2009. Central vs flank eruptions at Teide–Pico Viejo twin
stratovolcanoes (Tenerife, Canary Islands). J. Volcanol. Geotherm. Res. 181, 47-60.
Martí, J., Sobradelo, S., Felpeto, A., García, O., 2012. Eruptive scenarios of phonolitic
volcanism at Teide-Pico Viejo volcanic complex (Tenerife, Canary Islands). Bull.
Volcanol. 74, 767-782.
Morimoto, N., 1989. Nomenclature of pyroxenes. Subcomitee on pyroxenes.
Commission on new minerals and mineral names. Can. Mineral. 27, 143-156.
Neumann, E.-R., Wulff-Pedersen, E., Simonsen, S.L., Pearson, N.J., Martí, J., Mitjavila,
J., 1999. Evidence for fractional crystallization of periodically refilled magma
chambers in Tenerife, Canary Islands. J. Petrol. 40, 1089-1123.
Papale P, Moretti R, Barbato, D., 2006 The compositional dependence of the saturation
surface of H2O + CO2 fluids in silicate melts. Chem. Geol. 229, 78-95.
Pichavant, M., Costa, F., Burgisser, A., Scaillet, B., Martel, C , Poussineau, S., 2007.
Equilibration scales in silicic to intermediate magmas - Implications for phase
equilibrium studies. J. Petrol. 48, 1955-1972
Pownceby, M.I., O’Neill, H. St.C., 1994. Thermodynamic data redox reactions at high
temperatures.III. Activity-composition relations in Ni-Pd alloys from EMF
measurements at 850-1250 K and calibration of the NiO+Ni-Pd assemblage a redox
sensor. Contrib. Mineral. Petrol. 116, 327-339.
Robie, R.A., Hemingway, B.S., Fisher, J.R., 1979. Thermodynamic properties of
minerals and related substances at 298.15 K and 1 bar (105 pascals) pressure and at
higher temperatures. U.S. Geol. Surv. Bull. 1452, 456.
Rodríguez Badiola, E., Pérez Torrado, F.J., Carracedo, J.C., Guillou, H., 2006.
Petrografía y geoquímica del edificio volcánico Teide-Pico Viejo y las dorsales

26
noreste y noroeste de Tenerife, in Carracedo, J.C., ed., Los Volcanes del Parque
Nacional del Teide: Madrid,Serie Técnica. Publicacion Organismo Autónomo
Parques Nacionales, Ministerio de Medio Ambiente, p. 129–188.
Ruprecht, P. , Wörner, G., 2007. Variable regimes in magma systems documented in
plagioclase zoning patterns: El Misti stratovolcano and Andahua monogenetic
cones. J. Volcanol. Geotherm. Res. 165, 142-162.
Rutherford, M.J., Sigurdson, H., Carey, S., Davis, A., 1985. The May 18, 1980, eruption
of mount St. Helens 1. melts composition and experimental phase equilibria. J.
Geophys. Res. 90, 2929-2947.
Rutherford, M.J., Devine, J.D. III, 2008. Magmatic conditions and processes in the
storage zone of the 2004-2006 Mount St. Helens dacite. In: A volcano Rekindled:
the renewed eruption of Mount St. Helens 2004-2006.Sherrod, D.R., Scott, W.E.,
Stauffer, P.H. (eds). U.S. Geol Surv. Prof Paper pp.17-50.
Sauerzapf, U., Lattard, D., Burchard, M., Engelmann, R., 2008. The titanomagnetite-
ilmenite equilibrium: New experimental data and thermo-oxybarometric application
to the crystallization of basic to intermediate rocks. J. Petrol. 49, 1161-1185.
Scaillet, B., Pichavant, M., Roux, J., Humbert, G., Lefevre, A. (1992).
Scaillet, B., Pichavant, M., Roux, J., 1995. Experimental crystallization of leucogranites
magmas. J. Petrol. 36, 663-705.
Scaillet, B., Holtz, F., Pichavant, M., 1998. Phase equilibrium constraints on the
viscosity of silicic magmas 1. Volcanic-plutonic comparison. J. Geophys. Res. 103,
27,257-27,266.
Scaillet, B., Evans, B.W., 1999. The 15 June 1991 eruption of Mount Pinatubo. I. phase
equilibria and Pre-eruption P-T-ƒO2-aH2O. J. Petrol. 40, 381-411.
Scaillet, B., Pichavant, M., Cioni, R., 2008. Upward migration of Vesuvius magma
chamber over the past 20,000 years. Nature 455, 216-219.
Schmidt, B.C., Behrens, H., 2008. Water solubility in phonolite melts: influence of melt
composition and temperature. Chem. Geol. 256, 259–268.
Taylor, J.R., Wall, V.J. & Pownceby, M.I. (1992). The calibration and application of
accurate redox sensors. American Mineralogist 77, 284-295.
Triebold, S., Kronz, A., Wörner, G., 2006. Anorthite-calibrated backscattered electron
profiles, trace elements, and growth textures in feldspars from the Teide-Pico viejo
volcanic complex (Tenerife). J. Volcanol. Geotherm. Res. 154, 117-130.
27
Van Orman, J., Crispin, K.L., 2010. Diffusion in Oxides. Rev. Mineral. Geochem. 72,
757 - 826
Wiesmaier, S., Troll, V.R., Carracedo, J.C., Ellam, R.M., Bindeman, Y., Wolff, J.A.,
2012. Bimodality of Lavas in the Teide-PicoViejo Succession inTenerife-the Role of
Crustal Melting in the Origin of Recent Phonolites . J. Petrol.
doi:10.1093/petrology/egs056

28
Figure captions

29
Figure 1. a) Geographic location of the Canary Islands and simplified geological map of
Tenerife showing the products of the ancient basaltic shield, the las Cañadas Caldera
depression and the actual volcanic complex of Teide (T), Pico Viejo (PV), the vent and

30
distribution of the Roques Blancos eruption products (Modified from Ablay and Martí,
2000).b) geological map of the flank dome eruptions of the Teide-Pico Viejo volcano
and calibrated ages (modified from Carracedo et al., 2007);c) W view picture of the
Roques Blancos flank dome and location of the corresponding vents (modified from
Carracedo and Rodruíguez-Badiola, 2006); d) Summary of the last 17.000 yr
stratigraphy of the Teide-Pico Viejo volcanic complex (Modified from Ablay and Martí,
2000; Geochronology from Carracedo et al., 2007). Note the difference in the number of
phonolitic events from Pico Teide central eruptions compared to those from flank vents.
31
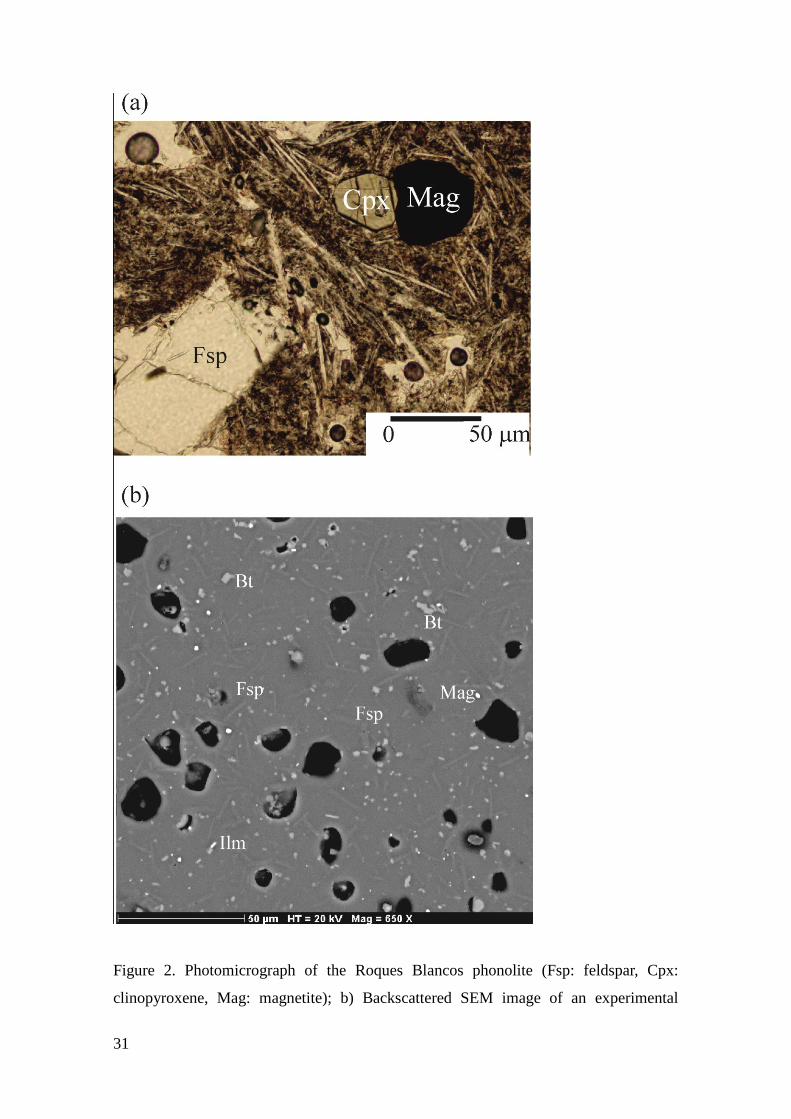
Figure 2. Photomicrograph of the Roques Blancos phonolite (Fsp: feldspar, Cpx:
clinopyroxene, Mag: magnetite); b) Backscattered SEM image of an experimental

32
charge containing magnetite (mag), ilmenite (ilm), biotite (bt) and feldspar (fsp).
Crystals are euhedral, small and unzoned.

33
Figure 3. Example of Electron Microprobe compositional profile (rim to rim) of a
natural feldspar showing a) variation in An content, b) TiO2 wt%, c) FeO* wt% and

34
BaO wt% content. Note that the increase in An content towards the borders of the
crystal is coupled with an increase in FeO, TiO2 and BaO (see text for details).

35
Figure 4. Isothermal phase relations of the Roques Blancos phonolite at a) 900ºC and
fO2NNO; b) 850ºC and fO2NNO; c) 800ºC and fO2NNO for different pressures and
water contents in the melt; d) Isobaric phase relations (50 MPa and fO2NNO) for
various temperatures and water contents in the melt. Mag: magnetite, Bt: biotite, Cpx:
clinopyroxene, ilm: ilmenite, tit: titanite, fsp: alkali feldspar. Dashed lines are estimated
phase boundaries. Numbers above dashed lines indicate crystal content in wt (%). Label
An below squares in plate d indicates the An content of experimental feldspars in the
charge. Dashed and dotted lines in plates a and c indicate estimated phase boundaries
for cpx and tit. Grey band in plate a and d shows the region where the phenocrysts
content and mineral assemblage of the natural obsidian are reproduced (see text for
details).

36
Figure 5. a) Variation of the Mg# with water content in the melt of natural and
experimental biotites. Black line and grey horizontal bar shows the natural composition.
Numbers next to symbols in the legend indicate temperature, pressure and fO2
conditions.

37
Figure 6. Variation of a) En content, b) Fs content, c) Wo content and d) Mg# of
experimental and natural clinopyroxenes with water content in the melt. Black line and
grey horizontal bar shows the natural composition. Numbers next to symbols in the
legend indicate temperature, pressure and fO2 conditions.

38
Figure 7. Variation of a) Anorthite content, b) albite content and c) orthose content in
natural and experimental feldspars with water content in the melt. Black line and grey
horizontal bar shows the natural composition. Numbers next to symbols in the legend
indicate temperature, pressure and fO2 conditions.

39
Figure 8. Glass compositional variations of major and minor oxides with water content
in the melt (plates a to h). Black line and grey horizontal bar shows the natural
composition. Numbers next to symbols in the legend indicate temperature, pressure and
fO2 conditions.

40
Figure 9. WNW-ESE cross section of the Teide-Pico Viejo stratovolcano showing the
the location of the magmatic reservoirs for central Teide magmas (Andújar et al. 2010),
Montaña Blanca (Andújar and Scaillet, 2012a) and Roques Blancos (this work). Magma
reservoir volumes are not at scale (modified from Andújar and Scaillet, 2012a).

Table 1: Major element compositions (in wt%) of bulk-rock, glass, and minerals of the natural sample, and starting material.
bulk rock astarting
material b
calculated
glass csd magnetite sd anorthoclase sd diopside sd biotite sd ilmenite sd
n 15 6 17 8 10 6
SiO2 59,38 59,64 59,23 0,33 0,08 0,01 65,11 0,40 51,36 0,41 36,66 0,28 0,05 0,01
TiO2 0,66 0,74 0,63 0,06 16,71 0,58 0,09 0,02 0,85 0,13 7,31 0,15 48,45 0,22
Al2O3 18,89 19,41 19,01 0,23 1,00 0,01 19,72 0,29 1,37 0,18 12,55 0,15 0,10 0,00
MgO 0,41 0,48 0,41 0,05 2,09 0,09 0,00 0,00 12,59 0,39 13,87 0,17 2,96 0,12
CaO 0,88 0,80 0,86 0,09 0,16 0,20 0,93 0,20 21,66 0,24 0,00 0,00 0,10 0,04
MnO 0,19 0,14 0,21 0,02 2,50 0,01 0,00 - 0,83 0,03 0,00 0,00 3,26 0,03
FeO* 3,41 3,39 3,62 0,18 72,13 0,23 0,25 0,03 10,07 0,52 14,60 0,19 42,95 0,55
Na2O 9,90 9,90 10,37 0,19 - - 7,94 0,19 1,16 0,08 1,07 0,12 - -
K2O 5,48 5,49 5,65 0,12 - - 4,81 0,42 0,00 0,00 8,45 0,08 - -
P2O5 0,07 - - - - - - - - - - - -
Cl 0,30 - - - - - - - - - - - -
F 0,12 - - - - - - - - - - - -
Original Sum 99,69 100,0 100,0 94,7 0,2 98,9 0,3 99,9 0,6 94,5 97,9 0,0
Mg# 16,96 4,90 69,03 1,01 62,87 0,39
An 4,44 0,95
Ab 68,30 1,47
Or 27,26 2,35
Wo 49,6 0,3
En 40,1 1,1
Fs 10,3 1,2
Phase
proportions
(wt%)
85,60 0,30 13,70 0,08 0,30 0,10
Thermo-Oxybarometric results after Sauerzapf et al. (2008)
n. pairs 6 sd
T(ºC) 895,37 4,8
∆NNOd -0,19 0,10
log f O2 -12,19 0,02
a: Bulk rock composition of the natural sample analysed by ICP-MS.
b: Electron Microprobe analysis of the starting glass added to the capsules.
c: Composition of the residual melt calculated by mass balance using the composition and abundance of the mineral phases and the bulk rock.
sd: Standard deviation.
n: Number of analysis.
*: Total iron reported as Fe2+
.
Mg# =100[Mg/(Mg+Fe*)].
Or, Ab, and An end- members calculated as in Deer et al. (1972)
End members for clinopyroxene (En, Fs, Wo) calculated as in Morimoto (1989).
phase proportions calculated as weight %.
d:Values for NNO buffer after Pownceby & O'Neill (1994)

Table 2: Experimental conditions and run products
NNO experiments
Run XH2Owt%in H2Owt%melt f H2(bar) log f O2(bar) D NNO aH2Oe
phase assemblage Sr2
850ºC,200MPa,162h b 9.14c
-12,69 0,20
RB1 1,00 6,84 -12,71 0,14 0,98 (98.2)gl+(1.6)mag+(0.2)ilm 1,03
RB2 0,89 6,12 -12,90 -0,05 0,78 (98.2)gl+(1.4)mag+(0.4)ilm 0,90
RB3 0,81 5,55 -13,07 -0,22 0,65 (93.0)gl+(1.0)mag+(trace)ilm+(6.0)bt 1,20
RB4 0,73 5,02 -13,24 -0,39 0,53 (94.7)gl+(0.3)mag+(0.3)ilm+(4.7)bt+(trace)fsp 0,32
RB5 0,62 4,22 -13,55 -0,70 0,37 gl+mag+ilm+bt+fsp n.d
RB6 0,53 3,63 -13,80 -0,95 0,28 gl+mag+ilm+bt+fsp+cpx n.d
850ºC,150MPa,233h b 6,47d
-12,76 0,13
RB25 1,00 6,08 -12,76 0,10 1,00 (97.3)gl+(0.7)mag+(trace)ilm+(2.0)bt 0,06
RB26 0,92 5,57 -12,88 -0,02 0,87 (96.7)gl+(0.6)mag+(trace)ilm+(2.74)bt 0,06
RB27 0,82 4,99 -13,07 -0,21 0,70 (96.5)gl+(0.1)mag+(tace)ilm+(3.4)bt 0,22
RB28 0,72 4,36 -13,31 -0,45 0,53 (78.7)gl+(0.7)mag+(trace)ilm+(3.6)bt+(17.0)fsp 0,33
RB29 0,60 3,62 -13,63 -0,77 0,37 (75.5)gl+(1.2)mag+(trace)ilm+(1.6)bt+(20.9)fsp+(0.8)cpx 0,05
RB30 0,48 2,94 -13,99 -1,12 0,24 gl+mag+ilm+bt+fsp+cpx n.d.
850ºC,100MPa,195h b 5,6d
-12,88 0,01
RB13 1,00 5,09 -12,87 0,00 1,00 (95.9)gl+(0.7)mag+(trace)ilm+(3.4)bt 0,21
RB14 0,90 4,60 -12,97 -0,10 0,89 (78.9)gl+(1.3)mag+(trace)ilm+(2.6)bt+(17.2)fsp 0,12
RB15 0,78 3,99 -13,22 -0,35 0,67 (72.7)gl+(1.5)mag+(trace)ilm+(3.1)bt+(22.7)fsp+(trace)cpx 0,12
RB16 0,69 3,49 -13,45 -0,58 0,51 gl+mag+ilm+bt+fsp+cpx n.d.
RB18 0,49 2,48 -14,03 -1,16 0,26 gl+mag+ilm+bt+fsp+cpx n.d.
850ºC,50MPa,389h b 2,42c
-12,71 0,18
RB31 1,00 3,19 -12,84 0,04 0,86 (92.3)gl+(0.5)mag+(0.1)ilm+(2.2)bt+(4.8)fsp+(0.1)cpx 0,06
RB32 0,92 2,94 -12,98 -0,10 0,73 (82.8)gl+(1.0)mag+(trace)ilm+(1.5)bt+(14.4)fsp+(0.3)cpx 0,01
RB34 0,71 2,27 -13,42 -0,54 0,44 (70.8)gl+(0.9)mag+(trace)ilm+(1.4)bt+(26.4)fsp+(0.5)cpx 0,10
RB35 0,56 1,79 -13,81 -0,93 0,28 gl+mag+ilm+bt+fsp+cpx n.d.
800ºC,205 MPa,114h b 7,22c
-13,71 0,19
RB49 1,00 5,01 -13,70 0,16 0,93 (95.9)gl+(1.3)mag+(2.5)bt+(0.3)cpx 0,38
RB50 0,94 4,69 -13,81 0,06 0,85 (95.4)gl+(0.5)mag+(3.3)bt+(0.8)cpx 0,50
RB51 0,84 4,18 -13,97 -0,11 0,75 (76.9)gl+(0.6)mag+(2.4)bt+(1.0)cpx+(19.2)fsp 0,19
RB52 0,81 4,05 -14,10 -0,24 0,62 (73.5)gl+(1.5)mag+(1.6)bt+(0.5)cpx+(22.9)fsp 0,07
RB53 0,54 2,72 gl+mag+bt+cpx+fsp n.d.
RB54 0,51 2,56 gl+mag+bt+cpx+fsp n.d.
800ºC,100MPa,145h b 4,92d
-13,87 0,03
RB61 1,00 3,95 -13,87 0,03 (61.6)gl+(1.4)mag+(2.8)bt+(0.5)cpx+(33.7)fsp+(trace)tit 0,14
RB62 0,92 3,64 -13,93 -0,05 (60.7)gl+(1.9)mag+(1.7)bt+(trace)cpx+(35.7)fsp+(trace)tit 0,08
RB63 0,80 3,14 gl+mag+bt+cpx+fsp+tit n.d
RB64 0,69 2,71 gl+mag+bt+cpx+fsp+tit n.d.
RB65 0,62 2,44 gl+mag+bt+cpx+fsp+tit n.d.
RB66 0,53 2,09 gl+mag+bt+cpx+fsp+tit n.d.

900ºC,200MPa,164h a 8,36c
-11,69 0,27
RB85 1,00 5,74 -12,11 -0,19 0,69 (97.5)gl+(2.5)bt 0,73
RB86 0,93 5,33 -12,23 -0,31 0,60 (97.5)gl+(2.5)bt 0,43
RB87 0,83 4,74 -12,44 -0,52 0,47 (97.3)gl+(2.7)bt 0,39
RB88 0,70 4,00 -12,74 -0,81 0,34 (97.8)gl+(0.9)mag+(trace)ilm+(1.3)bt 0,06
RB89 0,58 3,35 -13,04 -1,12 0,24 (97.7)gl+(1.4)mag+(trace)ilm+(0.4)bt 0,35
RB90 0,44 2,53 -13,52 -1,60 0,14 (88.1)gl+(0.9)mag+(trace)ilm+(0.7)bt+(10.3)fsp 0,07
900ºC,100MPa,188h a 4,89d
-11,81 0,15
RB 91 1,00 4,53 -11,94 0,00 0,86 (98.4)gl+(1.6)bt 0,34
RB 93 0,82 3,73 -12,27 -0,33 0,59 (98.2)gl+(1.5)mag+(trace)ilm+(0.3)bt 0,37
RB 94 0,73 3,31 -12,48 -0,54 0,46 (98.2)gl+(0.6)mag+(0.2)ilm+(0.7)bt 0,30
RB 95 0,56 2,53 -12,94 -1,00 0,27 (89.8)gl+(1.0)mag+(trace)ilm+(0.3)bt+(8.9)fsp 0,11
900ºC,50MPa,284h a 3,53c
-11,75 0,21
RB 96 1,00 3,07 -11,95 0,01 0,80 (98.2)gl+(1.8)bt 0,30
RB 97 0,91 2,78 -12,11 -0,16 0,66 (98.4)gl+(1.6)bt 0,57
RB 98 0,78 2,39 -12,37 -0,41 0,49 (98.5)gl+(0.7)mag+(trace)ilm+(0.8)bt 0,26
RB 99 0,73 2,24 -12,48 -0,52 0,43 (85.0)gl+(1.3)mag+(0.1)ilm+(0.1)bt+(trace)cpx+(13.5)fsp 0,08
RB 100 0,60 1,85 -12,79 -0,84 0,30 (74.3)gl+(1.3)mag+(trace)ilm+(0.4)bt+(0.2)cpx+(23.8)fsp 0,10
RB 101 0,50 1,53 -13,09 -1,13 0,21 (67.8)gl+(1.8)mag+(trace)ilm+(0.6)bt+(0.2)cpx+(29.6)fsp 0,09
QFM experiments
850ºC,100MPa,188h b 6,66c
-13,03 -0,14
RB 73 1,00 5,09 -13,25 -0,38 1,00 (98.0)gl+(0.7)mag+(0.5)ilm+(0.8)bt 0,70
RB 74 0,90 4,57 -13,32 -0,45 0,89 (98.3)gl+(0.4)mag+(0.7)ilm+(trace)bt+(0.6)cpx 0,58
RB 75 0,80 4,09 -13,48 -0,61 0,67 (88.7)gl+(0.9)mag+(trace)ilm+(0.9)bt+(0.5)cpx+(9.0)fsp 0,25
RB 76 0,71 3,61 -13,73 -0,86 0,51 gl+mag+ilm+bt+cpx+fsp n.d.
RB 77 0,55 2,80 -13,88 -1,01 0,31 gl+mag+ilm+bt+cpx+fsp n.d.
RB 78 0,53 2,70 -14,15 -1,28 0,26 gl+mag+ilm+bt+cpx+fsp n.d.
XH2Owt%in:initial H2O/(H2O+CO2) in the charge
H2Owt%melt: water content in the melt a: determined by FTIR, b:determined by the solubility model of Papale et al. (2006)
f H2(bar):hidrogen fugacity of the experiment. c:determined by using NiPd alloy sensors, d:calculated using the data obtained from succesfull NiPd alloys (see text for details)
log f O2(bar): logarithm of the oxygen fugacity calculated from the experimental f H2
D NNO:log f O2-log f O2 of the NNO buffer calculated at P and T (Pownceby & O'Neill,1994)
e:aH2Ocalculated by using H2Owt% at saturation/ H2Owt% in the melt (see text for details)
n.d.: not determined
phase assemblage: numbers in brackets indicate the phase abundance in the charge in weight %
Gl:glass, Mag:magnetite,Bt:biotite,Cpx:clinopyroxene, Ilm:ilmenite,Fsp:alkali feldspar, Tit:titanite
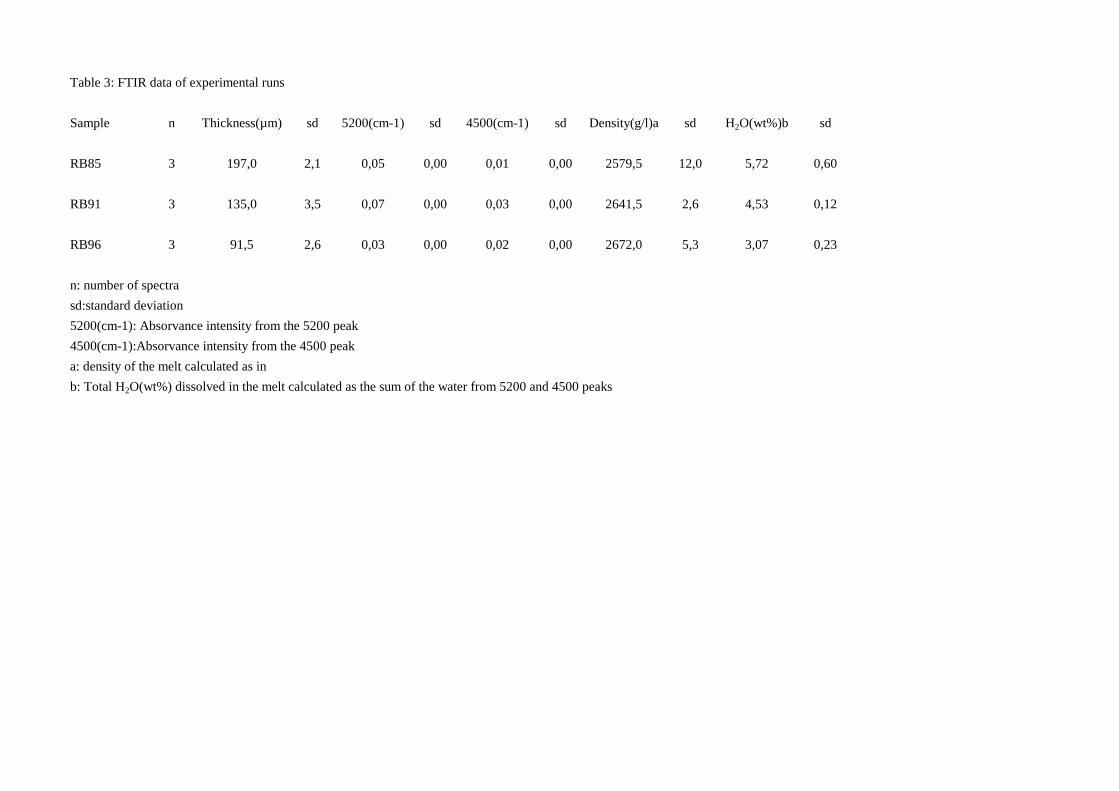
Table 3: FTIR data of experimental runs
Sample n Thickness(µm) sd 5200(cm-1) sd 4500(cm-1) sd Density(g/l)a sd H2O(wt%)b sd
RB85 3 197,0 2,1 0,05 0,00 0,01 0,00 2579,5 12,0 5,72 0,60
RB91 3 135,0 3,5 0,07 0,00 0,03 0,00 2641,5 2,6 4,53 0,12
RB96 3 91,5 2,6 0,03 0,00 0,02 0,00 2672,0 5,3 3,07 0,23
n: number of spectra
sd:standard deviation
5200(cm-1): Absorvance intensity from the 5200 peak
4500(cm-1):Absorvance intensity from the 4500 peak
a: density of the melt calculated as in
b: Total H2O(wt%) dissolved in the melt calculated as the sum of the water from 5200 and 4500 peaks

Table 4: Composition (wt%) and end-members of experimental mineral phases
Magnetite
SiO2 TiO2 Al2O3 MgO CaO MnO FeO Na2O K2O Sum Mg# wt%gl
RB32(3) - 17,44 0,91 1,54 0,00 3,02 77,13 - - 100,0 3,43 1,20
sd - 0,29 0,01 0,09 0,00 0,10 0,26 - - 0,0 -
RB16 - 13,75 2,10 1,75 0,00 3,53 78,87 - - 100,0 3,81 2,10
Ilmenite
SiO2 TiO2 Al2O3 MgO CaO MnO FeO Na2O K2O Sum Mg# wt%gl
RB13(3) - 49,49 0,10 2,22 0,00 3,75 44,47 - - 100,0 - 0,50
sd - 0,15 0,05 0,15 0,00 0,10 0,13 - - 0,0 -
RB14(4) - 50,10 0,12 2,31 0,00 4,19 43,28 - - 100,0 - 2,30
sd - 0,42 0,06 0,06 0,00 0,08 0,48 - - 0,0 -
RB15 - 50,47 0,07 2,43 0,00 4,86 42,22 - - 100,0 - 3,00
RB3 - 48,72 0,07 1,98 0,00 3,47 45,72 - - 100,0 - 1,10
RB77(2) 0,0 0,00 51,06 0,00 1,78 4,56 42,85 - - 100,0 -
Biotite
SiO2 TiO2 Al2O3 MgO CaO MnO FeO Na2O K2O Sum Mg# wt%gl
RB3 37,7 5,76 13,93 18,67 0,54 10,45 0,07 1,61 8,05 96,7 49,93 -
sd 0,6 0,36 0,26 0,28 0,05 0,66 0,05 0,53 0,30 0,7 1,22 -
RB13(5) 37,3 5,76 13,63 16,71 0,56 11,69 0,05 1,19 8,14 95,0 55,48 -
sd 0,9 0,38 0,21 0,48 0,04 0,67 0,03 0,31 0,28 0,4 1,30 -
RB14(3) 38,9 5,84 13,62 16,98 0,56 10,33 0,09 1,94 8,02 96,3 52,03 -
sd 0,5 0,36 0,24 0,86 0,06 0,60 0,07 0,44 0,31 1,3 0,20 -
RB85 35,9 4,74 14,54 15,23 0,54 14,70 0,00 1,02 8,86 96,5 63,25 -
RB86 40,8 4,74 15,76 13,03 0,57 12,89 0,11 1,61 8,07 97,6 63,82 -
RB87 35,8 5,73 15,56 14,72 0,24 14,07 0,00 1,02 8,94 97,1 63,02 -
RB88(2) 40,5 5,75 14,89 12,68 0,43 11,58 0,13 1,98 8,18 97,1 61,95 -
sd 0,7 0,24 0,45 0,76 0,08 0,72 0,02 0,34 0,36 0,5 0,05 -

RB89(2) 36,6 5,58 16,68 14,17 0,36 11,17 0,07 1,41 8,07 95,1 58,43 -
sd 0,5 0,11 0,67 0,57 0,06 0,25 0,08 0,05 0,02 0,8 0,43 -
RB94 38,2 6,18 14,59 14,51 0,47 12,16 0,03 1,34 8,16 96,6 59,90 -
RB99(2) 36,2 5,54 15,54 12,34 0,41 14,70 0,04 1,22 8,28 95,2 67,98 -
sd 0,5 0,41 0,22 0,44 0,13 0,22 0,01 0,14 0,21 0,6 0,45 -
RB100 (2) 37,5 6,39 14,71 12,45 0,38 13,66 0,02 1,22 8,53 96,4 66,17 -
sd 0,3 0,14 0,90 0,22 0,14 0,11 0,02 0,20 0,13 0,5 0,58 -
RB101 39,0 5,71 15,01 13,31 0,52 12,85 0,08 2,13 8,40 97,0 63,25 -
Clinopyroxene
SiO2 TiO2 Al2O3 MgO CaO MnO FeO Na2O K2O Sum Mg# wt%gl En Fs Wo
RB32(4) 48,4 2,45 3,15 9,36 20,49 1,00 12,27 1,62 0,09 98,8 57,62 - 29,7 21,8 46,7
sd 0,3 0,22 0,21 0,20 0,14 0,06 0,14 0,13 0,02 0,3 0,59 - 0,5 0,2 0,3
RB34(4) 49,9 1,60 1,85 11,43 21,00 0,97 11,58 1,66 0,00 100,0 63,75 - 34,0 19,4 44,9
sd 0,3 0,30 0,83 0,32 0,80 0,11 0,21 0,32 0,00 0,0 0,36 - 0,3 0,4 0,9
RB49(3) 50,3 0,79 1,30 7,95 21,87 1,48 15,42 0,93 0,00 100,0 47,89 2,80 24,0 26,1 47,4
sd 0,6 0,30 0,32 0,36 0,07 0,12 0,45 0,07 0,00 0,0 1,85 1,73 1,0 0,9 0,3
RB52 50,4 0,67 1,18 7,59 20,96 1,49 15,23 1,38 0,14 99,0 47,04 - 23,7 26,7 47,0
RB76(2) 51,0 1,58 4,04 8,65 19,60 1,17 12,17 1,91 0,47 100,5 55,89 - 28,6 22,6 46,6
sd 0,4 0,48 0,88 0,11 0,47 0,05 0,45 0,18 0,08 1,3 1,24 - 0,8 0,5 0,4
RB77(2) 50,1 0,96 1,93 8,75 20,64 1,29 12,92 1,41 0,19 98,2 54,68 - 27,7 23,0 47,0
sd 0,4 0,12 0,60 0,40 0,30 0,05 0,25 0,25 0,02 0,1 1,61 - 0,8 0,8 0,1
Feldspars
SiO2 TiO2 Al2O3 MgO CaO MnO FeO Na2O K2O Sum Mg# wt%gl An Ab Or
RB4(2) 64,1 0,36 19,64 0,18 1,23 0,00 1,50 7,75 4,14 98,9 - - 6,1 69,5 24,4
sd 0,7 0,14 0,48 0,02 0,04 0,00 0,54 0,20 0,09 0,8 - - 0,0 0,0 0,1
RB5 64,4 0,44 19,24 0,17 0,94 0,00 1,04 7,76 4,90 98,9 - - 4,5 67,5 28,0
RB31 65,9 0,20 19,64 0,03 1,08 0,02 0,53 7,72 5,03 100,1 - - 5,12 66,41 28,5
RB32 67,1 0,18 20,02 0,00 0,71 0,03 0,41 7,80 4,94 101,2 - - 3,45 68,13 28,4
RB34 63,5 0,33 19,64 0,16 0,46 0,25 1,60 7,64 6,19 99,8 - - 2,12 63,82 34,1

RB51(3) 64,6 0,16 20,24 0,03 0,95 0,00 0,44 7,63 4,38 98,4 - - 4,7 69,1 26,1
sd 0,1 0,01 0,36 0,02 0,01 0,00 0,22 0,06 0,07 0,5 - - 0,0 0,4 0,5
RB99 64,6 0,16 20,89 0,03 1,92 0,00 0,12 8,40 3,83 100,1 - - 8,8 70,1 21,1
RB100 64,3 0,23 20,78 0,00 1,66 0,13 0,52 8,26 4,14 100,1 - - 7,7 69,4 22,9
RB101(2) 64,1 0,28 19,60 0,07 0,78 0,19 0,73 7,54 5,53 99,3 - - 3,69 64,95 31,4
0,7 0,02 0,12 0,00 0,04 0,04 0,16 0,22 0,06 0,6 - - 0,12 0,29 0,41
numbers in brackets indicate the number of analysis.
sd: Standard deviation
* Total Iron reported as FeO
Mg# = 100[Mg/(Mg+Fe*)]
wt% glass: Clinopyroxene compositions are re-calculated due to glass contamination (see text for details)
and here we indiciate the wt% glass substracted to the original electron microprobe analysis
En, Fs, Wo: calculated as in Morimoto (1989)
An= 100[Ca/(Ca+Na+K)]; Ab= 100[Na/(Ca+Na+K)]; Or=[100K/(Ca+Na+K)]. End members calculated as in Deer et al. (1972).

Table 5: Experimental melt composition (wt%) normalized to 100% anhydrous basis
Run
NNO experiments
850ºC,200MPa,162h
SiO2 TiO2 Al2O3 MgO CaO MnO FeO* Na2O K2O Sum Mg#
original
sum Na2O+K2O per-alk
RB1(4) 61,7 0,56 19,5 0,15 0,95 0,16 2,23 9,7 5,1 100 10,6 96,6 14,8 1,1
sd 0,9 0,04 0,4 0,04 0,02 0,04 0,24 0,3 0,1 - 0,5
RB2(5) 61,7 0,52 19,5 0,16 0,87 0,15 2,38 9,7 5,0 100 10,8 96,7 14,8 1,1
sd 0,6 0,04 0,4 0,04 0,02 0,03 0,06 0,2 0,1 - 0,7
RB3(4) 61,6 0,55 19,2 0,17 0,85 0,14 2,50 10,0 4,9 100 11,0 98,1 15,0 1,1
sd 0,5 0,14 0,0 0,05 0,08 0,03 0,29 0,1 0,19 - 0,4
RB4(4) 60,9 0,54 19,3 0,16 0,76 0,18 2,51 10,4 5,3 100 9,9 98,9 15,8 1,2
sd 0,3 0,07 0,3 0,00 0,11 0,04 0,04 0,2 0,1 - 0,6
850ºC,150MPa,233h
RB25(9) 60,6 0,59 19,5 0,28 0,87 0,13 2,62 10,0 5,4 100 15,8 94,5 15,4 1,1
sd 0,3 0,12 0,2 0,03 0,05 0,06 0,14 0,3 0,2 - 0,7
RB26(5) 60,8 0,53 19,5 0,23 0,83 0,04 2,54 10,1 5,4 100 14,0 96,1 15,6 1,2
sd 0,2 0,08 0,1 0,03 0,03 0,08 0,12 0,2 0,0 - 0,7
RB27(4) 61,0 0,48 19,3 0,24 0,85 0,20 2,44 10,1 5,3 100 15,1 93,7 15,4 1,2
sd 0,3 0,04 0,3 0,04 0,10 0,08 0,16 0,2 0,0 - 0,6
RB28(3) 60,3 0,48 19,1 0,21 0,72 0,23 2,45 10,9 5,7 100 13,1 95,6 16,6 1,3
sd 0,3 0,06 0,2 0,06 0,06 0,07 0,29 0,1 0,2 - 0,9
RB29(6) 59,4 0,57 19,8 0,25 0,61 0,20 2,70 10,8 5,7 100 14,2 96,3 16,5 1,2
sd 0,3 0,09 0,1 0,02 0,08 0,07 0,27 0,2 0,1 - 0,6
850ºC,100MPa,195h
RB13(5) 60,9 0,63 19,4 0,29 0,82 0,15 2,53 10,1 5,1 100 17,0 95,5 15,2 1,1
sd 0,6 0,21 0,3 0,13 0,04 0,04 0,26 0,4 0,0 - 0,7

RB14(1) 60,1 0,41 19,8 0,17 1,00 0,06 2,22 10,8 5,4 100 12,1 93,6 16,2 1,2
RB15(1) 60,8 0,41 20,0 0,17 1,01 0,06 2,25 9,9 5,5 100 12,1 96,2 15,3 1,1
850ºC,50MPa,389h
RB31(4) 60,3 0,51 19,5 0,22 0,71 0,11 2,79 10,3 5,6 100 12,1 95,6 15,9 1,2
sd 0,3 0,05 0,2 0,01 0,05 0,08 0,19 0,3 0,1 - 0,5
RB32(3) 59,6 0,58 19,6 0,28 0,71 0,19 2,82 10,5 5,7 100 15,2 96,3 16,2 1,2
sd 0,2 0,05 0,2 0,04 0,10 0,09 0,17 0,1 0,1 - 0,4
RB34(1) 58,3 0,65 20,0 0,36 0,71 0,31 3,30 10,9 5,5 100 16,2 97,2 16,4 1,2
800ºC,205 MPa,114h
RB49(4) 61,3 0,26 20,1 0,10 0,75 0,10 2,11 9,8 5,5 100 7,6 89,0 15,2 1,1
sd 0,5 0,02 0,2 0,03 0,06 0,01 0,03 0,2 0,3 - 0,6
RB50(3) 60,2 0,24 19,5 0,06 0,66 0,12 2,28 11,4 4,4 100 4,8 90,7 15,8 1,2
sd 0,2 0,04 0,1 0,03 0,05 0,08 0,14 0,1 0,1 - 0,1
RB51(3) 59,5 0,30 20,0 0,12 0,57 0,18 2,95 10,8 5,5 100 6,7 95,1 16,3 1,2
sd 0,5 0,06 0,2 0,02 0,05 0,04 0,23 0,1 0,3 - 0,7
RB52(3) 59,7 0,44 19,8 0,10 0,67 0,08 2,25 11,0 5,8 100 7,5 95,5 16,7 1,2
sd 0,3 0,08 0,3 0,04 0,04 0,05 0,49 0,6 0,3 - 0,8
800ºC,100MPa,145h
RB61(1) 59,3 0,43 19,1 0,26 0,59 0,18 2,67 11,7 5,8 100 14,8 96,6 17,5 1,3
RB62(1) 58,8 0,43 19,4 0,25 0,80 0,15 2,32 11,6 5,9 100 16,0 96,6 17,6 1,3
900ºC,200MPa,164h
RB85(4) 60,6 0,72 19,6 0,33 0,90 0,19 3,03 9,4 5,3 100 16,2 93,6 14,7 1,1

sd 1,0 0,08 0,1 0,02 0,09 0,18 0,36 0,6 0,1 - 0,4
RB86(4) 60,2 0,70 19,6 0,30 0,90 0,33 2,81 9,6 5,5 100 15,9 94,0 15,1 1,1
sd 0,3 0,13 0,3 0,03 0,02 0,09 0,33 0,2 0,2 - 0,7
RB87(5) 60,3 0,64 19,7 0,30 0,99 0,16 2,66 9,8 5,4 100 16,8 95,0 15,2 1,1
sd 0,1 0,07 0,2 0,05 0,02 0,16 0,16 0,0 0,1 - 0,7
RB88(3) 60,3 0,65 19,5 0,27 0,94 0,23 2,65 9,9 5,5 100 15,5 94,6 15,4 1,1
sd 0,5 0,01 0,2 0,01 0,04 0,10 0,12 0,3 0,1 -
RB89(3) 60,6 0,65 19,8 0,28 0,92 0,30 2,38 9,6 5,5 100 17,6 95,6 15,0 1,1
sd 0,2 0,08 0,0 0,00 0,06 0,06 0,43 0,2 0,0 - 0,5
RB90(4) 59,7 0,58 19,6 0,28 0,85 0,16 2,89 10,2 5,8 100 14,6 96,7 15,9 1,2
sd 0,4 0,07 0,3 0,01 0,05 0,11 0,22 0,4 0,2 - 0,6
900ºC,100MPa,188h
RB 91(4) 60,0 0,71 19,7 0,33 0,97 0,16 2,91 9,6 5,4 100 16,8 95,4 15,0 1,1
sd 0,4 0,05 0,3 0,04 0,10 0,07 0,20 0,4 0,2 - 0,6
RB 93(3) 60,6 0,65 19,7 0,30 0,89 0,20 2,35 9,5 5,5 100 18,8 96,3 15,0 1,1
sd 0,1 0,09 0,1 0,04 0,09 0,16 0,31 0,3 0,1 - 0,7
RB 94(6) 60,4 0,58 19,5 0,29 0,99 0,17 2,84 9,6 5,5 100 15,4 96,3 15,1 1,1
sd 0,1 0,12 0,2 0,03 0,05 0,18 0,13 0,1 0,2 - 0,4
RB 95(3) 59,7 0,60 19,6 0,31 0,95 0,20 2,69 10,1 5,6 100 16,8 97,7 15,7 1,2
sd 0,4 0,02 0,3 0,03 0,10 0,18 0,40 0,4 0,2 - 0,1
900ºC,50MPa,284h
RB 96(4) 60,1 0,60 19,8 0,31 0,95 0,20 2,71 9,5 5,6 100 16,8 97,0 15,1 1,1
sd 0,4 0,05 0,2 0,02 0,07 0,12 0,45 0,4 0,2 - 0,8
RB 97(5) 60,2 0,70 19,6 0,40 0,83 0,17 2,88 9,4 5,6 100 19,8 97,7 15,1 1,1
sd 0,5 0,09 0,1 0,02 0,06 0,07 0,38 0,3 0,1 - 0,6
RB 98(5) 59,9 0,72 19,6 0,42 0,86 0,18 2,93 9,5 5,6 100 20,2 97,9 15,1 1,1
sd 0,3 0,09 0,1 0,07 0,03 0,06 0,27 0,2 0,1 - 0,5
RB 99(5) 59,5 0,69 19,6 0,42 0,83 0,11 2,80 10,3 5,7 100 21,1 97,6 16,0 1,2
sd 0,3 0,13 0,1 0,03 0,03 0,09 0,22 0,2 0,1 - 0,4

RB 100(5) 58,8 0,69 19,4 0,46 0,79 0,18 3,00 10,5 5,8 100 21,5 97,8 16,4 1,2
sd 0,4 0,05 0,2 0,06 0,05 0,09 0,30 0,2 0,1 - 1,3
RB 101(5) 58,7 0,70 19,6 0,46 0,78 0,17 2,60 10,9 5,9 100 24,0 98,4 16,8 1,2
sd 0,4 0,06 0,2 0,05 0,04 0,07 0,11 0,3 0,2 - 0,7
QFM experiments
850ºC,100MPa,188h
RB 73(3) 60,8 0,48 19,9 0,18 0,92 0,17 2,61 9,4 5,6 100 10,8 93,7 15,0 1,1
sd 0,3 0,03 0,0 0,03 0,06 0,15 0,09 0,1 0,2 - 0,9
RB 74(3) 60,5 0,41 20,0 0,21 0,79 0,24 2,78 9,4 5,7 100 11,9 93,9 15,1 1,1
sd 0,3 0,03 0,0 0,03 0,06 0,15 0,09 0,1 0,2 - 0,8
RB 75(3) 59,8 0,50 20,0 0,19 0,88 0,23 2,62 10,2 5,6 100 11,5 95,0 15,7 1,1
sd 0,3 0,03 0,0 0,03 0,06 0,15 0,09 0,1 0,2 - 0,9
numbers in brackets indicate the number of analysis
All analyses are normalized to 100% anhydrous. Original totals are reported (original sum)
sd: standard deviation
Mg#: magnesium number of the melt calculated as Mg#=100*(Mg/Mg+Fe) in moles
per-alk: per-alkalinity calculated as (Na+K)/Al in moles
FeO*: Total iron reported as Fe2+