centrale bank van aruba
TRANSCRIPT

CENTRALE BANK VAN ARUBA
CHARTS &
TRENDS
Research Department September 5, 2013

Sources (in alphabetical order):
• Aruba Airport Authority N.V. • Aruba Gas Supply N.V. • Aruba Port Authority N.V. • Aruba Stevedoring Company (ASTEC) N.V. • Aruba Tourism Authority N.V. • Bureau of Labor Statistics of the U.S. Department of Labor • Centrale Bank van Aruba • Centraal Bureau voor de Statistiek (the central bureau of Statistics) • Conference Board • Cruise Tourism Authority • Directie Economische Zaken Handel en Industrie (the department of economic affairs, commerce and
industry)Department of Finance • Federal Reserve Bank of St. Louis • Food and Agriculture Organization of the United Nations • International Monetary Fund • N.V. Elektriciteit-Maatschappij Aruba • Sociale Verzekeringsbank (the social security bank) • Tax Collector's Office • The London Bullion Market Association • Thomson Reuters/University of Michigan • Water- en Energie Bedrijf “Aruba” N.V.

Contents
1 Real sector 1.37 Nominal revenue per available room-total 1-91.1 Nominal turnover tax (BBO) 1-3 1.38 Real revenue per available room-total 1-91.2 Real turnover tax (BBO) - lagged one month 1-3 1.39 Nominal revenue per available room-hotel 1-91.3 Nominal wage tax 1-3 1.40 Real revenue per available room-hotel 1-91.4 Real wage tax - lagged one month 1-3 1.41 Nominal revenue per available room-timeshare 1-91.5 Inflation Aruba 1-4 1.42 Real revenue per available room-timeshare 1-9
(Twelve-month average) 1.43 Nominal average daily rate-total 1-91.6 Inflation Aruba 1-4 1.44 Real average daily rate-total 1-9
(End of period) 1.45 Nominal average daily rate-hotel 1-101.7 Inflation differential 12-month average and 1-4 1.46 Real average daily rate-hotel 1-10
end of period 1.47 Nominal average daily rate-timeshare 1-101.8 Inflation USA 1-4 1.48 Real average daily rate-timeshare 1-10
(Twelve-month average) 1.49 Nominal tourism receipts 1-111.9 Inflation differential Aruba with USA 1-4 1.50 Real tourism receipts 1-11
(Twelve-month average) 1.51 Nominal tourism expenditure 1-111.10 Aruba inflation excluding energy and food 1-4 1.52 Real tourism expenditure 1-11
(Twelve-month average) 1.53 Nominal tourism receipts 1-111.11 Aruba inflation excluding energy 1-4 (Commercial banks and CBA)
(Twelve-month average) 1.54 Real tourism receipts 1-111.12 USA inflation excluding energy 1-4 (Commercial banks and CBA)
(Twelve-month average) 1.55 Nominal hotel room tax/tourist levy 1-111.13 Aruba-Food and non-alcoholic beverage 1-5 1.56 Real hotel room tax/tourist levy - lagged one month 1-11
(Twelve-month average) 1.57 Nominal gambling licenses 1-121.14 Aruba-Housing 1-5 1.58 Real gambling licenses - lagged on month 1-12
(Twelve-month average) 1.59 Water 1-131.15 Aruba-Household operation 1-5 1.60 Electricity 1-13
(Twelve-month average) 1.61 Gas 1-131.16 Aruba-Transport 1-5 1.62 Container transport ASTEC 1-13
(Twelve-month average) 1.63 Unleaded premium gasoline prices 1-131.17 Aruba-Food component 1-5 1.64 Diesel prices 1-13
(Twelve-month average) 1.65 New commercial water connection 1-131.18 USA-Food component 1-5 1.66 New commercial water disconection 1-13
(Twelve-month average) 1.67 Index of construction 1-141.19 Aruba-Maintenance and repair of the dwelling 1-5
(Twelve-month average) 2 Monetary sector1.20 Unemployment rate 1-6 2.1 Nominal money supply 2-31.21 Severance insurance payments 1-6 (End of period)1.22 Workers' remittances payments 1-6 2.2 Real money supply 2-31.23 Population 1-6 (End of period)1.24 AZV-receipts 1-6 2.3 Nominal net domestic assets 2-31.25 AOV/AWW-receipts 1-6 (End of period)1.26 Stay-over visitors 1-7 2.4 Real net domestic assets 2-31.27 Visitor's nights 1-7 (End of period)1.28 Airport arrivals corrected for resident arrivals 1-7 2.5 Nominal net foreign assets 2-31.29 Resident arrivals 1-7 Including revaluation differences1.30 Airline load factor 1-7 (End of period)1.31 Average nights stayed 1-7 2.6 Real net foreign assets 2-31.32 Cruise passengers 1-7 Including revaluation differences1.33 Ship calls 1-7 (End of period)1.34 Occupancy rate-total 1-8 2.7 Nominal net foreign assets 2-31.35 Occupancy rate-hotels 1-8 Excluding revaluation differences1.36 Occupancy rate-timeshare 1-8 (End of period)

2.8 Real net foreign assets 2-3 2.34 Real average new commercial term loan 2-7Excluding revaluation differences per lender (During period)(End of period) 2.35 Nominal savings deposits 2-7
2.9 Nominal total credit 2-4 (End of period)(End of period) 2.36 Real savings deposits 2-7
2.10 Real total credit 2-4 (End of period)(End of period) 2.37 Number of new savings deposits 2-7
2.11 Nominal consumer credit 2-4 (During period)(End of period) 2.38 Total of amount of new savings deposits 2-7
2.12 Real consumer credit 2-4 (During period)(End of period) 2.39 Weighted average rate on interest on deposits 2-7
2.13 Number of new consumer credit 2-4 (During period)(During period) 2.40 Weighted average rate on interest on loans 2-7
2.14 Total amount of new consumer credit 2-4 (During period)(During period) 2.41 Interest rate margin 2-8
2.15 Nominal average new consumer credit per 2-4 (During period)lender (During period) 2.42 Weighted average yield on treasury bonds 2-8
2.16 Real average new consumer credit per 2-4 2.43 Weighted average yield on treasury bills 2-8lender (During period) 2.44 Gross business loans on a weekly basis 2-9
2.17 Nominal housing mortgages 2-5 2.45 Gross individual loans on a weekly basis 2-9(End of period)
2.18 Real housing mortgages 2-5 3 Public finance(End of period) 3.1 Government revenue 3-3
2.19 Number of new housing mortgages 2-5 3.2 Government expenditure 3-3(During period) 3.3 Government financial deficit (-) 3-3
2.20 Total amount of new housing mortgages 2-5 3.4 Government financial deficit (-) incl. change in 3-3(During period) unmet financing requirements
2.21 Nominal average new housing mortgages 2-5 3.5 Outstanding dometic government debt 3-3per lender (During period) 3.6 Outstanding foreign governmnet debt 3-3
2.22 Real average new housing mortgages 2-5 3.7 Outstanding government debt 3-3per lender (During period) 3.8 Outstanding government debt to GDP ratio 3-3
2.23 Nominal car loans 2-5 3.9 Taxes on income 3-4(End of period) 3.10 Taxes on commodities 3-4
2.24 Real car loans 2-5 3.11 Foreign exchange tax 3-4(End of period) 3.12 Nontax revenue 3-4
2.25 Nominal commercial loans 2-6 3.13 Wage expenditures 3-4(End of period) 3.14 Number of government employees 3-4
2.26 Real commercial loans 2-6 3.15 Goods and services 3-4(End of period) 3.16 Interest 3-4
2.27 Number of new commercial mortgages 2-6 3.17 Investments (Incl. development fund spending) 3-5(During period) 3.18 Transfer to AZV 3-5
2.28 Total amount of new commercial mortgages 2-6 3.19 Expenditure cash adjusted basis 3-5(During period)
2.29 Nominal average new commercial mortgages 2-6 4 External sectorper lender (During period) 4.1 Overall balance of payments 4-3
2.30 Real average new commercial mortgages 2-6 4.2 Overall balance of payments-Oil sector 4-3per lender (During period) 4.3 Overall balance of payments-Non-oil secter 4-3
2.31 Number of new commercial term loans 2-6 4.4 Current account 4-3(During period) 4.5 Current account-Oil sector 4-3
2.32 Total amount of new commercial term loans 2-6 4.6 Current account-Non-oil sector 4-3(During period) 4.7 Capital and financial account 4-3
2.33 Nominal average new commercial term loan 2-7 4.8 Capital and financial account-Oil sector 4-3per lender 4.9 Capital and financial account-Non-oil sector 4-4
4.10 Import payments of goods 4-4
4.11 Import payments of goods-Oil sector 4-4 7.5 Euro exchange rate (period average) 7-34.12 Import payments of goods-Non-oil sector 4-4 7.6 Consumer confidence index-USA 7-34.13 Import payments of services 4-4 7.7 Unemployment rate-USA 7-34.14 Import payments of services-Oil sector 4-4 7.8 USA index of leading economic indicators 7-34.15 Import payments of services-Non-oil sector 4-4 7.9 Gold prices 7-44.16 Import payments of goods and services 4-4 7.10 Food price index 7-44.17 Import payments of goods and services- 4-5
Oil sector4.18 Import payments of goods and services- 4-5
Non-oil sector4.19 Merchandise import coverage ratio 4-5
(End of period)4.20 Merchandise import coverage ratio 4-5
(Twelve-month average)4.21 Current account import coverage ratio 4-5
(End of period)4.22 Current account import coverage ratio 4-5
(Twelve-month average)
5 Macro prudential indicators5.1 Capital/risk-weighted assets ratio 5-35.2 Loan/deposit ratio 5-35.3 Prudential liquidity ratio 5-35.4 Nonperforming loans-commercial 5-4
current account5.5 Nonperforming loans-commercial term loans 5-45.6 Nonperforming loans-commercial mortgages 5-45.7 Nonperforming loans-individual mortgages 5-45.8 Nonperforming loans-individual other 5-45.9 Nonperforming loans-total loans 5-45.10 Commercial banks-nonperforming loans 5-4
(Monthly figures)5.11 Nonperforming loans - Commercial banks &
banklike institutions 5-5
6 Composite indicators6.1 Index monthly indicators of consumption 6-36.2 Index quarterly indicators of consumption 6-36.3 Index monthly indicators of investment 6-36.4 Index quarterly indicators of investment 6-36.5 Index of export indicators 6-36.6 Index of indicators of imports 6-36.7 Index of Economic Indicators 6-36.8 Partial economic activity index 6-36.9 Current business perception index 6-46.10 Short-term business perception index 6-46.11 Business perception index 6-4
7 International environment7.1 All commodities index-World 7-37.2 Non fuel commodity index-World 7-37.3 Energy index-World 7-37.4 Oil prices 7-3


1. Real sector


Chart 1.1 Chart 1.2Nominal turnover tax (BBO)
(Excl. receipts from Valero: June 2010 Afl. 211.6 million )
5.05.56.06.57.07.58.08.59.09.5
Jan Feb Mar Apr May Jun Jul Aug Sep Oct Nov Dec
2010 2011 2012 2013
In A
fl. m
illio
nReal turnover tax (BBO) - lagged one month
(In January 2007 prices)
4.44.85.25.66.06.46.87.27.68.0
Jan Feb Mar Apr May Jun Jul Aug Sep Oct Nov Dec
2010 2011 2012 2013
In A
fl. m
illio
n
Chart 1.3 Chart 1.4Nominal wage tax
12141618202224262830
Jan Feb Mar Apr May Jun Jul Aug Sep Oct Nov Dec
2010 2011 2012 2013
In A
fl. m
illio
n
Real wage tax - lagged one month(In January 2007 prices)
101214161820222426
Jan Feb Mar Apr May Jun Jul Aug Sep Oct Nov Dec
2010 2011 2012 2013
In A
fl. m
illio
n
1-3

Chart 1.5 Chart 1.6Inflation Aruba
(Twelve-month average)
-4.0
-2.0
0.0
2.0
4.0
6.0
Jan Feb Mar Apr May Jun Jul Aug Sep Oct Nov Dec
2010 2011 2012 2013
Perc
enta
ge c
hang
eInflation Aruba(End of period)
-6.0-4.0-2.00.02.04.06.08.0
Jan Feb Mar Apr May Jun Jul Aug Sep Oct Nov Dec
2010 2011 2012 2013
In p
erce
nt
Chart 1.7 Chart 1.8Inflation differential 12-month average and end of period
-10.0-8.0-6.0-4.0-2.00.02.04.06.08.0
Jan Feb Mar Apr May Jun Jul Aug Sep Oct Nov Dec
2010 2011 2012 2013
Perc
enta
ge p
oint
s
Inflation USA(Twelve-month average)
-0.50.00.51.01.52.02.53.03.5
Jan Feb Mar Apr May Jun Jul Aug Sep Oct Nov Dec
2010 2011 2012 2013
Perc
enta
ge c
hang
e
Chart 1.9 Chart 1.10Inflation differential Aruba with USA
(Twelve-month average)
-6.0-5.0-4.0-3.0-2.0-1.00.01.02.03.0
Jan Feb Mar Apr May Jun Jul Aug Sep Oct Nov Dec
2010 2011 2012 2013
Perc
enta
ge p
oint
s
Aruba inflation excluding energy and food (Twelve-month average)
-0.8-0.40.00.40.81.21.62.0
Jan Feb Mar Apr May Jun Jul Aug Sep Oct Nov Dec
2010 2011 2012 2013
Perc
enta
ge c
hang
e
Chart 1.11 Chart 1.12Aruba inflation excluding energy
(Twelve-month average)
-1.2-0.8-0.40.00.40.81.21.62.02.4
Jan Feb Mar Apr May Jun Jul Aug Sep Oct Nov Dec
2010 2011 2012 2013
Perc
enta
ge c
hang
e
USA inflation excluding energy(Twelve-month average)
0.81.01.21.41.61.82.02.22.42.6
Jan Feb Mar Apr May Jun Jul Aug Sep Oct Nov Dec
2010 2011 2012 2013
Perc
enta
ge c
hang
e
1-4

Chart 1.13 Chart 1.14Aruba - Food and non-alcoholic beverages - Weight 1,489
(Twelve-month average)
-0.6-0.4-0.20.00.20.40.60.8
Jan Feb Mar Apr May Jun Jul Aug Sep Oct Nov Dec
2010 2011 2012 2013
Perc
enta
ge c
hang
eAruba - Housing - Weight 1,815
(Twelve-month average)
-4.0-3.0-2.0-1.00.01.02.03.04.0
Jan Feb Mar Apr May Jun Jul Aug Sep Oct Nov Dec
2010 2011 2012 2013
Perc
enta
ge c
hang
e
Chart 1.15 Chart 1.16Aruba - Household operation - Weight 980
(Twelve-month average)
-0.40
-0.30
-0.20
-0.10
0.00
0.10
0.20
Jan Feb Mar Apr May Jun Jul Aug Sep Oct Nov Dec
2010 2011 2012 2013
Perc
enta
ge c
hang
e
Aruba - Transport - Weight 1,741(Twelve-month average)
-1.2-0.8-0.40.00.40.81.21.6
Jan Feb Mar Apr May Jun Jul Aug Sep Oct Nov Dec
2010 2011 2012 2013
Perc
enta
ge c
hang
e
Chart 1.17 Chart 1.18Aruba - Food component - Weight 1,263
(Twelve-month average)
-0.6-0.4-0.20.00.20.40.60.8
Jan Feb Mar Apr May Jun Jul Aug Sep Oct Nov Dec
2010 2011 2012 2013
Perc
enta
ge c
hang
e
USA - Food component(Twelve-month average)
-0.2-0.10.00.10.20.30.40.5
Jan Feb Mar Apr May Jun Jul Aug Sep Oct Nov Dec
2010 2011 2012 2013
Perc
enta
ge c
hang
e
Chart 1.19Aruba - Maintenance and repair of the dwelling - Weight 504
(Twelve-month average)
-0.24-0.20-0.16-0.12-0.08-0.040.000.040.080.12
Jan Feb Mar Apr May Jun Jul Aug Sep Oct Nov Dec
2010 2011 2012 2013
Perc
enta
ge c
hang
e
1-5

Chart 1.20 Chart 1.21Unemployment rate
8.68.89.09.29.49.69.8
10.010.210.410.610.8
2010 III 2011 IV 2012 IV
2010 2011 2012
In p
erce
ntag
eSeverance insurance payments
0
200
400
600
800
1,000
I II III IV
2010 2011 2012 2013
In A
fl. th
ousa
nd
Chart 1.22 Chart 1.23Worker's remittances payments
252626262728282829303030
I II III IV
2010 2011 2012 2013
In A
fl. m
illio
n
Population
101.0101.5102.0102.5103.0103.5104.0104.5105.0105.5
I II III IV
2010 2011 2012
In th
ousa
nd
Chart 1.24 Chart 1.25AOV/AWW-receipts
10
12
14
16
18
20
22
24
Jan Feb Mar Apr May Jun Jul Aug Sep Oct Nov Dec
2010 2011 2012 2013
In A
fl. m
illio
n
AZV-receipts
12
14
16
18
20
2224
26
Jan Feb Mar Apr May Jun Jul Aug Sep Oct Nov Dec
2010 2011 2012 2013
In A
fl. m
illio
n
1-6

Chart 1.26 Chart 1.27Stay-over visitors
556065707580859095
Jan Feb Mar Apr May Jun Jul Aug Sep Oct Nov Dec
2010 2011 2012 2013
Num
ber
of v
isito
rs in
thou
sand
Visitor's nights
400440480520560600640680720760
Jan Feb Mar Apr May Jun Jul Aug Sep Oct Nov Dec
2010 2011 2012 2013
Num
ber
of v
isito
r's n
ight
s in
thou
sand
Chart 1.28 Chart 1.29Airport arrivals corrected for resident arrivals
556065707580859095
Jan Feb Mar Apr May Jun Jul Aug Sep Oct Nov Dec
2010 2011 2012 2013
Num
ber
of a
rriv
als i
n th
ousa
nd
Resident arrivals
3456789
101112
Jan Feb Mar Apr May Jun Jul Aug Sep Oct Nov Dec
2010 2011 2012 2013
Num
ber
of a
rriv
als i
n th
ousa
nd
Chart 1.30 Chart 1.31Airline load factor
(Including transfer, transit, diplomats, inactive crew etc.)
666870727476788082
Jan Feb Mar Apr May Jun Jul Aug Sep Oct Nov Dec
2010 2011 2012 2013
In p
erce
nt o
f tot
al se
ats
Average nights stayed
6.4
6.8
7.2
7.6
8.0
8.48.8
9.2
Jan Feb Mar Apr May Jun Jul Aug Sep Oct Nov Dec
2010 2011 2012 2013
Ave
rage
day
s
Chart 1.32 Chart 1.33Cruise passengers
0
20
40
60
80
100120
140
Jan Feb Mar Apr May Jun Jul Aug Sep Oct Nov Dec
2010 2011 2012 2013
Pass
enge
rs in
thou
sand
s
Ship calls
0
10
20
30
40
5060
70
Jan Feb Mar Apr May Jun Jul Aug Sep Oct Nov Dec
2010 2011 2012 2013
Ship
cal
ls
1-7

Chart 1.34 Chart 1.35Occupancy rate - total
64
68
72
76
80
8488
92
Jan Feb Mar Apr May Jun Jul Aug Sep Oct Nov Dec
2010 2011 2012 2013
In p
erce
ntOccupancy rate - hotels
60
64
68
72
76
8084
88
Jan Feb Mar Apr May Jun Jul Aug Sep Oct Nov Dec
2010 2011 2012 2013
In p
erce
nt
Chart 1.36Occupancy rate - timeshare
68
72
76
80
84
88
92
Jan Feb Mar Apr May Jun Jul Aug Sep Oct Nov Dec
2010 2011 2012 2013
In p
erce
nt
1-8

Chart 1.37 Chart 1.38Nominal revenue per available room - total
80100120140160180200220240
Jan Feb Mar Apr May Jun Jul Aug Sep Oct Nov Dec
2010 2011 2012 2013
In A
fl.Real revenue per available room - total
(In January 2007 prices)
6080
100120140160180200220
Jan Feb Mar Apr May Jun Jul Aug Sep Oct Nov Dec
2010 2011 2012 2013
In A
fl.
Chart 1.39 Chart 1.40Nominal revenue per available room - hotels
120160200240280320360400440
Jan Feb Mar Apr May Jun Jul Aug Sep Oct Nov Dec
2010 2011 2012 2013
In A
fl.
Real revenue per available room - hotels(In January 2007 prices)
120
160
200
240
280
320
360
Jan Feb Mar Apr May Jun Jul Aug Sep Oct Nov Dec
2010 2011 2012 2013
In A
fl.
Chart 1.41 Chart 1.42Nominal revenue per available room - timeshare
15202530354045505560
Jan Feb Mar Apr May Jun Jul Aug Sep Oct Nov Dec
2010 2011 2012 2013
In A
fl.
Real revenue per available room - timeshare(In January 2007 prices)
12162024283236404448
Jan Feb Mar Apr May Jun Jul Aug Sep Oct Nov Dec
2010 2011 2012 2013
In A
fl.
Chart 1.43 Chart 1.44Nominal average daily rate - total
200240280320360400440480520
Jan Feb Mar Apr May Jun Jul Aug Sep Oct Nov Dec
2010 2011 2012 2013
In A
fl.
Real average daily rate - total(In January 2007 prices)
160200240280320360400440
Jan Feb Mar Apr May Jun Jul Aug Sep Oct Nov Dec
2010 2011 2012 2013
In A
fl.
1-9

Chart 1.45 Chart 1.46Nominal average daily rate - hotel
200240280320360400440480520
Jan Feb Mar Apr May Jun Jul Aug Sep Oct Nov Dec
2010 2011 2012 2013
In A
fl.Real average daily rate - hotel
(In January 2007 prices)
160200240280320360400440
Jan Feb Mar Apr May Jun Jul Aug Sep Oct Nov Dec
2010 2011 2012 2013
In A
fl.
Chart 1.47 Chart 1.48Nominal average daily rate - timeshare
200
240
280
320
360
400440
480
Jan Feb Mar Apr May Jun Jul Aug Sep Oct Nov Dec
2010 2011 2012 2013
In A
fl.
Real average daily rate - timeshare(In January 2007 prices)
160200240280320360400440
Jan Feb Mar Apr May Jun Jul Aug Sep Oct Nov Dec
2010 2011 2012 2013
In A
fl.
1-10

Chart 1.49 Chart 1.50Nominal tourism receipts
480520560600640680720760800
I II III IV
2010 2011 2012 2013
In A
fl. m
illio
nReal tourism receipts
(In the first quarter of 2007 prices)
400440480520560600640680720
I II III IV
2010 2011 2012 2013
In A
fl. m
illio
n
Chart 1.51 Chart 1.52Nominal tourism expenditure
320
340
360
380
400
420
440
I II III IV
2010
In A
fl. m
illio
n
Real tourism expenditure(In the first quarter of 2007 prices)
280
300
320
340
360
380
400
I II III IV
2010 2011 2012 2013
In A
fl. m
illio
n
Chart 1.53 Chart 1.54Nominal tourism receipts
(Commercial banks and CBA)
100120140160180200220240
Jan Feb Mar Apr May Jun Jul Aug Sep Oct Nov Dec
2010 2011 2012 2013
In A
fl. m
illio
n
Real tourism receipts - commercial banks and CBA(In January 2007 prices)
100
120
140
160
180
200
220
Jan Feb Mar Apr May Jun Jul Aug Sep Oct Nov Dec
2010 2011 2012 2013
In A
fl.
Chart 1.55 Chart 1.56Nominal hotel room tax/Tourist Levy
2.02.53.03.54.04.55.05.56.06.57.07.5
Jan Feb Mar Apr May Jun Jul Aug Sep Oct Nov Dec
2010 2011 2012 2013
In A
fl. m
illio
n
Real hotel room tax/Tourist levy - lagged one month(In January 2007 prices)
2.02.53.03.54.04.55.05.56.06.5
Jan Feb Mar Apr May Jun Jul Aug Sep Oct Nov Dec
2010 2011 2012 2013
In A
fl. m
illio
n
1-11
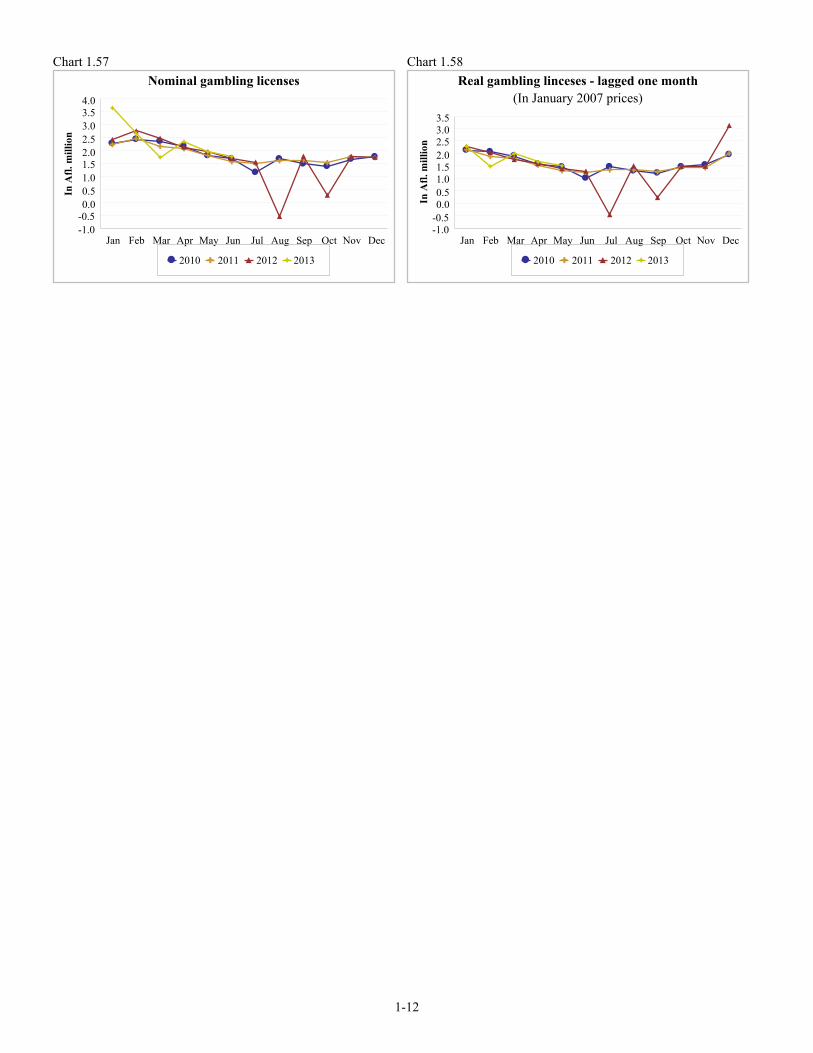
Chart 1.57 Chart 1.58Nominal gambling licenses
-1.0-0.50.00.51.01.52.02.53.03.54.0
Jan Feb Mar Apr May Jun Jul Aug Sep Oct Nov Dec
2010 2011 2012 2013
In A
fl. m
illio
nReal gambling linceses - lagged one month
(In January 2007 prices)
-1.0-0.50.00.51.01.52.02.53.03.5
Jan Feb Mar Apr May Jun Jul Aug Sep Oct Nov Dec
2010 2011 2012 2013
In A
fl. m
illio
n
1-12

Chart 1.59 Chart 1.60Water
(Household)
400420440460480500520540560580
Jan Feb Mar Apr May Jun Jul Aug Sep Oct Nov Dec
2010 2011 2012 2013
In th
ousa
nd m
3Electricity
(Household)
6062646668707274767880
I II III IV
2010 2011 2012 2013
In K
WH
mill
ion
Chart 1.61 Chart 1.62Gas
(Household)
450500550600650700750800850900950
Jan Feb Mar Apr May Jun Jul Aug Sep Oct Nov Dec
2010 2011 2012 2013
In th
ousa
nd p
ound
Container transport ASTEC
800900
1,0001,1001,2001,3001,4001,5001,600
Jan Feb Mar Apr May Jun Jul Aug Sep Oct Nov Dec
2010 2011 2012 2013
Tot
al c
onta
iner
s
Chart 1.63 Chart 1.64Unleaded premium gasoline prices
180190200210220230240250260
Jan Feb Mar Apr May Jun Jul Aug Sep Oct Nov Dec
2010 2011 2012 2013
In c
ents
per
lite
r
Diesel prices
150160170180190200210220230
Jan Feb Mar Apr May Jun Jul Aug Sep Oct Nov Dec
2010 2011 2012 2013
In c
ents
per
lite
r
Chart 1.65 Chart 1.66New commercial water connection
0
10
20
30
40
5060
70
Jan Feb Mar Apr May Jun Jul Aug Sep Oct Nov Dec
2010 2011 2012 2013
Tot
al
New commercial water disconnection
0
10
20
30
40
50
60
Jan Feb Mar Apr May Jun Jul Aug Sep Oct Nov Dec
2010 2011 2012 2013
Tot
al
1-13

Chart 1.67Index of construction
(Twelve-month average)
56.060.064.068.072.076.080.084.088.0
I II III IV
2010 2011 2012 2013
1-14

2. Monetary sector


Chart 2.1 Chart 2.2Nominal money supply
(End of period)
3,1003,1503,2003,2503,3003,3503,4003,4503,5003,550
Jan Feb Mar Apr May Jun Jul Aug Sep Oct Nov Dec
2010 2011 2012 2013
In A
fl. m
illio
nReal money supply
(In January 2007 prices, end of period)
2,6002,6502,7002,7502,8002,8502,9002,9503,0003,0503,100
Jan Feb Mar Apr May Jun Jul Aug Sep Oct Nov Dec
2010 2011 2012 2013
In A
fl. m
illio
n
Chart 2.3 Chart 2.4Nominal net domestic assets
(End of period)
1,6001,7001,8001,9002,0002,1002,2002,300
Jan Feb Mar Apr May Jun Jul Aug Sep Oct Nov Dec
2010 2011 2012 2013
In A
fl. m
illio
n
Real net domestic assets(In January 2007 prices, end of period)
1,4501,5001,5501,6001,6501,7001,7501,8001,8501,9001,950
Jan Feb Mar Apr May Jun Jul Aug Sep Oct Nov Dec
2010 2011 2012 2013
In A
fl. m
illio
n
Chart 2.5 Chart 2.6Nominal net foreign assets-Incl. revaluation differences
(End of period)
1,2001,2501,3001,3501,4001,4501,5001,5501,6001,6501,7001,750
Jan Feb Mar Apr May Jun Jul Aug Sep Oct Nov Dec
2010 2011 2012 2013
In A
fl. m
illio
n
Real net foreign assets-Incl. revaluation differences(In January 2007 prices, end of period)
1,0001,0501,1001,1501,2001,2501,3001,3501,4001,4501,5001,550
Jan Feb Mar Apr May Jun Jul Aug Sep Oct Nov Dec
2010 2011 2012 2013
In A
fl. m
illio
n
Chart 2.7 Chart 2.8Nominal net foreign assets-Excl. revaluation differences
(End of period)
1,000
1,100
1,200
1,300
1,400
1,500
1,600
Jan Feb Mar Apr May Jun Jul Aug Sep Oct Nov Dec
2010 2011 2012 2013
In A
fl. m
illio
n
Real net foreign assets-Excl. revaluation differences(In January 2007 prices, end of period)
800900
1,0001,1001,2001,3001,400
Jan Feb Mar Apr May Jun Jul Aug Sep Oct Nov Dec
2010 2011 2012 2013
In A
fl. m
illio
n
2-3

Chart 2.9 Chart 2.10Nominal total credit
(End of period)
2,600
2,700
2,800
2,900
3,000
3,100
3,200
Jan Feb Mar Apr May Jun Jul Aug Sep Oct Nov Dec
2010 2011 2012 2013
In A
fl. m
illio
nReal total credit
(In January 2007 prices, end of period)
2,3002,3502,4002,4502,5002,5502,6002,6502,7002,750
Jan Feb Mar Apr May Jun Jul Aug Sep Oct Nov Dec
2010 2011 2012 2013
In A
fl. m
illio
n
Chart 2.11 Chart 2.12Nominal consumer credit
(End of period)
555560565570575580585590595600605
Jan Feb Mar Apr May Jun Jul Aug Sep Oct Nov Dec
2010 2011 2012 2013
In A
fl. m
illio
n
Real consumer credit(In January 2007 prices, end of period)
470480490500510520530540
Jan Feb Mar Apr May Jun Jul Aug Sep Oct Nov Dec
2010 2011 2012 2013
In A
fl. m
illio
n
Chart 2.13 Chart 2.14Number of new consumer credit
(During period)
200
400
600
800
1,000
1,200
1,400
Jan Feb Mar Apr May Jun Jul Aug Sep Oct Nov Dec
2010 2011 2012 2013
Total amount of new consumer credit(During period)
68
10121416182022242628
Jan Feb Mar Apr May Jun Jul Aug Sep Oct Nov Dec
2010 2011 2012 2013
In A
fl. m
illio
n
Chart 2.15 Chart 2.16Nominal average new consumer credit per loan granted
(During period)
161820222426283032
Jan Feb Mar Apr May Jun Jul Aug Sep Oct Nov Dec
2010 2011 2012 2013
In A
fl. th
ousa
nd
Real average new concumer credit per loan granted(In January 2007 prices, during period)
1416182022242628
Jan Feb Mar Apr May Jun Jul Aug Sep Oct Nov Dec
2010 2011 2012 2013
In A
fl. th
ousa
nd
2-4

Chart 2.17 Chart 2.18Nominal housing mortgages
(End of period)
800820840860880900920940960980
Jan Feb Mar Apr May Jun Jul Aug Sep Oct Nov Dec
2010 2011 2012 2013
In A
fl. m
illio
nReal housing mortgages
(In January 2007 prices, end of period)
720
740
760
780
800
820
840
Jan Feb Mar Apr May Jun Jul Aug Sep Oct Nov Dec
2010 2011 2012 2013
In A
fl. m
illio
n
Chart 2.19 Chart 2.20Number of new housing mortgages
(During period)
20
40
60
80
100
120
140
Jan Feb Mar Apr May Jun Jul Aug Sep Oct Nov Dec
2010 2011 2012 2013
Total amount of new housing mortgages(During period)
468
1012141618202224
Jan Feb Mar Apr May Jun Jul Aug Sep Oct Nov Dec
2010 2011 2012 2013
In A
fl. m
illio
n
Chart 2.21 Chart 2.22Nominal average new housing mortgages per loan
granted(During period)
120140160180200220240260
Jan Feb Mar Apr May Jun Jul Aug Sep Oct Nov Dec
2010 2011 2012 2013
In A
fl. th
ousa
nd
Real average new housing mortgages per loan granted(In January 2007 prices, during period)
100
120
140
160
180
200
220
Jan Feb Mar Apr May Jun Jul Aug Sep Oct Nov Dec
2010 2011 2012 2013
In A
fl. th
ousa
nd
Chart 2.23 Chart 2.24Nominal car loans
(End of period)
156160164168172176180184
Jan Feb Mar Apr May Jun Jul Aug Sep Oct Nov Dec
2010 2011 2012 2013
In A
fl. m
illio
n
Real car loans(In January 2007 prices, end of period)
128132136140144148152156160164
Jan Feb Mar Apr May Jun Jul Aug Sep Oct Nov Dec
2010 2011 2012 2013
In A
fl. m
illio
n
2-5

Chart 2.25 Chart 2.26Nominal commercial loans
(End of period)
1,0401,0801,1201,1601,2001,2401,2801,320
Jan Feb Mar Apr May Jun Jul Aug Sep Oct Nov Dec
2010 2011 2012 2013
In A
fl. m
illio
nReal commercial loans
(In January 2007 prices, end of period)
880
920
960
1,000
1,040
1,080
1,120
Jan Feb Mar Apr May Jun Jul Aug Sep Oct Nov Dec
2010 2011 2012 2013
In A
fl. m
illio
n
Chart 2.27 Chart 2.28Number of new commercial mortgages
(During period)
02468
10121416
Jan Feb Mar Apr May Jun Jul Aug Sep Oct Nov Dec
2010 2011 2012 2013
Total amount of new commercial mortgages(During period)
048
121620242832
Jan Feb Mar Apr May Jun Jul Aug Sep Oct Nov Dec
2010 2011 2012 2013
In A
fl. m
illio
n
Chart 2.29 Chart 2.30Nominal average new commercial mortgages per loan
granted(During period)
0500
1,0001,5002,0002,5003,0003,5004,0004,5005,000
Jan Feb Mar Apr May Jun Jul Aug Sep Oct Nov Dec
2010 2011 2012 2013
In A
fl. th
ousa
nd
Real average new commercial mortgages per loan granted
(In January 2007 prices, during period)
0500
1,0001,5002,0002,5003,0003,5004,0004,500
Jan Feb Mar Apr May Jun Jul Aug Sep Oct Nov Dec
2010 2011 2012 2013
In A
fl. th
ousa
nd
Chart 2.31 Chart 2.32Number of new commercial term loans
(During period)
020406080
100120140
Jan Feb Mar Apr May Jun Jul Aug Sep Oct Nov Dec
2010 2011 2012 2013
Total amount of new commercial term loans(During period)
05
101520253035
Jan Feb Mar Apr May Jun Jul Aug Sep Oct Nov Dec
2010 2011 2012 2013
In A
fl. m
illio
n
2-6

Chart 2.33 Chart 2.34Nominal average new commercial term loan per loan
granted(During period)
0
200
400
600
800
1,000
Jan Feb Mar Apr May Jun Jul Aug Sep Oct Nov Dec
2010 2011 2012 2013
In A
fl. th
ousa
ndReal average new commercial term loan per loan granted
(In January 2007 prices, during period)
0100200300400500600700800
Jan Feb Mar Apr May Jun Jul Aug Sep Oct Nov Dec
2010 2011 2012 2013
In A
fl. th
ousa
nd
Chart 2.35 Chart 2.36Nominal savings deposits
(End of period)
820840860880900920940960
Jan Feb Mar Apr May Jun Jul Aug Sep Oct Nov Dec
2010 2011 2012 2013
In A
fl. m
illio
n
Real savings deposit(In January 2007 prices, end of period)
720
740
760
780
800
820
840
Jan Feb Mar Apr May Jun Jul Aug Sep Oct Nov Dec
2010 2011 2012 2013
In A
fl. m
illio
n
Chart 2.37 Chart 2.38Number of new savings deposits
(During period)
300350400450500550600650700
Jan Feb Mar Apr May Jun Jul Aug Sep Oct Nov Dec
2010 2011 2012 2013
Total amount of new savings deposits(During period)
12345678
Jan Feb Mar Apr May Jun Jul Aug Sep Oct Nov Dec
2010 2011 2012 2013
In A
fl. m
illio
n
Chart 2.39 Chart 2.40Weighted average rate of interest on deposits
(During period)
0.51.01.52.02.53.03.54.04.5
Jan Feb Mar Apr May Jun Jul Aug Sep Oct Nov Dec
2010 2011 2012 2013
In p
erce
nt
Weighted average rate of interest on loans(During period)
7.58.08.59.09.5
10.010.511.011.512.0
Jan Feb Mar Apr May Jun Jul Aug Sep Oct Nov Dec
2010 2011 2012 2013
In p
erce
nt
2-7

Chart 2.41 Chart 2.42Interest rate margin
(During period)
5.56.06.57.07.58.08.59.09.5
Jan Feb Mar Apr May Jun Jul Aug Sep Oct Nov Dec
2010 2011 2012 2013
In p
erce
ntWeighted average yield on treasury bonds
4.24.44.64.85.05.25.45.65.86.06.26.4
Jan Feb Mar Apr May Jun Jul Aug Sep Oct Nov Dec
2010 2011 2012 2013
Chart 2.43Weighted average yield on treasury bills
0.00.40.81.21.62.02.42.83.2
Jan Feb Mar Apr May Jun Jul Aug Sep Oct Nov Dec2010
Jan Feb Mar Apr May Jun Jul Aug Sep Oct Nov Dec2011
Jan Feb Mar AprMay Jun Jul Aug Sep Oct NovDec2012
Jan Feb Mar Apr May Jun2013
Advance rate Weighted average yield on 3-month treasury bills
2-8

Chart 2.44Gross business loans on a weekly basis
1,040
1,080
1,120
1,160
1,200
1,240
1,280
1 2 3 4 5 6 7 8 9 10 11 12 13 14 15 16 17 18 19 20 21 22 23 24 25 26 27 28 29 30 31 32 33 34 35 36 37 38 39 40 41 42 43 44 45 46 47 48 49 50 51 52
2010 2011 2012 2013
In A
fl. m
illio
n
Chart 2.45Gross individual loans on a weekly basis
1,400
1,420
1,440
1,460
1,480
1,500
1,520
1,540
1,560
1 2 3 4 5 6 7 8 9 10 11 12 13 14 15 16 17 18 19 20 21 22 23 24 25 26 27 28 29 30 31 32 33 34 35 36 37 38 39 40 41 42 43 44 45 46 47 48 49 50 51 52
2010 2011 2012 2013
In A
fl. m
illio
n
2-9


3. Public finance

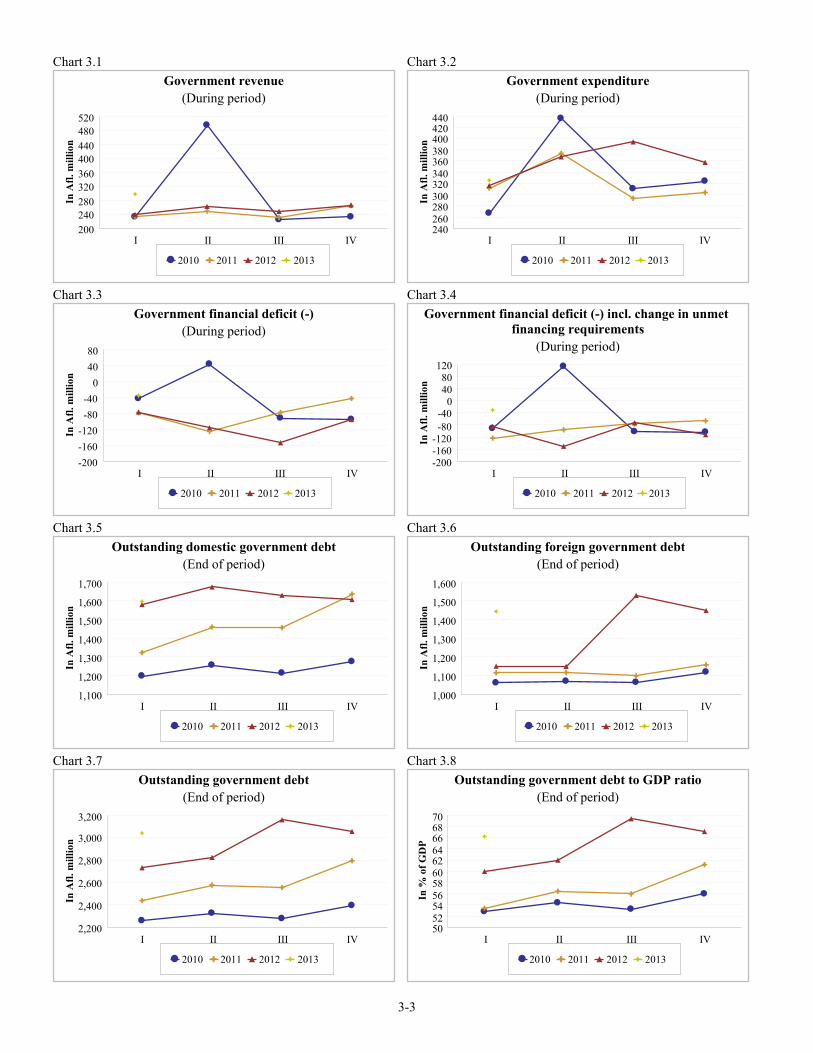
Chart 3.1 Chart 3.2Government revenue
(During period)
200240280320360400440480520
I II III IV
2010 2011 2012 2013
In A
fl. m
illio
nGovernment expenditure
(During period)
240260280300320340360380400420440
I II III IV
2010 2011 2012 2013
In A
fl. m
illio
n
Chart 3.3 Chart 3.4Government financial deficit (-)
(During period)
-200-160-120
-80-40
04080
I II III IV
2010 2011 2012 2013
In A
fl. m
illio
n
Government financial deficit (-) incl. change in unmet financing requirements
(During period)
-200-160-120
-80-40
04080
120
I II III IV
2010 2011 2012 2013
In A
fl. m
illio
n
Chart 3.5 Chart 3.6Outstanding domestic government debt
(End of period)
1,100
1,200
1,300
1,400
1,500
1,600
1,700
I II III IV
2010 2011 2012 2013
In A
fl. m
illio
n
Outstanding foreign government debt(End of period)
1,000
1,100
1,200
1,300
1,400
1,500
1,600
I II III IV
2010 2011 2012 2013
In A
fl. m
illio
n
Chart 3.7 Chart 3.8Outstanding government debt
(End of period)
2,200
2,400
2,600
2,800
3,000
3,200
I II III IV
2010 2011 2012 2013
In A
fl. m
illio
n
Outstanding government debt to GDP ratio(End of period)
5052545658606264666870
I II III IV
2010 2011 2012 2013
In %
of G
DP
3-3

Chart 3.9 Chart 3.10Taxes on income(During period)
-4-3-2-10123
Jan Feb Mar Apr May Jun Jul Aug Sep Oct Nov Dec
2010 2011 2012 2013
In A
fl. m
illio
nTaxes on commodities
(During period)
812162024283236
Jan Feb Mar Apr May Jun Jul Aug Sep Oct Nov Dec
2010 2011 2012 2013
In A
fl. m
illio
n
Chart 3.11 Chart 3.12Foreign exchange tax
(During period)
123456789
Jan Feb Mar Apr May Jun Jul Aug Sep Oct Nov Dec
2010 2011 2012 2013
In A
fl. m
illio
n
Nontax revenue(During period)
05
1015202530354045
Jan Feb Mar Apr May Jun Jul Aug Sep Oct Nov Dec
2010 2011 2012 2013
In A
fl. m
illio
n
Chart 3.13 Chart 3.14Wage expenditures - consisting of wages, employer's
contribution and wage subsidies(During period)
130140150160170180190
I II III IV
2010 2011 2012 2013
In A
fl. m
illio
n
Number of government employees(End of period)
4,0404,0604,0804,1004,1204,1404,1604,1804,2004,2204,240
I II III IV
2010 2011 2012 2013
Chart 3.15 Chart 3.16Goods and services
(During period)
354045505560657075
I II III IV
2010 2011 2012 2013
In A
fl. m
illio
n
Interest(During period)
202428323640444852
I II III IV
2010 2011 2012 2013
In A
fl. m
illio
n
3-4

Chart 3.17 Chart 3.18Investments (incl. development fund spending)
(During period)
81216202428323640
I II III IV
2010 2011 2012 2013
In A
fl. m
illio
nTransfer to AZV(During period)
010203040506070
I II III IV
2010 2011 2012 2013
In A
fl. m
illio
n
Chart 3.19Expenditure on a cash adjusted basis
(During period)
280300320340360380400420
I II III IV
2010 2011 2012 2013
In A
fl. m
illio
n
3-5


4. External sector


Chart 4.1 Chart 4.2Overall balance of payments
-200
-100
0
100
200
300
400
I II III IV
2010 2011 2012 2013
In A
fl. m
illio
nOverall balance of payments - oil sector
-160-140-120-100
-80-60-40-20
020
I II III IV
2010 2011 2012 2013
In A
fl. m
illio
n
Chart 4.3 Chart 4.4Overall balance of payments - non-oil sector
-200
-100
0
100
200
300400
500
I II III IV
2010 2011 2012 2013
In A
fl. m
illio
n
Current account
-600
-400
-200
0
200
400
I II III IV
2010 2011 2012 2013
In A
fl. m
illio
n
Chart 4.5 Chart 4.6Current account - oil sector
-600
-400
-200
0
200
400
600
I II III IV
2010 2011 2012 2013
In A
fl. m
illio
n
Current account - non-oil sector
-400
-300
-200
-100
0
100
200
I II III IV
2010 2011 2012 2013
In A
fl. m
illio
n
Chart 4.7 Chart 4.8Capital and financial account
-600
-400
-200
0
200
400
600
I II III IV
2010 2011 2012 2013
In A
fl. m
illio
n
Capital and financial account - oil sector
-600
-400
-200
0
200
400
600
I II III IV
2010 2011 2012 2013
In A
fl. m
illio
n
4-3

Chart 4.9 Chart 4.10Capital and financial account - non-oil sector
-200
-100
0
100
200
300400
500
I II III IV
2010 2011 2012 2013
In A
fl. m
illio
nImport payments of goods
0500
1,0001,5002,0002,5003,0003,5004,000
I II III IV
2010 2011 2012 2013
In A
fl. m
illio
n
Chart 4.11 Chart 4.12Import payments of goods - oil sector
0400800
1,2001,6002,0002,4002,8003,200
I II III IV
2010 2011 2012 2013
In A
fl. m
illio
n
Import payments of goods - non-oil sector
320340360380400420440460480500520
I II III IV
2010 2011 2012 2013
In A
fl. m
illio
n
Chart 4.13 Chart 4.14Import payments of services
260280300320340360380400420
I II III IV
2010 2011 2012 2013
In A
fl. m
illio
n
Import payments of services - oil sector
0
10
20
30
40
5060
70
I II III IV
2010 2011 2012 2013
In A
fl. m
illio
n
Chart 4.15 Chart 4.16Import payments of services - non-oil sector
260
280
300
320
340
360380
400
I II III IV
2010 2011 2012 2013
In A
fl. m
illio
n
Import payments of goods and services
5001,0001,5002,0002,5003,0003,5004,0004,500
I II III IV
2010 2011 2012 2013
In A
fl. m
illio
n
4-4
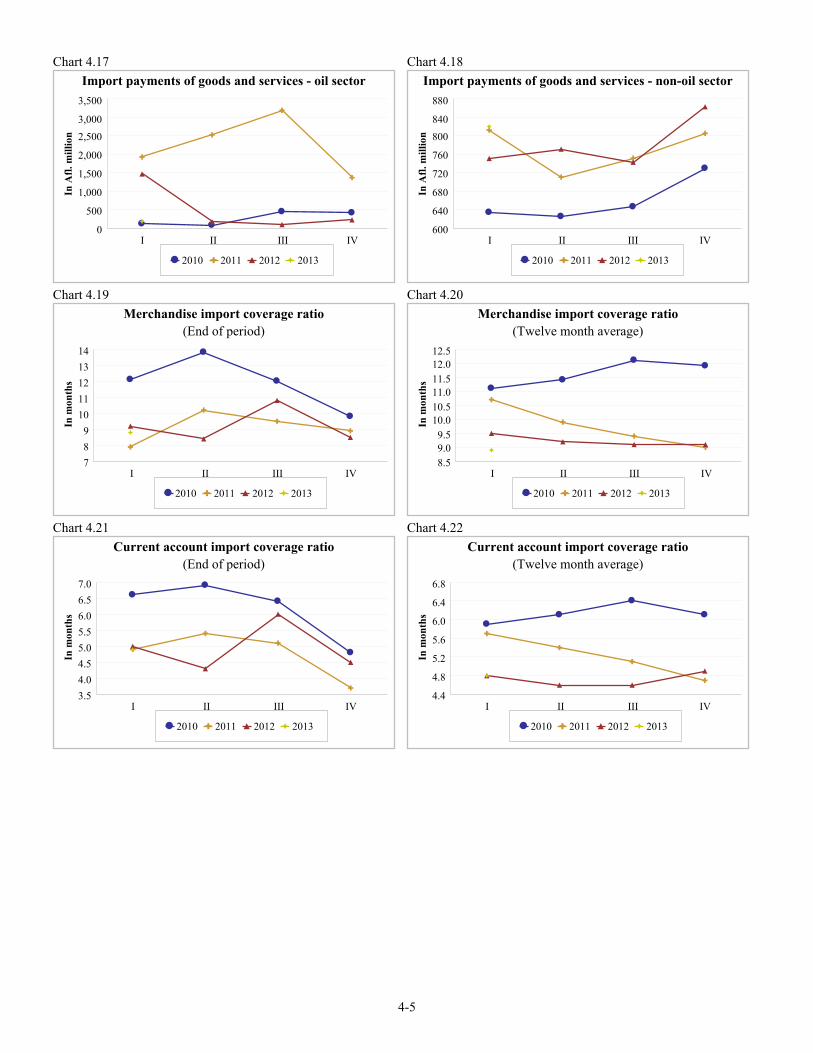
Chart 4.17 Chart 4.18Import payments of goods and services - oil sector
0
500
1,000
1,500
2,000
2,5003,000
3,500
I II III IV
2010 2011 2012 2013
In A
fl. m
illio
nImport payments of goods and services - non-oil sector
600
640
680
720
760
800840
880
I II III IV
2010 2011 2012 2013
In A
fl. m
illio
n
Chart 4.19 Chart 4.20Merchandise import coverage ratio
(End of period)
789
1011121314
I II III IV
2010 2011 2012 2013
In m
onth
s
Merchandise import coverage ratio(Twelve month average)
8.59.09.5
10.010.511.011.512.012.5
I II III IV
2010 2011 2012 2013
In m
onth
s
Chart 4.21 Chart 4.22Current account import coverage ratio
(End of period)
3.54.04.55.05.56.06.57.0
I II III IV
2010 2011 2012 2013
In m
onth
s
Current account import coverage ratio(Twelve month average)
4.4
4.8
5.2
5.6
6.0
6.4
6.8
I II III IV
2010 2011 2012 2013
In m
onth
s
4-5


5. Macroprudential indicators

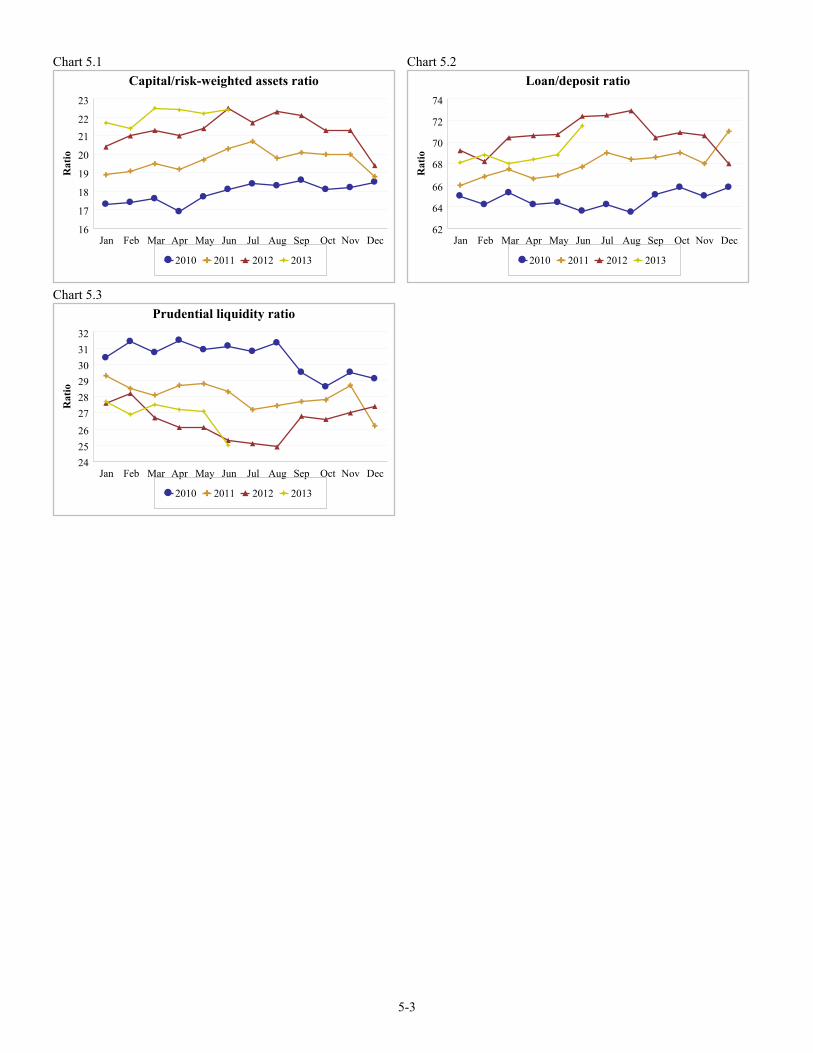
Chart 5.1 Chart 5.2Capital/risk-weighted assets ratio
16
17
18
19
20
2122
23
Jan Feb Mar Apr May Jun Jul Aug Sep Oct Nov Dec
2010 2011 2012 2013
Rat
ioLoan/deposit ratio
62
64
66
68
70
72
74
Jan Feb Mar Apr May Jun Jul Aug Sep Oct Nov Dec
2010 2011 2012 2013
Rat
io
Chart 5.3Prudential liquidity ratio
242526272829303132
Jan Feb Mar Apr May Jun Jul Aug Sep Oct Nov Dec
2010 2011 2012 2013
Rat
io
5-3

Chart 5.4 Chart 5.5Nonperforming loans-commercial current account
Commercial banks
15.016.017.018.019.020.021.022.023.024.0
I II III IV
2010 2011 2012 2013
In p
erce
ntNonperforming loans-commercial term loans
Commercial banks
2.04.06.08.0
10.012.014.016.0
I II III IV
2010 2011 2012 2013
In p
erce
nt
Chart 5.6 Chart 5.7Nonperforming loans-commercial mortgages
Commercial banks
6.08.0
10.012.014.016.018.020.0
I II III IV
2010 2011 2012 2013
In p
erce
nt
Nonperforming loans-individuals mortgageCommercial banks
3.43.63.84.04.24.44.64.85.0
I II III IV
2010 2011 2012 2013
In p
erce
nt
Chart 5.8 Chart 5.9Nonperforming loans-individual other
Commercial banks
6.87.27.68.08.48.89.29.6
10.0
I II III IV
2010 2011 2012 2013
In p
erce
nt
Nonperforming loans-total loansCommercial banks
6.57.07.58.08.59.09.5
10.010.511.0
I II III IV
2010 2011 2012 2013
In p
erce
nt
Chart 5.10Commercial banks - nonperforming loans
(Monthly figures)
0.0
4.0
8.0
12.0
16.0
20.0
24.0
Jan Mar May Jul Sep Nov2010
Jan Mar May Jul Sep Nov2011
Jan Mar May Jul Sep Nov2012
Jan Mar May Jul Sep Nov2013
Commercial current accountCommercial term loanCommercial mortgagesIndividual mortgagesIndividual otherTotal gross loans
In p
erce
nt
5-4

Chart 5.11Nonperforming loans
Commercial banks & banklike institutions
0.04.08.0
12.016.020.024.028.032.0
I II III IV2010
I II III IV2011
I II III IV2012
I2013
Commercial current accountCommercial term loanCommercial mortgagesIndividual mortgagesIndividual otherTotal gross loans
In p
erce
nt
5-5


6. Composite indicators


Chart 6.1 Chart 6.2Index monthly indicators of consumption
16
20
24
28
32
36
40
Jan Feb Mar Apr May Jun Jul Aug Sep Oct Nov Dec
2010 2011 2012 2013
Inde
xIndex quarterly indicators of consumption
364044485256606468
I II III IV
2010 2011 2012 2013
Inde
x
Chart 6.3 Chart 6.4Index monthly indicators of investment
60
70
80
90
100
110120
130
Jan Feb Mar Apr May Jun Jul Aug Sep Oct Nov Dec
2010 2011 2012 2013
Inde
x
Index quarterly indicators of investment
8084889296
100104108112116
I II III IV
2010 2011 2012 2013
Inde
x
Chart 6.5 Chart 6.6Index of export indicators
100104108112116120124128132
I II III IV
2010 2011 2012 2013
Inde
x
Index of indicators of imports
99
100
101
102
103
104105
106
I II III IV
2010 2011 2012 2013
Inde
x
Chart 6.7 Chart 6.8Index of Economic Indicators
747576777879808182
I II III IV
2010 2011 2012 2013
Inde
x
Partial economic activity index(Percentage change compared to the corresponding period a
year earlier)
-6.0-4.0-2.00.02.04.06.08.0
I II III IV
2010 2011 2012 2013
Perc
enta
ge c
hang
e
6-3

Chart 6.9 Chart 6.10Current business perception index
92
94
96
98
100
102104
106
I II III IV
2010 2011 2012 2013
Inde
xShort-term perception index
98
100
102
104
106
108
I II III IV
2010 2011 2012 2013
Inde
x
Chart 6.11Business perception index
94
96
98
100
102
104
106
I II III IV
2010 2011 2012 2013
Inde
x
6-4

7. Internationalenvironment

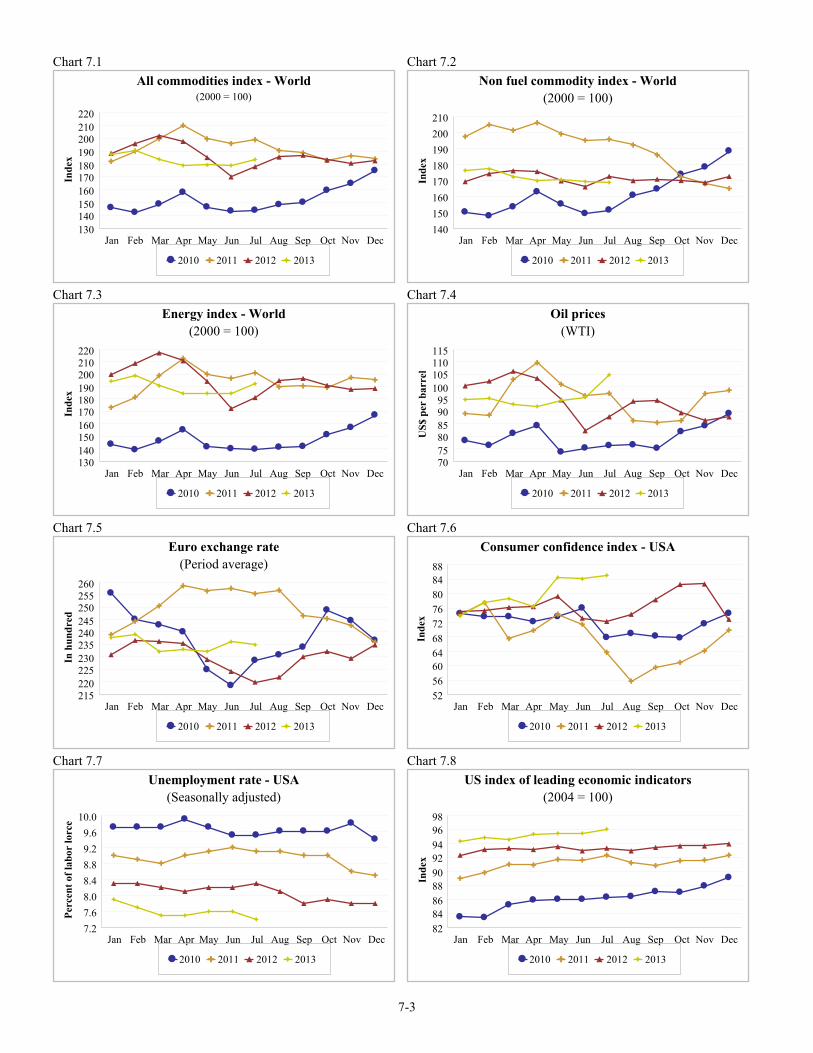
Chart 7.1 Chart 7.2All commodities index - World
(2000 = 100)
130140150160170180190200210220
Jan Feb Mar Apr May Jun Jul Aug Sep Oct Nov Dec
2010 2011 2012 2013
Inde
xNon fuel commodity index - World
(2000 = 100)
140150160170180190200210
Jan Feb Mar Apr May Jun Jul Aug Sep Oct Nov Dec
2010 2011 2012 2013
Inde
x
Chart 7.3 Chart 7.4Energy index - World
(2000 = 100)
130140150160170180190200210220
Jan Feb Mar Apr May Jun Jul Aug Sep Oct Nov Dec
2010 2011 2012 2013
Inde
x
Oil prices(WTI)
707580859095
100105110115
Jan Feb Mar Apr May Jun Jul Aug Sep Oct Nov Dec
2010 2011 2012 2013
US$
per
bar
rel
Chart 7.5 Chart 7.6Euro exchange rate
(Period average)
215220225230235240245250255260
Jan Feb Mar Apr May Jun Jul Aug Sep Oct Nov Dec
2010 2011 2012 2013
In h
undr
ed
Consumer confidence index - USA
52566064687276808488
Jan Feb Mar Apr May Jun Jul Aug Sep Oct Nov Dec
2010 2011 2012 2013
Inde
x
Chart 7.7 Chart 7.8Unemployment rate - USA
(Seasonally adjusted)
7.27.68.08.48.89.29.6
10.0
Jan Feb Mar Apr May Jun Jul Aug Sep Oct Nov Dec
2010 2011 2012 2013
Perc
ent o
f lab
or lo
rce
US index of leading economic indicators(2004 = 100)
828486889092949698
Jan Feb Mar Apr May Jun Jul Aug Sep Oct Nov Dec
2010 2011 2012 2013
Inde
x
7-3

Chart 7.9 Chart 7.10Gold prices
1,0001,1001,2001,3001,4001,5001,6001,7001,800
Jan Feb Mar Apr May Jun Jul Aug Sep Oct Nov Dec
2010 2011 2012 2013
In U
S$ p
er tr
oy o
unce
Food price index(2000-2004 = 100)
160170180190200210220230240
Jan Feb Mar Apr May Jun Jul Aug Sep Oct Nov Dec
2010 2011 2012 2013
Inde
x
7-4