centralia college’s 2006 2007 carbon inventory results · centralia college’s 20062007 carbon...
TRANSCRIPT
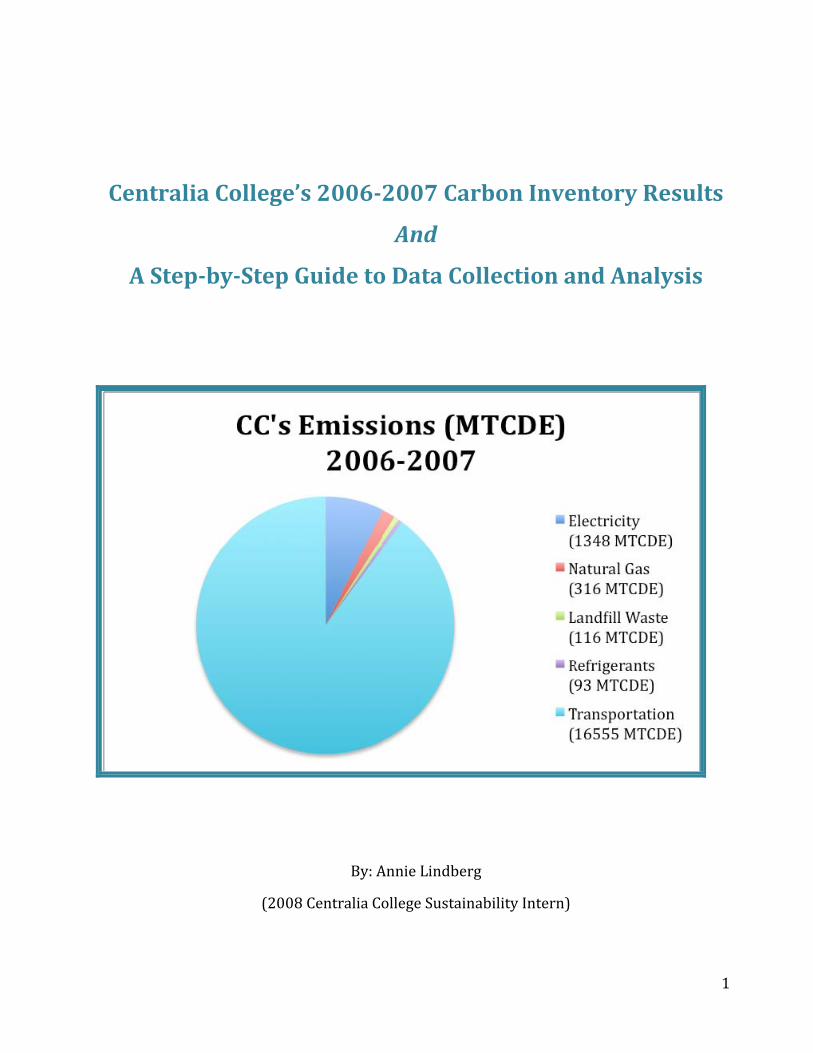
Centralia College’s 20062007 Carbon Inventory Results
And
A StepbyStep Guide to Data Collection and Analysis
1
By: Annie Lindberg
(2008 Centralia College Sustainability Intern)
2
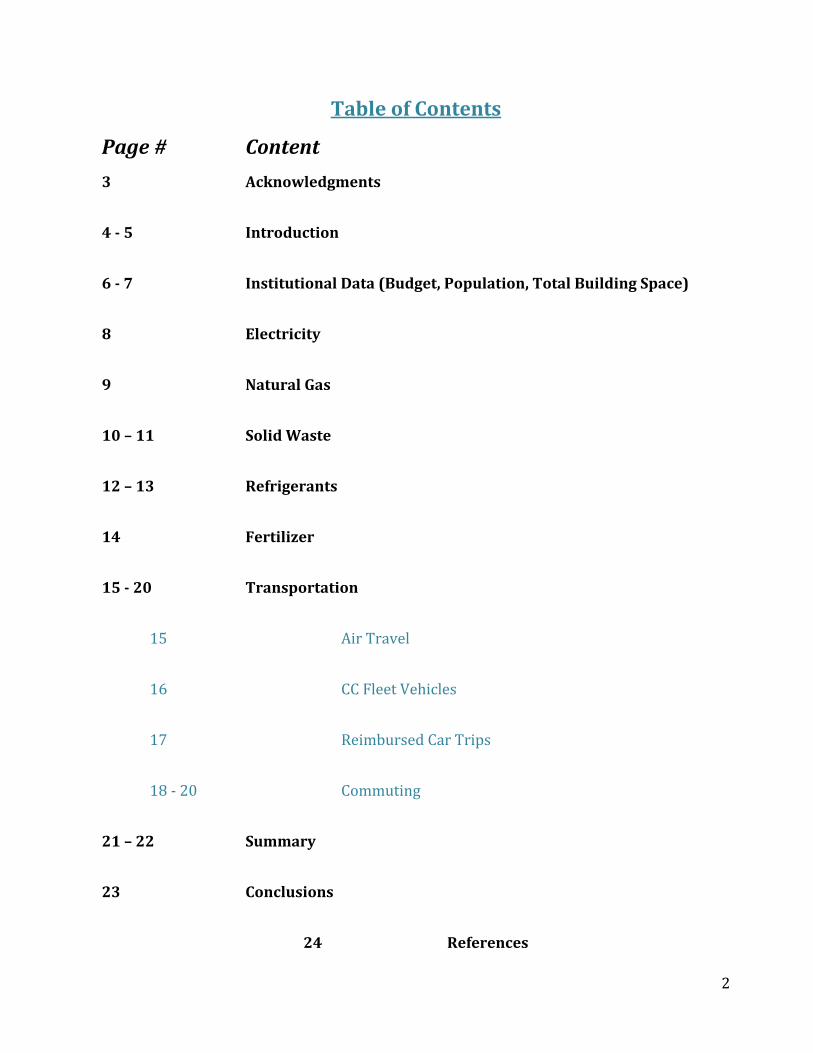
Table of Contents
Page # Content
3 Acknowledgments
4 5 Introduction
6 7 Institutional Data (Budget, Population, Total Building Space)
8 Electricity
9 Natural Gas
10 – 11 Solid Waste
12 – 13 Refrigerants
14 Fertilizer
15 20 Transportation
15 Air Travel
16 CC Fleet Vehicles
17 Reimbursed Car Trips
18 ‐ 20 Commuting
21 – 22 Summary
23 Conclusions
24 References
3
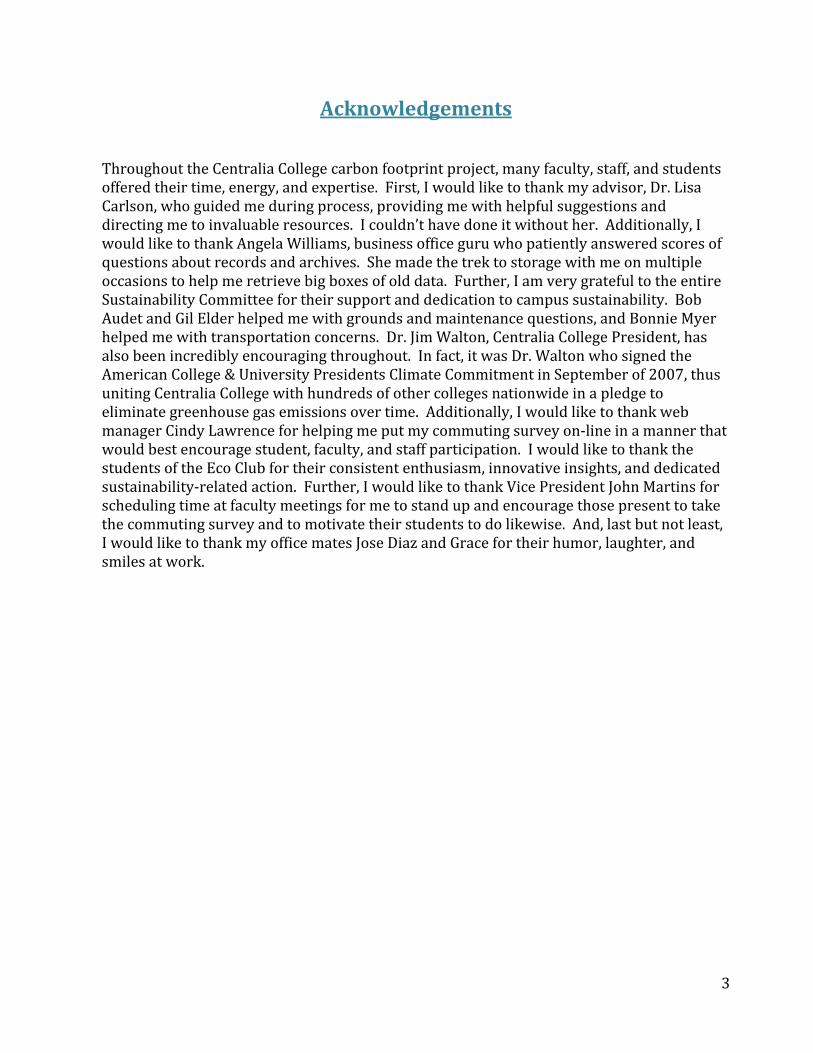
Acknowledgements
Throughout the Centralia College carbon footprint project, many faculty, staff, and students offered their time, energy, and expertise. First, I would like to thank my advisor, Dr. Lisa Carlson, who guided me during process, providing me with helpful suggestions and directing me to invaluable resources. I couldn’t have done it without her. Additionally, I would like to thank Angela Williams, business office guru who patiently answered scores of questions about records and archives. She made the trek to storage with me on multiple occasions to help me retrieve big boxes of old data. Further, I am very grateful to the entire Sustainability Committee for their support and dedication to campus sustainability. Bob Audet and Gil Elder helped me with grounds and maintenance questions, and Bonnie Myer helped me with transportation concerns. Dr. Jim Walton, Centralia College President, has also been incredibly encouraging throughout. In fact, it was Dr. Walton who signed the American College & University Presidents Climate Commitment in September of 2007, thus uniting Centralia College with hundreds of other colleges nationwide in a pledge to eliminate greenhouse gas emissions over time. Additionally, I would like to thank web manager Cindy Lawrence for helping me put my commuting survey on‐line in a manner that would best encourage student, faculty, and staff participation. I would like to thank the students of the Eco Club for their consistent enthusiasm, innovative insights, and dedicated sustainability‐related action. Further, I would like to thank Vice President John Martins for scheduling time at faculty meetings for me to stand up and encourage those present to take the commuting survey and to motivate their students to do likewise. And, last but not least, would like to thank my office mates Jose Diaz and Grace for their humor, laughter, and miles at work. Is
4
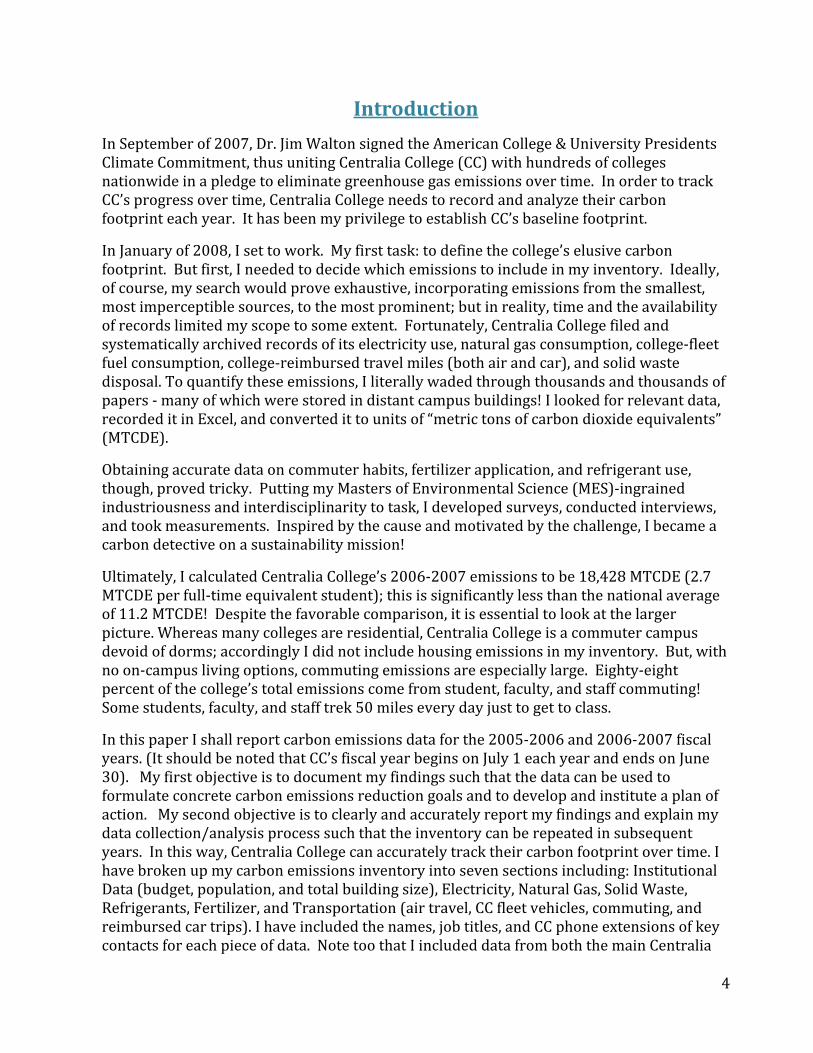
Introduction
In September of 2007, Dr. Jim Walton signed the American College & University Presidents Climate Commitment, thus uniting Centralia College (CC) with hundreds of colleges nationwide in a pledge to eliminate greenhouse gas emissions over time. In order to track CC’s progress over time, Centralia College needs to record and analyze their carbon footprint each year. It has been my privilege to establish CC’s baseline footprint.
In January of 2008, I set to work. My first task: to define the college’s elusive carbon footprint. But first, I needed to decide which emissions to include in my inventory. Ideally, of course, my search would prove exhaustive, incorporating emissions from the smallest, most imperceptible sources, to the most prominent; but in reality, time and the availability of records limited my scope to some extent. Fortunately, Centralia College filed and systematically archived records of its electricity use, natural gas consumption, college‐fleet fuel consumption, college‐reimbursed travel miles (both air and car), and solid waste disposal. To quantify these emissions, I literally waded through thousands and thousands of papers ‐ many of which were stored in distant campus buildings! I looked for relevant data, recorded it in Excel, and converted it to units of “metric tons of carbon dioxide equivalents” (MTCDE).
Obtaining accurate data on commuter habits, fertilizer application, and refrigerant use, though, proved tricky. Putting my Masters of Environmental Science (MES)‐ingrained industriousness and interdisciplinarity to task, I developed surveys, conducted interviews, and took measurements. Inspired by the cause and motivated by the challenge, I became a carbon detective on a sustainability mission!
Ultimately, I calculated Centralia College’s 2006‐2007 emissions to be 18,428 MTCDE (2.7 MTCDE per full‐time equivalent student); this is significantly less than the national average of 11.2 MTCDE! Despite the favorable comparison, it is essential to look at the larger picture. Whereas many colleges are residential, Centralia College is a commuter campus devoid of dorms; accordingly I did not include housing emissions in my inventory. But, with no on‐campus living options, commuting emissions are especially large. Eighty‐eight percent of the college’s total emissions come from student, faculty, and staff commuting! Some students, faculty, and staff trek 50 miles every day just to get to class.
In this paper I shall report carbon emissions data for the 2005‐2006 and 2006‐2007 fiscal years. (It should be noted that CC’s fiscal year begins on July 1 each year and ends on June 30). My first objective is to document my findings such that the data can be used to formulate concrete carbon emissions reduction goals and to develop and institute a plan of action. My second objective is to clearly and accurately report my findings and explain my data collection/analysis process such that the inventory can be repeated in subsequent years. In this way, Centralia College can accurately track their carbon footprint over time. I have broken up my carbon emissions inventory into seven sections including: Institutional Data (budget, population, and total building size), Electricity, Natural Gas, Solid Waste, Refrigerants, Fertilizer, and Transportation (air travel, CC fleet vehicles, commuting, and reimbursed car trips). I have included the names, job titles, and CC phone extensions of key contacts for each piece of data. Note too that I included data from both the main Centralia
5
campus and the Morton branch for all sectors except natural gas (because the Morton campus does not use natural gas). In all cases, I determined emissions coefficients using The Clean Air‐Cool Planet Campus Carbon Calculator (2006b). The fourteen appendices provide more detailed raw data and results in Excel. These spreadsheets are presented clearly and concisely to facilitate data collection and organization in future Centralia College carbon inventories. Whereas I have only presented data from fiscal years 2005‐2006 and 2006‐2007 in the body of the report, I have included data from all fiscal years for which I have data in the Excel appendices. In some sectors I have data for the last five years, in others it was only reasonable to collect data on the last two.
6
Institutional Data
Budget ($) Population (#)
Fiscal Operating Energy Full-Time Part-Time Total Building
Year Budget Budget Students Students Faculty Staff Space (sq ft)
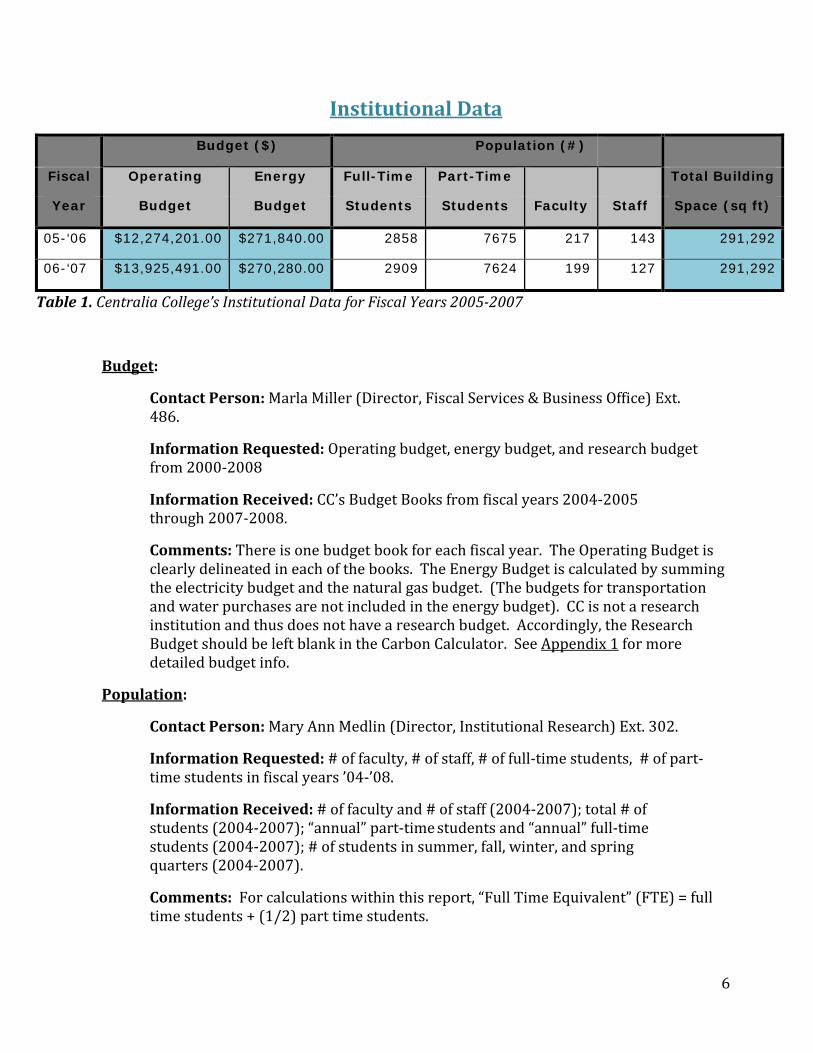
05-‘06 $12,274,201.00 $271,840.00 2858 7675 217 143 291,292
06-‘07 $13,925,491.00 $270,280.00 2909 7624 199 127 291,292
Table 1. Centralia College’s Institutional Data for Fiscal Years 20052007
Budget:
Contact Person: Marla Miller (Director, Fiscal Services & Business Office) Ext. 486.
Information Requested: Operating budget, energy budget, and research budget from 2000‐2008
Information Received: CC’s Budget Books from fiscal years 2004‐2005 through 2007‐2008.
Comments: There is one budget book for each fiscal year. The Operating Budget is clearly delineated in each of the books. The Energy Budget is calculated by summing the electricity budget and the natural gas budget. (The budgets for transportation and water purchases are not included in the energy budget). CC is not a research institution and thus does not have a research budget. Accordingly, the Research Budget should be left blank in the Carbon Calculator. See Appendix 1 for more detailed budget info.
Population:
Contact Person: Mary Ann Medlin (Director, Institutional Research) Ext. 302.
Information Requested: # of faculty, # of staff, # of full‐time students, # of part‐time students in fiscal years ’04‐’08.
Information Received: # of faculty and # of staff (2004‐2007); total # of students (2004‐2007); “annual” part‐time students and “annual” full‐time students (2004‐2007); # of students in summer, fall, winter, and spring quarters (2004‐2007).
Comments: For calculations within this report, “Full Time Equivalent” (FTE) = full time students + (1/2) part time students.
7
When looking at the data on the attached Excel spreadsheets, recognize that the number of “total” students and the number of “annual” students differ. The number of “annual” students refers to the sum of summer, fall, winter, and spring students. Many students attend CC during multiple quarters; the number of “annual” students” counts these students multiple times. Accordingly, to determine the “total” number of part‐time students without double counting, I first determined the percentage of part‐time students (by dividing number of “annual” part‐time students by the sum of “annual” part‐time” and “annual” full‐time). Multiplying this percentage by the “total” number of students, I obtained the number of “total” of parttime students. I determined the “total” number of fulltime students” by subtracting the “total” number of parttime students from the “total” number of students. See Appendix 2 for a more detailed CC population breakdown.
Building Size:
Contact Person: Steve Ward (P, Finance & Admin, Exec Director, Foundation) Ext. 233.
Information Requested .) : Total CC Building Space (sq. ft
Information Received: Total CC Building Space (sq. ft.)
Comments: This number includes the old science building (Ehret Hall) that wastorn down in 2007. A new science building is currently being built in its place.
8
Electricity
Fiscal Electricity Emission Coefficients CC’s Emissions Year (kWh) (MTCDE/KWh) (MTCDE)
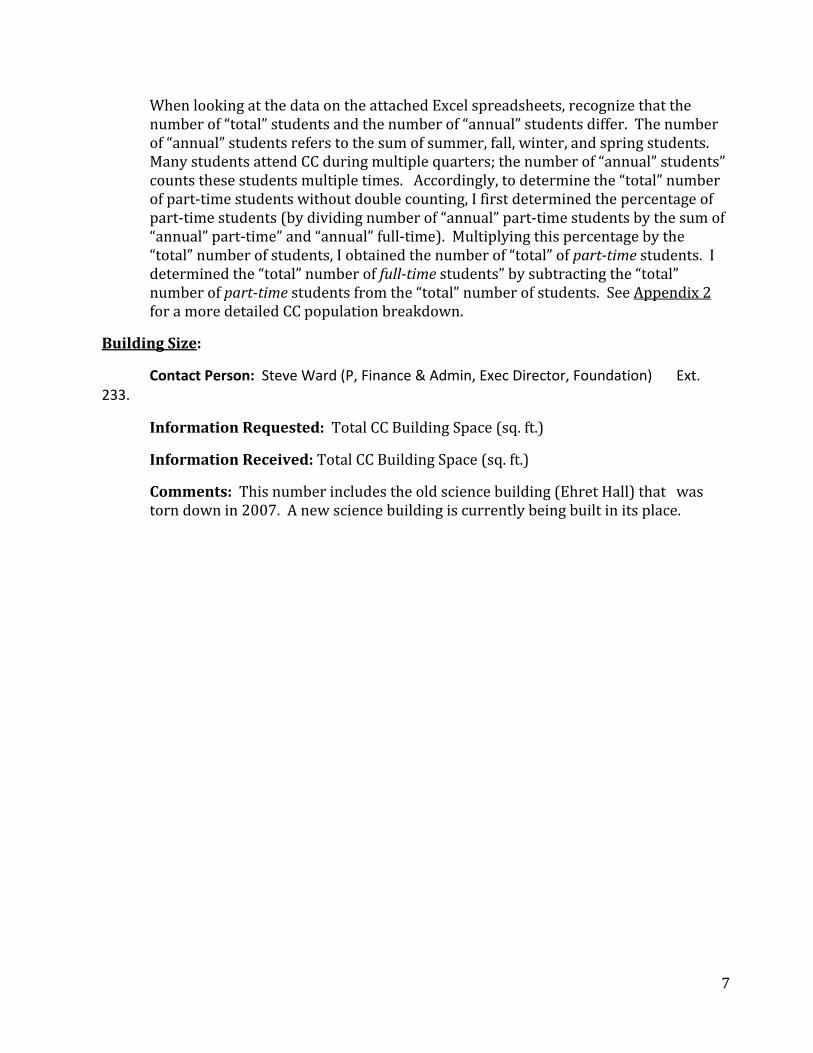
05-‘06 4094634 0.00033 1357 06-‘07 4065643 0.00033 1348
Table 2. Centralia College’s Greenhouse Gas Emissions from Purchased Electricity for Fiscal Year 20052007
Contact Person: Angela Williams (Fiscal Tech 2, Business Office) Ext. 278.
Information Collected: Electricity use on CC’s main Centralia campus is located in a file titled “City of Centralia/Utilities”. Electricity use on CC’s Morton campus is located in a file titled “Lewis County – PUD”. You will find monthly receipts of electricity use (kilowatts) for each meter locations. In 2006‐2007 there were thirty meter locations. I calculated not only CC’s total kW/yr, but also CC’s total kW/month, and CC’s total kW/meter address/yr. This way, electricity use at each meter location can be tracked over time. See Appendix 3 for this more detailed electricity data.
Comments: The business office keeps records of all expenses. Records from the current fiscal year are located in file folders (arranged alphabetically by topic) on a bookshelf in the southeast corner of the business office. Ask Angela Williams for permission before accessing these (and all) files. Files from the previous fiscal year are located in boxes in a storage closet within the business office. Files from two years back are located in boxes in a storage room down the hall from the business office. Staff in the business office have keys to this storage room and will assist you. Files from three, four, and five years ago are located several blocks away in the storage building on the southwest side of campus. A business office staff member will need to accompany you to retrieve files from this location. Files
. from six plus years ago have been disposed of. You will have no access to this information
In calculating CC’s Electricity Emissions, I used the emissions coefficient 0.00033 because The Clean Air‐Cool Planet Campus Carbon Calculator (2006b) identified this as the typical emissions coefficient for electricity in Western Washington.
9
Natural Gas Fiscal Natural Gas Emission Coefficients CC’s Emissions
Year (MMBtu) (MTCDE/MMBtu) (MTCDE)
05-‘06 6191 0.053 328 06-‘07 5955 0.053 316
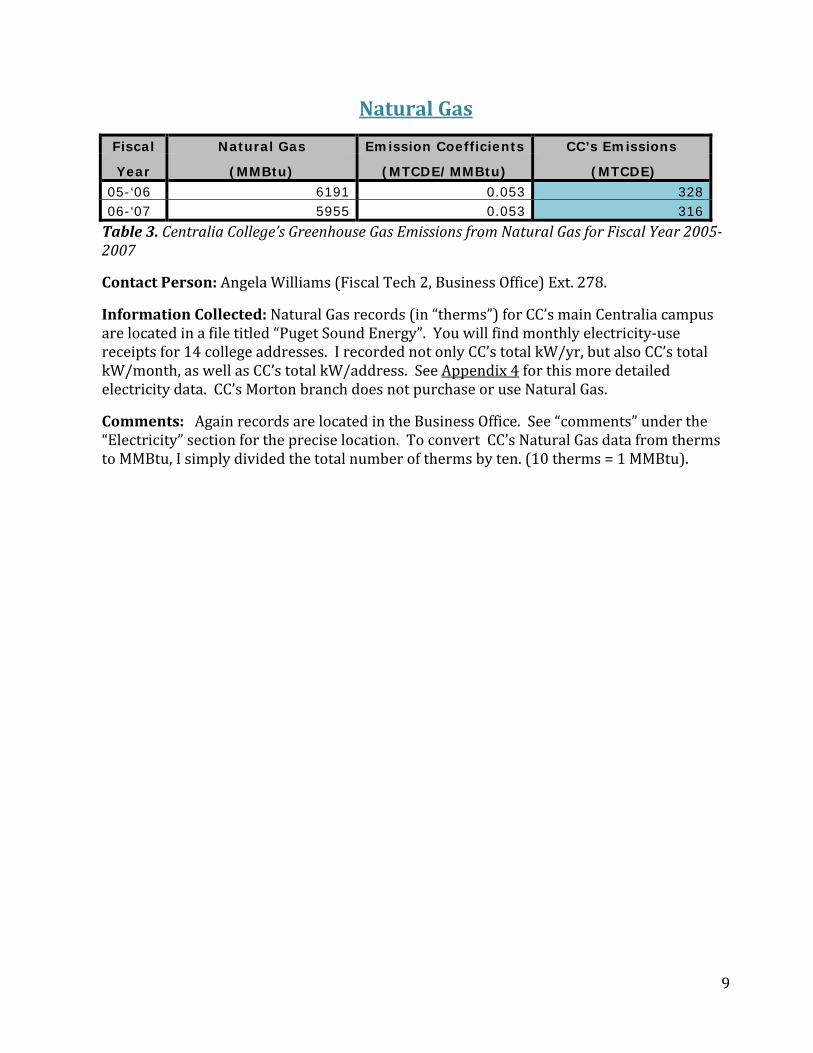
Table 3. Centralia College’s Greenhouse Gas Emissions from Natural Gas for Fiscal Year 20052007
Contact Person: Angela Williams (Fiscal Tech 2, Business Office) Ext. 278.
Information Collected: Natural Gas records (in “therms”) for CC’s main Centralia campus are located in a file titled “Puget Sound Energy”. You will find monthly electricity‐use receipts for 14 college addresses. I recorded not only CC’s total kW/yr, but also CC’s total kW/month, as well as CC’s total kW/address. See Appendix 4 for this more detailed electricity data. CC’s Morton branch does not purchase or use Natural Gas.
Comments: Again records are located in the Business Office. See “comments” under the Electricity” section for the precise location. To convert CC’s Natural Gas data from therms o MMBtu, I simply divided the total number of therms by ten. (10 therms = 1 MMBtu). “t
10
Solid Waste
Fiscal Landfill Waste Emission Coefficients CC’s Emissions Year (Short tons) (MTCDE/short ton) (MTCDE)
05-‘06 885 0.15 130 06-‘07 791 0.15 116
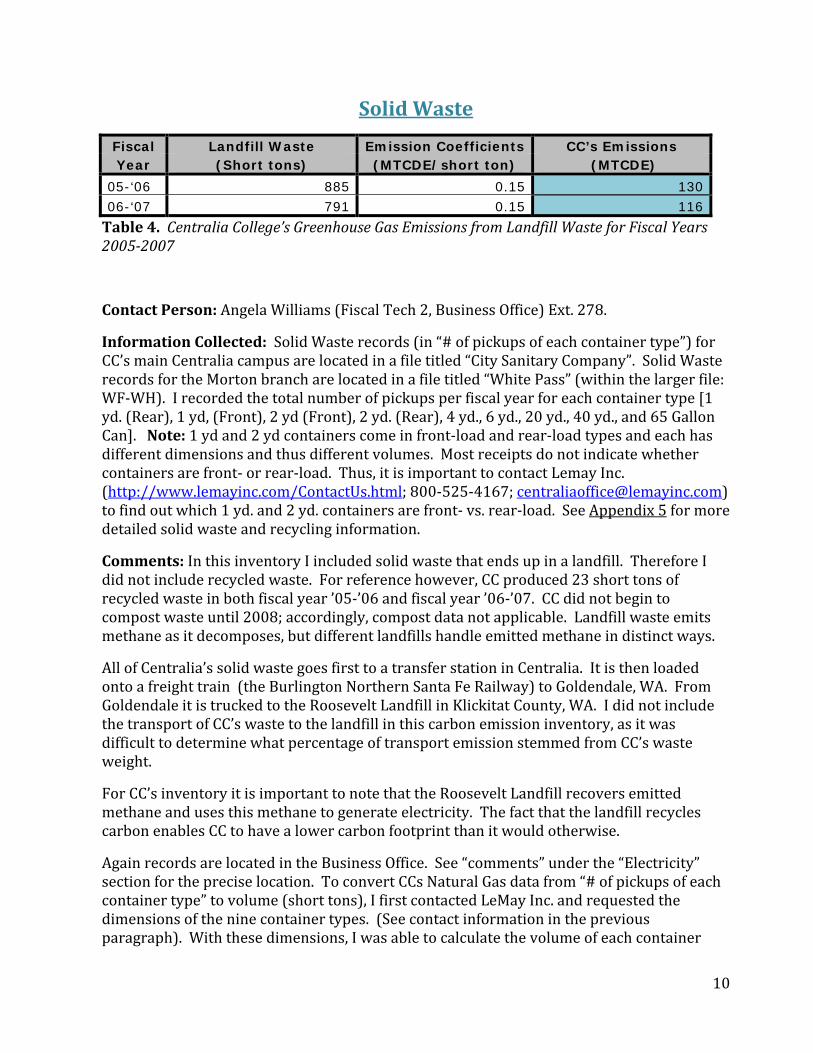
Table 4. Centralia College’s Greenhouse Gas Emissions from Landfill Waste for Fiscal Years 20052007
Contact Person: Angela Williams (Fiscal Tech 2, Business Office) Ext. 278.
Information Collected: Solid Waste records (in “# of pickups of each container type”) for CC’s main Centralia campus are located in a file titled “City Sanitary Company”. Solid Waste records for the Morton branch are located in a file titled “White Pass” (within the larger file: WF‐WH). I recorded the total number of pickups per fiscal year for each container type [1 yd. (Rear), 1 yd, (Front), 2 yd (Front), 2 yd. (Rear), 4 yd., 6 yd., 20 yd., 40 yd., and 65 Gallon Can]. Note: 1 yd and 2 yd containers come in front‐load and rear‐load types and each has different dimensions and thus different volumes. Most receipts do not indicate whether containers are front‐ or rear‐load. Thus, it is important to contact Lemay Inc. (http://www.lemayinc.com/ContactUs.html; 800‐525‐4167; [email protected]) to find out which 1 yd. and 2 yd. containers are front‐ vs. rear‐load. See Appendix 5 for more detailed solid waste and recycling information.
Comments: In this inventory I included solid waste that ends up in a landfill. Therefore I did not include recycled waste. For reference however, CC produced 23 short tons of recycled waste in both fiscal year ’05‐’06 and fiscal year ’06‐’07. CC did not begin to compost waste until 2008; accordingly, compost data not applicable. Landfill waste emits
s. methane as it decomposes, but different landfills handle emitted methane in distinct way
All of Centralia’s solid waste goes first to a transfer station in Centralia. It is then loaded onto a freight train (the Burlington Northern Santa Fe Railway) to Goldendale, WA. From Goldendale it is trucked to the Roosevelt Landfill in Klickitat County, WA. I did not include the transport of CC’s waste to the landfill in this carbon emission inventory, as it was difficult to determine what percentage of transport emission stemmed from CC’s waste weight.
For CC’s inventory it is important to note that the Roosevelt Landfill recovers emitted methane and uses this methane to generate electricity. The fact that the landfill recycles carbon enables CC to have a lower carbon footprint than it would otherwise.
Again records are located in the Business Office. See “comments” under the “Electricity” section for the precise location. To convert CCs Natural Gas data from “# of pickups of each container type” to volume (short tons), I first contacted LeMay Inc. and requested the dimensions of the nine container types. (See contact information in the previous paragraph). With these dimensions, I was able to calculate the volume of each container
11
type. LeMay Inc. informed me that each cubic yd. of solid waste weights 350 lbs on average. Thus, I multiplied a given container’s waste volume (cubic yds.) by 350 to determine its waste weight. To convert waste weight in pounds to short tons, I multiplied by 2000. (2000 lbs. = 1 short ton). This number estimates the weight (in short tons) of waste occupying a given container. Then, total weight/yr (short tons/yr) of waste from a given container = (# of pickups/yr. of a given container)*(estimated weight of the given container’s solid waste). See Appendix 5 for this more detailed solid waste data including all conversion factors. Because 350 lbs is the average weight of one cubic yard of solid waste throughout the entire city of Centralia, it would be informative to calculate the average weight of one cubic yard of solid waste on the Centralia College campus (as it may differ significantly from the city average). This could be accomplished by weighing various trash containers around campus. Be sure that your sample is both ample and random to ensure statistical robustness.
12
Refrigerants
Fiscal Refrigerant HCFC-22 Emission Coefficients CC’s Emissions Year (Pounds) (MTCDE/lb.) (MTCDE)
05-‘06 121 0.77 93 06-‘07 121 0.77 93
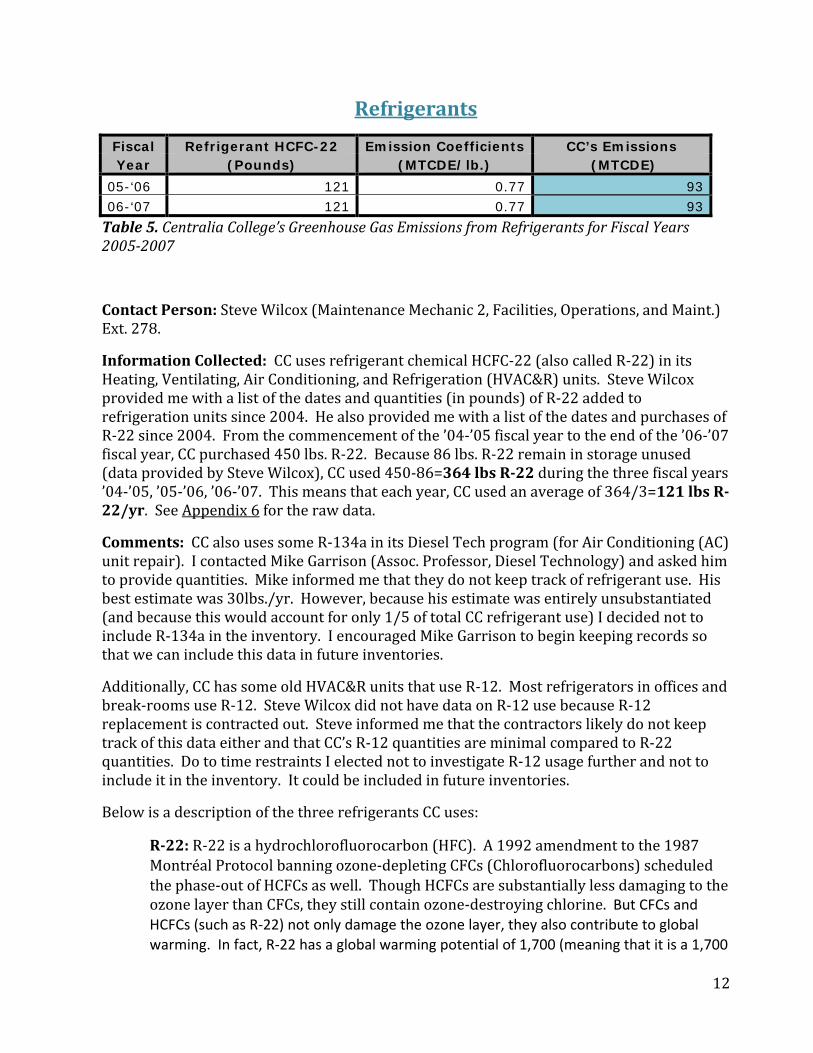
Table 5. Centralia College’s Greenhouse Gas Emissions from Refrigerants for Fiscal Years 20052007
Contact Person: Steve Wilcox (Maintenance Mechanic 2, Facilities, Operations, and Maint.) Ext. 278.
Information Collected: CC uses refrigerant chemical HCFC‐22 (also called R‐22) in its Heating, Ventilating, Air Conditioning, and Refrigeration (HVAC&R) units. Steve Wilcox provided me with a list of the dates and quantities (in pounds) of R‐22 added to refrigeration units since 2004. He also provided me with a list of the dates and purchases of R‐22 since 2004. From the commencement of the ’04‐’05 fiscal year to the end of the ’06‐’07 fiscal year, CC purchased 450 lbs. R‐22. Because 86 lbs. R‐22 remain in storage unused (data provided by Steve Wilcox), CC used 450‐86=364 lbs R22 during the three fiscal years ’04‐’05, ’05‐’06, ’06‐’07. This means that each year, CC used an average of 364/3=121 lbs R22/yr. See Appendix 6 for the raw data.
Comments: CC also uses some R‐134a in its Diesel Tech program (for Air Conditioning (AC) unit repair). I contacted Mike Garrison (Assoc. Professor, Diesel Technology) and asked him to provide quantities. Mike informed me that they do not keep track of refrigerant use. His best estimate was 30lbs./yr. However, because his estimate was entirely unsubstantiated (and because this would account for only 1/5 of total CC refrigerant use) I decided not to include R‐134a in the inventory. I encouraged Mike Garrison to begin keeping records so that we can include this data in future inventories.
Additionally, CC has some old HVAC&R units that use R‐12. Most refrigerators in offices and break‐rooms use R‐12. Steve Wilcox did not have data on R‐12 use because R‐12 replacement is contracted out. Steve informed me that the contractors likely do not keep track of this data either and that CC’s R‐12 quantities are minimal compared to R‐22 quantities. Do to time restraints I elected not to investigate R‐12 usage further and not to
inventories. include it in the inventory. It could be included in future
Below is a de scription of the three refrigerants CC uses:
R22: R‐22 is a hydrochlorofluorocarbon (HFC). A 1992 amendment to the 1987 Montréal Protocol banning ozone‐depleting CFCs (Chlorofluorocarbons) scheduled the phase‐out of HCFCs as well. Though HCFCs are substantially less damaging to the ozone layer than CFCs, they still contain ozone‐destroying chlorine. But CFCs and HCFCs (such as R‐22) not only damage the ozone layer, they also contribute to global warming. In fact, R‐22 has a global warming potential of 1,700 (meaning that it is a 1,700
13
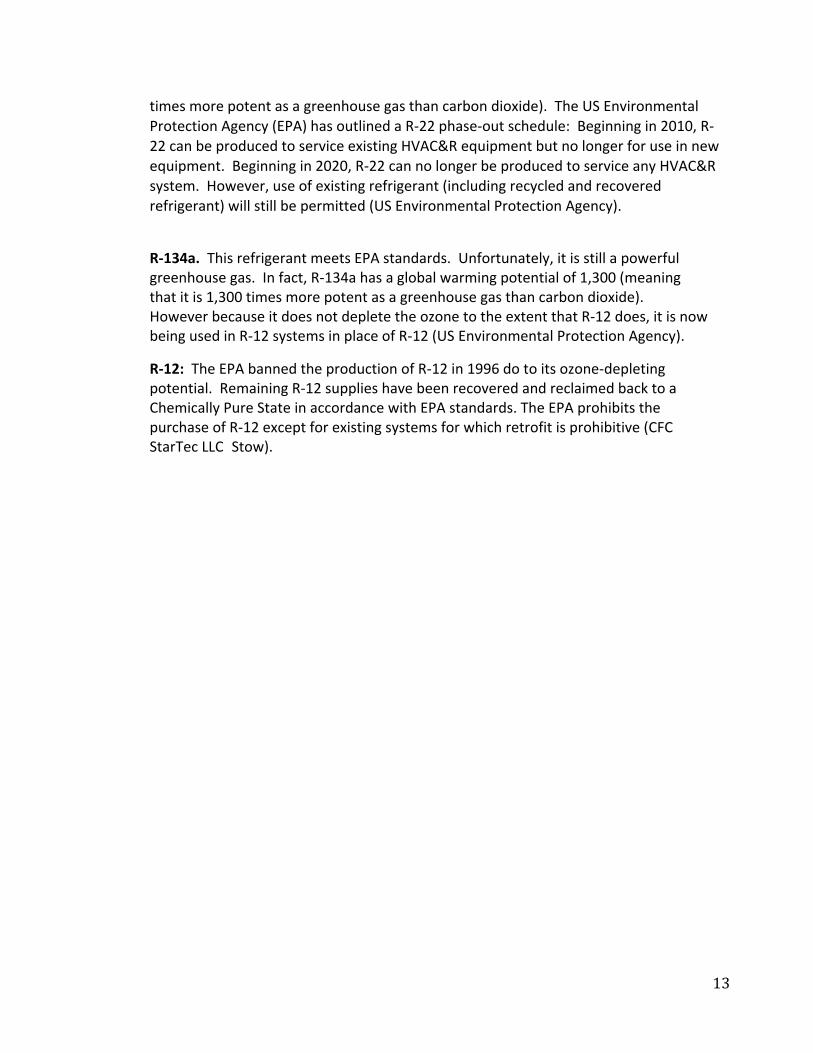
times more potent as a greenhouse gas than carbon dioxide). The US Environmental Protection Agency (EPA) has outlined a R‐22 phase‐out schedule: Beginning in 2010, R‐22 can be produced to service existing HVAC&R equipment but no longer for use in new equipment. Beginning in 2020, R‐22 can no longer be produced to service any HVAC&R system. However, use of existing refrigerant (including recycled and recovered refrigerant) will still be permitted (US Environmental Protection Agency).
R‐134a. This refrigerant meets EPA standards. Unfortunately, it is still a powerful greenhouse gas. In fact, R‐134a has a global warming potential of 1,300 (meaning that it is 1,300 times more potent as a greenhouse gas than carbon dioxide). However because it does not deplete the ozone to the extent that R‐12 does, it is now being used in R‐12 systems in place of R‐12 (US Environmental Protection Agency).
R‐12: The EPA banned the production of R‐12 in 1996 do to its ozone‐depleting potential. Remaining R‐12 supplies have been recovered and reclaimed back to a Chemically Pure State in accordance with EPA standards. The EPA prohibits the purchase of R‐12 except for existing systems for which retrofit is prohibitive (CFC StarTec LLC�Stow).
14
Fertilizer
Fiscal Fertilizer % Nitrogen Emission Coefficients CC’s
Emissions Year (Pounds) (MTDCE/lb. N) (MTCDE)
05-‘06 1650 20 0.0038 0.1 06-‘07 1650 20 0.0038 0.1
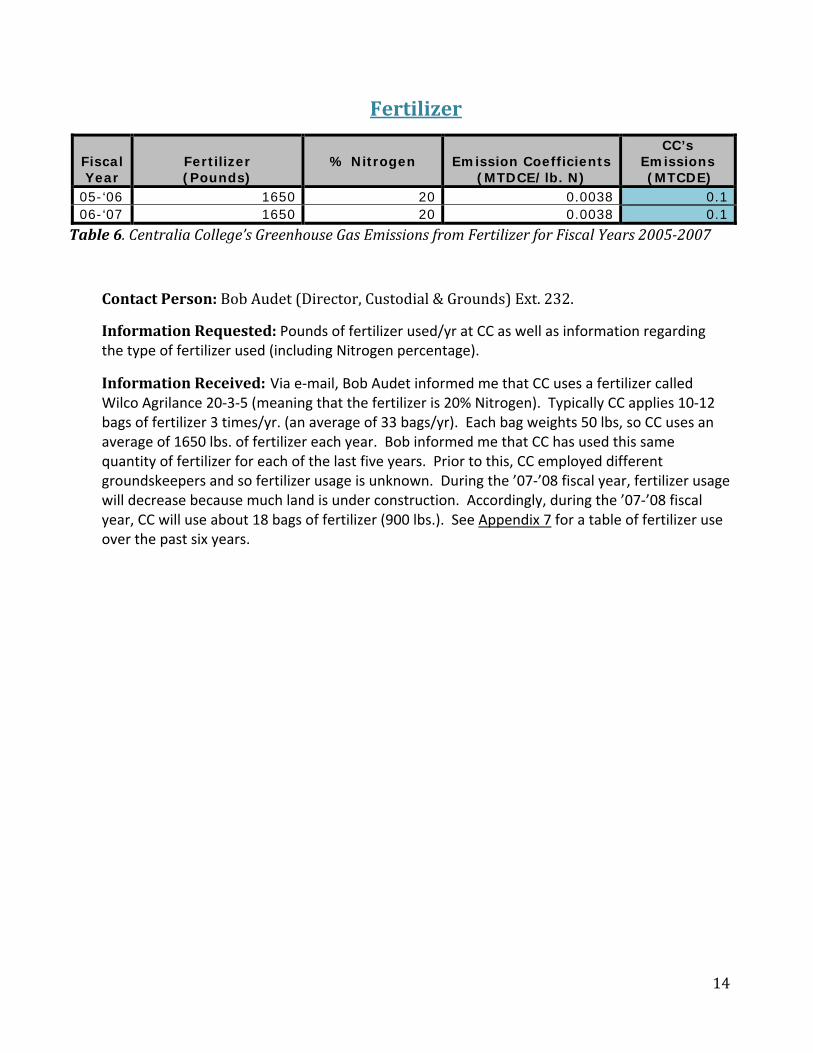
Table 6. Centralia College’s Greenhouse Gas Emissions from Fertilizer for Fiscal Years 20052007
Contact Person: Bob Audet (Director, Custodial & Grounds) Ext. 232.
Information Requested: Pounds of fertilizer used/yr at CC as well as information regarding the type of fertilizer used (including Nitrogen percentage).
Information Received: Via e‐mail, Bob Audet informed me that CC uses a fertilizer called Wilco Agrilance 20‐3‐5 (meaning that the fertilizer is 20% Nitrogen). Typically CC applies 10‐12 bags of fertilizer 3 times/yr. (an average of 33 bags/yr). Each bag weights 50 lbs, so CC uses an average of 1650 lbs. of fertilizer each year. Bob informed me that CC has used this same quantity of fertilizer for each of the last five years. Prior to this, CC employed different groundskeepers and so fertilizer usage is unknown. During the ’07‐’08 fiscal year, fertilizer usage will decrease because much land is under construction. Accordingly, during the ’07‐’08 fiscal year, CC will use about 18 bags of fertilizer (900 lbs.). See Appendix 7 for a table of fertilizer use over the past six years.
15
Transportation
Air Travel
Fiscal Air Travel Emission Coefficients CC’s Emissions Year (Miles) (MTCDE/mile) (MTCDE)
05-‘06 206496 0.00078 161 06-‘07 287932 0.00078 225
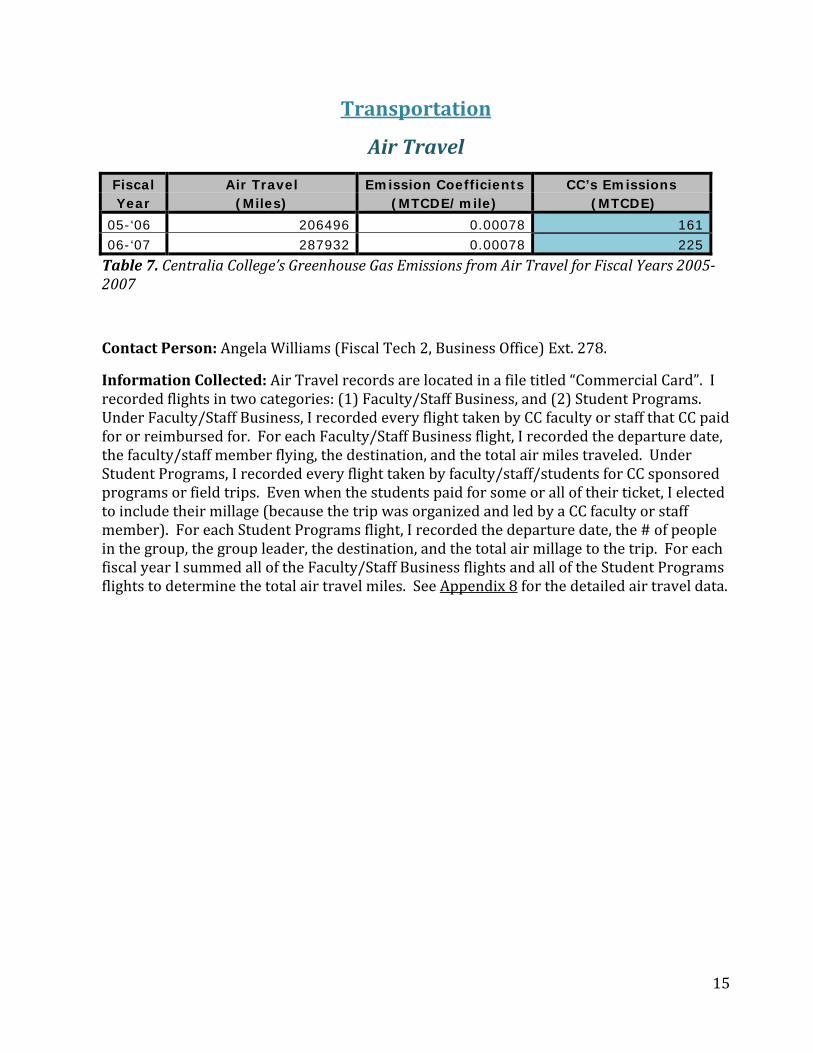
Table 7. Centralia College’s Greenhouse Gas Emissions from Air Travel for Fiscal Years 20052007
Contact Person: Angela Williams (Fiscal Tech 2, Business Office) Ext. 278.
Information Collected: Air Travel records are located in a file titled “Commercial Card”. I recorded flights in two categories: (1) Faculty/Staff Business, and (2) Student Programs. Under Faculty/Staff Business, I recorded every flight taken by CC faculty or staff that CC paid for or reimbursed for. For each Faculty/Staff Business flight, I recorded the departure date, the faculty/staff member flying, the destination, and the total air miles traveled. Under Student Programs, I recorded every flight taken by faculty/staff/students for CC sponsored programs or field trips. Even when the students paid for some or all of their ticket, I elected to include their millage (because the trip was organized and led by a CC faculty or staff member). For each Student Programs flight, I recorded the departure date, the # of people in the group, the group leader, the destination, and the total air millage to the trip. For each fiscal year I summed all of the Faculty/Staff Business flights and all of the Student Programs lights to determine the total air travel miles. See f Appendix 8 for the detailed air travel data.
16
Transportation
CC Fleet Vehicles
Fiscal CC Fleet Emission Coefficients CC’s Emissions
Year (GallonsGAS) (MTCDE/gallon) (MTCDE)
05-‘06 3555 0.009 32 06-‘07 2794 0.009 25
Fiscal CC Fleet Emission Coefficients CC’s Emissions
Year (GallonsDIESEL) (MTCDE/gallon) (MTCDE)
05-‘06 1192 0.01 12 06-‘07 1112 0.01 11
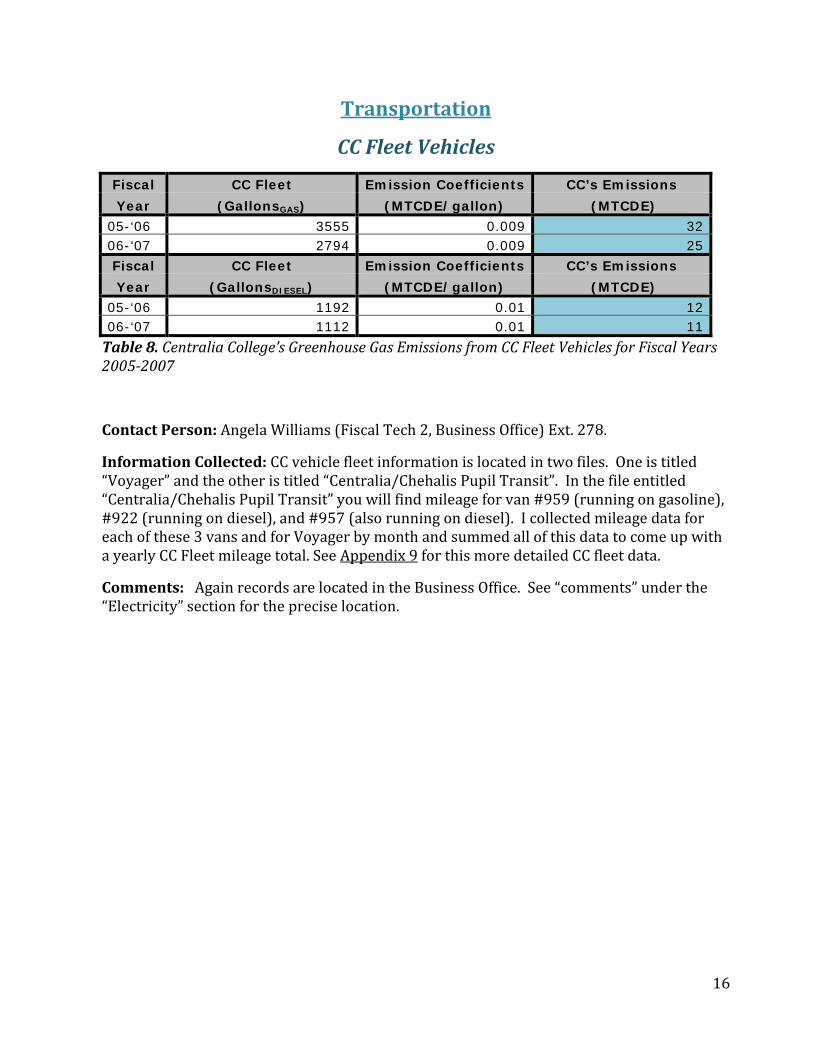
Table 8. Centralia College’s Greenhouse Gas Emissions from CC Fleet Vehicles for Fiscal Years 20052007
Contact Person: Angela Williams (Fiscal Tech 2, Business Office) Ext. 278.
Information Collected: CC vehicle fleet information is located in two files. One is titled “Voyager” and the other is titled “Centralia/Chehalis Pupil Transit”. In the file entitled “Centralia/Chehalis Pupil Transit” you will find mileage for van #959 (running on gasoline), #922 (running on diesel), and #957 (also running on diesel). I collected mileage data for each of these 3 vans and for Voyager by month and summed all of this data to come up with a yearly CC Fleet mileage total. See Appendix 9 for this more detailed CC fleet data.
Comments: Again records are located in the Business Office. See “comments” under the Electricity” section for the precise location. “
17
Transportation
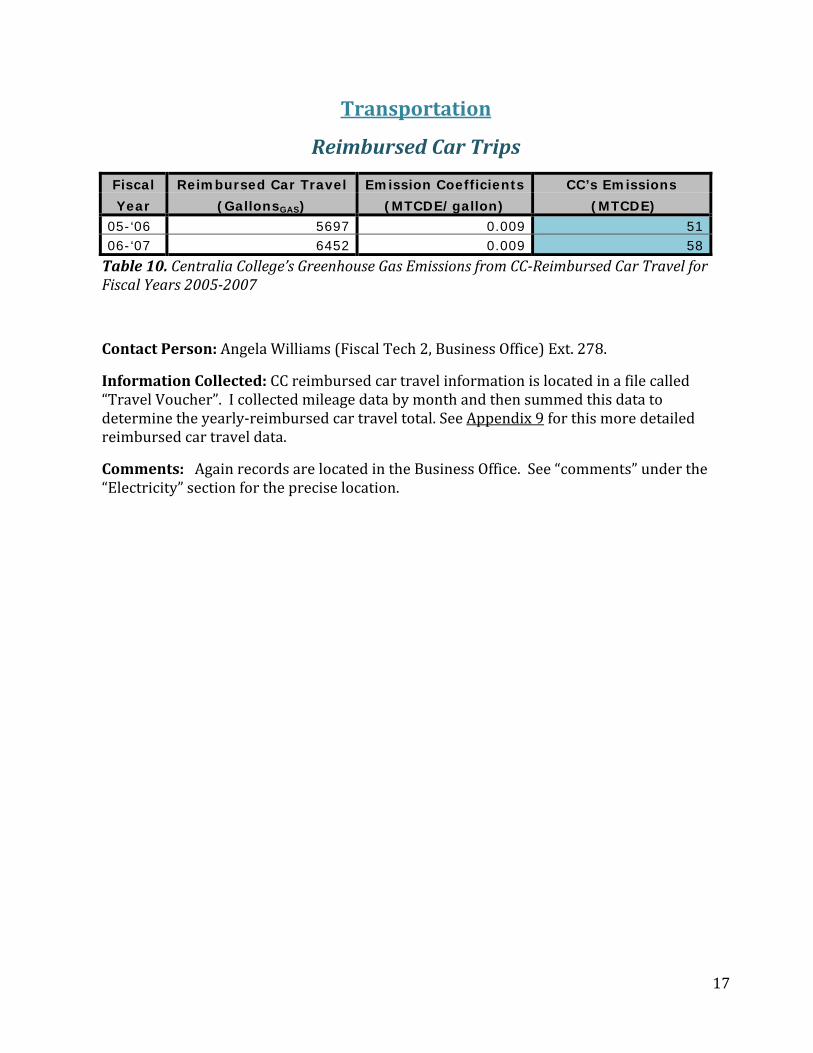
Reimbursed Car Trips
Fiscal Reimbursed Car Travel Emission Coefficients CC’s Emissions
Year (GallonsGAS) (MTCDE/gallon) (MTCDE)
05-‘06 5697 0.009 51 06-‘07 6452 0.009 58
Table 10. Centralia College’s Greenhouse Gas Emissions from CCReimbursed Car Travel for Fiscal Years 20052007
Contact Person: Angela Williams (Fiscal Tech 2, Business Office) Ext. 278.
Information Collected: CC reimbursed car travel information is located in a file called “Travel Voucher”. I collected mileage data by month and then summed this data to determine the yearly‐reimbursed car travel total. See Appendix 9 for this more detailed reimbursed car travel data.
Comments: Again records are located in the Business Office. See “comments” under the Electricity” section for the precise location. “
18
Transportation
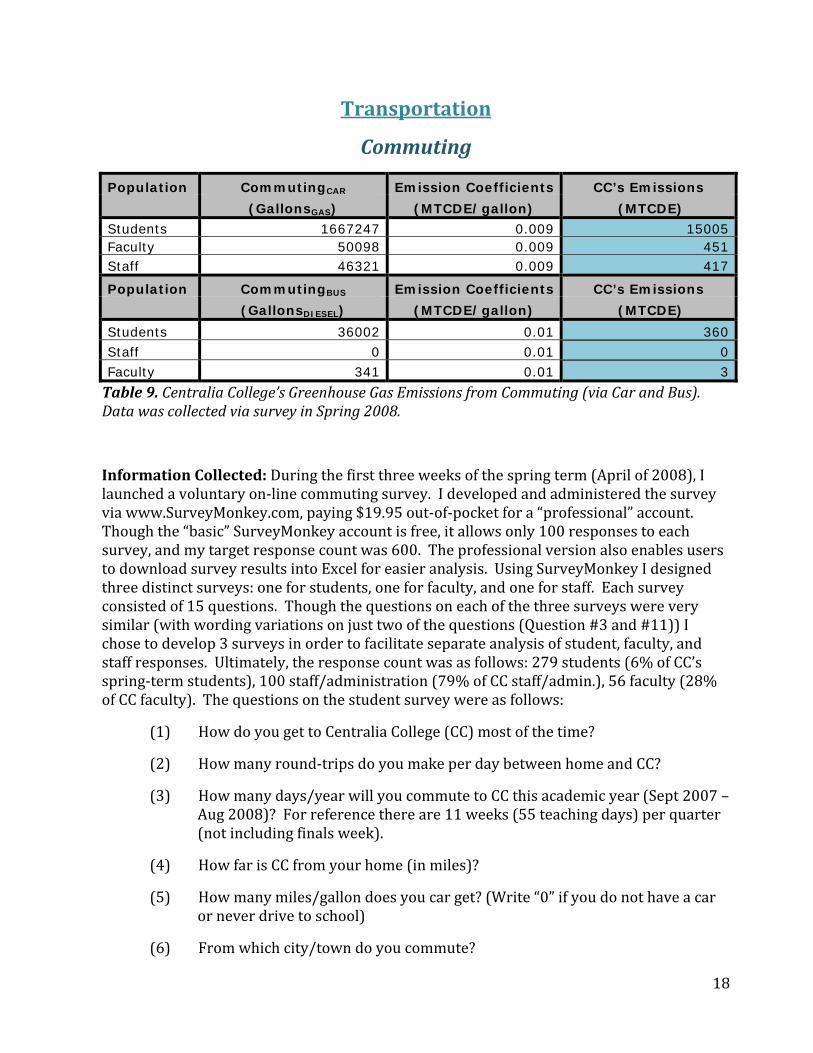
Commuting
Population CommutingCAR Emission Coefficients CC’s Emissions
(GallonsGAS) (MTCDE/gallon) (MTCDE)
Students 1667247 0.009 15005 Faculty 50098 0.009 451 Staff 46321 0.009 417
Population CommutingBUS Emission Coefficients CC’s Emissions
(GallonsDIESEL) (MTCDE/gallon) (MTCDE)
Students 36002 0.01 360 Staff 0 0.01 0 Faculty 341 0.01 3
Table 9. Centralia College’s Greenhouse Gas Emissions from Commuting (via Car and Bus). ata was collected via survey in Spring 2008. D
Information Collected: During the first three weeks of the spring term (April of 2008), I launched a voluntary on‐line commuting survey. I developed and administered the survey via www.SurveyMonkey.com, paying $19.95 out‐of‐pocket for a “professional” account. Though the “basic” SurveyMonkey account is free, it allows only 100 responses to each survey, and my target response count was 600. The professional version also enables users to download survey results into Excel for easier analysis. Using SurveyMonkey I designed three distinct surveys: one for students, one for faculty, and one for staff. Each survey consisted of 15 questions. Though the questions on each of the three surveys were very similar (with wording variations on just two of the questions (Question #3 and #11)) I chose to develop 3 surveys in order to facilitate separate analysis of student, faculty, and staff responses. Ultimately, the response count was as follows: 279 students (6% of CC’s spring‐term students), 100 staff/administration (79% of CC staff/admin.), 56 faculty (28% of CC faculty). The questions on the student survey were as follows:
(1) How do you get to Centralia College (CC) most of the time?
(2) How many round‐trips do you make per day between home and CC?
(3) How many days/year will you commute to CC this academic year (Sept 2007 – Aug 2008)? For reference there are 11 weeks (55 teaching days) per quarter (not including finals week).
(4) How far is CC from your home (in miles)?
(5) How many miles/gallon does you car get? (Write “0” if you do not have a car or never drive to school)
(6) From which city/town do you commute?
19
(7) From which zip code do you commute?
(8) If you arrive by car, how often do you carpool?
(9) When you carpool, how many people (other than yourself) do you usually drive with?
(10) What would make you more likely to carpool, bus, walk, or bike to school?
wants one)? (11) Do you have a bus pass (provided FREE to any CC student who
(12) Do you have plans to buy a HYBRID vehicle in the near future?
(13) Do you have plans to buy an ELECTRIC vehicle in the near future?
(14) What is your name? Optional, but to win you must enter your full name so we can ensure that entrants fill out the survey only once)
(15) What is your e‐mail address? (Optional, but to win you must answer so we can contact you)
See Appendix 10 for a copy of each of the three surveys including the multiple choice response options.
Students, faculty, and staff could access the surveys via a link on the main CC webpage or via a link on CC’s sustainability webpage. I e‐mailed Cindy Lawrence (Web Manager, College Relations; Ext. 630) the web links to the 3 surveys (web links provided by SurveyMonkey) and she developed buttons on the CC web pages connecting to the surveys.
I used four methods to inform students, faculty, and staff of the surveys and to encourage their participation. First, I tied completing the survey with entry into a drawing to win either a $25 gift certificate to the CC Bookstore (donated by the CC Bookstore) or a free, reserved parking space through September 2008 (provided by Bonny Myer, the Director of Central Services and Purchasing, Ext 230). Secondly, I sent e‐mails to all faculty and staff via the “elective” and “official” CC list‐serves with links to the surveys. Thirdly, I asked John Martins (Vice President of Instruction; Ext 411) to put me on the early April faculty meeting agenda. At the meeting I informed faculty of the survey, encouraged their participation, and invited them to encourage their students to participate as well. Lastly, I put signs on every bulletin board on campus and on many of the computers in the library and Washington Hall computer labs. These signs announced the survey. See Appendix 11 for a copy the promotional signs; see Appendix 12 for the Raw SurveyMonkey data; see Appendix 13 for the summary data.
Comments: In the future, it would be beneficial to distribute the survey “randomly” for more statistically accurate results. Perhaps you can contact Mary Ann Medlin (Director, Institutional Research, Ext 302) and include the commuting survey as an addendum to one of the surveys she is already conducting. If you do choose to continue with the voluntary web‐based method try to increase student participation. At the time of my survey, CC had no student e‐mail accounts. However, now that CC is working to distribute student e‐mail
accounts, students can be made aware of future surveys via e‐mail. Also, if you do choose to continue with the voluntary web‐based method, I would suggest discarding the “free, reserved parking spot” prize because, in hindsight, I recognized that it might have skewed survey participation. Perhaps those who drive to school were more apt to complete the survey because they were lured by the potential free parking prize incentive.
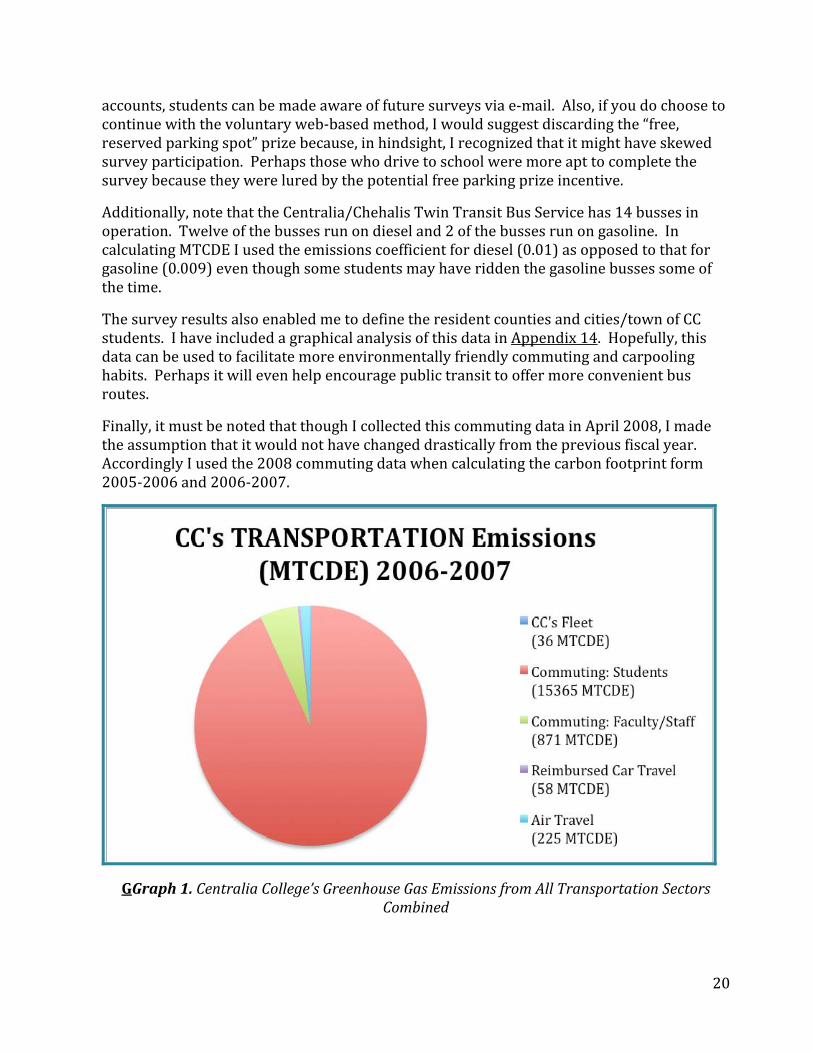
Additionally, note that the Centralia/Chehalis Twin Transit Bus Service has 14 busses in operation. Twelve of the busses run on diesel and 2 of the busses run on gasoline. In calculating MTCDE I used the emissions coefficient for diesel (0.01) as opposed to that for gasoline (0.009) even though some students may have ridden the gasoline busses some of the time.
The survey results also enabled me to define the resident counties and cities/town of CC students. I have included a graphical analysis of this data in Appendix 14. Hopefully, this data can be used to facilitate more environmentally friendly commuting and carpooling habits. Perhaps it will even help encourage public transit to offer more convenient bus routes.
Finally, it must be noted that though I collected this commuting data in April 2008, I made the assumption that it would not have changed drastically from the previous fiscal year. Accordingly I used the 2008 commuting data when calculating the carbon footprint form 2005‐2006 and 2006‐2007.
GGraph 1. Centralia College’s Greenhouse Gas Emissions from All Transportation Sectors Combined
20
Summary
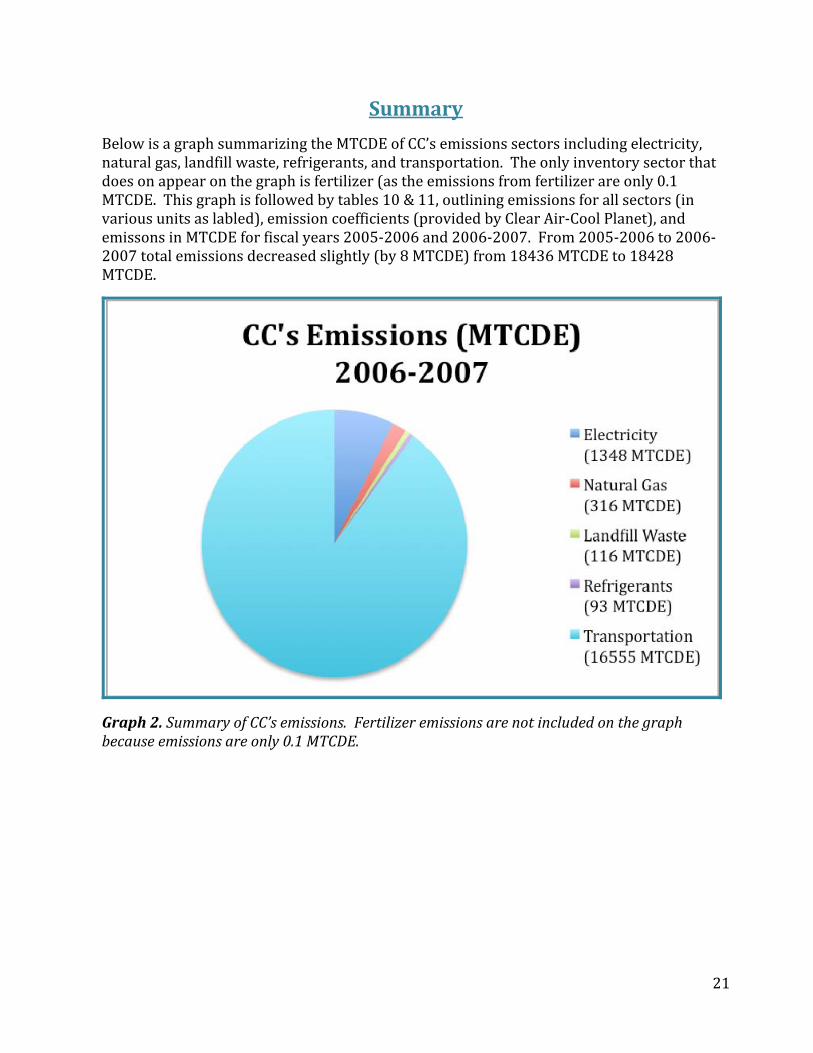
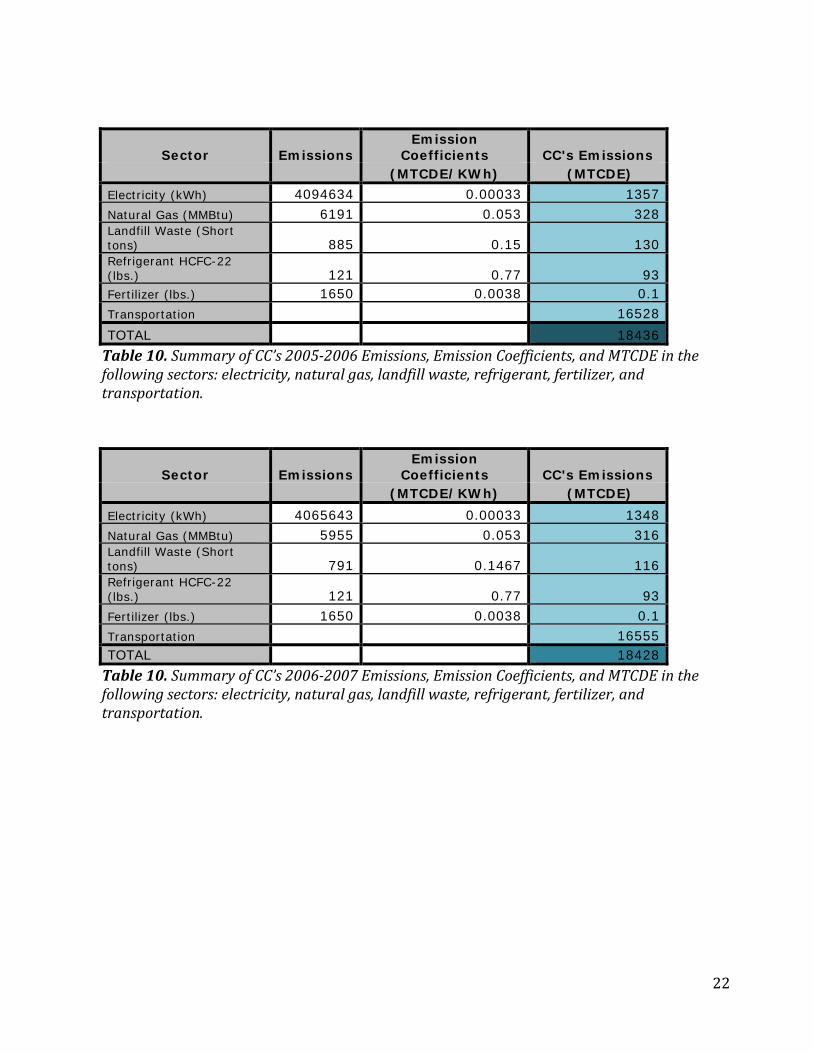
Below is a graph summarizing the MTCDE of CC’s emissions sectors including electricity, natural gas, landfill waste, refrigerants, and transportation. The only inventory sector that does on appear on the graph is fertilizer (as the emissions from fertilizer are only 0.1 MTCDE. This graph is followed by tables 10 & 11, outlining emissions for all sectors (in various units as labled), emission coefficients (provided by Clear Air‐Cool Planet), and emissons in MTCDE for fiscal years 2005‐2006 and 2006‐2007. From 2005‐2006 to 2006‐2007 total emissions decreased slightly (by 8 MTCDE) from 18436 MTCDE to 18428 MTCDE.
Graph 2. Summary of CC’s emissions. Fertilizer emissions are not included on the graph because emissions are only 0.1 MTCDE.
21
22
Sector Emissions Emission
Coefficients CC's Emissions (MTCDE/KWh) (MTCDE)
Electricity (kWh) 4094634 0.00033 1357
Natural Gas (MMBtu) 6191 0.053 328 Landfill Waste (Short tons) 885 0.15 130 Refrigerant HCFC-22 (lbs.) 121 0.77 93 Fertilizer (lbs.) 1650 0.0038 0.1
Transportation 16528
TOTAL 18436
Table 10. Summary of CC’s 20052006 Emissions, Emission Coefficients, and MTCDE in the following sectors: electricity, natural gas, landfill waste, refrigerant, fertilizer, and transportation.
Sector Emissions Emission
Coefficients CC's Emissions (MTCDE/KWh) (MTCDE)
Electricity (kWh) 4065643 0.00033 1348
Natural Gas (MMBtu) 5955 0.053 316 Landfill Waste (Short tons) 791 0.1467 116 Refrigerant HCFC-22 (lbs.) 121 0.77 93
Fertilizer (lbs.) 1650 0.0038 0.1
Transportation 16555 TOTAL 18428
Table 10. Summary of CC’s 20062007 Emissions, Emission Coefficients, and MTCDE in the following sectors: electricity, natural gas, landfill waste, refrigerant, fertilizer, and transportation.
23
Conclusions
Our first task is complete – we have developed a baseline carbon emissions inventory ‐ but the work that I am most excited about lies ahead! Centralia College is now beginning to formulate concrete goals for the reduction of carbon emissions and to develop and institute a plan of action. How can we best facilitate a change in deeply ingrained behaviors such as commuting habits? Clearly, the answer demands a creative, multi‐faceted approach. Significant change will be challenge no doubt, but with the support of Centralia College’s sustainability committee, an exceptionally inspired, motivated, and eclectic group of faculty, staff, students ‐ including the college president, the head of grounds, the head of maintenance, the head of purchasing, and student body government representatives ‐ I am both hopeful and excited about the road that lay ahead.
I know that I am fortunate to have the opportunity to immerse myself in this sustainability project, to work to elicit real, positive change. I have learned much the challenges and excitements of working with a diverse group toward a common goal and I have also learned much about the realities of time and resource constraints. This summer I will focus my work on reducing CC’s commuting footprint by negotiating more convenient bus routes with public transit, developing a carpool website, investigating the possibility of installing bike racks and bike lockers, and developing a sustainability workshop for incoming students. I am optimistic that next year’s footprint will be smaller than the last!
24
References
Campus Carbon Calculator. Clean Air‐Cool Planet. http://www.cleanair‐coolplanet.org/. 2008. Accessed Spring 2008.
CFC StarTec LLC�Stow. “Refrigerant Recovery Recycling: Dichlorodifluoro�methane�R-12”.ecgas_products/r12.htm http://www.c‐fc.com/sp . Accessed June 2, 2008
US Environmental Protection Agency. “What You Should Know about Refrigerants When Purchasing or Repairing a Residential A/C System or Heat Pump”. http://www.epa.gov/ozone/title6/phaseout/22phaseout.html. March 14. 2008. Accessed June 2, 2008.