centrality as a process accounting for attraction inequalities in ... 2nd symposium 9… · s pace...
TRANSCRIPT

����
S P A C E S Y N T A X S E C O N D I N T E R N A T I O N A L S Y M P O S I U M • B R A S I L I A � � � �
PPPPP R O C E E D I N G SR O C E E D I N G SR O C E E D I N G SR O C E E D I N G SR O C E E D I N G S V V V V VO L U M EO L U M EO L U M EO L U M EO L U M E I I I I I I I I I I
CENTRALITY AS A PROCESS
accounting for attraction inequalities in deformed grids
Professor Bill HillierUniversity College London, London, United kingdom
0 AbstractThe ‘centre’ of a settlement, whether city, town or village, usually means a concen-tration and mix of land uses and activities in a prominent location. At any point intime, it is usually fairly clear where the centre is and what its limits are. However, theneed to revitalise the centres of towns and cities, has drawn attention to how littlewe know of the processes by which centres are generated and sustained. Histori-cally, it is clear that centres not only grow and shrink, but also shift and diversify, andwith growth to large town or city level, a whole hierarchy of centres and subcentresusually appears diffused throughout the settlement. The challenge is to understandcentrality as a process, rather than to describe it as a state. In this paper it is pro-posed that well-defined spatial factors first play a critical role in the formation andlocation of centres, and then play an equally critical role in developing and sustain-ing their vitality. The process works through the impact of spatial configuration onmovement, and the subsequent influence this has on land use choices, and the de-velopment of the area as an ‘attractor’ in the settlement layout as a whole. A properunderstanding of these spatial factors and the processes they set in train is, it isargued, vital to any programme for the revitalisation, sustaining or long term devel-opment of centres.
1 Introduction: the problem of centralityThe term ‘centre’ applied to settlements has functional and spatial elements. Func-tionally, it means a distinctive concentration and mix of activities in a certain area,spatially a certain position for that area in the settlement as a whole. A functionalmethod for identifying the limits of English town centres, combining GIS analysisof land uses and demography with reviews of informed opinion, has recently beenestablished by Professor Batty and his colleagues (Batty et al, 1997). But what of thespatial aspects ? Are the land use aspects independent of space, and the focus andlimits of the centre imposed solely by history ? Or do they occur in well definedspatial positions in settlements ? Do all functional aspects of centres interact withspace in the same way ? Or do some require and even generate special local gridconditions, as suggested by the recent studies of Australian and US cities by Siksna(Siksna 1997) ? And what about change ? Do centres change solely in response toeconomic or planning decisions ? Or are there underlying spatial processes whichtend to push centre development this way or that ?
The aim of this paper is to complement the work of Batty’s team by outlining aspatial model for the development of a key component of centrality - ‘live centrality’- at all levels of settlements. ‘Live centrality’ means the element of centrality whichis led by retail, markets, catering and entertainment, and other activities which ben-
Keywords: space syntax, centrality, at-
traction, configuration
Professor Bill Hillier
The Bartlett School of Graduate Studies
(Torrington Place Site)
University College London, Gower Street
London WC1E 6BT, England
tel (44) (0)171 391 1739
fax (44) (0)171 813 4363
email [email protected]
www http://www.spacesyntax.com

����
S P A C E S Y N T A X S E C O N D I N T E R N A T I O N A L S Y M P O S I U M • B R A S I L I A � � � �
C e n t r a l i t y a s a P r o c e s s ; a c c o u n t i n g f o r a t t r a c t i o n i n e q u a l i t i e s i n d e f o r m e d g r i d s • B i l l H i l l i e r
efit unusually from movement. The argument is confined to the live centre becausethe spatial processes governing live centrality appear to invoke spatial requirementsover and above those related to other central functions such as administration, officeemployment or religion. The key proposal is that a distinctive spatial component isalways present in live centres because at all level it occurs in locations favoured by andinfluenced by the ‘movement economy’ process (as outlined in Hillier 1996a (Chapter4) & b). The theory of the ‘movement economy’ was developed from the notion of‘natural movement’ (Hillier et al 1993) which had arisen from studies showing that,other things being equal, movement flows in different parts of a street network weresystematically influenced by the spatial configuration of the network itself. The ‘move-ment economy’ theory built on this, and proposed that evolving space organisation insettlements first generates movement patterns, which then influence land use choices,and these in turn generate multiplier effects on movement with further feed-back onland use choices and the local grid as it adapts itself to more intensive development. Itis the movement economy, it is argued, that gives rise to the seamless web of higherand lower intensity areas, including the centre itself as the area of highest intensity,that characterise towns and cities in general.
Spatially, the movement economy process works at two levels in generating a pat-tern of centrality: a global level and a local level. Globally, the process selects loca-tions which have the appropriate degree of integration with respect to the settle-ment as a whole. Locally, locations are selected with certain local grid conditions.Both aspects of the process are dynamic. As settlements grow, the pattern of globalintegration is likely to change, and this will create spatial pressure for a shift in thefocus of centrality. An outward shift is the most characteristic manifestion of this.Locally, as centres grow, they create pressure for greater local integration of thekind described by Siksna, that is grid intensification and smaller block size to allowgreater ease of movement within the centre. The greater the scale of the centre, thestronger the ‘Siksna process ‘will be.
A theoretical context to this paper is provided by the debate between configurationand attraction as rival concepts in accounting for urban movement, and the influ-ence movement has on the long term evolution of the urban surface. In spite of theconsistent success of configurational measures in predicting movement, it is clearthat in centres at all levels attraction plays ande important role in drawing people tothe centre. In any urban model that seeks to capture the morphological dynamics ofthe urban surface, the phenomena to be explained are both the spatial configura-tion we call the town plan and the pattern of centres and subcentres, or attraction
inequalities , in the plan. In syntactic terms, the problem is to extend the analysis ofconfiguration to take account of these attraction inequalities in some way.
In this paper a clear answer to this problem is proposed: that configuration gener-ates attraction, at least as far as live centres are concerned, and that the appearanceof attraction inequalities in the urban surfaces is to be accounted for by the spatiallydriven movement economy process. This is not to discount the obvious fact that it iteconomic and political factors that eventually determine urban development, onlythat these factors work within the constraints and limits set by the fact that central-ity is a spatially led process.

����
S P A C E S Y N T A X S E C O N D I N T E R N A T I O N A L S Y M P O S I U M • B R A S I L I A � � � �
PPPPP R O C E E D I N G SR O C E E D I N G SR O C E E D I N G SR O C E E D I N G SR O C E E D I N G S V V V V VO L U M EO L U M EO L U M EO L U M EO L U M E I I I I I I I I I I
2 The phenomena of centralityAt first sight, understanding centrality in towns and cities does not seem to beproblematic. Both spatial and functional aspects appear clear and stable: a his-toric high street or market square as a focus, perhaps, and a concentration ofurban functions that have grown up around it to create a central area. Typically, acentre would be marked by a focal ‘live centre’ of markets and retail, with quieterzones of administration, business and religion in close spatial proximity definingthe limits of the central area. All we would need know to understand centrality insuch cases would be to identify the focus, describe the limits and map the variousfunctions in their locations.
As soon as we take time into account, however, we find that centrality is often nei-ther clear nor stable, either in its focus or its limits. Although in many settlementsthe location and limits of the centre do remain more or less in the same place overlong periods, in others the centre not only expands or contracts, but may also shiftits focus. Most commonly this displacement of the centre is from a historical coretowards what was once an edge. Even in quite small settlements this progressivedisplacement of the centre towards the edge can often be found. For example, inmany small hill towns in France and Italy, we find a gradual shift of the ‘live centre’from the older, upper parts of the town towards the more active edges lower down,where inter-settlement movement is to be found, perhaps leaving other central func-tions behind. We can find similar processes even in the most culturally traditionalof towns such as Ghardaia and Beni Isguen in the Mzab in Algeria (Salah-Salah,1987). ‘Edge city’, it seems, is not a recent state of affairs: it is one one of the el-ementary processes of urban growth (as argued in Hillier 1996, Chapter 9: ‘Thefundamental city’).
Centres can also diversify with growth, and the tendency to functional speciali-sation of sub-areas that we find in historic ‘centres’ can in larger cities becomespatially distinct centres for different type of function. Both this process, andthe edge city process, are evident in London, where the main ‘live centre’ is inthe Oxford Street area - once an ‘edge city’ - at some distance from both thecentre of office employment, which remains in the original historic centre, theCity of London, and the centre of administration and religion, which grew upsome distance away in Westminster. The formal centre of London is identifiednot by a concentration of functions in a particular area but by a point south ofTrafalgar Square defined between the three main functional ‘centres’, but lyingclearly outside all three.
With enough time and growth the problem of centrality in settlements takes yetanother form. In most cities of any size, the problem is not simply to account for ashifting centre or centres, but for a whole ‘hierarchy of centres and subcentres’that pervade the urban structure, ranging from large local centres which can rivalor even outstrip the main centre in levels of activity, down to the small groups ofshops and other facilities that act as focal points for local areas. Again we are notdealing with a steady state. At all levels of the hierarchy, centres grow and fade,often in response to changing conditions quite remote from the actual centres.

����
S P A C E S Y N T A X S E C O N D I N T E R N A T I O N A L S Y M P O S I U M • B R A S I L I A � � � �
C e n t r a l i t y a s a P r o c e s s ; a c c o u n t i n g f o r a t t r a c t i o n i n e q u a l i t i e s i n d e f o r m e d g r i d s • B i l l H i l l i e r
2.1 Centrality as a process
Centrality, then, is clearly not simply a state, but a process with both spatial andfunctional aspects. As a process, it is found to some degree at every level of theurban structure, and may over time change what once seemed a steady state into anew pattern. It follows that to understand centrality, in a way that will be robustenough to guide decisions about the future, we must seek to understand it as aspatio-functional process, not simply as a state, or series of states, at particular pointsin time. The description of states will of course be essential to developing knowl-edge of centrality, but for an effective understanding we must go beyond these de-scriptions and seek to understand how the changing states of centrality are the prod-ucts of continuing spatio-functional processes. To attend only to states might be torisk mistaking a momentary state of affairs for a natural state of things. As ProfessorBatty points out (Batty 1998 p 22), a preoccupation with states, if linked to policy,could undermine the very spatial dynamics that give rise to the kind of centralityphenomena that we seek to conserve or reanimate.
To understand centrality then we must investigate the relation between its spatialand its functional dynamics, and seek to know how these are driven by the socialand economic life of urban societies. Centrality is a spatial case of our need to un-derstand the relation between structure and function in cities. An understanding ofcentrality would most likely to take the form of a ‘structure-function’ model capableof showing how spatial and functional dimensions were interrelated, and how bothwere driven by social and economic activity. Here, it is proposed that the ‘move-ment economy’ process is such a model.
3 First order diagnostics: syntactic analysis and its limitationsThe problem is how should we detect the process in operation. In the absence oftime-series data spread over decades or even centuries, we must adopt a more diag-nostic approach: to try to identify the process by its products. If the movement
C
B
Figure 1: London (lograd-3)
a
b
My
c
Qw
Sj
El
figure 1. London Log integration Map

���
S P A C E S Y N T A X S E C O N D I N T E R N A T I O N A L S Y M P O S I U M • B R A S I L I A � � � �
PPPPP R O C E E D I N G SR O C E E D I N G SR O C E E D I N G SR O C E E D I N G SR O C E E D I N G S V V V V VO L U M EO L U M EO L U M EO L U M EO L U M E I I I I I I I I I I
economy is the process by which centrality in general is created, then its effectsshould be detectable in consistent relations between the functional variables bywhich we mark centrality - land uses concentrations and mixes, demographic fac-tors and so on - and distinctive types of spatial patterning. The key questions thenbecome: do we find distinctive types of spatial pattern in functionally defined cen-tres, and if so, what are they ? Are they to do with the global settlement form, as thenotion of centrality implies. If so, how can this be applied to local centres and subcentres ? Or are local grid conditions critical, as implied by Siksna’s work ? Dodifferent spatial factors perhaps operate at different levels of centrality ?
Our first need then is for diagnostic techniques. Let us begin in the obvious place:with orthodox syntactic analysis. Integration analysis, after all, measures somethinglike ‘topological centrality’ in a line complex at whatever level we choose to set ourradius. In London, both global and local integration pick out Oxford Street as theprime integrator, and the West End as the most integrated area Looking at theradius-3 integration map (the logged version) in Figure 1, we also find a wholeseries of long, sometimes wandering routes picked out, mostly but not all radial, andmost with significant subcentres along their length.
This is promising, far too incomplete to be anything but a suggestive beginning.There is no identification of where along a line the main concentrations of activityoccur, nor of the local extent of these concentations. More strikingly, the analysisfails altogether to identify certain quite large local subcentres which are not on mainroutes, such as Marylebone High Street (marked My in Figure 1), St John’s WoodHigh Street (marked Sj) and Queensway (marked Qw), or more local ‘village’ cen-tres such as Thornhill Road in Barnsbury (marked Bb), Canonbury village (markedCn), or England’s Lane (marked El). None of the focal lines for these ‘centres’ areidentified as significantly different from others in their neighbourhood.
What is missing ? Let us try some more precise diagnostics - or perhaps heuristicswould be a better word. Consider first the main north west radial in Figure 1, theEdgeware Road, beginning at the top left arrow. Figure 2 extracts its lines from theaxial map, together with all lines up to two steps from the lines (the minimum con-ditions for creating an orthogonal grid) to allow us to examine the changing localgrid conditions along the line. Three distinct (and quite large) local live centres liealong its length, each picked out by a black background: Cricklewood High Streetthe most northerly, marked a in Figure 1, Kilburn High Street in the centre markedb, and finally the section between the Harrow Road to Oxford Street, marked c. Isthere any way in which the sections of the road that have become live centres aresyntactically distinctive. The answer is clear. Each such section is characterised by amore intensive ‘2-step grid’ than the noncentre sections of the lines, in the sensethat there are larger numbers of smaller blocks close to the line section. This has thesimple effect that good numbers of buildings whose entrances face on to the thoselines are within a short distance of the live centre line. The local grid conditions,we may say, are distinctive in the live centre parts of the line, and in a way thatwould seem to maximise local accessibility of dwellings to that line. Preliminarystudies of other lines such as the Kingsland Road (top right arrow in Figure 1) sug-gest similar effects might be found elsewhere.

����
S P A C E S Y N T A X S E C O N D I N T E R N A T I O N A L S Y M P O S I U M • B R A S I L I A � � � �
C e n t r a l i t y a s a P r o c e s s ; a c c o u n t i n g f o r a t t r a c t i o n i n e q u a l i t i e s i n d e f o r m e d g r i d s • B i l l H i l l i e r
Figure 2: Edgeware Road
Figure 3: Marylebone Route Sequence
Figure 4: Barnsbury Route Sequence
figure 2
figure 3
figure 4

���
S P A C E S Y N T A X S E C O N D I N T E R N A T I O N A L S Y M P O S I U M • B R A S I L I A � � � �
PPPPP R O C E E D I N G SR O C E E D I N G SR O C E E D I N G SR O C E E D I N G SR O C E E D I N G S V V V V VO L U M EO L U M EO L U M EO L U M EO L U M E I I I I I I I I I I
Fgure 5: Marylebone and Barnsbury on their own
Figure 6: 2-step grids from selected live centre lines
Queensway
England's Lane
St John's Wood High Street
Canonbury village
Figure 6b: 2-step grids from further selected live centre lines
Crawford Street Lambs Conduit Street
Columbia Road Kings Road
Whitecross Street
Chalton Street
figure 5
figure 6a
figure 6b

����
S P A C E S Y N T A X S E C O N D I N T E R N A T I O N A L S Y M P O S I U M • B R A S I L I A � � � �
C e n t r a l i t y a s a P r o c e s s ; a c c o u n t i n g f o r a t t r a c t i o n i n e q u a l i t i e s i n d e f o r m e d g r i d s • B i l l H i l l i e r
However, if we look at the ‘high streets’ and ‘village centres’ not on main radials(marked with a capital and lower case letter on FIgure 1) we do not find thismetrically intensive local pattern. But we do find a local syntactic pattrern whichhas at least some comparable properties. For this, we need a slightly differentheuristic technique. Because the ‘centres’ are not on long radial lines,we con-struct a local route that passes through the live centre line and look at changinglocal grid conditions on each section of the route. Figure 3, for example, is sucha route for Marylebone High Street. The figure shows the sequence of 2-stepgrids from each line on the route. We see that the live centre line shown topright is distinctive in that it covers whole of the local grid, whereas others onlydefine a part of it. Figure 4 is a similar sequence for the much smaller scale livecentre line for Barnsbury village, this time ending on the live centre line. Againwe see that the local live centre line is distinctive in being the only line thatcovers the whole system. If we then look at the integration maps of the twoareas on their own (cut out from the surrounding grid - Figure 5), we can seewhy this is the case. In both cases, the live centre line is the principle integratorin the local system, and in both cases it is because the live centre line is the onethat in effect joins together local grids which are otherwise relatively distinct.As a result, a more complete local grid can be ‘seen’ within two steps from thecentre line than form any other local line.
Figure 6a then show the 2-step grids for four more smaller scale local centres.The two ‘high streets, St John’s Wood High Street and Queensway both linklocal grids which are otherwise less well connected to each other. The two ‘vil-lages’ each define in their own way a well-defined local grid comparable toBarnsbury village. In all four cases, other local lines defined much less com-plete local grids. Figure 6b then takes another five local live centre lines, in-cluding three with street markets:Whitecross Street, Chalton Street and Co-lumbia Road. In each case, the line is a relatively local line, though usually linkeddirectly to a more strategically important line in the area (Chalton Street con-nects to the Euston Road and Crawford Street to Baker Street, while ColumbiaRoad is just off Hackney Road). Each has a strikingly well-defined and moreintensive 2-step grid than other lines in the vicinity.
We see then that the ‘local grid conditions’, as shown by the ‘2-deep’ grid from aline, thus seem to be a distinctive spatial property of live centre lines. Sometime the2-deep grid describes a more compact and sometimes a looser structure, but thefact that in each case the same 2-step definition of local grid conditions does markout the local centre as distinctive, albeit with varying metric properties, is sugges-tive. Now let us try a third heuristic. Figure 7 is an axial map of the northwest partof the borough of Camden in London with all 1160 current shops (checked throughdirect observation, because the critical relation is the relation between the shopand the line onto which it opens) and their type located as dots in 49 local centres,varying in scale from minor high streets to single shops. The map was created byMaria Adriana Gebauer-Munoz, a doctoral student at UCL, and a senior lecturer atthe Universidad Catolica del Norte in Antofagasta in Chile. Gebauer-Munoz’s aimwas to ask what if any spatial properties could be systematically related to the differ-ent scales of the ‘centres’ shown by the map, measuring the scale simply by the

����
S P A C E S Y N T A X S E C O N D I N T E R N A T I O N A L S Y M P O S I U M • B R A S I L I A � � � �
PPPPP R O C E E D I N G SR O C E E D I N G SR O C E E D I N G SR O C E E D I N G SR O C E E D I N G S V V V V VO L U M EO L U M EO L U M EO L U M EO L U M E I I I I I I I I I I
Figure 6: Camden Shops
number of shopping, catering and entertainment outlets. Spatial variables were ex-plored at two levels: for the lines on which shops occurred; and for an amendedversion of the map where lines were added representing the ‘shopping segments’ ofthe lines, ending where the shops ended. The spatial variables explored were thevarious syntactic values of lines and ‘shopping segments’, the combined syntacticvalues of pairs of lines or segments forming intersections, and various measures ofthe local grid conditions for the lines and segments. The results were striking.Multiple regression using the main spatial variables produced an r-squared of .735from 10 variables. The best r-squared for a single syntactic variable was .286 forlocal integration, the best for intersections was .377 for the sum of connectivities ofintersection, but the best by far was .519 for local integration for segments (seebelow) - that is for the integration of the 2-deep grid from the ‘shopping segment’of the line. Stepwise regression on the spatial variables then showed that local gridconditions, as measured by the local integration value from the segment was themajor variable, with a minor role for global integration in the area. Once again,local grid conditions are shown to be the key variable associated with the degree oflocal centrality.
1
1.5
2
2.5
3
3.5
4
4.5
5
5.5
.7 .75 .8 .85 .9 .95 1 1.05 1.1 1.15global/londall
ln(x
) of
tota
l ret
ail+
ent
y = 2.536x + .583, R-squared: .049
. 5
1
1.5
2
2.5
3
3.5
4
4.5
5
5.5
1 1.5 2 2.5 3 3.5 4 4.5 5 5.5 6local/nw-camden
ln(x
) of
tota
l ret
ail+
ent
y = .653x + .212, R-squared: .286
1
1.5
2
2.5
3
3.5
4
4.5
5
5.5
1.5 2 2.5 3 3.5 4 4.5 5µconn1st+2ndInters
ln(x
) of
tota
l ret
ail+
ent
y = .984x - .225, R-squared: .377
1
1.5
2
2.5
3
3.5
4
4.5
5
1.5 2 2.5 3 3.5 4 4.5 5segmentshop local
ln(x
) of
tota
l ret
ail+
ent
y = .798x + .141, R-squared: .519
figure 7

�����
S P A C E S Y N T A X S E C O N D I N T E R N A T I O N A L S Y M P O S I U M • B R A S I L I A � � � �
C e n t r a l i t y a s a P r o c e s s ; a c c o u n t i n g f o r a t t r a c t i o n i n e q u a l i t i e s i n d e f o r m e d g r i d s • B i l l H i l l i e r
4 The transect methodIn all the cases we have considered so far, retail is essentially linear in its spatialorganisation, usually on a single line, through occasionally on two or more intersect-ing lines. Some degree of linearity will always be retained, to a greater or lesserdegree in different circumstances, but in the next section we will see how retailmoves from a linear towards a convex form of organisation in the centre itself. Wewill examine this through a new heuristic, this time aimed at main urban centres. Inthis series of studies we will use the work of Dr Kayvan Karimi, carried out (thoughnot using the transect method) as part of his doctoral research.
Consider first a town with a fairly well defined historic centre, York. Figure 8 is firstorder axial analysis of the whole built up area of York showing global integration.The main integrators are a sequence of lines passing east west through the mainretail centre, with the line actually in the main retail centre (Micklegate) as theprinciple integrator. As with London, we have clues to centrality, but not an accountof the centre itself.
Suppose we then ask a simple question. If local grid conditions are different in thecentre, then a route from the edge of the city through the centre and out the otherside recording the changing local grid conditions ought to provide some indicationof these differences. Figure 9 is a ‘transect’ of York taking the main through route(though not passing down the main shopping street) from the north west to southeast through the central area and attaching the 3-deep local grid to the route, onemore than in the London case to allow for the greater deformity of the grid. A 2-step transect tells a similar story, but the 3-step transect is clearer. The transectshows the changing ‘local grid conditions’ associated with each stretch of the route.To facilitate comparison Figure 10 then divides the 3-transect into sections, definedby relative gaps in the local grid. This also allows independent syntactic analysis ofeach section, the results of which are set out in Table 1.
Visual inspection of Figure 10 shows that the central area is distinctive in severalways:
- the metric area covered by the 3-step grid in the central area is both more com-pact and convex than other sections of the route. The route lines in the centre arerelatively short compared with other sections of the route, and the lines up to threesteps deep from the route tend also to be be shorter; however
- in spite of relative shortness of the lines, the number of islands (or urban blocks)defined by the lines in the centre is much larger (31) than anywhere else. If we lookalong other parts of the route then we find that many - or in some cases most - of thelines do not define islands at all (that is, they do not form part of the local rings ofcirculation that must, by definition, surround urban blocks) and others define oneor two blocks only. In the centre, the lines tend to help define several blocks in spiteof being shorter.
- the previous two point imply that the mean size of island in the central area mustbe much smaller than elsewhere, and this is clearly the case; and finally:

�����
S P A C E S Y N T A X S E C O N D I N T E R N A T I O N A L S Y M P O S I U M • B R A S I L I A � � � �
PPPPP R O C E E D I N G SR O C E E D I N G SR O C E E D I N G SR O C E E D I N G SR O C E E D I N G S V V V V VO L U M EO L U M EO L U M EO L U M EO L U M E I I I I I I I I I I
Figure 10: Sections of Transect Analysis in York
Section 1 Section 2 Section 3 (town centre)
Section 4 Section 5 Section 6
1
2
3
4
5 6
KEY:
Figure 8: Integration Map of York
figure 8
Figure 9: Transect Analysis of York (grid pattern created by up to three steps away from a through route in York)
Key:
transect route
first step second step
third step
figure 9
figure 10

�����
S P A C E S Y N T A X S E C O N D I N T E R N A T I O N A L S Y M P O S I U M • B R A S I L I A � � � �
C e n t r a l i t y a s a P r o c e s s ; a c c o u n t i n g f o r a t t r a c t i o n i n e q u a l i t i e s i n d e f o r m e d g r i d s • B i l l H i l l i e r
- the blocks in the centre are densely packed in an overall convex shape with a higharea-perimeter ratio i.e approximate a circular or square form, rather then a jagged,fragmented or elongated form. This is a functionally interesting property since,other things being equal, the more a shape approximates a circle (as a square does)the shorter will be the mean trip length within the shape.
Figure 11 then shows the ‘live centre’ - the principal streets with continuous shop-ping - of York - part of the centre section identified by the transect (which passedalongside the main shopping area). The overall convex and compact shape of thecentre is preverved, though with rather more elongation in the north south direc-tion than the east west direction. We see that dense retail does not develop in thelooser grid to the east of the transect route to the same degree as to the west wherethe grid is smaller scale. Within the live centre area, the internal small scale streetsin fact nearly all also have continuous retail, and a market square is also to be foundhere. To the east it tends instead to form short ‘spikes’ leading in and out of the mainretail area to the west.
Figure 11: Live Centre of York (integration analysis and the main retail streets are shown for the central grid)
YORK
LIVE CENTRE OF THE TOWN
MAIN RETAIL STREETS
KEY
figure 11
table 1

�����
S P A C E S Y N T A X S E C O N D I N T E R N A T I O N A L S Y M P O S I U M • B R A S I L I A � � � �
PPPPP R O C E E D I N G SR O C E E D I N G SR O C E E D I N G SR O C E E D I N G SR O C E E D I N G S V V V V VO L U M EO L U M EO L U M EO L U M EO L U M E I I I I I I I I I I
This distinctive ‘compact and convex’ shape of the live centre, with a more intensiveinternal local grid, turns out to be very characteristic of town centres in the UK. Forwant of a better term, we have call this shape a ‘spiky potato’ to capture the irregu-lar approximation of compact convexity, and also to capture the relatively short linksthat usually link the convex shape outwards into the surrounding area. Spiky potatoforms are also found in similar analyses of four other towns by Karimi. Figure 12shows 3-transects for Winchester, Hereford, Canterbury and Norwich, and Figure13 extracts the ‘live centre’ from each. In each case, a compact and convex shapeappears, with more linearity in smaller cases, and more convexity in larger.
Table 1 then sets out the main syntactic values for the transect sections of all fivetowns, from edge to live centre then out to the opposite edge. We see that in eachcase, three critical syntactic values: local integration, global integration, and thecorrelation between the two (the latter indicates the degree of symbiosis or synergybetween the local and global patterning of space, a vital property of space in urbanareas - see Hillier 1996, Chapter 4), all increase as you move towards the centre,peak in the live centre, and then reduce as you progress to the opposite edge. The
Figure 12: Transect Analysis of four English Towns (grid pattern created by up to three steps away from a through route in four English towns)
Hereford
Winchester
Canterbury
Key:
transect route
first step second step
third step
Norwich
figure 12
Figure 13: Live Centres of Four English Traditional Towns (integration analysis and the main retail streets are shown on the central grid)
HEREFORD
CANTERBURY
NORWICHWINCHESTER
CASTLE AREA
City Hall
Market Square
LIVE CENTRE OF THE TOWN
MAIN RETAIL STREETS
KEY
figure 13

�����
S P A C E S Y N T A X S E C O N D I N T E R N A T I O N A L S Y M P O S I U M • B R A S I L I A � � � �
C e n t r a l i t y a s a P r o c e s s ; a c c o u n t i n g f o r a t t r a c t i o n i n e q u a l i t i e s i n d e f o r m e d g r i d s • B i l l H i l l i e r
numerical pattern is remarkably consistent, and confirms the results of the graphi-cal appraisal. As you move towards the live centre, the grid becomes more compact,convex and subdivided, and at the same time more integrated and with a betterdefined relation between global and local structure.
The results, though preliminary, suggest that there may be clear syntactic correlatesfor centrality, and that these can express in numerical form some of the characteristicsof a compact and convex shape with short links outwards on integrated lines lininginto the surrounding area coupled to a dense internal grid with small islands. Theoverall spiky potato shape formed by the live centre is also remarkably consistent,though always reflecting to some degree the linear nature of the original generators ofthe live centre. Karimi in fact notes that in Iranian cities the live centre tends to re-main more linear with slower development of a convex form (Karimi 1997).
5 Interdependence, interaccessibility and the shape of centralityWhy then should these be the properties associated with centrality ? They are, it issuggested, all natural products of the movement economy process. Town centres, itis suggested, can be defined as complexes of interdependent facilities, so that ifyou come to use one, it is easy to use others. The criterion for whether or not adevelopment would be ‘part of the town centre’ reflects this interdependence: ifpeople come to use this, will they also use other facilities in the centre ? Whether ornot interdependence is effective depends on interaccessibility: it must be possi-ble to get from any facility to any other by a quick and easy route which stays withinthe town centre and which itself is lined with town centre facilities to maximisenatural access to all facilities.
In a town centre, in short, it must be possible to search, explore and find, and thebasic rule is that wherever you get to, you can still find an easy route to anything elseyou want to visit without going back over the same route. Interaccessibility shouldalso be reflected in the pattern of access to the centre: whichever direction youapproach the centre from, the whole centre should quickly make its interaccessibilityavailable and obvious. The effect of this will be that although bits of the centre growout along these routes to some extent, it will happen in such a way as to conserve theintegrity of the whole. The overall shape of a town centre is thus an overall compactconvex shape with spikes - the ‘spiky potato’ - with a series of quantifiable spatialcharacteristics reflecting interaccessibility which peak in the live centre, and fall offtowards the edges of the settlement.
From a spatial point of view, then, centrality seems to be a product both of theoverall configuration of the grid, which decides where the centre should be, and ofthe kind of local process of grid adaptation and intensification predicted by thetheory of the movement economy, and described by Siksna (Siksna 1997) in hisstudies of American and Australian centres. In our small sample of towns, we findthat in each case, the ‘live centre’ develops as a ‘compact and convex’ shape, withlinks reaching into the surrounding area in all key directions. It is this ‘spiky potato’shape, coupled with its high internal integration and local-global symbiosis, thatcreates the interaccessibility that is required by the interdependent facilities of thelive centre, and which is created as the settlement evolved by the processes of natu-

����
S P A C E S Y N T A X S E C O N D I N T E R N A T I O N A L S Y M P O S I U M • B R A S I L I A � � � �
PPPPP R O C E E D I N G SR O C E E D I N G SR O C E E D I N G SR O C E E D I N G SR O C E E D I N G S V V V V VO L U M EO L U M EO L U M EO L U M EO L U M E I I I I I I I I I I
ral movement and the movement economy. Successful live centres require both aglobal position in the settlement, and compact and interaccessible local layoutconditions. This is the basic shape of centrality.
5.1 Reflections on centrality
We have now looked at several kinds and scale of centrality, in different urbansituations. Can they be linked together into a single conjectural model ? The fol-lowing might be suggested:
- initially, the live centre is linear, on a section of a most integrated line, probablydefined in relation to its most integrated intersection; - as the settlement grows, a convex Siksna process of grid intensification and met-ric integration develops in the live centre; - with linear growth away from the centre, local subcentres develop on radialsselected by local metric 2-deep conditions, but in themselves remain linear; - with further growth, smaller scale subcentres develop away from main radialswhere there is a locally strong 2-deep structure but without metric 2-deep condi-tions.
In general, the ‘Siksna process’ of convex live centre formation seems to be gov-erned by scale. Only a major centre is strong enough to call it into play. Weakercentres tend to remain more linear. In all cases, however, local grid conditions arecritical to the live centre, initially selecting between integrated locations by pro-viding a locally accessible catchment area, and subsequently by providing the logicof growth of the live centre from a linear to a convex form.
5.2 Movement generators of centrality
How then does centrality fit into the overall logic of the urban grid ? In a recentpaper on the geometry underlying the deformed grids of organic cities (Hillier 1999)it was proposed that the fundamental influences shaping the evolution of large scaleurban grids were two kinds of movement. The first is linear movement from specificorigins to specific destinations, and the dominant manifestation of this are the quasilinear radials that connects the central areas of cities with their edges, as so fre-quently picked out by syntactic analysis. These alignments are usually composed oflong lines, or sequences of fairly long lines connected to each other by obtuse angleintersections, thus minimising distance from origin at the edge to destination in oraround the centre. These can be clearly seen in Figure 1 of London. This pattern ispervasive in the sense that a peripatetic observer moving around the grid who findsan obtuse angle connection and continues along the alignment would be very likelyto find another obtuse angle connection continuing the alignment. Once this hadoccurred the probability of another would be even greater. The distribution of an-gles of incidence for lines was thus seem as playing a key role in making the urbansurface intelligible. We can call this kind of movement moving-to, and note that itgenerates forms which are essentially 1-dimensional.
In constrst to this, the second kind of movement is ‘moving around’ movementwithin a local area, and relats all origins and all destinations within that area. Thistype of movement is essentially convex in form, and optimally generates not quasi

�����
S P A C E S Y N T A X S E C O N D I N T E R N A T I O N A L S Y M P O S I U M • B R A S I L I A � � � �
C e n t r a l i t y a s a P r o c e s s ; a c c o u n t i n g f o r a t t r a c t i o n i n e q u a l i t i e s i n d e f o r m e d g r i d s • B i l l H i l l i e r
linear sequences of lines connected by obtuse angles but quasi grids, in which linesintersect appromimately at right angles, and continue to form other quasi-right an-gle intersections with other lines. This process has the effect of optimising ‘metricintegration’ in two dimensions, that is minimising means trip lengths from all pointsto all others within a 2-dimensional zone, as opposed to metric integration in 1-dimension for the quasi linear radials. The 2-dimensional zone where this process ismaximised is the centre of the settlement, but it also occurs in other parts of thesettlement and where it does it generates subcentrality proportionate to its localgrid development. Thus The 1-dimensional radial structure defines where the cen-tre it to be, and eventually creates the spikes that link the compact and convex cen-tral shape into the 1-dimensional system, while the compact and convex shape itselfis the product of the movement economy process working 2-dimensionally in thevicinity of the lines selected by the 1-dimensional structure.
The centrality process is thus driven by distance minimisation in one dimensionand in two. 1-dimensional distance minimisation generates the main radial struc-ture of the grid, as usually picked out by the global integration core of the settle-ment. 2-dimensional distance minimisation creates the local metrically and syntac-tically integrated quasi-grids that form the distribution of attraction inequalities inthe grid. 1-dimensional movement defines where the movement economy processwill operate to generate local or global centrality. The 2 -dimensional process is thenthe means by which the movement economy process creates its attraction inequali-ties.
Gien this thepretica model, we may now reflect on its intrinsic dynamics. As we willsee, exploration of these dynamics suggests in fact that all the properties we find incentres - a compact and convex shape, a small scace internal grid, and so on - arisefrom optiomising a single variable: ‘metric integration’ (Hillier 1996a, Chapter 3) -and with the unexpected bonus that we can begin to show that the idea of attractionnot only interacts with configuration, but in fact has a configurational interpretationso that we can unify the two concepts.
6 Metric integration and attractionThe idea of metric integration arises from the suggestion that the success of syntac-tic integration as a measure is that it is ultimately an expression of ‘universal dis-tance’. This is defined, in contrast to ‘specific distance’ which measure the distancefrom a to b, as the distance from one point to all others in a shape. In practice this isshown by representing a shape as an arbitrarily fine tessellation, then treating thetessellation elements as the nodes of a graph and the facewise joins between ele-ments edges. Configurational measures can then be applied in the normal way, giv-ing results such a measures of shape expressing mean trip distance within the shape,and other measures analogous to area perimeter ratios.
From the point of view of centrality, the interesting thing is how metric integrationbehaves under architectural and urban conditions. We can explore this by repre-senting the axial map (or even the full two dimensional shape of urban spaces), as alinear tessellation, so that each element of the tessellation is uniform in size. Inte-gration analysis at radius-n thus measures the distance form each element to all

����
S P A C E S Y N T A X S E C O N D I N T E R N A T I O N A L S Y M P O S I U M • B R A S I L I A � � � �
PPPPP R O C E E D I N G SR O C E E D I N G SR O C E E D I N G SR O C E E D I N G SR O C E E D I N G S V V V V VO L U M EO L U M EO L U M EO L U M EO L U M E I I I I I I I I I I
Figure 14: An orthogonal grid (A) with fewest axial lines is metrically more integrated than axially more complex structures.
A.1561 B.1625 (lower is more integrated)
C.1606 D.2978
others, that is its ‘universal distance’. This can then be averaged for all tessellationelements and give a measure of mean universal distance for the whole complex. Themean depth or integration from each cell to all others is thus isomorphic to themean trip length from that cell to all others, and the mean integration of the com-plex is isomorphic to mean trip length in the complex as a whole. In Chapter 3 of‘Space is the Machine’ (Hillier 1996a), it is shows that universal distance - and there-fore mean trip lengths - in shapes will always by minimised in compact and convexshapes, and maximised in linear, jagged and otherwise nonconvex shapes, followingthe logic of area-perimeter ratios.
On this basis we can construct experiments in which we hold steady the totaltravellable distance within a spatial system by keeping the number of modularelements constant within a standard envelope shape, and rearranging them sothat all difference in mean trip length will be wholly due to the configurations inwhich we place these elements within the standard envelope shape. Figure 14 forexample shows four grids, each made up of 145 cells within a 17 x 17 envelope.Grid A is a straightforward orthogonal grid with uniform block size, which we willcall the uniform grid. Grid B offsets the blocks east-west, thus increasing thenumber of axial lines, but keeping block size fairly uniform. Grid C offsets blocksand varies blocks size more substantially. Grid D is a tree structure, with, in ef-fect, a single, highly nonconvex internal block. The integration value is derived bycomputing the total depth (and therefore the total metric distance) from each cellto all others, then carrying out our the usual normalisation to give an ‘integration’value in which a lower value means greater integration, or lower mean trip lengthfrom all cells to all others. Grids B, C and D all have less integration or greatermean trip lengths than Grid A.
figure 14

�����
S P A C E S Y N T A X S E C O N D I N T E R N A T I O N A L S Y M P O S I U M • B R A S I L I A � � � �
C e n t r a l i t y a s a P r o c e s s ; a c c o u n t i n g f o r a t t r a c t i o n i n e q u a l i t i e s i n d e f o r m e d g r i d s • B i l l H i l l i e r
Figure 15: If all are joined into a single system, integration is attracted into the regular grid, as indexed by the valaues of the central cells in each subgrid: top left : .07267; right: .076405; bottom left: .076154; right: .101987.
Figure 15 then combines the four grids into a single system and re-analyses. Thedistribution of colours shows that the red structure reaches farther into theorthogonal grid at the top left than into any others, showing the ‘attractor’ effect ofthis grid. Unfortunate, with the current of this software, mean integration values forsubsets of cells cannot be calculated. We therefore compare the four subgrids on acell by cell basis and find that in general comparable located cells are more inte-grated in the top left grid than in the others. Pending a full test of this result withnew software, we index each grid by the integration value of its geometrically cen-tral cell. We find that the top left, orthogonal grid has the lowest value and is there-fore the most integrated.
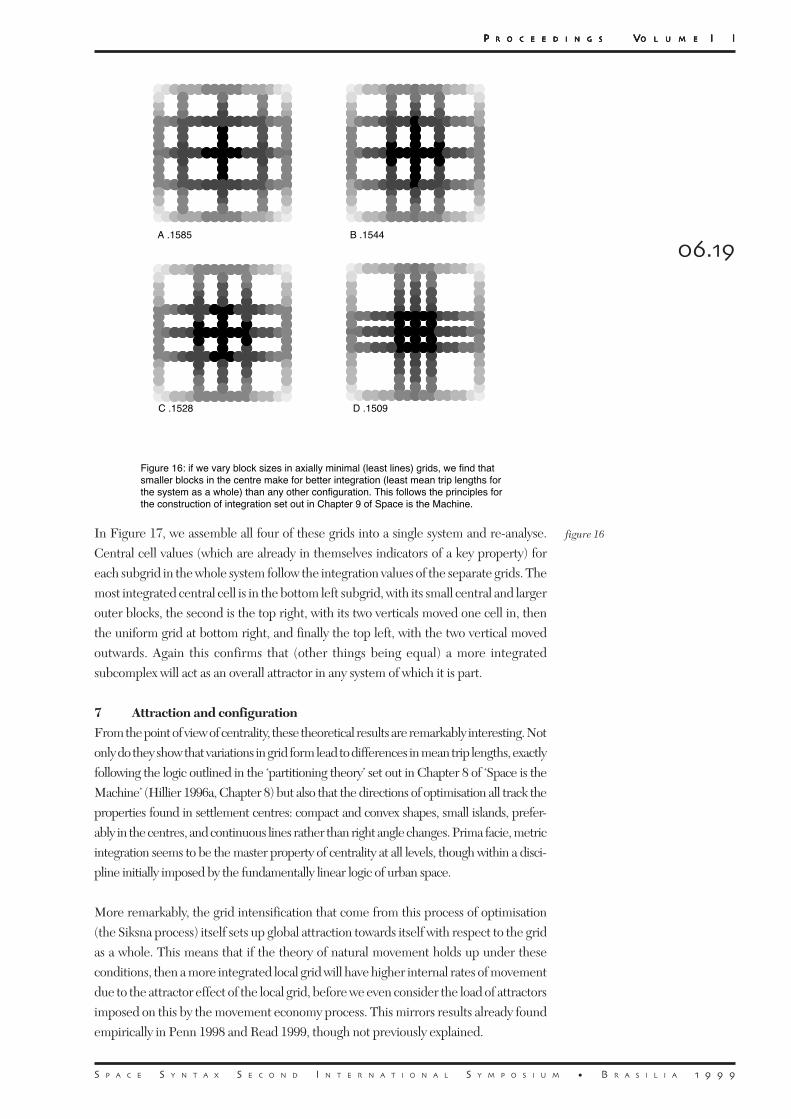
In Figure 16 we then hold number of lines invariant and vary block size only. InGrid A, we move the two outer north-south lines on cell east and west, creatinglarger central blocks. The result is less integration (i = .1585) than in the uniformgrid (.1561). However, in Grid B, we move the same two north-south lines one cellinwards from their position in the uniform grid. We now find that the grid in nowrather more integrated than the uniform grid (.1544), and the total distance to betravelled to go from each cell to all others is therefore decreased. In Grid C we thenmove the two inner east-west lines one cell closer in, making smaller and squarercentral blocks, and larger outer blocks. The effect is even greater integration (.1528).Finally, we take this process as far as possible within this 145 cell system and bringboth north-south and east-west lines one cell further in, creating very small centralblocks and much larger outer blocks. The result is an even more integrated system(.1509), and therefore a system in which the total metric distance from each cell toall others is less than in any of the other cases so far considered. These resultsexactly follow the predictions in Chapter 8 of ‘Space in the Machine’ (the partition-ing theory). Larger central blocks decrease integration, and small central blocksincrease it, as predicted by the ‘centrality’ principle.
figure 15
�����
S P A C E S Y N T A X S E C O N D I N T E R N A T I O N A L S Y M P O S I U M • B R A S I L I A � � � �
PPPPP R O C E E D I N G SR O C E E D I N G SR O C E E D I N G SR O C E E D I N G SR O C E E D I N G S V V V V VO L U M EO L U M EO L U M EO L U M EO L U M E I I I I I I I I I I
Figure 16: if we vary block sizes in axially minimal (least lines) grids, we find that smaller blocks in the centre make for better integration (least mean trip lengths for the system as a whole) than any other configuration. This follows the principles for the construction of integration set out in Chapter 9 of Space is the Machine.
A .1585 B .1544
C .1528 D .1509
In Figure 17, we assemble all four of these grids into a single system and re-analyse.Central cell values (which are already in themselves indicators of a key property) foreach subgrid in the whole system follow the integration values of the separate grids. Themost integrated central cell is in the bottom left subgrid, with its small central and largerouter blocks, the second is the top right, with its two verticals moved one cell in, thenthe uniform grid at bottom right, and finally the top left, with the two vertical movedoutwards. Again this confirms that (other things being equal) a more integratedsubcomplex will act as an overall attractor in any system of which it is part.
7 Attraction and configurationFrom the point of view of centrality, these theoretical results are remarkably interesting. Notonly do they show that variations in grid form lead to differences in mean trip lengths, exactlyfollowing the logic outlined in the ‘partitioning theory’ set out in Chapter 8 of ‘Space is theMachine’ (Hillier 1996a, Chapter 8) but also that the directions of optimisation all track theproperties found in settlement centres: compact and convex shapes, small islands, prefer-ably in the centres, and continuous lines rather than right angle changes. Prima facie, metricintegration seems to be the master property of centrality at all levels, though within a disci-pline initially imposed by the fundamentally linear logic of urban space.
More remarkably, the grid intensification that come from this process of optimisation(the Siksna process) itself sets up global attraction towards itself with respect to the gridas a whole. This means that if the theory of natural movement holds up under theseconditions, then a more integrated local grid will have higher internal rates of movementdue to the attractor effect of the local grid, before we even consider the load of attractorsimposed on this by the movement economy process. This mirrors results already foundempirically in Penn 1998 and Read 1999, though not previously explained.
figure 16

�����
S P A C E S Y N T A X S E C O N D I N T E R N A T I O N A L S Y M P O S I U M • B R A S I L I A � � � �
C e n t r a l i t y a s a P r o c e s s ; a c c o u n t i n g f o r a t t r a c t i o n i n e q u a l i t i e s i n d e f o r m e d g r i d s • B i l l H i l l i e r
Figure 17: if the four grids are combined into a single system, then integration is attracted into the most integrated system, that is, the one with smaller central blocka, as indexed by the central cells values: top left: .070970; top right: .070397; bottom.left: .070684; bottom right: .070111
This theoretical relation between configuration and attraction is an unexpected bo-nus in the project of exploring the degree to which the pattern of attraction inequalities in the urban grid - the pattern of centres and subcentres - can be ex-plained through the movement economy process, and can therefore justify the axiom:configuration generates attraction. The evidence we have adduced for this proposi-tion is of course indirect: we have sought to identify a process by its products. How-ever, the unexpected theoretical linking of configuration and attraction throughmetric integration does lend extra force to the evidence that has been marshalled intaking these first steps towards a spatial theory of centrality. Both empirical andtheoretical results thus suggest that far from being distinct properties, attractionand configuration are bound to each other not only through the processes by whichattraction inequalities arise in the urban configuration through the operation of themovement economy, but also, in a more purely spatial sense, within the idea of con-figuration itself. This raises the possibility that it might in due course be possiblethe characterise the pattern of ‘centres and subcentres’ in the urban surface in gen-eral as ‘attraction inequalities’ produced by the movement economy process work-ing through the spatial process of metric integration.
8 ReferencesBatty M et al (1998) Town Centres: Defining Boundaries for Statistical Monitoring: Feasibility StudyDepartment of the Environment, transport and the Regions 54ppHillier B (1996a) Space is the Machine Cambridge University PressHillier B, Penn A, Hanson J, Grajewski T, Xu J (1993) Natural movement: or configuration and attractionin urban pedestrian movement - Environment & Planning B: Planning & Design Vol. 20, 29-66Hillier B (1996b) ‘Cities as movement economies’ Urban Design International 1,1, 49-60 E & F.N.SponAwarded AESOP prize for the best paper in a European planning journal of 1996Hillier B, Burdett R, Peponis J, & Penn A (1987) ‘Creating life: or, does architecture determine anything?’Architecture & Behaviour 3, 3, 233-250.Karimi, K (1997) (title) PhD Thesis in he University of LondonSiksna A (1997) ‘The effects of block size and form in North American and Australian City Centres UrbanMorphology 1, 19-33Salah-Salah F (1987) Cities in the Sahara: spatial structure and generative processes PhD Thesis, Univer-sity of London
figure 17