centre for economic performance discussion paper no. 233 april 1995 enterprise adjustment in poland:...
TRANSCRIPT

CENTRE FOR ECONOMIC PERFORMANCE
DISCUSSION PAPER NO. 233
April 1995
ENTERPRISE ADJUSTMENT IN POLAND:EVIDENCE FROM A SURVEY OF 200 PRIVATE,
PRIVATIZED, AND STATE-OWNED FIRMS
M. BELKA, S. ESTRIN, M.E. SCHAFFER, and I.J. SINGH

ABSTRACT
This paper reports the main findings from a survey of some 200 Polish firmscarried out at the end of 1993. The central focus is on the relationship betweendifferent emerging forms of ownership and the extent and nature of enterprise leveladjustments taking place. Four broad categories of enterprises that distinguish themain ownership forms that characterize Polish industry were included in the survey:(a) traditional state-owned enterprises, (b) corporatized state-owned enterprises thathave been converted into joint stock companies but whose shares are now owned bythe State Treasury; (c) former state-owned firms that have been privatized; and(d) privately-owned firms which were established de novo.
Some of the main findings from the survey are as follows. Growth andinvestment in 1993 were widely diffused through the economy, but rather moreconcentrated in the private sector and especially in de novo private firms, whilefinancial distress as revealed by low profit margins was concentrated in the state-owned sector. The survey suggests that all firms in Poland have experienced aconsiderable increase in competition, and have faced the need radically to restructuretheir patterns of input purchases and marketing strategy. In general, de novo privatefirms have led the way, and changes have been fewer and less deep in the state-owned sector. Developments on the labor side in our sample are rather modest, andto be heavily oriented to satisfy the preferences of insiders, especially workers.Overmanning remains rife in both the state-owned and privatized sector, anddifferences between the two groups of firms in wage determination appear to stemmore from the operation of the excess wage tax than from differences in motivation.Behavior in the de novo private firms is, however, clearly different, with a concern tohire not fire, and with lower employee influence. With respect to finance, we findthat privatized and especially de novo private firms are financially relatively healthy,with higher profits and fewer bad debts than the state-owned firms. Althoughalmost half of private sector firms hold no bank debt, bank credit is flowing fastestto these firms and in general they report the fewest problems in servicing it.Overdue trade credit is common among all ownership groups but more so amongstate firms; however, the flow problem is not serious, and volumes of total andoverdue trade credit are comparable to West European levels. The main method bywhich severely financially-distressed firms, nearly all of which are state-owned,finance their losses is by running up tax arrears; financing by banks and by tradecredit is much less significant.
This paper was produced as part of the Centre'sProgramme on Post-Communist Reform

ENTERPRISE ADJUSTMENT IN POLAND: EVIDENCE FROM A SURVEY OF200 PRIVATE, PRIVATIZED, AND STATE-OWNED FIRMS
M. Belka, S. Estrin, M.E. Schaffer, and I.J. Singh
APRIL 1995

Published byCentre for Economic Performance
London School of Economics and Political ScienceHoughton Street
London WC2A 2AE
©M.Belka, S.Estrin, M.E.Schaffer, and I.J.Singh
ISBN 0 7530 0688 X

ENTERPRISE ADJUSTMENT IN POLAND: EVIDENCE FROM A SURVEY OF200 PRIVATE, PRIVATIZED, AND STATE-OWNED FIRMS
M. Belka, S. Estrin, M.E. Schaffer, and I.J. Singh
Page
1. Introduction 1
2. Sample Size and Selection 3
3. Performance of Manufacturing Firmsby Ownership 5
4. Market Structure and Competition 6
5. Labor 11
6. Finance 16
7. Investment and Technology 22
8. Problems of Ownership and Governance 25
Endnotes 35Tables 36References 52
The Centre for Economic Performance is financed by the Economic and SocialResearch Council.

ACKNOWLEDGEMENTS
Paper presented at the Workshop on Enterprise Adjustment in Eastern Europe,World Bank (PRDTE), Washington, DC, September 1994. This paper is a product ofthe World Bank Research Project on Enterprise Behavior and Economic Reform inCentral and Eastern Europe. The views expressed in the paper are those of theauthors and not those of the World Bank or other institutions.

ENTERPRISE ADJUSTMENT IN POLAND: EVIDENCE FROM A SURVEYOF 200 PRIVATE, PRIVATIZED, AND STATE-OWNED FIRMS
M. Belka, S. Estrin, M.E. Schaffer and I.J. Singh
1. Introduction
The last few years have seen most dramatic changes in Central and Eastern
Europe, most notably the collapse of Communist Party rule throughout the area and
the subsequent desire to move from central planning to market methods of resource
allocation. The tasks faced in each country are enormous, with the need for economic
reform at the level of the macro-economy to stabilize prices and to introduce foreign
exchange convertibility, and at the microeconomic level to form competitive product,
capital and labor markets. Essential elements in this process of economic transition
are the transfer of ownership of firms from public into private hands, and the
fundamental adjustment in enterprise behavior in response to the new economic
environment.
Though it is now more than four years since the "big bang" in Poland, there
have been only a few studies at either a theoretical or an empirical level of enterprise
adjustment in transition (but see Pinto, Belka, and Krajewski, 1994, for the results of
a survey of 75 Polish state-owned firms). Research is therefore urgently needed to
understand the behavior of firms in transition, whether state or privately owned, and
to guide policy-makers and potential investors towards business and industries of
likely future profitability and growth. In principle this can be done by analyzing
longitudinal data on the industrial sector available from official sources - the Central
Statistical Offices (CSOs) in each country. But there are two difficulties with this
approach. First, where only aggregate industrial or sub-sector data are available, they
do not allow one to capture the complexity and dynamics of the adjustment process
taking place at the enterprise level, as firms, some failing and others succeeding,
respond both to changes in their environment and in their internal organizations and
ownership forms. Second, even where longitudinal firm level data are available, they
limit the scope of the analysis because these data: (a) follow the Central and East
European accounting procedures and are oriented to information about production
and material inputs rather than profitability, costs and financial transactions; (b) often

2
exclude private sector firms, which are an increasingly important element in any
analysis of micro-economic adjustment; (c) are subject to greater confidentiality as
CSOs collect less information each year and confidentiality is likely to apply primarily
to variables of key interest to the transition; and (d) suffer from problems of inter-
temporal comparability, because the transition is likely to entail vertical or horizontal
disintegration as the role of central planning is eliminated and firms redefine the
"core" of their business by divestiture and acquisition or are themselves broken up
during the process of privatization. In order to undertake a proper longitudinal
analysis and overcome some of these deficiencies, it becomes essential to undertake
primary data collection through surveys in order to link the quantitative and financial
information needed to measure performance and adjustments, with the institutional
changes in ownership and organizational forms that take place during the transition.
This paper reports the main findings from a survey of some 200 Polish firms
carried out at the end of 1993. The survey was designed to capture the rapid changes
in ownership that have been occurring in Poland and their implications for enterprise
behavior and performance. The central focus is on the relationship between different
emerging forms of ownership and the extent and nature of enterprise level
adjustments taking place. Four broad categories of enterprises that distinguish the
main ownership forms that characterized Polish industry at the end of 1993 were
included in the survey: (a) traditional state-owned enterprises (SOEs),
(b) corporatized state-owned enterprises (SAs) that have been converted into joint
stock companies but whose shares are now owned by the State Treasury; (c) former
state-owned firms that have been fully or partially privatized, mainly though not
solely through employee leasing or management buyouts (PREs); and (d) privately-
owned firms (POEs) which were established de novo.
The methodology of the sample selection and the form of the survey and the
characteristics of the sampled firms are described in sections 2-3. Section 4 outlines
the main findings on market structure and competition, and section 5, on
employment. Sections 6-7 look at issues of finance, investment and technology.
Section 8 concludes the paper with a discussion of the findings on ownership and
corporate governance.

3
2. Sample Size and Selection
The survey was sponsored by the World Bank Research Project on Enterprise
Behavior and Economic Reform, and was undertaken between November 1993 and
March 1994 by a team of Polish economists headed by one of the authors. A survey
questionnaire in two parts was administered to 200 enterprises in the manufacturing
sector. Eight firms were added later (in part to replace firms that withdrew from the
survey after they had supplied most of the requested information), giving a total
sample size of 208. The first part of the questionnaire was undertaken primarily by
interview with senior managers, and involved qualitative questions about a variety
of subjects including marketing, technology, employment, finance and corporate
governance. The second part of the questionnaire was quantitative and drew on
various elements of the firm's profit and loss accounts, balance sheets and other
economic data for the three years 1991-1993.
The minimum firm size covered in the sample was 10 employees. The sample
was stratified by ownership form as follows: 40 enterprises were emerging (de novo)
private firms (POEs); 45 were privatized firms (PREs); 41 were state-owned firms
which had been converted into joint stock companies ("commercialized",
"corporatized") and were awaiting privatization (SAs) and 81 were traditional (not yet
corporatized) state-owned firms (SOEs). Within these categories the selection of firms
was random but somewhat concentrated in a fairly narrow group of highly
industrialized regions. All major manufacturing subsectors are well-represented;
there are only minor differences between the sectoral distribution of the firms in our
sample compared to the weight of sectors in aggregate manufacturing employment.
Based on these data it is possible for us to paint a picture of firm performance
by ownership type in Poland. This picture is of considerable interest in its own right
because of the shortcomings of the available data on the Polish private sector
published by the Polish Central Statistical Office. Though the quality of these data
is probably the best among transition countries, they suffer from two important
drawbacks. First, the CSO data make no distinction between the de novo private
sector and the privatized sector. Second, the CSO definition of the "private sector"
in use since 1991 includes cooperatives. Poland began the transition with a
substantial number of manufacturing cooperatives, accounting for 13% of industrial

4
employment in 1989 compared to 17% for the emerging private sector proper. During
the communist period Polish cooperatives had little real autonomy, but the situation
in the transition is quite different and in this sense cooperatives are correctly
classified as part of the private sector. Cooperative performance has, however, been
quite poor during the transition, and over the period 1989-1993 the output and
employment of industrial cooperatives has roughly halved. But even now their
weight in manufacturing is still substantial relative to the emerging private sector,
and moreover, because they are larger than the average de novo private firm, they are
disproportionately represented in much of the CSO's statistics. At the same time, the
emerging private sector, by all accounts, has enjoyed explosive growth. The Polish
CSO statistics on the private sector thus unfortunately combine what are several quite
distinct ownership groups: de novo private firms, formerly state-owned firms that
have been privatized, and cooperatives.
Our sample of 208 firms included 5 cooperatives founded during the
communist period. Given that the transition has meant control of these cooperatives
was devolved to their members, for most of the analysis we classify the 5
cooperatives in our sample as "privatized" firms, PRE's. Cooperatives are quite
special ownership forms, and we omit them entirely from our discussion on corporate
governance in section 8.
Compared to the relative weights of state-owned and private sector
employment in Polish industry, our sample is fairly representative. About 60% of
firms in our sample are state-owned, compared to about 65% of total industrial
employment excluding small firms (employment 5 or less) in Poland in 1993. The
division of the state-owned sector into commercialized and traditional SOEs is
similarly representative: 1/3 of industrial employment in the state sector in Poland
in 1993 was in commercialized firms, and 1/3 of our state-owned firms are
commercialized. However, our sample substantially overrepresents privatized firms
relative to de novo private firms. We estimate (based on Polish CSO data) that
employment in privatized industrial firms (excluding cooperatives) in 1993 amounted
to about 4% of total industrial employment in firms with 6 or more employees,
whereas the de novo private sector accounted for about one-quarter of total industrial
employment (cooperatives accounted for about 7%). This decision to overrrepresent1

5
the privatized sector was deliberate, the aim being to reflect the variety of
privatization methods in Poland.
3. Performance of Manufacturing Firms by Ownership
The first five tables provide a picture of the firms in our sample, and of the
key differences in situation and enterprise economic performance by ownership type
in Poland at the end of 1993. We note first from Table 1 that, as expected, most de
novo private firms (POEs) are small, and most state firms (SAs and SOEs) are large.
However it is encouraging that there are already a few large de novo private firms,
and that more than one third of privatized firms (PREs) are small or medium-sized.
It is also noteworthy that virtually all corporatized firms are large. The reason for
this is that the bulk of these firms are to be included in the Polish Mass Privatization
Programme (MPP) and so first had to be converted into joint stock companies.
The Polish industrial sector began to grow again in 1992 after a deep recession,
and total manufacturing output grew by 8.5% in 1993 in firms employing more than
5 persons. In fact the (weighted) average output growth in our sample in 1993 was
also 8.5% (!). Tables 2 and 3 provide a picture of how the growth was distributed
between the ownership types. Commencing with output growth in Table 2, we find
rapid real growth (in excess of 10 %) concentrated in the private sector, both in
privatized and especially in de novo private firms. Only a minority of SOEs and
merely a quarter of corporatized firms display rapid output growth. On the other
hand, the macroeconomic expansion is leaving few firms out completely; only 10%
or less of private firms and 20% or less of state-owned firms were (still) shrinking in
1993.
The picture is rather different for employment growth, reflecting the fact that
current and former state-owned firms often still had significant amounts of hoarded
labor, and that private firms need to employ extra workers in order to grow.
Manufacturing employment in Poland in firms employing more than 5 persons grew
by 1.7% in the course of 1993; the comparable (weighted average) figure for our total
sample was -6%. A third or more of PREs, SAs and SOEs in our sample record rapid
employment reductions; in each case, higher proportions than display rapid declines

6
in production. Almost none of the state-owned and formerly state-owned firms
record rapid increases in employment, as against 50% of de novo private firms. Thus
output growth is fairly widely dispersed, though more marked in the private sector,
while employment growth is concentrated in de novo private firms.
The after-tax profit margin (profit as a percentage of sales) in Polish
manufacturing (in firms employing more than 50 persons) was -2% in 1993; in our
sample, aggregate (weighted) profitability was -4%. Profitability by ownership type
is reported in Table 4. Although there is considerable dispersion of profitability
within ownership groups, the patterns are more or less as expected. The bulk of
emerging private sector firms have positive or high (margins above 10%) profitability;
the privatized firms are mostly profitable, but with a significant proportion making
substantial losses (margin < -10%); corporatized and traditional SOEs are mostly
profitable or nearly profitable (with relatively fewer profitable SOEs than SAs), but
with a large portion making substantial losses and fully one-fifth in serious financial
distress (profitability < -25%).
Private and privatized firms were investing more than state-owned firms of
both categories. The investment/sales ratio in 1993 for the private and privatized
categories was 4-6%, compared to 2-3% for the state-owned firms. Again, there is
considerable diversity within these ownership categories; some emerging private
firms are reporting little investment, and some traditional state-owned firms are
investing considerable amounts. Nevertheless, Table 5 confirms the general pattern;
high-investment firms are considerably more common among the private and
privatized categories, and low-investment firms are predominantly state-owned.
In summary, most de novo private firms are small, while most state-owned
firms and especially the corporatized ones are large. Privatized firms can be both
medium-sized or large. Growth and investment in 1993 were widely diffused
through the economy, but rather more concentrated in private firms, while financial
distress as revealed by low profit margins was concentrated in the state-owned sector.
4. Market Structure and Competition
In this section, we use the survey to investigate the changing pattern of sales

7
between the domestic and foreign market, and between firms and budgetary
organizations. The data reveal some fundamental adjustments in market structure
and the intensity of competition, as well as some associated changes in the way that
firms behave in the market place. As one would expect, there are also important
differences between different ownership forms in both the way that market structures
are perceived to have changed and in firms' responses to those changes.
We commence with the allocation of output between domestic and foreign
markets. The distribution by ownership type is summarized in Table 6. Sales are
categorized into three destinations: the domestic market, and exports to CMEA and
non-CMEA respectively. Frequencies in the four ownership categories are reported
for the four different ownership types for the pre-reform year, 1989, and the year of
the survey, 1993. In 1989, the table reveals that state-owned categories, and the firms
later to be privatized, supplied the domestic market predominantly; typically around
two thirds of firms reported that domestic sales represented more than 75% of
production. Majority domestic production represented an even larger proportion of
the few private firms extant in 1989; around 80% of firms produce more than 75% of
their output for the domestic market. It is also interesting that by 1989, most firms
already have significant shares of their production going to non-CMEA markets,
though almost none exported more than half of their production. Thus we find that
around 40% of state-owned firms in 1989 export up to one quarter of their output to
the CMEA and more than one half of firms export up to one half of their production
outside the CMEA.
The situation had changed somewhat by 1993, though not perhaps as much
as one might have expected from the descriptive literature. The proportion of sales
going to the CMEA market fell sharply for all firm types, especially for state-owned
firms, with a suggestion from the data of considerable substitution of exports to non-
CMEA markets. The shares sold to domestic markets did not alter greatly, however.
The next set of questions addressed the changing market structure and
emerging competitive pressures post-reform. Enterprises' own evaluation of the
market structure is reported in Table 7, which presents frequency distributions of
answers to the question "what is your market share in your top three products?". On
their own admission, more than one third of corporatized state-owned firms produce

8
more than half of the market output in their leading product, with up to one quarter
making the same claim for their second and third products. There is some contrast
here with de novo private firms, more than two thirds of which claim to have a
market share of less than one quarter in all three products. Market structures also
appear slightly more competitive for privatized than for state-owned firms.
However, market structures are everywhere very imperfect on these measures. Even
in de novo private firms, almost one in ten claim virtual monopoly power in their first
and second products (e.g. market shares in excess of 75%).
However, as Table 8 shows, the reforms have brought about considerable
changes in perceived competition from imports. It is striking that imports were
rarely seen as a major source of competition in 1989, even for private firms. For the
former state-owned sector, less than 10% of firms felt themselves to face serious
competitive pressure from aboard. The situation is completely transformed by 1993.
Almost two thirds of corporatized firms and nearly one half of privatized and state-
owned firms now regard importers as major competitors and only a small proportion
(5% in SAs) view importers as not representing a competitive threat. Unsurprisingly,
the change is smallest for private companies, relatively more of whom viewed
importers as major competitors in 1989 and fewer of whom did so in 1993.
To obtain a feel for how things have developed on the marketing side, a
number of questions were asked about the diversification of sales and purchases and
the establishment of brands. One indicator of complexity on the marketing side is
the distribution of sales between customers, which we proxy by the percentage of
output sold to the largest customer. This clearly could be very high if the firm sold
its products predominantly to trading organizations or the state. In fact, only around
3% of firms sold all their output to one customer, though the percentage was higher
for de novo private firms (9%). Around 20% of current and formerly state-owned
firms sold more than half their output to a single firm, as against more than 27% of
de novo private firms. However, the vast majority of firms in all four ownership
classes, averaging around 66%, had a quite diversified group of customers with 25%
or less of output going to the largest purchaser. This is consistent with the view that
many firms in the de novo private sector are closely related to, and often dependent
upon, their larger purchasers in the state-owned sector. A surprising number of

9
firms had established a significant degree of brand image by 1993, to the extent that
54% of the sample believed that their brand names gave them latitude to change
prices. However, the establishment of brands was not well correlated with
ownership; the proportion replying in the affirmative to the question was greatest in
state-owned firms (60%) and least in privatized firms. The proportion in de novo
private was also high, 57%.
The development of more competitive relations on the supply side is indicated
by the extent of input purchase from the private sector, and we find sharp differences
between the state and private sectors. Thus only 14% of SAs and 24% of SOEs
purchase more than one quarter of their inputs from the private sector. This
contrasts with almost half of private firms. In this respect as in many others,
privatized firms look more like state-owned ones, with 74% of firms purchasing less
than 25% of their output from the private sector. The findings are disappointing
because most firms, regardless of ownership form, consider private suppliers to be
at least as good or better than state-owned ones; for example, around 90% of all
firms in answer to questions about product quality, 95% in terms of reliability and
virtually 100% in terms of responsiveness. The only area in which state-owned firms
were seen as better suppliers was in the provision of credit; 60% of firms found
private suppliers worse in the provision of credit facilities while only 30% of firms
found them to be better.
The survey also reveals rather little difference in the structure of sales (e.g.
between consumers and wholesalers) across different ownership types, and
surprisingly few changes reported by the firms in the sample between 1991 and 1993
(though of course both years are post-reform). This can be seen in Table 9, which
reports the proportion of sales going to final consumers and intermediaries in both
foreign and domestic trade in 1991 and 1993. In 1991, around 80% of sales were to
domestic purchasers, the bulk to consumers rather than retailers. The remaining
approximately 20% were sold abroad. In the state-owned and privatized sectors,
these sales were predominantly through domestic trading companies. However,
these were completely insignificant for private firms, whose exports predominantly
were direct to purchasers. The situation did not change markedly between 1991 and
1993, except for private firms which increased their share of foreign in total sales.

10
The nature of foreign sales in the different ownership types is indicated by a
question about branding. In response to the question, "what percentage of your
foreign sales were under your own brand name in 1991?", 71% of private firms and
58% of privatized firms replied zero, as against only 37% of the state-owned firms
together. Only 20% of private and 25% of privatized firms sold more than three
quarters of their output abroad under their own brand name, as against 35% of state-
owned firms. There was however a lot of progress in this area in the private sector
between 1991 and 1993. The proportion of private firms selling more than three
quarters of their output abroad under their own brand name doubled in two years,
and rose by seven percentage points for privatized firms. The percentage also rose
for SAs, by seven percentage points, but actually fell for SOEs.
Clear differences between the two types of private firms and state-owned ones
emerge when we consider the proportion of sales to budgetary organizations such as
the government, army, hospitals or schools. This can be seen in Table 10, which
reveals that only 3% of de novo private firms and 7% of privatized firms sell more
than 25% of their output to budgetary organizations. This contrasts with 21% of SAs
and 28% of SOEs. Equally revealing is the fact that 89% of private firms and 81% of
privatized ones have no longer any residual commercial market ties with any state
organization, as against only 43% of state-owned organizations.
All types of firms have put an increasing effort into sales and marketing. One
indicator is the number of employees in the sales force. Almost all firms employed
fewer than 25 workers in the sales force in 1991, the exceptions being in some large
SAs. Even in the private firms, 71% employed less than three sales staff, as against
20% in the privatized firms. This probably reflects differences in size as much as
market orientation, however. The situation had changed considerably in the two
years to 1993; only 46% of private firms now employed fewer than three sales
persons, as against 12% of privatized firms. The proportions in the SAs actually went
the other way from 7% to 10% employing fewer than three sales staff in 1993 against
1991. This figure is slightly misleading, however; the proportion of firms employing
more than 25 sales staff rose from 16% to 32% though it did not change from 8% in
SOEs. There has also been an increase in the proportion of costs spent on advertising
in all types of firm. Thus in 1991, more than one third of privatized firms and nearly

11
20% of state-owned firms spent nothing at all on advertising. That proportion had
fallen to around 2% by 1993. There were no major differences in the proportion spent
in the four ownership types.
In summary, the survey suggests that all firms in Poland have experienced a
considerable increase in competition, and have faced the need to radically restructure
their patterns of input purchases and marketing strategy. In general, de novo private
firms have led the way and their record in quality and reliability is seen as good by
all parties. Changes have been fewer and less deep in the state-owned sector, and
especially in the enterprises which have not been corporatized. Worryingly,
privatized firms often resemble state-owned firms more than newly formed private
enterprises.
5. Labor
The survey contains information about employment and wages that can be
used to analyze the determinants of enterprise behavior of the labor market. The
qualitative sections of the questionnaire also contain questions about labor hoarding
and turnover, wage determination and employee power, the latter thought to be an
important phenomenon in Polish firms (see Estrin, Gelb, Singh (1994)). It is these
questions that form the basis of the discussion in this section. More formal analysis
of labor market behavior is in Estrin and Svejnar (1994).
We commence with the issue of overmanning. The questionnaire asks whether
managers regard the level of employment as being optimal, given current levels of
output, capital and technology. The distribution of answers by ownership type is
reported in Table 11. The table reveals that even after four years of reform, and after
a considerable labor shakeout as evidenced by the large drop in aggregate industrial
employment and the high and rising level of unemployment, labor hoarding remains
endemic in the Polish state-owned sector. Only around 35% of SAs and 45% of SOEs
believe that their employment levels are about right; 38% and 25% respectively
consider themselves as overmanned by at least 10% of their labor force. Once again,
there is little to distinguish privatized firms from those still under state ownership;
only 43% have employment about right, and 20% are overmanned by more than 10%

12
of the labor force. The real difference is with the de novo private sector, where the
majority of firms (60%) regard the employment level as about right, and none regard
it as too high by more than 20% of the labor force. The different market situation
faced by the new private firms discussed above is also revealed starkly by the fact
that 23% of firms see current employment levels as too low, presumably because
demand is outstripping their capacity to supply.
We find in Table 11 that a majority of state-owned firms and a substantial
minority of privatized ones regard themselves as having excessive levels of
employment. The natural question to ask is why these firms do not act to reduce
employment levels towards what they regard as the optimum. The main answers to
this question are summarized for the different ownership types in Table 12. The
question only applies to a small number of private firms, because only 17% of them
regard employment levels as excessive. Also, the proportions in Table 12 sum to
more than 100% because firms could offer more than one explanation. The two main
reasons cited for overmanning by all firm types are the expectation of recovery and
social factors leading managers to avoid layoffs. Legal obstacles play some role in
both types of private firm, but not the state sector. Workers' resistance is also cited
frequently in SOEs and privatized firms, though not at all in de novo private ones.
The responses make clear that all the relevant firms regard overmanning as leading
to financial problems - virtually none argue that the extra workers do not cause a
financial burden. The table is consistent with the view that workers' influence over
employment decisions, either of a positive or a negative sort, is the main reason for
the persistence of overmanning.
The questionnaire reveals that most firms have laid off some workers; only
around 10% of current and former state-owned firms claim to have laid off no
workers over the previous two years. However, it is no surprise that 20% of de novo
private firms have never laid any workers off, and that layoffs in this sector when
they have occurred have typically been small in scale. The largest layoffs have in fact
been in the SAs and SOEs, where around 70% of firms have laid off more than 500
workers. They have been more modest in privatized firms. Rather few of these
layoffs in any firm type have been via "group layoffs" - only around 9% of the total
of private firms used this method and the average was around 30% of the current

13
and former state-owned sector.
The emergence of skill mismatch despite downsizing and overmanning is
indicated by the vacancies situation. A sizeable minority of firms reported that they
had vacancies that had remained open for more than two months; around 25% of the
sample with little variation by ownership type. In fact, vacancies were the greatest
problem for SAs, 33% of which reported positions that had been unfilled for more
than two months, and smallest for privatized firms, for which the proportion was
21%.
The reasons that firms cite for the problems in hiring are summarized in
Table 13. The totals can sum to more than 100% because firms can highlight more
than one reason, or to less than 100% because many firms noted very specific hiring
problems not reported in the table. The main reason mentioned by all firms is the
shortage of qualified candidates. This seemed to be particularly true in the private
sector, and was mentioned as a problem by every privatized firm with unfilled
vacancies. One can probably also see the impact of the excess wages tax or
"popiwek" on the state-owned sector; almost one half of SOEs and more than one
third of SAs reported that they were unable to meet the wage paid elsewhere.
However, it is also possible that this reflects the worse financial situation in these
companies.
The role of the popiwek also emerges when we consider the factor underlying
wage determination in the four enterprise types. Managers were asked to cite the
most important factor determining the current wage paid. The dominant answer
reported in Table 14 for the private and privatized firms was the available cash.
However, in the state-owned sector, the popiwek was almost as important (or more
important for SAs). The table suggests that labor market pressures were not yet
becoming important in wage setting. Even in the private firms, one can interpret
"available cash" as evidence of the preponderance of insider power; the need to
preserve profits is mentioned by few or no firms, and external labor market pressures
via either the wage setting of competitors or previous pay structures appear to exert
little influence. However, employee power does not appear to be exercised through
traditional employee institutional structures such as trade unions, workers' councils,
etc. As with the persistence of overmanning, managers appear to be willing, in this

14
area at least, to act in a way consistent with the preferences of the labor force without
employees using formal mechanisms to enforce their preferences. Firms may
therefore appear to be managerially controlled, but managers seem to be careful not
to cross the workers, at least in areas where employees have very strong preferences
such as wage and employment determination.
The popiwek applies only to the state-owned sector, and we have information
about the extent to which firms which are paying it have exceeded the wage norms.
The numbers involved are in fact modest. In 1993, only 7% of SAs and 3% of SOEs
exceeded the norms by more than 25%. These figures broadly apply for the previous
two years as well; in 1991 8% and 5% of firms respectively were paying on average
more than 25% over the norm. There is also little change in the proportion of firms
actually paying over the norm. For SAs it was 68% in 1991 and 70% in 1993 and for
SOEs the proportions were 33% and 43% respectively. The higher proportion of SAs
paying the popiwek is probably because these firms were in better financial shape
than SOEs, as already indicated. The absence of trend in the high proportion of SAs
paying popiwek suggests that it is not acting effectively as a disincentive to breaking
the wage norm.
We finally return to employee power at the workplace. A standard indicator
of workers' influence over decision-making is the proportion of the labor force which
is unionized. The distribution by ownership type is reported in Table 15. There is
a sharp distinction between the de novo private firms, none of which are unionized,
and the current and former state-owned sectors where the unionization rates are
typically rather high. Average proportions unionized exceed 50% in SAs and SOEs,
and are slightly lower in privatized firms. However, it is interesting that
unionization is also rarely very high; only in 15% of SAs and 6% of SOEs does it
exceed 75%. Given that much of economic growth is likely to be concentrated in the
new private sector, the likely future path of unionization rates in Poland is therefore
downward, though from relatively high initial levels.
As we suggested in discussing wage and employment determination,
unionization rates may not be a good indicator of employee influence. Without
attempting to measure actual influence levels, we attempted in the survey to discover
its rate of change. The results for the four ownership types are reported in Table 16.

15
One can hypothesize that the levels of employee influence are already low in private
firms, but rather higher in the other three categories. Thus the finding in the table
that employee influence is staying the same in private firms, but tending to fall
everywhere else, all contributes to the general picture of slowly waning employee
power. Perhaps surprisingly, the decline in employee power is greatest in SAs, rather
than private firms. This probably reflects the nature of the privatization process,
which, since it has typically led to employee or employee-management buyouts, has
if anything probably entrenched workers' authority; whereas the corporatization
process both removes some formal powers of the workers (see below), and can to
some extent be slowed or stopped by workers' resistance. Employee influence is
changing little in SOEs, and indeed it is rising in almost as many firms as it is falling.
The firms in the survey were also asked about the provision of social benefits.
We have investigated the responses of the firms issue in depth in a separate paper
(Estrin, Schaffer and Singh 1994), and report here only our main conclusions. Social
provision remains surprisingly widespread, and has not been greatly reduced in
either the state-owned or the privatized sectors. Moreover, even de novo private firms
offer a surprising range of social benefits to workers and, if anything, they are
tending to increase rather than reduce the scale of their provision. Social assets are
concentrated in state-owned firms, but there is relatively little social asset disposal;
the de novo private sector is expanding the range of social benefits offered but is not
investing significantly in social assets. Changes in the provision of social benefits
have been modest and there is also some evidence of substitution between money
wages and social benefits in firms subject to the excess wages tax.
In summary, we find developments on the labor side in our sample to be
rather modest, and to be heavily oriented to satisfy the preferences of insiders,
especially workers. Overmanning remains rife in both the state-owned and privatized
sector, and differences between the two groups of firms in wage determination
appear to stem more from the operation of the popiwek than from differences in
motivation. Behavior in the de novo private firms is, however, clearly different, with
a concern to hire not fire, and with lower employee influence.

16
6. Finance
We begin with the basic characteristics of the sample. We noted that the
emerging private sector firms had the highest profitability, followed by privatized
firms, corporatized state firms, and traditional state-owned enterprises. Table 17
shows the situation with respect to indebtedness is somewhat different. As with
profitability we see considerable heterogeneity among ownership groups. All four
groups contain some negative equity firms, but these are much more common in the
traditional SOE category (18% of all SOEs) than in the others (about 5%).
Corporatized firms have a surprisingly high proportion of firms with high equity
relative to debt, followed by emerging private firms, privatized, and lastly SOEs. The
large number of indebted (but not negative equity) privatized firms may be a result
of the method of privatization (leveraged buy-outs).
The structure of debts also holds some surprises. Table 18 presents the
percentages of liabilities of each ownership group to the three main groups of
creditors: other firms, banks, and government (tax and social security liabilities). The
fraction owed to other firms - trade credit received - is very similar in all four groups
(about 40% of total debt). Where the ownership groups differ is in the amounts
owed to banks vs. the amounts owed to the government. Emerging private firms
have little in the way of outstanding taxes liabilities relative to total debt, and hold
more in the way of bank credit (about 40% of total debt); as we move to the
privatized category, then to corporatized, and finally to the SOEs, the proportion
owed to the government increases and to the banks decreases. As usual, these
figures conceal considerable variation, especially concerning debt to banks and to
government. It is important to note that tax and social security liabilities include, but
are by no means limited to, "tax arrears", as taxes are payable with a lag; we will see
below that in fact most tax liabilities of the firms in our sample are not overdue. We
will return to tax liabilities in a moment, and focus here on bank debt. Table 19
groups firms within ownership groups according to the size of their bank debt
relative to their annual sales (rather than by total debt). Corporatized and traditional
SOEs hold more bank debt relative to turnover than the private and privatized
groups, and more frequently. About 40-45% of both groups of private firms hold no
bank debt at all, compared to 20-25% of the state-owned groups. However, the larger

17
firms in the private and especially privatized groups hold very substantial amounts
of bank debt - enough to make the aggregate debt/sales ratio roughly the same for
private and state-owned firms (about 6-8%).
How do firms behave with respect to these three groups of creditors? Firms
were asked to rank their payment obligations to creditors and to employees, in the
order they are covered in practice; the answers are summarized by ownership group
in Table 20. There is surprisingly little variation by ownership group, with taxes and
wages ranked either first or second by all types of firm, and payments to suppliers
(trade creditors) ranked last. Obligations to workers are on average ranked slightly
above those to government in state-owned firms, and visa-versa in private firms.
Data supplied by firms on the term structure of credit (how long overdue) reported
in Table 21 are consistent with this, though there are variations by ownership group.
Private and privatized firms have the best payment records vis à vis trade creditors,
but even they have on average over 20% of their commercial payables overdue.
Corporatized and traditional state-owned firms have about 50% of their trade credit
overdue. This may well reflect the size and market power of state-owned firms as
much or more than their financial difficulties. It is a commonplace in Western
countries for small firms to complain about the slow payment by large customers,
and in fact the proportion of trade credit overdue in our sample (about 50% or so)
is close to the West European average. The payment record of all firms vis à vis2
bank credit is considerably better for trade credit, and in fact shows less variation by
ownership group: the average percentage of bank credit overdue ranges from 0-15%
for privatized and de novo private, to 10-25% for corporatized and traditional SOEs.
With respect to taxes, private and privatized have the best records, with less than
20% overdue; corporatized have 30% of their outstanding tax liabilities overdue, and
almost half of the taxes due from SOEs are overdue. Note that the fact that these
figures for the percentage of taxes overdue exceeds those for bank credit across
ownership groups does not necessarily indicate banks have higher priority than the
tax man, because the volume of non-overdue tax liabilities depends on tax regulations
and schedules. We will return to the problem of tax arrears shortly.
There are also signs in Table 21 of substantial numbers of firms with "bad
debt" stock problems in the state-owned groups, especially the SOEs; interestingly,

18
the problems seem less severe for "bad" bank debt than for trade credit or tax arrears.
About one-third of SOEs had more than 25% of the their total trade credit and total
tax liabilities overdue one year or longer, but only 14% had that much of their bank
debt overdue one year or longer. Flow problems are, however, not so severe. This
can be seen by comparing the percentage of liabilities overdue 0-3 months with the
percentage overdue 3-12 months, in monthly average terms (that is, divide the 0-3
months overdue category by 3 and the 3-12 months overdue category by 9). The
average per month for the 3-12 months overdue category is typically much smaller
than that for the 0-3 months overdue category for all classes of creditor in all classes
of ownership, indicating that most payables which do become overdue eventually do
get paid.
A very sharp distinction in behavior towards creditors appears if we
distinguish firms not by ownership but by serious financial distress, which for our
purposes we define as post-tax profitability (profit/sales in %) being less than -25%
in 1993. There are 26 such firms out of a total of 203 firms with complete data: no
emerging private firms, 3 privatized firms, 8 corporatized firms and 15 traditional
SOEs. That is, 90% of our financially-distressed firms are state-owned; and 20% of
the firms in both our state-owned categories are financially distressed. How are these
firms financing their losses? We look at the change in trade credit, bank credit, and
tax and social security liabilities, all as a percentage of annual sales, for our
financially distressed firms and for the remaining 177 firms. These are presented in
Table 22, along with profitability and equity/debt ratios for the two groups.
The figures are striking. The financially distressed group is failing to cover
even its core costs: the operating losses of this group, defined as revenues minus
costs but before depreciation, interest costs, and exceptional charges, amount to the
equivalent of 16% of sales. Bottom-line (after-tax) losses come to 76% of annual sales
(!), and over half of this - the equivalent of 46% of sales - is being financed by an
increase in tax and social security liabilities. Financing by bank credit and trade
credit, each amounting to about 9% of annual sales, is much less important, at less
than the equivalent of 10% of annual sales each. Financing of the 177 other firms by3
trade creditors, banks and government amounts to about 3% of annual sales each.
The key appears to be financial distress rather than ownership per se; when the 177

19
non-distressed firms are broken down by ownership, no such major differences in
financing appear. These figures conceal some variation among enterprises, but the
pattern stands up to closer scrutiny; for example, about 1/3 of financially distressed
firms had increases in trade credit which were greater than 50% of annual sales; 20%
had increases in bank credit greater than 50% of sales; and 70% had increases in
outstanding tax liabilities which were greater than 50% of sales.
This pattern is also reflected in the responses to the question asked of firms
about how they ranked their payment obligations by creditor. Table 23 contains the
responses of firms, this time separated into the financially-distressed group and the
remainder. The effect of financial distress on state-owned firms is to increase the
priority accorded to paying wages (almost universally ranked first) and to paying
suppliers (now almost on a par with taxes and banks), at the expense of the
government. Again, the key is financial distress; the rankings by non-distressed state-
owned firms and private firms were nearly identical.
These findings suggest that when state-owned firms get into serious trouble,
they respond by changing the priority of their payments. Outgoings for essential
current operations - payments of wages, and to a lesser extent, payments to suppliers
- are raised in priority. If the firm fails to pay wages or suppliers, it will not be able
to function at all, whereas if tax payments are missed, the firm will get into trouble
with the tax office . . . which is better than closing altogether. The effectiveness of
this strategy of extracting what are in effect subsidies from the state can be seen from
the output and employment growth of our 26 financially-distressed firms. Three-
quarters of them actually increased their output in 1993, compared to 82% of the rest
of the sample. The increase in tax arrears was nevertheless not enough to completely
cushion the firms, and they shed substantial amounts of labor in 1993: 22 of the 26
decreased their total employment, 14 of them by over 10% (compared to 66% and
24%, respectively, of the rest of the sample).
We now consider the relationship between firms and banks in more detail.
The standard view of private sector firms as starved of bank credit does not seem to
hold true, at least for Poland in 1993. Balance sheet data from those firms which do
hold bank debt suggest that credit from banks is growing fastest in private and
privatized firms, and slowest in corporatized and state-owned firms. Table 24

20
tabulates firms according to the change in real bank debt in 1993. Of those emerging4
private and privatized firms holding bank credit at the end of 1993, 45-50% had seen
increases in real bank credit of over 10%, compared to 25-30% of the two state-owned
groups. Somewhat surprisingly, even in the two private ownership groups close to
half decreased their real bank debt by over 10%. Firms were also asked if they had
ever been refused bank credit in the period 1990-93. Only 10-15% of private and
privatized firms responded yes, compared to 35-40% of corporatized and traditional
state-owned firms. The most common reason for given for refusal of bank credit to
private and privatized firms was inadequate collateral (between 1/3 and 1/2 of the
few cases reported); the most common reason by far given by the two kinds of state-
owned firms was the poor financial situation of the firm (about 3/4 of all cases).
Firms were asked if their bank had ever classified them as "uncreditworthy"
in the period 1990-93. Not surprisingly, very few private or privatized responded
"yes", but fully 40% of corporatized and traditional state-owned firms had been
classified by their banks as such. Very few firms reported that the first such episode
took place in 1990; the most common response was 1991 (about half of firms ever
classified as uncreditworthy) and 1992 (about one-third). This is consistent with
reports that the bad debt problems of the banks emerged in 1991. The results of5
getting into trouble with the bank were long-lasting; over two-thirds of the firms
which reported being classified as uncreditworthy had not, at the time of the survey,
regained their good standing with their bank.
Firms were also asked if they had failed to repay or service a bank loan in the
previous year. About 20% of all firms, meaning about a quarter of all firms with
bank debt, responded yes. Somewhat surprisingly, emerging private firms have
about the same recent bank record as corporatized and traditional state-owned firms -
between one-quarter and one-third of firms with bank debt in these ownership
groups report failing to service fully their debt in the preceding year. Privatized
firms, by contrast, have a noticeably better record - about one-seventh of firms with
bank debt failed to keep up payments at some point. When asked "what happened
then?", the most common response by far was capitalization of interest payments,
rescheduling of the debt, etc., mentioned in about 2/3 of all cases (with no major
differences across ownership groups). Conciliation arrangements (meaning

21
arrangements under the enterprise and bank restructuring program) were mentioned
in fewer than 20% of all cases; bankruptcy or other legal measures, in 5% of cases;
and in only one case did the bank collect on collateral.
We now turn to the other side of the balance sheet and look at trade credit
extended (receivables for goods and services). The total volume of trade credit
measured as an average payment period in months (receivables/monthly sales) in the
total sample is about 2 months, close to the West European average; the percentage
overdue in the sample, about 50%, is also close to the West European average.6
Table 25 presents the term structure of receivables by ownership group. There is
somewhat less divergence than for trade credit received: about 40-45% of the
receivables of private and privatized firms is overdue, compared to 50-60% of the two
state-owned groups. The latter also show signs of "bad debt" stock problems, with
22% of SAs and 37% of SOEs having more than a quarter of their receivables overdue
more than one year. Again, however, the flow problems do not appear great (most
receivables are eventually paid for); the average per month in the 0-3 months overdue
category is once more considerably lower than the average per month in the 3-12
months overdue category.
Interestingly, when firms were asked which type of customers were most likely
to fail to pay on time, the overwhelming response - about 2/3 of each ownership
group - was "small firms". We have seen that the small firms in our survey, namely
the private and privatized firms, were in fact the most reliable customers for their
suppliers. This may be simply the result of selection bias - any firm which is willing
to be interviewed and reveal its financial records is likely to be of above-average
integrity.
The firms we surveyed used a wide range of methods to control their
receivables. The responses of firms differed little by ownership group, and are
presented for the sample as a whole in Table 26. Half of the firms surveyed always
or frequently required payment in advance from new customers; this falls to 20% for
established customers. 60% frequently charge interest on overdue receivables; the
same portion refuse to resupply a customer in arrears until his outstanding debt is
settled or rescheduled; and again the same portion frequently pursues "informal
methods" to chase up overdue receivables. The lowest responses are for pursuit of

22
overdue receivables by legal action (37% of firms use this frequently) and sale of
overdue receivables on the debt market (only 10% use this method even occasionally).
The only variations by ownership group are that emerging private firms rarely charge
interest on overdue receivables (17% do this frequently) and rarely take legal action
to chase up late payers (only 10% do this frequently).
In summary, we find that privatized and especially de novo private firms are
financially relatively healthy, with higher profits and fewer bad debts than the state-
owned firms. Although almost half of private firms of both categories hold no bank
debt, bank credit is flowing fastest to these firms and in general they report the
fewest problems in servicing it. Overdue trade credit, both extended and received,
is common among all ownership groups but more so among state firms; however, the
flow problem is not serious, volumes of total and overdue trade credit are
comparable to West European levels, and all firms report a wide variety of methods
in use to control their overdue receivables. A significant minority of state-owned
firms, especially traditional SOEs, suffer from stock problems (bad debts long
overdue) and flow problems (large losses). The main method by which severely
financially-distressed firms, nearly all of which are state-owned, finance their losses
is by running up tax arrears; financing by banks and by trade credit is much less
significant. This problem is largely limited to state-owned firms in financial distress;
state-owned firms which are not in such financial difficulties have payment records
similar to those of private firms.
7. Investment and Technology
Most firms reported that they saw profitable investment opportunities: 75-80%
of private, privatized and corporatized saw such opportunities, and even 60% of
traditional state-owned firms. Few firms, however, saw no factors which restricted
their investment decision (17% of private and privatized firms, and fewer than 5% of
both state-owned categories). The single biggest obstacle was felt to be high interest
rates - 60-70% of firms in all ownership groups reported this as the most important
obstacle to investment. The next most common obstacle cited by firms in all
ownership categories was the poor financial situation of the firm, the variation being

23
in the frequency cited: about 15% of private and privatized firms mentioned this as
first or second in importance, compared to 40% of corporatized firms and 53% of
traditional state-owned firms. The third most common obstacle cited by firms was
"unwillingness of banks to lend", but this was cited as first or second in importance
by only 10-20% of firms, with little variation by ownership category.
To what extent are increased investments going into new investment capacity
as distinct from repair of existing equipment embodied in older technologies? Over
65% of the firms used their new investments to provide new productive capacity
while the remainder used it to repair existing machinery and equipment. A larger
proportion (84%) of the de novo private firms (POEs) used their fixed investments for
additions to new productive capacity compared to 50-60% for other forms of
ownership. There was significant inverse correlation between size and the proportion
of investments allocated to new productive capacity. Thus a very large share (88%)
of the total new investments occurring in the smaller firms (< 50 employees) went
towards acquiring new productive capacity compared to less than half for the large
firms (> 250 employees).
A major aspect of restructuring during the transition relates to the replacement
of old technologies with newer ones acquired either through new investments or joint
ventures. Many firms, including most state-owned ones, cite the need to acquire
modern technologies as the major reasons for their willingness to enter into joint
ventures with foreign, mainly Western, firms. Commencing with the vintage of the
capital stock, we find in Table 27 that less than a quarter of the entire stock of
machinery and equipment was less than five years old; nearly two thirds was more
than 10 years old in 1993. Because a greater proportion of new private firms and
recently privatized firms have been undertaking new investments, the resulting
differences in the vintage of the capital stock by ownership are now striking. While
two thirds of the capital stock in de novo private firms is less than 5 years old; the
comparable percentages for privatized, state-owned corporatized and state-owned
firms are 22%, 9% and 11%. In state-owned firms, whether corporatized or not,
almost half of the entire stock of capital equipment is older than 15 years.
When firms were asked whether or not they had introduced any new
technologies within the last 2 years, over 61% answered in the affirmative, though

24
with important differences by ownership. Nearly 77% of the newly private and 72%
of the privatized firms had introduced new technologies; only 46% of the state-owned
firms had. It can bee seen in Table 28 that most of the acquisition of new
technologies have been from the OECD or other non-CMEA or domestic sources.
However, most of this technology has been purchased outright and not acquired
through joint ventures or outside investors. The bulk of the technology acquisitions
still coming from the former CMEA countries are acquired by firms that remain
under state ownership, while over two thirds of the acquisitions from OECD
countries are by de novo private or privatized firms.
Acquiring foreign designs or technologies are major elements in the way in
which firms are restructuring. Nearly 15% of the current output of all firms is now
based on products of foreign design while another 15% is based on foreign
production technologies; and these shares have been increasing. While all firms have
to some extent been taking advantage of this type of restructuring through
technology and product transfer, clearly the edge has been with newly formed private
companies. In privately-owned companies over 27% of their output is based on
foreign product designs and another 31% on foreign technologies, as against an
average of around 13% on both counts for those firms that remain under state
ownership.
Although, as we report in Table 29, the share of total output based on products
of foreign design does not vary much by performance, the more successful firms
produce a larger share of their output based on foreign production technologies. Of
the 25 firms indicating that more than half of their output was produced on
production technologies acquired abroad, over two thirds recorded growth in real
sales in excess of 10% in 1993.
Clearly the size of the firm matters in the acquisition of new technologies, and
we investigate this more in Table 30. Nearly two thirds of all such acquisitions in the
survey were by larger firms (those with employment greater than 250). Over 70% of
acquisitions from the OECD were made by the large firms. There is little evidence
that success in acquiring new technologies is linked with export intensity (as
measured by the share of output exported); indeed there was a negative correlation
between export intensity and percentage of new technologies acquired and

25
introduced. This stands to reason if we recall that most of the technologies acquired
to date have been purchased outright and have not come through any specific tie-ins
with joint ventures or direct foreign investors.
8. Problems of Ownership and Governance
The sample with full data which we use in this section is composed of 40
private, 40 privatized, 40 corporatized (state-owned) firms and 80 "traditional" SOEs.
As noted in the introduction, we omit discussion of the 5 cooperatives in this section.
All of these groups, possibly with the exception of the traditional SOEs, are highly
heterogenous and should be described in more detail.
The emerging private sector firms are predominantly small companies,
founded in the 1980s or just very recently in the 1990s. There are 3 joint stock
companies, 19 limited liability companies and 1 general partnership, all of which need
to satisfy regulations concerning their organizational structure: i.e. an assembly of
shareholders, Board of Directors (Zarz�d) and most frequently a Supervisory Board.
The rest of the group are individually owned. Moreover, some of the limited liability
companies are individual ownerships in disguise, where the owners (founders, as a
rule) chose this legal status out of fiscal considerations, but retain 80-95% of shares.
Ownership is highly concentrated. In addition to the 17 individually-owned
firms, in almost all of the 23 firms with a corporate form the share of the principal
shareowner exceeds 50% with a tendency to approach 70-85%. In a few of these
firms ownership is shared by two parties in a 50/50 or 49/51 proportion. Eight of
the 23 are dominated by senior managers or other employees, 10 by other private
individuals (of which 2 are returning expatriates and 2 are foreigners), and 5 are
dominated by foreign or joint-venture entities. The role of minority shareholders
seems to be generally insignificant; total number of shareholders is low, not exceeding
10 on average. Foreign capital is involved in 8 firms.
Enterprises in the privatized group are previous state firms or parts of state
firms. Privatization took place in the last 4 years, in 32 cases at the initiative of the
managers and/or employees of the firm in question. In only one case did the state
initiate the process; in the remainder the initiator was a prospective outside investor.

26
Eighteen of the privatized firms are joint-stock companies, and 22 are limited liability
companies. The real dividing line is, however, between the enterprises in which
insiders (managers, other employees) took over the firm, and ones in which outsiders
took control. This broadly reflects the difference between the so-called capital
privatization and privatization through employee leasing, though this division is not
precise as insiders can also use capital privatization. Nineteen of the 40 firms have
been taken over by outsiders in result of: (a) direct sale to a specific buyer of a whole
enterprise or its selected assets, (b) sale through public offering, (c) liquidation under
the Law on SOEs (firm in bad shape - 1 case) and restitution (1 case). Insiders took
control of the firm in at least 21 cases; employee leasing, preceded by liquidation
under the Law on Privatization of SOEs, was the dominant route.
Looking at the structure of share ownership in the privatized category, in 22
firms managers and other employees together hold an absolute majority of shares.
The managers' share is significantly lower (21.6% on average in 27 firms in which
they own any shares) than the employees' share (48.8% in 24 firms), but is probably
high enough to control enterprises when the employee ownership is dispersed. Of
the remaining 18 privatized firms, 8 are controlled by foreign or joint-venture firms
or individuals, 4 by Polish SOEs, 3 by Polish private firms (of which one is an
investment fund), and 3 by domestic individual investors. This picture is blurred
somewhat, as 3 firms are also listed on the Warsaw Stock Exchange, where the
numerical "domination" on the part of individual and institutional investors is
misleading. In fact, therefore, the position of the management should be expected to
be very strong in more than half of the sample. Among the minority shareholders
we find domestic private banks (2 cases), a pension fund (1 case), foreign investment
funds (2 cases), Polish individuals and firms, both private and state-owned (9 cases),
managers and other employees, but rarely foreign firms and individuals (2 cases).
The group of 40 corporatized state enterprises (SAs) comprises state enterprises
that have been corporatized (converted into joint-stock companies with the sole
ownership of the state) in 1990-1993, mainly with a view to their participation in the
mass privatization program. The state (i.e. the "founding organ") was a driving force
behind the change (as initiator or active partner) in only 10 cases, with the firm
playing the decisive role in almost all other cases. Also, not less than 38 firms expect

27
to be privatized in a foreseeable future: 27 by mass privatization, 2 by employee
leasing, and the rest by various forms of capital privatization.
There are 3000 "traditional" state-owned enterprises (SOEs) in Polish industry,
with as yet unchanged ownership and legal status, and which account for more than
50% of industrial production and 60% of industrial exports of Poland. In our sample
of 80 SOEs, a majority (44) have plans to go private by various methods: mass
privatization (13), employee leasing (15), direct sale to specific investor or public
offering (12), restitution (3) and other, sometimes unspecified.
We can distinguish between six types of firm from the point of view of
ownership and legal status. These are:
i) traditional, labor-dominated SOEs
ii) corporatized state firms
iii) insider-controlled privatized firms
iv) outside-investor-controlled privatized firms
v) private firms owned by individuals
vi) private partnerships
The survey questionnaire also permits us to study three issues in corporate
governance and control: the impact of corporatization of SOEs on decision-making
process in enterprises; the changing power structure in the process of privatization;
and the nature of governance in typical Polish private firms. We first examine the
effect on state firms of the change from a traditional SOE to a joint-stock company
(SA).
Polish SOEs are formally dominated by the workers, i.e. by the General
Assembly of Workers and the Workers' Council. In theory, the Workers' Council has
most powers of the governing organs in a corporation: it approves or takes all most
important decisions, nominates and fires the management, and sets their wages. The
role of the owner (the state) is very limited both in theory and in practice. It is
represented by the founding organs - the Ministry of Industry and Trade or voivods -
which approve changes in the legal and organizational status of the enterprise
(privatization, corporatization, sale or acquisition of assets, mergers). An SOE is
28
autonomous, self-financing and self-governed (the famous Polish "3S" from the early
1980s); the role of the state, certainly in the vast majority of manufacturing firms, was
reduced drastically some years previously.
"Corporatization" involves liquidation of workers representation (Workers'
Councils); the nomination of a Supervisory Board (SB) as a representative of the
owner; and nomination of a Board of Directors (BD). The hitherto unclear form of
state ownership takes the form of 100% stock ownership. To exercise its powers as
an owner, the "General Assembly of Shareholders" is convened from time to time,
consisting in the representative of the Ministry of Privatization or the voivod
informing the usually present members of the SB and BD about the owner's decisions,
among them concerning the nomination of the SB. As a rule, two of 6-9 Board
members are elected by the workers. In our sample 80% of the firms reported having
a six-person Supervisory Board. The BD is composed of 2-5 members of top
management of the firm; almost without exception acting executive officers. In
practice, then, there is no distinction between the BD and the top management in
Polish corporatized state enterprises.
Corporatization was meant to be a preliminary stage in preparation of
privatization, particularly mass privatization. Also, it was and still is seen as a means
of clarifying the legal status and internal power structure of state firms: ownership
is better defined, allowing for better control and reorganization, management's
position strengthened, the infamous "Bermuda triangle" of Polish SOE's eliminated.
The latter resulted from the co-existence of three decision-making centres - the
Workers' Council, trade union, and directors - which (according to popular opinion)
practically paralyzed restructuring efforts.
Turning to the changing structure of influence, we find the influence of the
State in traditional, labor-dominated SOEs is virtually undetectable. Of 80 firms, only
15 noticed the impact of "government (non-shareholders)" in our main question
concerning the relative influence of various interests, and only very few (2-4) saw any
practical or formal influence that it may exert on any aspect of the firm.
In the 40 corporatized enterprises the situation changes dramatically. The State
has a well-defined representation and procedures of control. The Supervisory Board
is seen as having major influence on hiring/firing managers (34 cases, in 24 practical,

29
not only formal), setting managerial compensation (23, only 4 formal), allocation of
profits (22), major investments (23), mergers/acquisitions (20), sale or lease of assets
and amending the statutes of the corporation (24). On the other hand the SB does not
intervene in changes in internal structure, firing/hiring workers, setting their wages
and benefits; nor does it participate in the planning process in the enterprise -
preparing the budget or financial statements. Slightly surprising is a clear perception
of the role of the General Assembly of Shareholders, that makes final approval of
financial statements (23 cases, of which in 15 practically), decides about profit
allocation (24) and amending the statutes (29, of which 18 practically). The
Shareholders Assembly, which means in practice the representative of the Ministry
of Privatization in most cases, is also said to have a say in mergers/acquisitions and
sale or lease of assets. However, its influence is more frequently of formal than
practical character.
In traditional SOEs labor dominates management through the Workers'
Councils, at least in theory. In corporatized firms workers have just two
representatives in the SBs . . . and their trade unions. The survey indicates that in the
SOEs, Workers' Councils are said to have substantial influence on most important
decisions: hiring/firing managers (in 80% of observations), setting their
compensation (67%), profit allocation (61%), major investments (65%), changes in
internal structure, mergers/acquisitions (both around 66%) and sale or lease of assets
(79%). The last situation reflects the tendency for the Councils to strictly control the
socially and politically suspect process of creating the "nomenklatura" partnerships,
allegedly to siphon off resources from state companies. Workers' Councils are also
said to give the final approval of the financial statement (in 71%), e.g. carrying out
their controlling function over management.
However strong the Workers' Council's position is, we should not treat it as
absolute domination. Firstly, in all decisions their role in practice is seen as weaker
(by 10 to 20 percentage points) than in theory. Secondly, in many issues
(hiring/firing managers being one of the notable exceptions) their influence is weaker
than the influence of the management. Thirdly, the role of the Councils in
hiring/firing of workers and setting their wages is seen as much weaker than that of
the trade unions, whose influence in all other issues is described as close to none.

30
Possible exceptions may include trade unions' attempts in around 25% of firms to
meddle with managers' compensation and internal structure.
Summing up, managers generally perceive Workers' Councils as strong
partners, dominating in the process of hiring/firing top management, equally
influential in setting managerial compensation and determining profit allocation, but
junior partners in other decisions.
In corporatized firms the influence of workers is drastically lower. Employee
representatives on SBs pass entirely unnoticed, though unions play some role in their
traditional domains of employment and wages. Though less than half of the
respondents linked trade unions with these issues, about half thought they played an
important role in making decisions on hiring/firing workers, and about two thirds
admitted their influence on wage policy in the firm.
In assessing managerial influence, we have to allow for their probable
tendency to overestimate the formal division of powers and underestimate the
practical impact they have on the decision-making process. There is a certain analogy
between the SOEs and corporatized firms: in the former case it is the Workers'
Council that controls the management; in the latter, the Supervisory Board. However,
a marked difference in the responses can be seen: in certain areas, managers in SOEs
are much stronger than in corporatized firms.
In the SOEs managers strongly influence all the important decisions, even if
they have to share power with the Workers' Councils. In the state corporations,
managers (i.e. the Board of Directors) are dominated by SBs in the matters of profit
allocation, major investments and mergers/acquisitions; wage-setting is also less
dependent on them. However, when asked in another context who really chooses the
members of the BD, our respondents indicated in 17 cases (of 40) it was the
management. At the same time, there is less interference in their running of the
current business - hiring/firing of workers, setting their wages, changing the internal
structure of the firm, etc. - on the part of the SBs. "Less" does not mean that they are
passive, however. According to the questionnaires, the influence of SBs on the
overall business is quite high. On a scale from 1 (extensive day-to-day influence) to
5 (very little influence), 12 SBs are given a rating of 1, 8 are given a rating of 2, and
16, a rating of 3. They usually meet once a month, their presence is felt by the

31
management, but disagreement occurs rather rarely (in 11 firms only, and in just 4
more than once).
Corporatization does not formally strengthen the position of managers within
the firm. Undoubtedly, one of its consequences is a more precise definition of
competencies of different bodies, which makes the situation in the firm more
transparent. Managers clearly like it, maybe because the possible conflict of interests
(if it appears at all) with the SB is less acute and easier to manage than a conflict with
the workers. Both in SOEs and in corporatized enterprises managers dominate: in
the former they have a less competent but also a less predictable partner; in the latter
the partner has broad and better-defined competencies, but is "of the same kind".
Thus, corporatization seems to change the balance of power in enterprises: the State
gains in influence, the workers lose, the managers remain in control but in a better
defined environment.
We turn now to the question of who takes control of the firm after
privatization. Following privatization, the State disappears from the scene. The main
actors are management and owners, represented by the shareholders meeting and/or
the Supervisory Board. Trade unions seem to pass totally unnoticed; in only 1-2
enterprises do they have an influence on workers' compensation. In the insider-
dominated privatized firms it is understandable, as employees become shareholders
and exert control through the existing institutional framework of the company; in
other cases this change remains somewhat mysterious.
In the group of 40 privatized enterprises, the questionnaires provide a picture
of managers (BD) running the current business - preparing the budget and financial
statement, hiring/firing workers and setting their wages (more than 75% answers
indicating their practical and formal influence), sharing power with shareholders'
representatives (SB and shareholders meeting) as far as changes in internal structure,
major investments and sale/lease of assets is concerned (50-60% of positive answers)
and accepting owners' decisions on profit allocation, mergers/acquisitions and
changes in statutes.
To detect differences between insider- and outsider-privatized firms we looked
at who are the dominant decision-makers in four important, and potentially
conflictual, areas. We distinguish between insiders' firms (21 cases), firms with

32
participation of foreign capital (10), firms listed on the Warsaw Stock Exchange (3),
and others (6). When someone was quoted as having practical influence, we
interpreted it as dominating someone having only formal influence. In some cases
we were not able to tell who really makes a decision as two bodies are ascribed the
same weight. As a result the numbers in Table 31 do not necessarily sum up to the
number of firms in each category.
We notice striking difference between the categories. Insiders' firms (most of
them employee leasings) can be characterized as follows:
- managers (BD) have a very strong position vis à vis the other partners
- the SB looks rather weak, although it is said to have a say in determining
managerial compensation
- the shareholders meeting has, according to the questionnaire, a decisive voice in
profit allocation
In reality, managers' domination is probably even higher than this suggests.
Supervisory Boards are almost entirely composed of employees, and they are very
unlikely to resist their bosses' suggestions. An interesting finding is a strong position
of the shareholders meeting, which means that it has taken over the role of Workers'
Council and trade unions in determining wages. A general manager has to play a
smart game with the workers (this time as shareholders) during these meetings; he
need not be afraid of "his fellow capitalists" from the SB. Total elimination of unions
is quite consistent with this scenario.
Because only 3 firms in the sample are listed on the Stock Exchange, no serious
conclusions can be drawn about them. Information from Table 31 indicates that the
power structure is similar to that in insider-dominated firms.
Categories (2) and (4) are both outsider-dominated firms and the influence
patterns differ significantly from those observed in insider-controlled firms.
Managers, particularly in the firms with foreign participation, are clearly
subordinated to the owners, although they make the day-to-day decisions and play

33
important role in major investment decisions. In firms with foreign capital the
position of SB compared to the shareholders meeting seems to be more pronounced
than in the firms owned by domestic investors. This reflects the more complex
institutional structure of the foreign-owned firms, which are usually larger.
Therefore managers lose their domination in the firms that are taken over by
outside investors. To secure the interests of the owner, and to upgrade the level of
management, foreign firms not infrequently delegate their people to the Board of
Directors. Out of 8 firms in which foreigners are majority owners, 4 have one or two
foreign directors.
We move now to the de novo private firms. At least 22 of the 40 private firms
are individually owned, with all decisions concentrated in the hands of the owner.
This is typical for the Polish private sector, which consists largely of small and
medium-sized units. Such arrangements, although convenient for firms just entering
the market, are a serious obstacle to growth. We note that the frequent bankruptcies
of private firms, often after a short period of very rapid expansion, are commonly
attributed to improper management. Owners try to manage a $100 million firm in
a way they used to run a 20-man shop.
In the other de novo private firms, ownership is still heavily concentrated,
though in these enterprises there is a formal corporate structure with a Board of
Directors and Shareholders Meeting (and sometimes a SB). Responsibilities are
shared in a typical way, e.g.:
- managers make the day-to-day decisions: prepare budget and financial statements,
hire/fire workers and set their wages, determine the internal structure, but also major
investments (in two thirds of cases)
- owners are said to control allocation of profits (in 12 of 18 cases) and
mergers/acquisitions (similar frequency)
- managers' nominations and compensation is determined by managers and owners
in an equal number of firms, suggesting that the distinction between manager and
owner is blurred.

34
Summarizing and leaving the de novo private firms aside, we can look at the
ownership change in Polish firms as a struggle for power. The government's goal
seems to be an "orderly withdrawal", possibly with somewhat more determination
in "strategic" or "political" sectors. Workers pursue "social" goals. Managers want,
wherever it is possible, to take control of the privatized state firm. The outside
investor has a chance in one of the following three situations: (a) firm is too big to
be taken over by insiders, but is not seen as "strategic", so privatization will not be
blocked by political considerations; (b) the firm is bankrupt, or seems to be so; (c) an
alliance with the managers is formed. Given the strong and historically militant trade
unions, the lack of consistent government policy, and the limited interest shown by
foreign capital, it is not surprising that privatization in Poland is dominated by
insiders, mainly the managers.

35
1. As of end-September 1993, employment in "capital privatized" industrial
enterprises in Poland amounted to 80 thousand. We estimate employment in firms
privatized via leasings and liquidations in industry to have been about 40-60
thousand. Total industrial employment in firms with 6 or more employees was 3.3
million. See the Polish CSO publication Prywatyzacja Przedsi�biorstw Pa½stwowych
według stanu na 30.09.93 r. (Privatization of State Enterprises as of 30.03.93).
2. It is also about the same as the proportion of trade credit overdue in Hungary
as of end-1991, the Czech Republic as of end-1991, and Russia as of 1993. See Fan
and Schaffer (1994) for more details.
3. The picture is muddied somewhat by the treatment of interest on liabilities.
This is included in balance sheet figures for bank debt if the interest is formally
capitalized. We note that accrued interest charges for the 26 financially-distressed
firms amounted to the equivalent of about 5-6% of annual sales, making a net flow
of bank credit to these firms of about 3-4% of sales (see Table 22). Balance sheet data
on tax and social security liabilities apparently include penalty interest on arrears, but
we have no separate data on this. Penalty interest charges on taxes and social
security charges are likely to have been substantial in the financially-distressed firms.
4. End-year bank debt deflated by the December-December industrial price index
(37% in 1993), as a % of start-year bank debt. Bank debt excludes bank debt overdue.
Firms with positive end-year bank debt and zero start-year bank debt are included
in the highest bank debt growth category.
5. We leave open the question of how much was due to banks becoming
"tougher" in 1991, and how much was due to a large number of firms holding bank
debt getting into difficulties in that year.
6. See Fan and Schaffer (1994).
ENDNOTES

36
NOTATION
POE = De novo private firms
PRE = Privatized firms
SA = Corporatized state-owned firms (joint stock companies, 100% state-owned)
SOE = "Traditional" (unincorporated) state-owned firms
Table 1: Size by Ownership Category
Employment in 1993 POE PRE SA SOE(% of group)
≤ 50 employees 31 2 0 3
51-250 62 36 8 29
251-1000 8 45 53 41
1001+ 0 16 40 28
Total 100 100 100 100
Mean employment 111 594 1007 703(persons)
Table 2: Output Growth by Ownership Category
Output Growth in 1993 POE PRE SA SOE(% of group)
< -10% 5 12 20 16
-10% - 10% 21 31 53 43
10% - 25% 13 29 18 23
> 25% 61 29 10 18
Total 100 100 100 100
Unweighted average in 66.5% 20.1% 9.2% 9.8%%

37
Table 3: Employment Growth by Ownership Category
Employment Growth in POE PRE SA SOE1993(% of group)
< -10% 16 27 28 35
-10% - 10% 32 66 73 54
> 10% 53 7 0 5
Total 100 100 100 100
Unweighted average in % 23.3% -6.7% -6.1% -8.1%
Table 4: After-Tax Profit Margin (Profit/Sales in %) by Ownership Category
Profit Margin in 1993 POE PRE SA SOE(% of group)
< -25% 0 7 20 19
-25% - -10% 0 18 12 17
-10% - 0% 25 11 15 22
0% - 10% 53 55 48 37
> 10% 23 9 5 5
Total 100 100 100 100
Average in % Weighted 3.7% 1.3% -0.9% -11.1% Unweighted 4.3% -2.6% -9.9% -18.3%

38
Table 5: Investment/Sales Ratio in 1993 by Ownership Category
Investment/Sales Ratio in POE PRE SA SOE%(% of group)
0% - 1% 10 13 44 43
1% - 3% 43 38 28 31
3% - 5% 13 18 18 13
5% - 10% 10 15 8 10
> 10% 23 15 3 3
Total 100 100 100 100
Unweighted average in % 5.8% 4.4% 2.2% 2.5%

39
Table 6: Distribution of Sales by Market and Ownership Type in 1993 and 1989
a. % Sales to National Market
POE PRE SA SOE
1993 1989 1993 1989 1993 1989 1993 1989
0 - 25 11 3 0 7 3 3 4 4 26 - 50 6 9 7 12 18 8 11 14 51 - 75 11 9 16 14 18 30 24 18 76 - 100 71 79 77 67 63 60 61 65
b. % Sales to CMEA
POE PRE SA SOE
1993 1989 1993 1989 1993 1989 1993 1989
0 80 91 63 49 60 45 76 46 1 - 25 14 9 34 40 40 35 16 43 26 - 50 6 0 3 9 0 18 4 5 51 - 75 0 0 0 2 0 0 3 4 76 - 100 0 0 0 0 0 3 0 3
c. % Sales to non-CMEA
POE PRE SA SOE
1993 1989 1993 1989 1993 1989 1993 1989
0 49 76 52 49 15 20 39 41 1 - 25 29 6 34 33 55 68 30 48 26 - 50 11 9 7 9 10 10 21 10 51 - 75 3 6 7 9 20 3 6 1 76 - 100 9 3 0 0 0 0 4 0

40
Table 7: Market Share in Top 3 Products in 1993
Product 1 Product 2 Product 3
% market 1 2 3 4 1 2 3 4 1 2 3 4
0 38 19 0 13 46 26 6 14 70 22 7 18 1 - 25 31 44 46 47 29 52 69 53 25 48 64 64 26 - 50 9 14 20 13 17 10 9 16 5 11 4 10 51 - 75 13 11 14 13 0 10 3 6 0 4 14 2 76 - 100 9 11 20 14 8 3 14 11 0 15 11 6
POE = 1PRE = 2SA = 3SOE = 4
Table 8: Imports As Source of Competition 1993 and 1989
Ownership Type
POE PRE SA SOE
93 89 93 89 93 89 93 89
Importers are
a. major competitors 34 12 48 9 62 10 45 6b. minor 37 29 28 36 33 51 37 42competitors 29 58 23 55 5 38 18 51c. not competitors

41
Table 9: Sales and Marketing
Ownership Type
Type of Sale POE PRE SA SOE
% 93 91 93 91 93 91 93 91
1. Domestic sales of which 77 86 86 87 77 77 79 82- to consumer 45 50 46 50 55 58 50 52- to retailer 32 36 40 38 22 18 29 30
2. Foreign Sales of which 23 14 14 13 23 23 21 18- direct to purchaser 16 13 6 4 9 5 7 3- via trading co's (domestic) 3 0 4 6 13 18 11 13- via trading co's (foreign) 4 1 3 2 1 1 3 2
Table 10: Percentage of Sales to Government or Budgetary Organizations
% SalesOwnership Type
POE PRE SA SOE
0 89 81 43 43 1 - 25 9 12 38 30 26 - 50 3 7 15 21 51 - 75 0 0 3 5 56 - 100 0 0 3 1

42
Table 11: Employment Relative to Optimal Level in 1993 by Ownership Type
Employment isOwnership Type
POE PRE SA SOE
a. too high > 20% 0 11 5 10b. too high 10-20% 3 9 33 15c. too high 5-10% 14 30 20 29d. about right 60 43 35 45e. too low 23 7 8 1
Table 12: Why firms do not reduce employment if it is too high
% Possible Respondents
Ownership Type
POE PRE SA SOE
a. extra workers cause no financial burden 0 0 4 4b. recovery expected 50 52 65 51c. legal obstacles 33 33 4 7d. social reasons 50 29 61 56e. workers' resistance 0 33 17 30
Table 13: Main Obstacles to Filling Vacancies
Ownership Type
POE PRE SA SOE
a. no qualified applicant 89 100 54 58b. regulations about hiring 0 0 0 0c. unable to pay competitive 0 11 38 47wage

43
Table 14: Significant Factors in Wage Determination
Most importantfactor
% Firms by Ownership Type
1 2 3 4
a. available cash 60 84 45 56b. need to pay competitive 14 5 3 0wages 0 0 47 40c. popiwek 0 0 3 1d. unions, workers' council, 8 7 0 1etc.e. previous wage
Note: some firms ranked more than one factor as being most important
Table 15: Unionization by Ownership Type
% unionization% firms in each ownership type
POE PRE SA SOE
0 100 18 0 5 1 - 25 0 11 5 15 26 - 50 0 48 52 44 51 - 75 0 16 27 29 76 - 100 0 7 15 6
Table 16: Influence of Workers and Their Representative Bodies
Influence has been% firms in each ownership type
POE PRE SA SOE
a. increasing 0 11 5 14b. same 97 59 50 70c. decreasing 3 30 45 16

44
Table 17: Indebtedness by Ownership Category
Equity/Debt ratio at end- POE PRE SA SOE1993(% of group)
< 0 8 7 5 18
0-1 38 61 20 35
1-2 18 16 19 22
> 2 38 16 46 26
Total 100 100 100 100
Table 18: Distribution of Debt to Firms, Banks and Government by OwnershipCategory
Percentage of Liabilities in 1993 owed POE PRE SA SOEto:
Firms (payables for goods and services) 46 45 49 44
Banks 32 16 19 23
Government (taxes and social security) 19 27 24 28
Other 3 12 8 5
Total 100 100 100 100
NB: Unweighted means, Q34.

45
Table 19: Bank Debt/Sales Ratio in % by Ownership Category
Bank Debt as % of Sales in 1993 POE PRE SA SOE(% of group)
0% 40 45 22 23
1% - 5% 35 27 34 23
5% - 10% 10 14 22 23
> 10% 15 14 22 31
Total 100 100 100 100
NB: Q37.
Table 20: "Rank your payment obligations according to priority they are met inpractice." (1=top priority)
Average rank of payments to: POE PRE SA SOE
Government (taxes and social 1.7 1.6 2.0 1.8security)
Banks 2.7 2.6 2.7 2.8
Employees (wages) 1.8 1.8 1.6 1.7
Firms (suppliers) 3.6 3.5 3.6 3.3
NB: Q35.

46
Table 21: Term Structure of Liabilities by Ownership Group
% of payables to suppliers which is: POE PRE SA SOE
Not overdue 78 78 52 44
Overdue 0-3 months 8 13 17 16
Overdue 3-12 months 4 7 15 17
Overdue > 1 year 10 2 16 23
Total 100 100 100 100
Percentage of firms with a quarter ormore of their payables overdue > 1 7% 11% 22% 37%year
% of bank debt which is: POE PRE SA SOE
Not overdue 86 100 90 75
Overdue 0-3 months 3 0 0 2
Overdue 3-12 months 3 0 2 8
Overdue > 1 year 8 0 7 15
Total 100 100 100 100
Percentage of firms with a quarter ormore of their bank debt overdue > 1 5% 2% 10% 14%year
% of taxes payable which is: POE PRE SA SOE
Not overdue 83 88 71 52
Overdue 0-3 months 4 6 7 9
Overdue 3-12 months 9 3 15 16
Overdue > 1 year 4 3 7 23
Total 100 100 100 100
Percentage of firms with a quarter ormore of their taxes overdue > 1 year 2% 4% 10% 33%
NB: unweighted means; firms with zero debt in a category excluded.

47
Table 22: Severely Financially-Distressed Firms and the Financing of Losses
All quantities measured as a 26 Financially-distressed 177 Otherpercentage of 1993 sales firms firms
(1993 profitability < -25%)
"Operating profit", 1993 -16.0 14.0Net profit after tax, 1993 -76.1 0.5
Change in payables to suppliers 8.8 3.01.1.93-31.12.93
Change in bank debt 9.1 2.51.1.93-31.12.93
Change in tax and social 46.3 2.0security liabilities1.1.93-31.12.93
Memo items:
Tax and social securityliabilities in % of 1993 sales 1.1.93 34.0 4.7 31.12.93 80.3 6.7
Taxes and social securitycontributions during 1993, in % 31.2 17.0of 1993 sales (accruals basis)
Equity/debt ratio, end-93 -0.1 1.2
Distribution of debt in % (end-93) 100 100 Total 41 48 Firms (trade creditors) 16 24 Banks 41 22 Government 2 7 Other
Operating profit = revenues minus accrued costs (including accrued taxes) beforedepreciation, interest charges and exceptional charges.
NB: weighted averages (aggregates); unweighted means are similar. Distribution ofdebt from Q34.
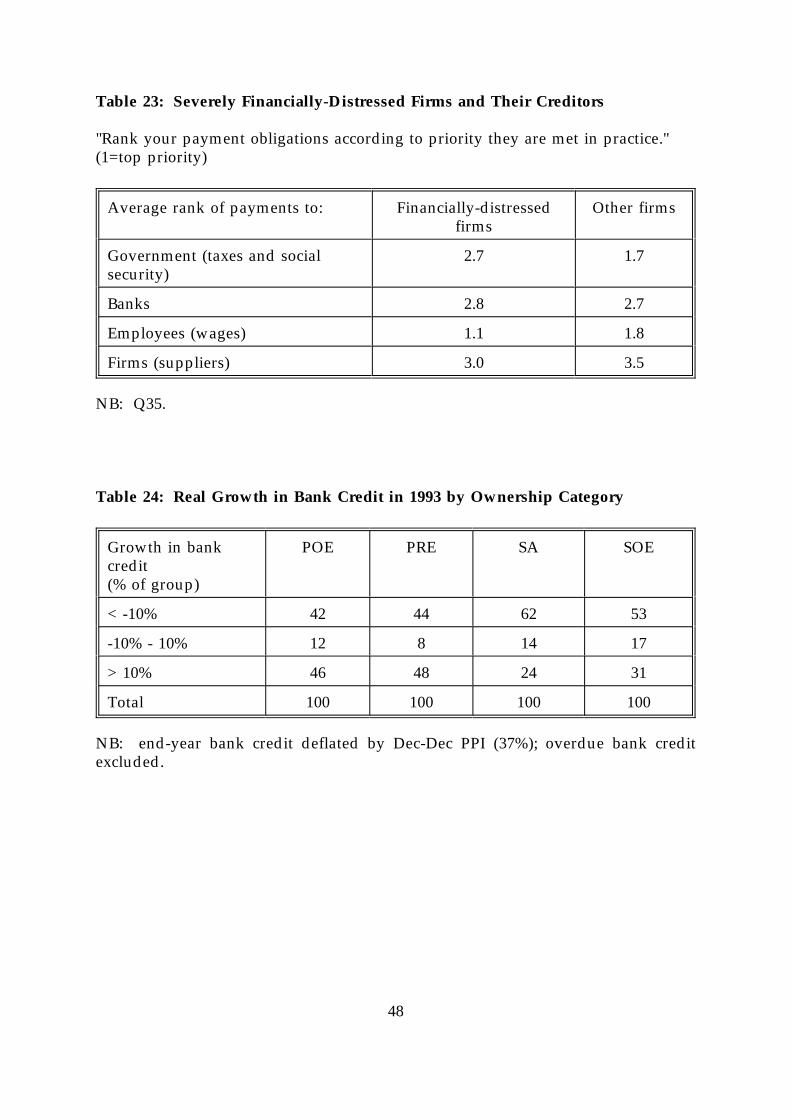
48
Table 23: Severely Financially-Distressed Firms and Their Creditors
"Rank your payment obligations according to priority they are met in practice."(1=top priority)
Average rank of payments to: Financially-distressed Other firmsfirms
Government (taxes and social 2.7 1.7security)
Banks 2.8 2.7
Employees (wages) 1.1 1.8
Firms (suppliers) 3.0 3.5
NB: Q35.
Table 24: Real Growth in Bank Credit in 1993 by Ownership Category
Growth in bank POE PRE SA SOEcredit(% of group)
< -10% 42 44 62 53
-10% - 10% 12 8 14 17
> 10% 46 48 24 31
Total 100 100 100 100
NB: end-year bank credit deflated by Dec-Dec PPI (37%); overdue bank creditexcluded.

49
Table 25: Payment Period and Term Structure of Receivables from Customers
POE PRE SA SOE
Average payment period 1.6 1.8 2.4 2.4(receivables/sales in months) month month month month
s s s s
% of receivables from customers which is:
Not overdue 60 57 49 39
Overdue 0-3 months 12 21 17 21
Overdue 3-12 months 9 13 17 16
Overdue > 1 year 8 9 17 24
Total 100 100 100 100
Percentage of firms with a quarter or moreof their receivables overdue > 1 year 7% 11% 22% 37%
NB: unweighted means.
Table 26: Methods Used to Control Level of Receivables
Method Frequently or always In useused (% of firms)
(% of firms)
Require payment in advance from 49 64new customers
Require payment in advance from 19 42established customers
Charge interest on overdue 61 77receivables
Refuse to supply to a customer 59 83behind in payments
Informal methods 63 83
Legal action 37 72
Sell overdue receivables 2 10

50
Table 27: Vintage of Capital Stock by Ownership.(Percentage of Equipment in Each Age Category)
Vintage of Capital POE PRE SA SOE TOTALStock
Less than 5 Years 66.9 22.6 9.2 10.9 23.05.1 - 10 Years 22.1 24.9 12.9 19.4 19.410.1 - 15 Years 7.1 23.0 27.1 21.2 20.3More than 15 Years 5.9 29.6 50.8 48.5 37.3
Table 28: Methods of Acquisition of New Technologies by Source.(Percentage of Acquisitions)
SOURCES Domestic CMEA OECD Other TotalVia Purchase 27.5 5.5 42.9 9.9 85.7Via Jt. Venture/Outside 3.3 2.2 7.7 1.1 14.3InvestorsTotal 30.8 7.7 50.5 11.0 100
Table 29: New Technology Acquisitions by Performance(Real Sales Growth in 1993) and (Percentage of Acquisitions)
Performanc < - 10% -10 to +10% > + 10% Totale
Source: Domestic 5.1 10.7 15.7 31.5
CMEA 0.6 3.4 3.9 7.9OECD 5.6 20.2 23.6 49.4Other 0.6 3.9 6.7 11.2Total 11.3 38.2 50.0 100.0
Table 30: New Technology Acquisitions by Size of Firm(Percentage of Acquisitions)
Employme 1 to 50 51 to 250 > 250 Totalnt
Source: Domestic 2.7 8.8 19.2 30.8
CMEA 0.5 3.8 3.3 7.7OECD 3.3 11.5 35.7 50.5Other 0.5 6.6 3.8 11.0Total 7.1 30.8 62.1 100.0

51
Table 31: Relative Influence of Various Interests in Privatized Firms
Issue Type of firm BD SB Shareholdersmeeting
Profit allocation Insiders (21) 6 2 13
Foreign capital 1 4 7(10)
Stock Exchange 1 1 3(3)
Other (6) 0 2 4
Hiring/firing Insiders (21) 9 5 7managers
Foreign capital 1 8 1(10)
Stock Exchange 2 1 0(3)
Other (6) 1 2 3
Managerial Insiders (21) 10 9 2compensation
Foreign capital 2 8 0(10)
Stock Exchange 2 1 0(3)
Other (6) 3 2 2
Major investment Insiders (21) 12 4 6
Foreign capital 3 2 4(10)
Stock Exchange 3 1 1(3)
Other (6) 3 0 4
52
REFERENCES
Saul Estrin, Alan Gelb and I.J. Singh (1994), `Restructuring, Viability andPrivatization: A Comparative Study of Enterprise Adjustment in Transition',London Business School/World Bank.
Saul Estrin, Mark E. Schaffer and I.J. Singh (1994), `The Provision of Social Benefitsin State-Owned, Privatized and Private Firms in Poland', paper presented tothe CEPR/IAS conference on Social Protection and the Enterprise inTransitional Economies, Vienna, March 1994. CEP Working Paper No. 606,July.
Estrin-Svejnar (1994).
Qimiao Fan and Mark E. Schaffer (1994), `Governmental Financial Transfers andEnterprise Adjustments in Russia, with Comparisons to Central and EasternEurope', Economics of Transition (Vol. 2, No. 2, June).
Brian Pinto, Marek Belka and Stefan Krajewski (1994), `Transforming State Enterprisesin Poland: Evidence on Adjustment by Manufacturing Firms', BrookingsPapers on Economic Activity (No. 1).