centre for health economics - · pdf filecentre for health economics ... 1 introduction 1 ......
TRANSCRIPT

Centre for Health Economics
Working Paper 141
Conceptualising the Assessment of Quality of Life Instrument Mark 2 (AQoL 2):
Methodological Innovations and the Development of the AQoL Descriptive System
Professor Jeff Richardson Director, Health Economics Unit, Monash University
Mr Neil Atherton Day
Principal Research Fellow, Centre for Program Evaluation, The University of Melbourne
Dr Stuart Peacock Senior Lecturer, Health Economics Unit, Monash University
September, 2003 ISSN 1448 - 6822
ISBN 1 876662 62 X

CENTRE PROFILE
The Centre for Health Economics is a research and teaching organisation established in 1990 to:
• Undertake academic research – methodological and applied into health programs, health systems and current health policy issues;
• Expand the teaching of health economics to increase the supply of trained health economists and to extend the level of understanding of health economics within the wider health community.
The Centre for Health Economics is part of the Faculty of Business and Economis within Monash University.
The views expressed in Centre publications are those of the author(s) and do not necessarily reflect the views of the Centre or its sponsors. Readers of publications are encouraged to contact the author(s) with comments, criticisms and suggestions.

TABLE OF CONTENTS
1 Introduction 1 1.1 MAU Instruments ..........................................................................................................1 1.2 Objectives of the Paper ................................................................................................1 1.3 Genesis of AQoL 1 .......................................................................................................2 1.4 Instrument Validity and the Five Instrument Comparative Study ..................................3
2 Methodological Issues in the Construction of AQoL 2 8 2.1 AQoL 2 Challenges.....................................................................................................11 2.2 AQoL 2 Innovations ....................................................................................................13
3 Construction of the AQoL 2 Descriptive System 16 3.1 Objectives and Methodology.......................................................................................16 3.2 Sample Selection........................................................................................................18 3.3 Data Processing .........................................................................................................21 3.4 Analysis ......................................................................................................................21
4 Results 23 References 24 Appendix 1 Deliberative Methods 26 Appendix 2 AQoL 1 Questionnaire and Scoring Algorithm 30 Appendix 3 AQoL 2 Descriptive System 35
List of Tables Table 1 Number cured equivalent to saving one life – implied by 2 MAU instruments 4 Table 2 Major MAU Scales 5 Table 3 Average utilities by age and patient status (adjusted) 6 Table 4 Correlations between instruments (unadjusted) 7 Table 5 Fieldwork summary: population sample 20 Table 6 Response rates: population sample 20 Table 7 AQoL 1 and AQoL 2 comparison 23 List of Figures Figure 1 HRQoL coverage 6 Figure 2 Structural dependence and double counting 10 Figure 3 Structure of AQoL 1 11 Figure A.1 AQOL II survey design 27 Figure A.2 Survey recruitment matrix – numbers of respondents 27 Figure A.3 Disutility values for item response categories 1-4 by item number 31 List of Boxes Box 1 Steps in constructing a descriptive system 8 Box 2 Visual aid for eliciting the TTO value when independent living is set at the 15
dimension all worst
Conceptualising the Assessment of Quality of Life Instrument Mark 2 (AQoL II): Methodological Innovations and the Development of the AQoL Descriptive System

Conceptualising the Assesment of Quality Of Life Instrument Mark 2 (AQoL II), Methodological
Innovations and the Development of the AQoL Descriptive System
1 Introduction
1.1 MAU Instruments
Before the development of cost utility analysis, economic evaluation of health services either ignored quality of life (QoL) or treated QoL as an ‘intangible’ that could be noted and described but not quantified or included as an integral part of the health outcome. Cost utility analysis (CUA) has attempted to overcome this deficit by adopting the quality adjusted life year (QALY) as the unit of output for health benefits in cost effectiveness studies. One of two approaches have been adopted.
First, in a ‘holistic’ or scenario based approach to measurement, the health states relevant to the evaluation of a health program are described in a series of scenarios. These scenarios are then rated using a scaling device such as the time trade-off or standard gamble to obtain a ‘utility’ index; an index of the strength of a person’s preference for a health state. The index is then used to obtain QALYs. The construction of the health scenarios and the rating exercise both require surveys. Normally, patients who have experienced the health states are consulted for scenario construction and a random population sample used for the rating.
The second ‘decomposed’ approach requires the preliminary construction of a generic multi attribute utility (MAU) QoL instrument which is capable of describing numerous health states and assigning a utility—preference—score to each of these. MAU-instrument construction involves the creation of a descriptive system describing multiple health states. This involves the decomposition of a health state into multiple dimensions of health which are described by one or more items; that is a series of questions, each with multiple responses, which describe the dimension and the intensity of the health state. Generic instruments purport to include all significant dimensions of health. To convert the multi attribute into a multi attribute utility instrument a ‘scaling’ system is created which is capable of assigning utility scores to every combination of health states. This requires the scaling of item responses and the recomposition of the dimensions into particular health states. Literally the MAU approach decomposes health states, assigns utility scores to the decomposed parts and then recombines the parts according to the scoring algorithm to determine an overall utility score for each health state. The attraction of the MAU instrument is, inter alia, that it obviates the need for the two surveys required by the holistic approach, it imposes a standard, non-arbitrary description on the health states and it allows for the continuous collection of data in longitudinal studies.
1.2 Objectives of the Paper
To date there has been only one multi attribute utility (MAU) instrument developed in Australia, namely, the Assessment of Quality of Life Mark 1 (AQoL 1) (Hawthorne and Richardson 1995;
Conceptualising the Assessment of Quality of Life Instrument Mark 2 (AQoL II): Methodological Innovations and the Development of the AQoL Descriptive System 1
Conceptualising the Assessment of Quality of Life Instrument Mark 2 (AQoL II): Methodological Innovations and the Development of the AQoL Descriptive System 2
Hawthorne et al 1996; Hawthorn et al 2000; Richardson and Hawthorne 2001; Richardson et al 2001)1
As discussed below there are limitations with this instrument (and with other MAU instruments) and the construction of the AQoL 2 was motivated by the need to advance the state of the art in MAU instrument construction. More specifically the present paper has five objectives. These are:
(i) To document some of the reasons for concern with respect to the validity of existing instruments, including AQoL 1;
(ii) To describe the conceptualisation of the revised, AQoL 2 instrument;
(iii) To describe the methodological innovations which, in part, motivated the project;
(iv) To present the results from the quantitative and qualitative analysis of candidate items; and
(v) To report the final AQoL 2 descriptive system.
Subsequent publications will describe the time trade-off (TTO) based scaling (calibration) of the descriptive system presented here, the alternative scaling based upon Person Trade-Off (PTO) procedures and the population norms (average AQoL scores) by age and sex cohort.
1.3 Genesis of AQoL 1
The objective of creating a new instrument and not simply rescaling the descriptive system of an existing instrument implies dissatisfaction with the existing instruments. These can be divided into two categories; viz, non-MAU instruments that purport to measure QoL in some sense but do not measure the strength of individual preferences, and MAU instruments that explicitly seek to attach utility values to the health states described by the instrument.
Multi attribute, non-utility based instruments: Some of the non-MAU instruments are described in McDowell & Newell (1987) and Bowling (1995). Most are disease or condition specific. In addition some generic instruments have been developed for population health surveys, for the prediction of resource use or clinical outcomes (a review of many instruments is given in Walker & Rosser 1993). Such instruments may produce a health profile in which the different dimension scores remain disaggregated. Alternatively, they may yield a single QoL score through the use of a simple combination rule such as the unweighted addition of positive responses in each of the dimensions. Neither approach satisfies the requirements of economic evaluation. The use of health profiles may result in ambiguous conclusions. A health related intervention may result in an improvement in one dimension of the profile but a deterioration in another. Under these conditions it is difficult to draw firm conclusions about the overall QoL.
1 The WHO Disability Adjusted Life year (DALY) has been adapted in Australia by Mathers (et al) and in Victoria by Vos
et al). The DALY is conceptually similar to the QALY as it combines years of life lost from each disease with the lost utility attributable to the lower quality of life in a health state (the disutility score times the expected life years in the health state). To date, DALYs have been constructed using the Person Trade-Off (PTO) scaling instrument and not the Time Trade-Off (TTO) or Standard Gamble (SG) favoured by economists in the construction of MAU instruments and in cost utility analysis more generally. The Australian and Victorian DALY studies employed Dutch disutility weights.

Conceptualising the Assessment of Quality of Life Instrument Mark 2 (AQoL II): Methodological Innovations and the Development of the AQoL Descriptive System 3
Aggregate, non-utility scores may provide an unambiguous indication of the movement in the QoL, but economic decision making also requires a consideration of the impact of the intervention upon the quantity of life—life expectancy—and upon cost. In fortuitous circumstances the change in these three project attributes might lead to an unambiguous ranking of two interventions, A and B. This would occur, for example, when project A was superior to project B with respect to all three attributes. However, if project A led to a greater QoL improvement and project B to a greater increase in life expectancy then the overall improvement would be ambiguous. If the costs of these two projects were the same, then the choice between them would depend upon the relative importance of the incremental improvement in QoL and life expectancy. Non-utility instruments are not constructed in a way which permits the combination or comparison of QoL and life expectancy and are, therefore, insufficient for the task of economic evaluation. If the cost of A and B differ then economic evaluation requires a comparison of the cost difference and the difference in health outcomes. This again implies the need for outcomes to be expressed in unambiguous and readily comprehended units.
MAU Instruments: Efforts to overcome this difficulty led to the development of the quality adjusted life year (QALY). Life years are weighted by an index of utility—a preference weight—which acts as an exchange rate between the quantity and quality of life. This implies that two interval properties must be met and not the normal ‘weak’ interval property. The latter implies that a given reduction in the index must mean the same across the entire range of the index. (For example a reduction of 0.2 from 1.0 to 0.8 must mean the same as a reduction from 0.5 to 0.3. However for validity in the context of economic evaluation the utility index must have a ‘strong’ interval property. This requires that a given percentage reduction in the utility index must have the same importance (as measured by the strength of preference) as the same percentage reduction in life expectancy. Thus, for example, a 20 percent reduction in the utility index must mean the same as a 20 percent reduction in life expectancy as either of these will reduce the number of QALYs by 20 percent.
Achieving this property is highly problematic, and it is almost universally ignored. This is a serious defect in the literature and in the state of the art in MAU instrument construction. Cost utility analysis purports to include both the quantity and quality of life in a single metric for health outcome and the exchange rate function of the QALY between the quantity and quality of life is of pivotal importance for instrument validity. To date, the property has been sought by the selection of scaling techniques which employ a trade-off between the quality and quantity of life; viz, the time trade-off (TTO), Standard Gamble (SG) and the Person Trade-Off (PTO). The validity of the scale values obtained from the use of these techniques cannot be determined by direct comparison with actual behaviour: people cannot be easily observed trading QoL against life expectancy. Consequently scale values rely primarily upon construct validity: their acceptability depends primarily upon the belief that people may make meaningful judgments about the trade-off.
1.4 Instrument Validity and the Five Instrument Comparative Study
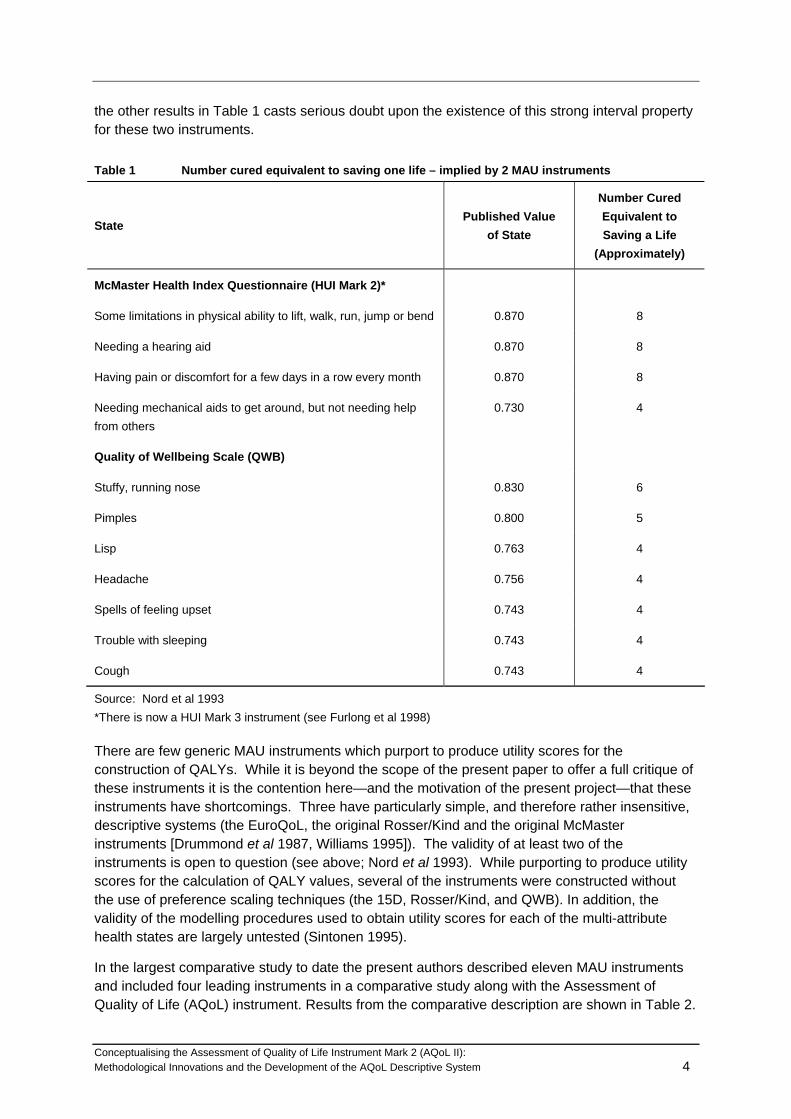
Few comparative studies of MAU generic instruments have been reported in the literature. The result of one test of two instruments is reported in Table 1. Published values for the original McMaster and the Quality of Wellbeing (QWB) instruments (column 2) were used to calculate the number of people whose full cure (utility index returns to 1.0) would be equivalent to saving a life (gaining 1.0). This is reported in column 3. Thus, for example, according to the QWB, curing one person from a ‘cough’ would increase utility by 1 - 0.74 = 0.26. Four such cures would increase utility by 4 x 0.26 = 1.03 and therefore be equivalent to saving a life. The implausibility of this and
Conceptualising the Assessment of Quality of Life Instrument Mark 2 (AQoL II): Methodological Innovations and the Development of the AQoL Descriptive System 4
the other results in Table 1 casts serious doubt upon the existence of this strong interval property for these two instruments.
Table 1 Number cured equivalent to saving one life – implied by 2 MAU instruments
State Published Value
of State
Number Cured Equivalent to Saving a Life
(Approximately)
McMaster Health Index Questionnaire (HUI Mark 2)*
Some limitations in physical ability to lift, walk, run, jump or bend 0.870 8
Needing a hearing aid 0.870 8
Having pain or discomfort for a few days in a row every month 0.870 8
Needing mechanical aids to get around, but not needing help from others
0.730 4
Quality of Wellbeing Scale (QWB)
Stuffy, running nose 0.830 6
Pimples 0.800 5
Lisp 0.763 4
Headache 0.756 4
Spells of feeling upset 0.743 4
Trouble with sleeping 0.743 4
Cough 0.743 4
Source: Nord et al 1993 *There is now a HUI Mark 3 instrument (see Furlong et al 1998)
There are few generic MAU instruments which purport to produce utility scores for the construction of QALYs. While it is beyond the scope of the present paper to offer a full critique of these instruments it is the contention here—and the motivation of the present project—that these instruments have shortcomings. Three have particularly simple, and therefore rather insensitive, descriptive systems (the EuroQoL, the original Rosser/Kind and the original McMaster instruments [Drummond et al 1987, Williams 1995]). The validity of at least two of the instruments is open to question (see above; Nord et al 1993). While purporting to produce utility scores for the calculation of QALY values, several of the instruments were constructed without the use of preference scaling techniques (the 15D, Rosser/Kind, and QWB). In addition, the validity of the modelling procedures used to obtain utility scores for each of the multi-attribute health states are largely untested (Sintonen 1995).
In the largest comparative study to date the present authors described eleven MAU instruments and included four leading instruments in a comparative study along with the Assessment of Quality of Life (AQoL) instrument. Results from the comparative description are shown in Table 2.

Conceptualising the Assessment of Quality of Life Instrument Mark 2 (AQoL II): Methodological Innovations and the Development of the AQoL Descriptive System 5
In addition to the differences reported in Table 2, the five instruments included in the second stage of the study differed significantly with respect to their content and the number of items used to describe the different dimensions of health. These differences are shown in Figure 1.
Table 2 Major MAU Scales
Scale Descriptive System
Type of Description (Sensitivity
‘Utility Scores’1 Using
Psychometric properties
Model
Con-struct4
‘Valida-tion'
Rosser Kind XXX ME No No None
Quality of Wellbeing
X RS No Yes Additive
15D Sintonen ** Impairment
RS No Yes Additive
HUI I X TTO No No Multiplicative
HUI II * Impairment
RS/SG No Yes Multiplicative
HUI III *** Impairment/ disability
RS No na Multiplicative
EuroQoL/EQ5D X Handicap TTO No No Additive/ Econometric
DALY XXX Disease PTO No No RS/PTO3
WHOQoL ** Handicap No ?? Additive
SF36 (converted)
** Handicap SG Additive
AQoL 1 *** Handicap TTO Yes Yes Multiplicative
AQoL 2 **** Handicap TTO/PTO Yes No Multiplicative/ Econometric

Figure 1 HRQoL Coverage
HRQoL dimensions SF-36 AQoL EuroQol HUI-III 15DRelative to the body
Anxiety/Depression *** * * **Bodily care * * * *Cognitive ability * *General health ******Memory *Mobility *** * * * *Pain ** * * ** *Physical ability/Vitality ******* * *Rest and fatigue ** * *Sensory functions ** **** *****
Social expressionActivities of daily living * * *Communication * ** *Emotional fulfilment ** **Family role *Intimacy/Isolation *Medical aids use *Medical treatment **Sexual relationships *Social function ** *Work function **
HRQoL dimensions SF-36 AQoL roQol HUI-III 15DEuRelative to the body
Anxiety/Depression *** * * **Bodily care * * * *Cognitive ability * *General health ******Memory *Mobility *** * * * *Pain ** * * ** *Physical ability/Vitality ******* * *Rest and fatigue ** * *Sensory functions ** **** *****
Social expressionActivities of daily living * * *Communication * ** *Emotional fulfilment ** **Family role *Intimacy/Isolation *Medical aids use *Medical treatment **Sexual relationships *Social function ** *Work function **
1
Of greater concern, when the five instruments were administered to 976 respondents (hospital in patients, out patients, and members of the general population) the correlation between the utility scores predicted by the five instruments was very low and the mean values for patients i different age cohorts differed significantly. These results are shown in Tables 3 and 4.
Table 3 Average utilities by age and patient status (adjusted)
.929 .938 .969 .944 .969
.872 .903 .944 .901 .967
.884 .904 .945 .894 .955
.791 .827 .906 .823 .935
.716 .806 .888 .739 .894
.722 .793 .878 .747 .887
.771 .781 .888 .787 .906
.626 .638 .833 .704 .859
.637 .772 .871 .649 .866
.525 .692 .806 .488 .817
.533 .668 .808 .563 .823
.493 .595 .791 .580 .830
16-3535-5050 - 6565 - 95
Age inYears
Popln
16-3535-5050 - 6565 - 95
Age inYears
Outpatient
16-3535-5050 - 6565 - 95
Age inYears
Ward
Respondenttype
Mean
AQOL3adjusted
Mean
HUI-3adjusted
Mean
15Dadjusted
Mean
EUROQoLadjusted
Mean
SF-36Utility
adjusted
Conceptualising the Assessment of Quality of Life Instrument Mark 2 (AQoL II): Methodological Innovations and the Development of the AQoL Descriptive System 6

Conceptualising the Assessment of Quality of Life Instrument Mark 2 (AQoL II): Methodological Innovations and the Development of the AQoL Descriptive System 7
Table 4 Correlations between instruments (unadjusted)
AQoL HUI III 15D EuroQoL SF-36
HUI III .762
15D .821 .799
EuroQoL .751 .653 .760
SF36 utility .733 .664 .741 .7.25
Mean .767 .715 .775 .722 .716
Notes:
Population, Outpatient and Ward cases, N = 906 - 968
The conclusion drawn from this five instrument study was that, at present, no instrument can claim gold standard status, that some or all of the instruments produce seriously biased utility scores and that the value of health improvement attributable to a medical intervention will vary significantly with the choice of MAU instrument.
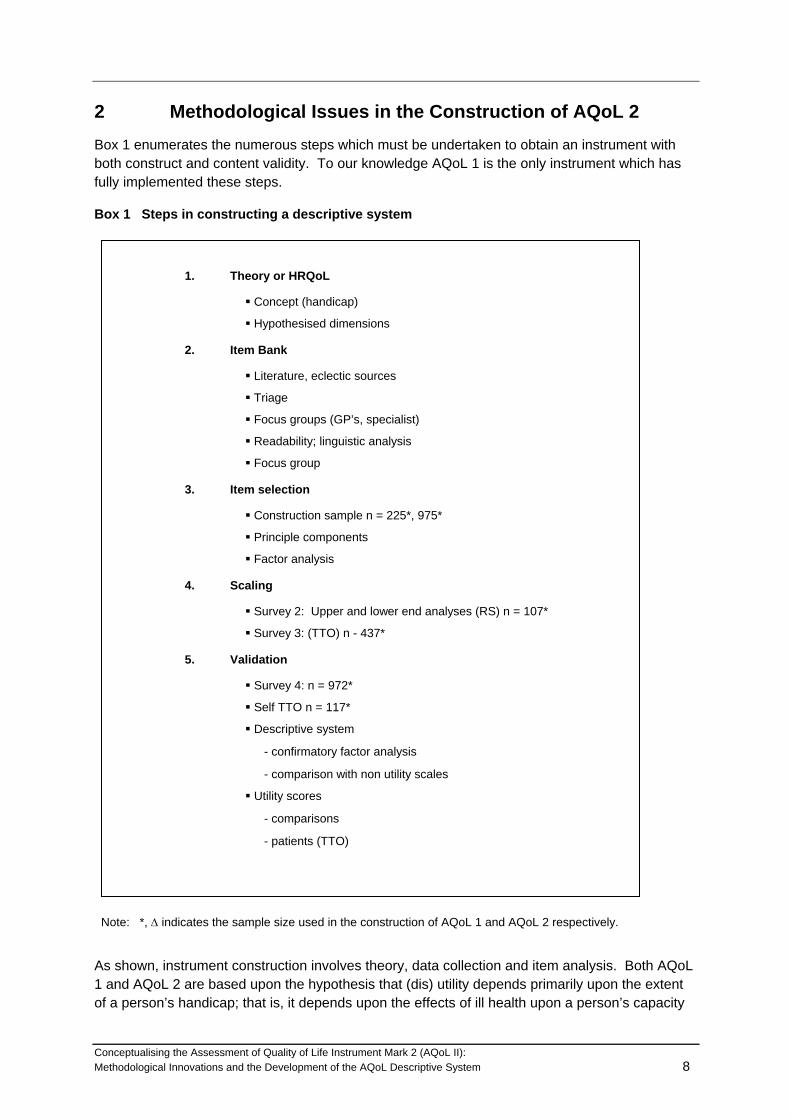
2 Methodological Issues in the Construction of AQoL 2 Box 1 enumerates the numerous steps which must be undertaken to obtain an instrument with both construct and content validity. To our knowledge AQoL 1 is the only instrument which has fully implemented these steps.
Box 1 Steps in constructing a descriptive system
1. Theory or HRQoL
Concept (handicap)
Hypothesised dimensions
2. Item Bank
Literature, eclectic sources
Triage
Focus groups (GP’s, specialist)
Readability; linguistic analysis
Focus group
3. Item selection
Construction sample n = 225*, 975*
Principle components
Factor analysis
4. Scaling
Survey 2: Upper and lower end analyses (RS) n = 107*
Survey 3: (TTO) n - 437*
5. Validation
Survey 4: n = 972*
Self TTO n = 117*
Descriptive system
- confirmatory factor analysis
- comparison with non utility scales
Utility scores
- comparisons
- patients (TTO)
Note: *, Δ indicates the sample size used in the construction of AQoL 1 and AQoL 2 respectively.
As shown, instrument construction involves theory, data collection and item analysis. Both AQoL 1 and AQoL 2 are based upon the hypothesis that (dis) utility depends primarily upon the extent of a person’s handicap; that is, it depends upon the effects of ill health upon a person’s capacity
Conceptualising the Assessment of Quality of Life Instrument Mark 2 (AQoL II): Methodological Innovations and the Development of the AQoL Descriptive System 8

Conceptualising the Assessment of Quality of Life Instrument Mark 2 (AQoL II): Methodological Innovations and the Development of the AQoL Descriptive System 9
to function in a social context. In contrast, the HUI instruments, EQ5D and 15D incorporate descriptive systems based upon disability, that is, upon ‘within the skin’ descriptions of the impact of ill health upon a person’s capacity to carry out certain functions or, using the WHO’s description, ‘any restriction or lack of ability to perform an activity in the manner or within the range considered normal for a human being’, (WHO 1980:28). Based upon this theory dimensions of handicap are hypothesised. An item bank is then constructed from the very large number of items which describe the hypothesised dimensions. Items are obtained from a number of sources; the literature, from other instruments, from focus groups and researcher creation. A triage process is conducted to determine items which are most readable and achieve a full coverage of the hypothesised dimension of handicap. Final item selection is based upon an analysis of a ‘construction sample’. This is a stratified and representative group of respondents who complete all of the items. Analysis of these responses indicate the items which cluster together and, the clustering indicates the extent of correspondence between hypothesised dimensions and the clustering of item responses.
The resulting descriptive system is ‘scaled’ using a model. All of the major instruments describe so many combinations of item responses that it is impossible to obtain a utility score directly. For example AQoL 1 consists of 12 items each with 4 response categories2. Consequently, there are 412—16.8 million—combinations of item responses. To date MAU instruments have employed simple additive models (weights summed to united) multiplicative models (weights constrained scores between 1.0 and 0) and econometric models (whereby selected multi attribute states are regressed upon item responses and the coefficients of the best fitting statistical result become the item weights).
Finally, instrument construction should be followed by a series of validation studies. Despite the powerful and misleading connotations of the term ‘validation’, an instrument is never fully validated in the sense that it is shown to be a gold standard. Rather, evidence should be obtained which supports the hypothesis that an instrument produces true values for utility in a particular context. This process normally involves a series of comparisons with other instruments and the evidence supporting the hypothesis of instrument validity is progressively strengthened with the continued accumulation of confirmatory results. Despite its youth AQoL 1 has achieved some outstanding results (Hogan et al 2001; Sturm et al 2002; Osborne et al 2002).
The process described involves a number of challenges. First, the descriptive system must convey the same information to the survey respondent assigning utility scores during instrument construction and to the patient who subsequently describes their own health state. For example, a ‘within the skin’ description of hearing loss may lead to a significant disutility during the construction phase. Those actually suffering hearing loss may not experience this disutility if their social environment permits significant adaptation and the disability does not lead to significant handicap.
Secondly, and as described by Winterfeldt and Edwards (1986) (also see Feeny and Torrance (1996)) an instrument must have an appropriate level of preference independence. Simplifying the utility score for one dimension should not depend upon the level of a patient along a second dimension. Without preference independence it would become necessary to model and scale the interactions. Only Feeny and Torrance in the context of the HUI 3 have attempted a partial
2 The initial instrument consisted of 15 such items but the 3 items describing ‘illness’ were removed as a result of the
validation study.
modelling of such an interaction. However their study concluded that a simple multiplicative model without interactions outperformed the partial multi linear model.
A third requirement is that the items are sensitive to all health states over the health domain which the instrument purports to describe. Thus, for example, an instrument which included the disutility arising from reduced locomotion might accurately detect a reduced capacity to walk and run but fail to detect the reduced capacity to climb stairs. If the former problem did not correlate highly with the latter then the descriptive system has a degree of insensitivity. More importantly, neither of these problems might have a significant effect upon an elderly person who does not seek to walk significant distances or have stairs in their house. Rather, their ability to move around the house and carry out activities of daily living should be included in a sensitive instrument.
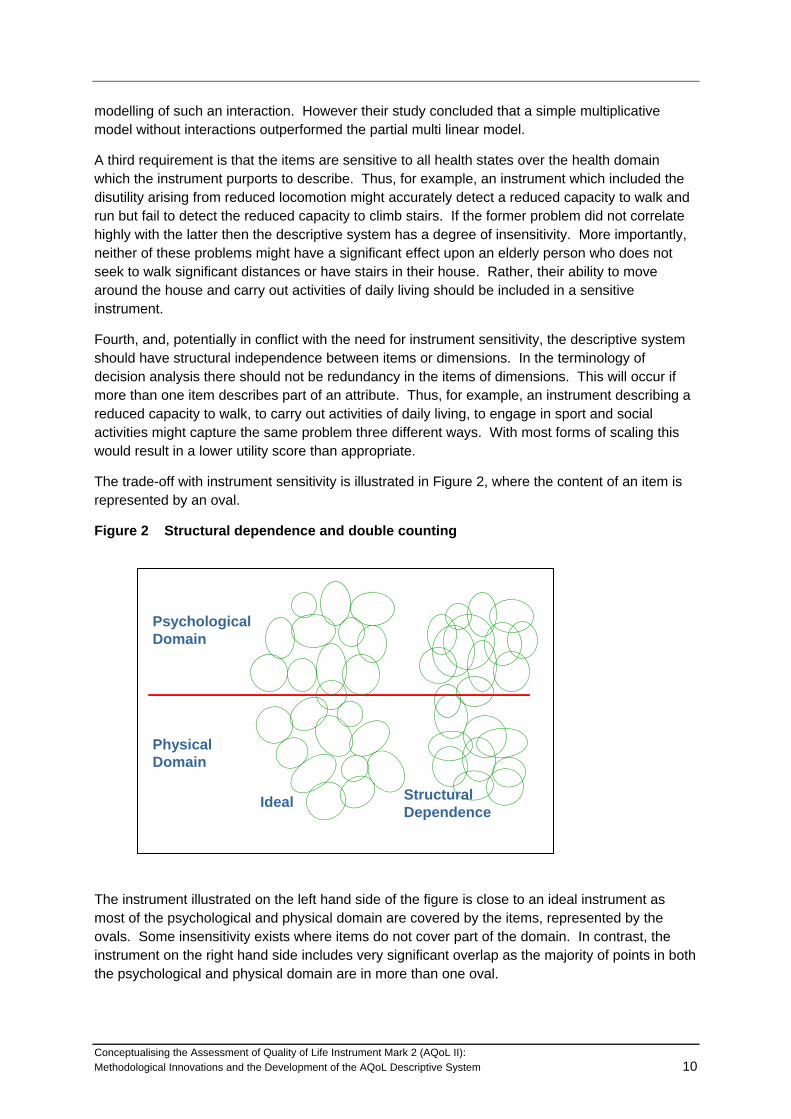
Fourth, and, potentially in conflict with the need for instrument sensitivity, the descriptive system should have structural independence between items or dimensions. In the terminology of decision analysis there should not be redundancy in the items of dimensions. This will occur if more than one item describes part of an attribute. Thus, for example, an instrument describing a reduced capacity to walk, to carry out activities of daily living, to engage in sport and social activities might capture the same problem three different ways. With most forms of scaling this would result in a lower utility score than appropriate.
The trade-off with instrument sensitivity is illustrated in Figure 2, where the content of an item is represented by an oval.
Figure 2 Structural dependence and double counting
Psychological Domain
Physical Domain
Ideal StructuralDependence
The instrument illustrated on the left hand side of the figure is close to an ideal instrument as most of the psychological and physical domain are covered by the items, represented by the ovals. Some insensitivity exists where items do not cover part of the domain. In contrast, the instrument on the right hand side includes very significant overlap as the majority of points in both the psychological and physical domain are in more than one oval.
Conceptualising the Assessment of Quality of Life Instrument Mark 2 (AQoL II): Methodological Innovations and the Development of the AQoL Descriptive System 10

AQoL 1 sought to overcome the latter problems and the trade-off between redundancy and instrument sensitivity by the adoption of an hierarchical structure. This is shown in Figure 3.
Figure 3 Structure of AQoL 1
Socialrelationships
Independent living
Illness
Physical senses
Psychologicalwell-being
prescribed medicinesmedication and aids
medical treatment
self - carehousehold tasks
mobility
relationships with otherssocial isolation
family role
seeinghearing
communication
sleepanxiety & depressed
pain
Health
Related
Quality of
Life
In this sensitivity was sought by employing several items in the knowledge that this led to some double counting (redundancy) within dimensions. Statistical independence—orthogonality—was achieved between the five dimensions during the construction state through use of factor analysis. The downward bias resulting from double counting was limited by independently assessing the disutility of each dimension ‘all worst’ health state; that is, it was not possible for the disutility, including double counting, to be greater than the disutility of the three items evaluated simultaneously. The low scores obtained by the overall AQoL cast some doubt upon the success of this strategy.
2.1 AQoL 2 Challenges
In the three years following its initial publication, the AQoL 1 was requested and sent to 80 research teams and appears to be have been used in at least 50 projects. Feedback from a number of these including studies conducted at the Centre for Health Program Evaluation and particularly feedback from the five instrument study (Richardson et al 2001) a number of strengths and potential weaknesses were identified. Positive features of the instrument appear to be as follows:
• AQoL 1 has greater sensitivity over certain domains of ill health than other instruments and particularly in the region of good health;
• the instrument detects—predicts—greater changes in utility than other instruments included in the comparative studies;
• conceptualising health in terms of handicap has led to a preference for the AQoL instrument in a number of projects where social context has been of importance;
• the instrument is quickly completed and easy to administer.
Conceptualising the Assessment of Quality of Life Instrument Mark 2 (AQoL II): Methodological Innovations and the Development of the AQoL Descriptive System 11
Conceptualising the Assessment of Quality of Life Instrument Mark 2 (AQoL II): Methodological Innovations and the Development of the AQoL Descriptive System 12
Negative features emerging from this experience are as follows:
• Despite the relative sensitivity in the region of good health there is significant room for improvement. Like other instruments, AQoL 1 is primarily concerned with ‘illth’, not vitality and wellness as needed for the evaluation of health promotional activities;
• Utility scores have been modelled in the AQoL using the most sophisticated algorithm to date, viz, a multi level multiplicative model. While there are compelling reasons for preferring a multiplicative to an additive model there are few compelling reasons for believing that either the dimension utilities or the global utility have a simple multiplicative relationship to the constituent items and dimensions respectively. Further, while dimensions were selected and constructed to be orthogonal the lack of structural independence within dimensions would tend to bias utility scores downwards. Likewise, while items were selected to minimise preference dependency there is no procedure for off-setting bias introduced by this or the other threats to numerical validity;
• Despite the use of the hierarchical structure to quarantine the effects of structural dependence within dimensions, global AQoL scores are systematically lower than scores on other instruments. HUI 3, the other multiplicative model, likewise has low utility scores which suggests that the multiplicative model, by permitting lower scores, may tolerate downward errors in a way which cannot occur with additive models;
• As with all other instruments, AQoL 1 employed ‘spontaneous utilities’; that is, respondents were presented with TTO trade-offs in an interview context where, despite the exhortation to think about the task, the opportunities for deliberation were small and the opportunities for discussion and consultation nonexistent. Because of adaptation, we have hypothesised that ‘deliberative utilities’ will be systematically higher than ‘spontaneous utilities’;
• The potentially greatest threat to the validity of a decomposed than reconstructed instrument score may be the so called ‘focussing fallacy’. Survey respondents are asked to consider the disutility of a dimension ‘all worst’ health state while all other dimensions are at the dimension ‘all best’. This ‘swing weight’ approach to the elicitation of utilities facilitates both the process of questioning and the subsequent modelling. However the process will yield invalid scores if respondents do not believe that a dimension all worst health state is compatible with all best health states elsewhere. If this fact is forgotten then the respondent may then ‘focus’ exclusively upon the single dimension all worst and, mentally, interpret this as indicative of the overall health state, an assumption which would create a significant downward bias in the estimated utility scores;
• AQoL 1 necessarily adopted a single scaling procedure, viz, the TTO. This has increasingly been the procedure of choice in recent cost utility studies. It produces scores of the same magnitude as the Standard Gamble, the procedure preferred by those who believe that behaviour under risk is consistent with the axioms of Von Neumann and Morgenstern (a group of economists which explicitly excludes Von Neumann and Morgenstern! (Pope 1983; Pope 1995)). In contrast, the Person Trade-Off (PTO) procedure yields significantly higher utility scores. It has recently been promoted by those who argue that a social perspective should be adopted when evaluating health states; that is, respondents should be asked to imagine they are prioritising health services for others who will experience the health states and not themselves (see, in particular, Nord 1999). The argument has been persuasive and the WHO has adopted this perspective in
Conceptualising the Assessment of Quality of Life Instrument Mark 2 (AQoL II): Methodological Innovations and the Development of the AQoL Descriptive System 13
the construction of the Disability Adjusted Life Year (DALY) which has been used to quantify the Burden of Disease in every country (Murray and Lopez 1996). This suggests the desirability of constructing a ‘bridge’ between TTO and PTO based scoring algorithms.
2.2 AQoL 2 Innovations
The innovations which motivated AQoL 2 were a response to the challenges discussed above. The main innovations are listed below.
2.2.1 AQoL 2 Descriptive System
The procedures adopted for the derivation of the descriptive system followed the psychometric principles necessary for content and construct validity (AQoL appears to be unique amongst MAU models in this respect). AQoL 2 is also similar to AQoL 1 in its conceptualising health primarily in terms of handicap; that is, our basic hypothesis is that utility is primarily determined by handicap and not by impairment or disability. AQoL 2 was constructed to achieve a multi level model with a number of (orthogonal) sub-dimensions each of which consists of a number of (non orthogonal) items.
The content and structure of an instrument, constructed as described above, is determined by the ‘universe’ of health states defined by the item bank included in the construction survey. For AQoL 2 the item bank was expanded to include items of greater relevance in the region of normal-good health. Additionally, response categories for items in AQoL 1 were expanded from 4 per item in order to gain greater upper end sensitivity.
The second innovation with respect to the descriptive system was the addition of a ten point rating scale with endpoints ‘greatly improved’ and ‘totally ruined’. Respondents were asked to use this scale to indicate how the health state described by their item response affected their quality of life.
The rating scale was included for two reasons. First, it permits a consistency check. Discordance between the item response category and the rating scale response may signal the need to eliminate the responses from an analysis. Secondly, during the scaling—calibration—of the descriptive system, dimension scores will be compared, econometrically, with both item and rating scale responses to determine whether or not the rating scale responses increase the explanatory power of the dimension score. If this result is found then the final scoring algorithm can include this information.
2.2.2 Scaling
The protocol for scaling AQoL 2 included three potentially important innovations. The first of these was an attempt to encourage respondent deliberation. The almost universal practice in cost utility analysis has been to present respondents with a vignette or health state and ask for their response (using the TTO, SG or PTO). While respondents are encouraged to think before responding the time constraints upon the interview necessarily results in a ‘spontaneous response’. People making real world decisions with respect to these health states would, in contrast, have the opportunity to contemplate the options at length and to discuss the issues involved with family and friends. There has been almost no experimentation with the use of ‘deliberative responses’ (for exceptions see Murray and Lopez 1996; Shiell 2000). Consequently
Conceptualising the Assessment of Quality of Life Instrument Mark 2 (AQoL II): Methodological Innovations and the Development of the AQoL Descriptive System 14
the AQoL 2 protocol employed two separate face-to-face interviews. Respondents were dichotomised. One half of respondents were provided with a deliberation kit designed to encourage thought and discussion of selected issues between the interviews. The remaining respondents were simply re-interviewed. Differences between the first and second interview responses in the second group may arise because of unreliability (a low test-retest correlation). Significant differences between the two groups may be attributed to deliberation. If detected, the scaling protocol allows for adjustment of spontaneous responses. The achievement of deliberative responses is discussed more fully in Appendix 1.
A second major innovation is the use of three separate scaling devices in the context of a MAU instrument. As with AQoL 1 the principle scaling technique is the Time Trade-Off (TTO) which, as noted above, yields utility scores which are very similar to the Standard Gamble. Additionally, however, the major parameters which determine the order of magnitude of the health state—dimension worst and multi attribute health states—are also being scaled with the Person Trade-Off (PTO) instrument. An exchange rate between the two instrument values will be constructed econometrically and this will permit a second set of AQoL 2 tariffs, viz, a PTO scoring system incorporating a social perspective.
During the interview, respondents are asked to conduct a ‘self-TTO’. That is, they are asked to nominate the number of years of life they would sacrifice to move from their current health state to the AQoL all best health state for the remainder of their life. In principle, this information would permit the construction of a third AQoL tariff. Based upon experience with self-TTO during the five instrument validation study, however, it is likely that self-TTO responses will be too unreliable for this task. The properties of self-TTO responses have not been explored in the literature.
The third and potentially most important change associated with scaling AQoL 2 is a change in the presentation of questions to minimise error arising from the focusing effect discussed above. For each of the multi attribute health states an overview of the full health state is included which indicates which of the dimensions are at the dimension all best, all worst, or at an intermediate health state. An example of the visual aid is shown in Box 2. While the respondent is asked to focus primarily upon the dimension worst health state they are visually reminded that other dimensions are at their all best.
A final difference with AQoL 1 arises for pragmatic reasons. If a single respondent was asked to provide all of the information required, the interview burden would be excessive, even allowing for the two stage interview described above. Consequently the two face-to-face interviews were used to collect TTO and PTO scores for the major parameters, viz, the multi attribute health states and the dimension all worst scores. Item responses and item worst scores are being collected using a postal rating scale. Overlapping questions will allow the construction of an exchange rate between RS and TTO/PTO scores.
2.2.3 Modelling
The ‘decomposed’ scores for items and dimensions are to be combined using a two stage procedure. First, multiplicative models will be used to predict dimension utility scores. These, in turn, will be combined with an overarching multiplicative model. At the second stage there will be an ‘econometric correction’. This has two parts. As described above, in the first stage information from the item rating scales will be used to increase the predictive power and validity of dimension scores. Secondly there will be a similar econometric correction to predict the global AQoL 2 score. TTO scores have been obtained for a number of multi attribute states. These will be ‘explained’ econometrically by the predicted AQoL score but, additionally, by individual

dimension scores and/or dummy variable for each of the dimensions. There will be limited experimentation with other personal information to determine whether or not AQoL scores vary systematically with the age and socio economic status of respondents.
Box 2 Visual aid for eliciting the TTO value when independent living is set at the dimension all worst
Conceptualising the Assessment of Quality of Life Instrument Mark 2 (AQoL II): Methodological Innovations and the Development of the AQoL Descriptive System 15

Conceptualising the Assessment of Quality of Life Instrument Mark 2 (AQoL II): Methodological Innovations and the Development of the AQoL Descriptive System 16
3 Construction of the AQoL 2 Descriptive System
3.1 Objectives and Methodology
There were two major objectives in the development of the AQoL 2 descriptive system. First it was desirable that the AQoL 2 have elements of continuity from the AQoL 1 to allow for comparison between the results. Secondly, the new questionnaire was intended to improve the sensitivity of the AQoL 1, and particularly for the health states of healthier people. The project sought to develop an instrument that would detect the effects of health promotion programs over the next decade.
This development was undertaken in three phases: literature review, consultations and focus groups with key informants, pre-testing and piloting.
3.1.1 Review of literature and QoL questions
An extensive literature review was undertaken and, in particular, the questions used in the measurement of health related quality of life were examined. This work built upon several previous stages of the AQoL program. The first was the AQoL validation study, a survey of three groups of Victorian adults; viz, the general population, hospital inpatients and outpatients. In this survey, each informant completed the AQoL 1 questionnaire and five other instruments (SF-36, EQ5d, 15D, WHOQol and HUI2/3). The survey provided a basis for the comparative analysis of a large number of items, which guided the selection and testing of items for the AQoL 2. The second resource was the large bank of 350 items developed for AQoL 1. These items were reviewed and many tested for inclusion in AQoL 2.
The brief for the development of AQoL 2 specified that it was to address the needs of health promoters, and in particular be sensitive to measurements of quality of life affecting aged persons, those of NESB and adolescents. Interviews were conducted with researchers working in the areas of aging, youth health and ethnic health.
3.1.2 Focus Groups
Because of the significance of the health promotion objectives of the AQoL 2, it was decided to conduct group discussions. After initial interviews with key stakeholders from the health promotion area, several potential informants were identified. These informants included potential users of the AQoL 2, either as researchers, policy makers or managers who might be expected to utilize the instrument. In particular the Victorian Health Promotion Foundation was asked to nominate two health promotion practitioners with an interest in the application of quality of life measurement instruments. The focus groups were held at Melbourne University in June 1998.
Three broad questions were canvassed:
• What is the current role of quality-of-life measurement in health promotion.
• How is quality-of-life conceptualised by practitioners and researchers working in health promotion?
• Over the next five to ten years, what are broad changes and developments are likely to occur in Health Promotion that we should try to anticipate in revising our Quality-of-Life instrument?

Conceptualising the Assessment of Quality of Life Instrument Mark 2 (AQoL II): Methodological Innovations and the Development of the AQoL Descriptive System 17
The first area considered by groups was the current role of quality-of-life measurement in health promotion. Specifically the following questions were asked:
• How extensively is quality-of-life measurement used currently?
• What are the main current applications of quality-of-life instruments?
• What are the major issues at the moment for quality-of-life measurement in Health Promotion?
The next area considered was the conceptualisation of quality-of-life measurement in health promotion. The relevant questions here were as follows:
• How is quality-of-life conceptualised by practitioners and researchers working in health promotion? Will our illness oriented instrument require revision for applications in Health Promotion?
• What needs fixing? In revising the AQoL 1 instrument, where should the research team focus our attention? Specifically:
o what are the main shortcomings in quality-of-life measurement—and in particular AQoL 1—that most urgently need attention?
o which of these short-comings would be most amenable to improvement in a revised AQoL.
The initial responses to these questions indicated that quality-of-life measurement is rarely used in health promotion. At present, outcomes are more likely to be measured in terms of knowledge gain or lifestyle change. Informants generally could see a major advantage in the possibility of quality-of-life measure that would provide a common metric enabling different health interventions to be compared. However some remained sceptical about the possibility of developing such a measure.
There was some concern among practitioners that at present quality-of-life measurement tools have a more clinical orientation and application. Moreover, there a problems as a result of the program logic underlying much health promotion activity. Many health promotion interventions work by initially increasing the recipient’s level of concern about a health issue in anticipation of changing behaviour and ultimately improving quality of life. A lengthy time scale would be required to see many health promotion outcomes translated into changes in quality of life.
Some participants anticipated an increase in the importance of less material elements in health, for example psychic satisfaction, spirituality, sexual fulfilment, and that these elements may feature more prominently in conceptions of quality-of-life in the future. Another issue raised was the increasing awareness of sub cultural differences in health-related attitudes and behaviours and the impact this was having on work in health promotion. Finally, some group participants believed that in the future there would be an increasing trend movement away from individual level objectives towards the achievement of collective goals. These conclusions serve to illustrate the limitations of individual oriented QoL instruments. They do not, of course, suggest that such instruments are unimportant.

Conceptualising the Assessment of Quality of Life Instrument Mark 2 (AQoL II): Methodological Innovations and the Development of the AQoL Descriptive System 18
3.1.3 Pre-testing and Piloting
The final database was subjected to a triage procedure based upon an analysis of language, conceptual content and clarity. As a general but not invariable rule items were preferred which contained a single important element as multi element items may, potentially, create ambiguities and preference reversals. The final Construction Questionnaire included 112 items and covered the following six domains:
(i) social (including work, family and intimate relationships) (ii) independent living (iii) mental health (iv) illness (including pain) (v) values and beliefs (vi) sensory
3.2 Sample Selection
The construction survey was administered to three groups of people:
• 316 randomly selected members of the Victorian adult population over 18 years
• 96 inpatients from one Melbourne Metropolitan Hospital
• 206 outpatients at a Melbourne Metropolitan Hospital
3.2.1 Adult Population Sample
Sample error estimates suggested that responses from 1,000 individuals would provide an optimal trade off between field cost and precisions of estimates. Allowing for a response rate of 66 percent required 1,500 to be selected. All Victorian postcodes were stratified by population size and socio-economic status using the SEIFA indicator. The number to be included in the sample was determined by the population postcode. A final sample of 1,514 members was selected from a total of 436 postcodes, with the number sampled from each post-code varying from 1 to 18.
A computer readable telephone directory was used to select the required number of telephone services from each postcode. After sending a preliminary letter explaining the study to the registered subscriber, a telephone interview was used to collect information about the subscribers and, after randomising by first name, one ‘in-scope’ individual was selected from each telephone service. (Information about the number of subscribers, was subsequently used to weight the data to offset the over-representation of telephones servicing one person. Similarly an adjustment was made to off-set the increased chance of selection by individuals with multiple telephone listing. After these corrections for the number of subscribers per telephone number the sample represented a two stage unclustered sample design stratified by the following:
• post code location and population size
• postcode areas: socio-economic status (use of SEIFA index in the selection of very small postcode areas)
The primary sampling unit is the telephone service, and the secondary sampling stage is the selection of one person from among those who regularly use the service.
Conceptualising the Assessment of Quality of Life Instrument Mark 2 (AQoL II): Methodological Innovations and the Development of the AQoL Descriptive System 19
The errors to which the sample is prone include
• non-response or refusal from the telephone subscriber
• non-response or refusal from the selected person
• errors in postcode population estimates
• errors resulting from mapping of SEIFA census data aggregated to 1996 postcode boundaries on to boundaries contemporary with the study
• errors resulting from the exclusion of telephone services not included in the machine readable telephone directory.
A mail questionnaire was posted to the selected person.
Inpatients were opportunistically selected from seven wards in one Melbourne metropolitan hospital. Patients were initially approached by clinical staff with a letter requesting the patient’s participation. Researchers, who worked in the hospital over a four week period, approached all inpatients for whom permission was granted by clinical staff, and who were available in the ward at the time of interviewer visit. Informants required sufficient English language to complete the questionnaire either in writing or orally: translations or interpretation was not available. The informants represent a “time slice” sample of inpatients who were well enough to complete the questionnaire, either unaided or with the assistance of an interviewer. Interviewers reported no refusals from among 96 inscope patients.
Patients in the waiting room of the emergency department of the same hospital were approached by interviewers, presented with a short letter explaining the study and requested to fill out the questionnaire while waiting for attention: 206 complied.
The field stage of the population survey consisted of the following steps:
• an initial letter was sent to selected telephone subscribers, introducing the study and explaining the procedure;
• a telephone call was made to explain the study and to select an informant from the household. Five telephone calls were made at different times and days before the number was abandoned. Additional telephone calls were commonly required to obtain the cooperation of the selected person;
• the questionnaire was despatched by post in most cases. Face to face interviews were reserved for pre-testing in cases where interviewer assistance was requested;
• up to two reminder letters or phone calls were made in cases of non-response to despatched questionnaires.
Telephone interviewers were selected by program research staff in the pilot stage, and by three experienced research assistants who were extensively trained for the main stages of the project. The procedure for telephone selection was highly systematized and rigorously adhered to by staff.
A qualified and experienced Social Worker was retained in the role of counsellor for any respondents who might have encountered health or personal difficulties as a result of completing the questionnaire. The social worker was available ‘on call’ to answer queries or deal with problems raised by any informants who were disturbed, worried or upset as a result of completing
Conceptualising the Assessment of Quality of Life Instrument Mark 2 (AQoL II): Methodological Innovations and the Development of the AQoL Descriptive System 20
the construction questionnaire. The Social Worker was instructed to refer any such callers to an appropriate agency. No calls were received.
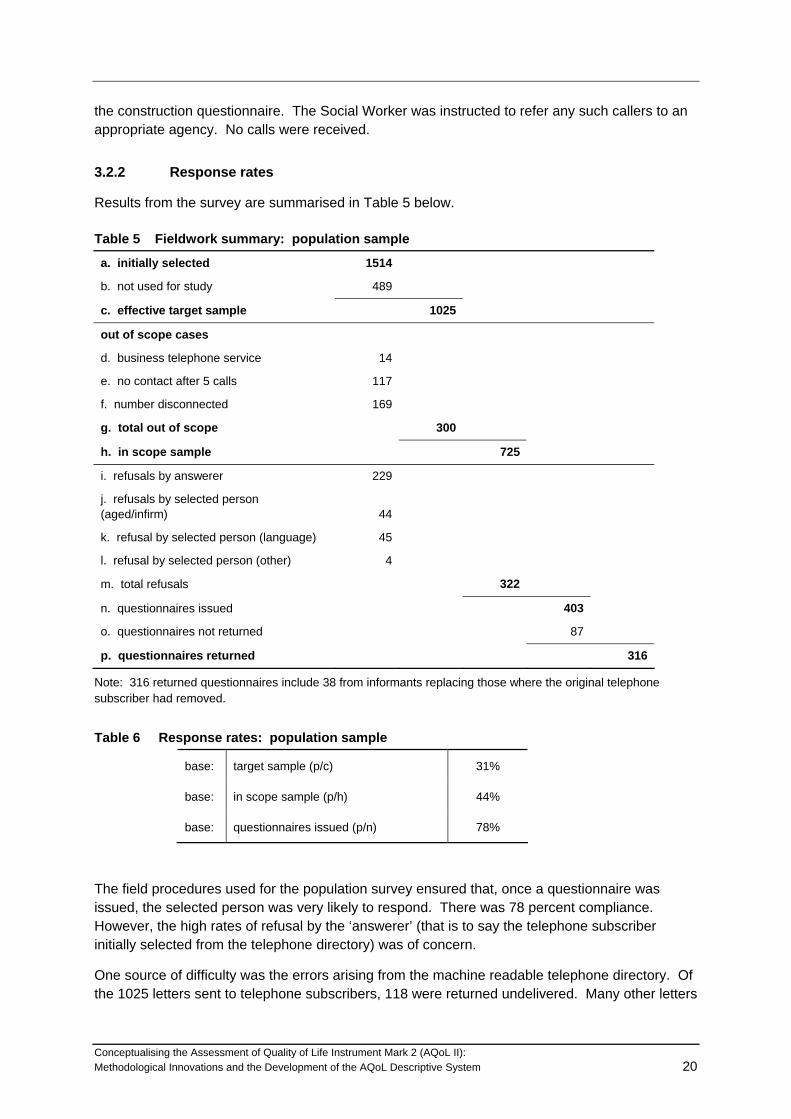
3.2.2 Response rates
Results from the survey are summarised in Table 5 below.
Table 5 Fieldwork summary: population sample
a. initially selected 1514
b. not used for study 489
c. effective target sample 1025
out of scope cases
d. business telephone service 14
e. no contact after 5 calls 117
f. number disconnected 169
g. total out of scope 300
h. in scope sample 725
i. refusals by answerer 229
j. refusals by selected person (aged/infirm) 44
k. refusal by selected person (language) 45
l. refusal by selected person (other) 4
m. total refusals 322
n. questionnaires issued 403
o. questionnaires not returned 87
p. questionnaires returned 316
Note: 316 returned questionnaires include 38 from informants replacing those where the original telephone subscriber had removed.
Table 6 Response rates: population sample
base: target sample (p/c) 31%
base: in scope sample (p/h) 44%
base: questionnaires issued (p/n) 78%
The field procedures used for the population survey ensured that, once a questionnaire was issued, the selected person was very likely to respond. There was 78 percent compliance. However, the high rates of refusal by the ‘answerer’ (that is to say the telephone subscriber initially selected from the telephone directory) was of concern.
One source of difficulty was the errors arising from the machine readable telephone directory. Of the 1025 letters sent to telephone subscribers, 118 were returned undelivered. Many other letters

Conceptualising the Assessment of Quality of Life Instrument Mark 2 (AQoL II): Methodological Innovations and the Development of the AQoL Descriptive System 21
were found not to have been delivered, although not returned. Some errors were due to the original subscriber having moved.
Many errors were due to the omission of flat or unit numbers from the directory for multiple dwellings at a single address. This meant that, during the initial telephone interview, “answerers” were asked to respond to questions about the names and numbers of users of their telephone service from an unknown ‘cold’ caller. Procedures were subsequently modified so that in such cases, the telephone interviewer offered to send a preliminary letter to establish the credibility of the study.
The major reason for the difficulty in securing participation was probably the sheer bulk of the questionnaire: with 112 quality of life items, each with two questions, plus background information questions. This is an unavoidable problem confronting any survey researcher requiring answers to a large number of items during the construction stage of any questionnaire. A trade off is required between the large questionnaire desirable for instrument construction and the need for a short questionnaire to reduce respondent burden and facilitate high response rates.
3.3 Data Processing
To randomise order effects, questions were randomly sorted into 8 different sequences which were incorporated into eight different versions of the questionnaire. These eight versions were randomly allocated among informants.
Upon receipt, questionnaires were visually checked, and some instances, where pages appeared to have been skipped, informants were requested to re-complete.
Data from the completed questionnaires was double entered, and all inconsistencies checked and re-entered. All items were range checked and many logical checks were carried out. SPSS/data entry was used during key punching.
Missing information on individual items was well within acceptable boundaries, with the exception of three questions about intimate relationships. These items were subject to EM estimation using the SPSS Missing Values procedure, so that answers to all the questions in the social dimension were used to estimate values on intimacy questions for those who had not answered.
3.4 Analysis
Initially, all frequency distributions and missing values were checked to identify items that might lack sufficient variance or have no “head room” or “foot room”. Such items were felt to be unlikely to detect change in health states.
Another aspect checked at this stage was differences in response between the population, outpatient and inpatient samples. Lack of discrimination was seen as a matter of concern for most variables, but not in the case of items where, on prima facie grounds, hospital status might be considered less likely to affect response: for example social items. Similarly, where responses on the associated scale items (about the effect of the health state on quality of life) suggested the differences in levels of response to the item was no associated with different levels of concern in terms of quality of life.

Conceptualising the Assessment of Quality of Life Instrument Mark 2 (AQoL II): Methodological Innovations and the Development of the AQoL Descriptive System 22
These considerations were generally used to rank items, rather than discard them at this preliminary stage of the analysis.
The remainder of the analysis was a search for structure among the items, so that selection of a small number of items for the AQoL 2 instrument could adequately represent a wide range of health states.
This process used two structural equation programs: for dimensions with fewer than 20 items, the EQS program was used. For other dimensions, the LISREL program was applied. In each case, canonical correlations were used to reflect the ordinal nature of the data from the items. For purposes of validation, in the case of one dimension both programs were used and, due to differences in the algorithms, results were found to differ slightly.
At first, the LISREL structural equation program was used to test the hypothesis that all items included in the dimension did measure the same underlying concept. This generally led to the exclusion of several questions. The second step was to check for internal structure within the domain: modification indices provided by the LISREL program often suggested sub dimensions, and these were explored with a series of different models. The final stage in the process was to check for items that cross loaded between dimensions, and, in a few instances items ultimately were found to measure a domain different from that intended.
After modelling each individual domain, the overall fit of the model was tested and some fine tuning undertaken, to result in a final model with six dimensions, each dimension having 3, 4 items, as shown in the appendix. The fit of the model is excellent, with an RMSEA index of 0.05 (regarded as ideal in the literature, which generally stipulates that anything less that 0.08 is satisfactory). The widely quoted Comparative Fit Index (CFI) is 0.99 (generally accepted range is > 0.95).
It should be stressed that, at all stages, the structure of the model was reviewed from a substantive as well as a statistical view point. In choosing items to include, and deciding on the desirable structure, the structural equation modelling was used to establish a range of variant models. Decisions between the models, or about variations within them were informed by consideration of the theoretically substantive coverage of what is generally regarded as health related quality of life.
One example will illustrate the general approach: a review of the model will show loadings between items and dimensions (lambdas) are generally high, indicating a close relationship between the variance of each item and the dimension it represents. The exceptions are in the sensory perception dimension, where the lowest loading (0.58) is for Q18 about vision. This suggests that vision is less closely related to quality of life than other items in the model. This is readily interpretable: people can suffer poor vision without it necessarily being related to other deficiencies in health related quality of life. Similarly the loading from the AQoL to the sensory perception domain (gamma coefficient) is lowest in this region of the model: 0.51. This suggests that sensory perception is less closely related to the other constructs represented by the general AQoL Quality of Life measure. However, to exclude vision or sensory perception from a generic instrument would fly in the face of conventional understandings of the conceptual boundaries of health related quality of life, so it is unhesitatingly included in the model. It is worth reiterating that, although these loadings are low, they do not compromise the fit of the model to the data, which is, by all measures, outstandingly good.
Conceptualising the Assessment of Quality of Life Instrument Mark 2 (AQoL II): Methodological Innovations and the Development of the AQoL Descriptive System 23
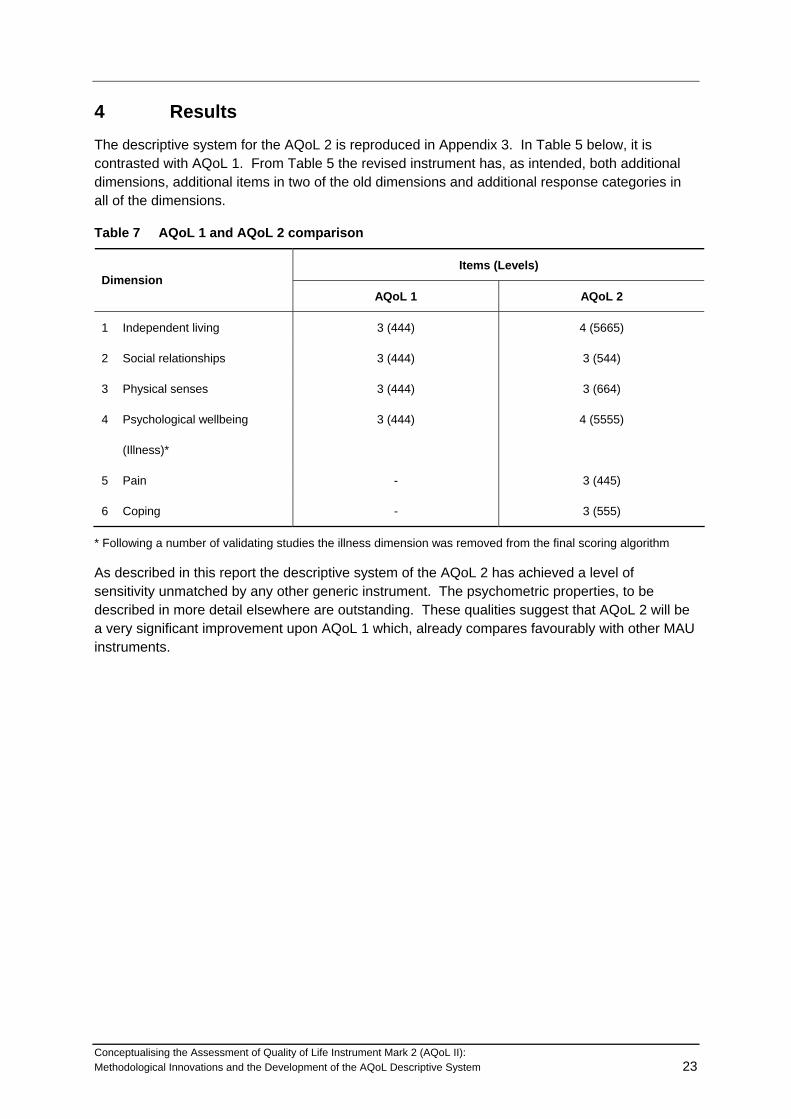
4 Results The descriptive system for the AQoL 2 is reproduced in Appendix 3. In Table 5 below, it is contrasted with AQoL 1. From Table 5 the revised instrument has, as intended, both additional dimensions, additional items in two of the old dimensions and additional response categories in all of the dimensions.
Table 7 AQoL 1 and AQoL 2 comparison
Items (Levels) Dimension
AQoL 1 AQoL 2
1 Independent living 3 (444) 4 (5665)
2 Social relationships 3 (444) 3 (544)
3 Physical senses 3 (444) 3 (664)
4 Psychological wellbeing 3 (444) 4 (5555)
(Illness)*
5 Pain - 3 (445)
6 Coping - 3 (555)
* Following a number of validating studies the illness dimension was removed from the final scoring algorithm
As described in this report the descriptive system of the AQoL 2 has achieved a level of sensitivity unmatched by any other generic instrument. The psychometric properties, to be described in more detail elsewhere are outstanding. These qualities suggest that AQoL 2 will be a very significant improvement upon AQoL 1 which, already compares favourably with other MAU instruments.
Conceptualising the Assessment of Quality of Life Instrument Mark 2 (AQoL II): Methodological Innovations and the Development of the AQoL Descriptive System 24
References Bowling A 1995, Measuring Disease: A Review of Disease Specific Quality of Life Measurement
Scales, Open University Press, Suffolk.
Drummond M, Stoddard G & Torrance G 1987, Methods for the Economic Evaluation of Health Care Programs, Oxford Medical Publications, Oxford.
Feeny D, Torrance G & Furlong W 1996, Health Utilities Index, in B Spilker (ed) Quality of Life and Pharmacoeconomics in Clinical Trials, Philadelphia Lippencott Raven Publishers.
Furlong W, Feeny D, Torrance G et al 1988, Multiplicative Multi Attribute Utility Function for the Health Utility Index Mark 3 (HUI 3) System: A Technical Report 98/11, Hamilton McMaster University, Centre for Health Economics and Policy Analysis.
Hawthorne G & Richardson J 1995, An Australian MAU/QALY instrument: rationale and preliminary results, Working Paper 49, Centre for Health Program Evaluation, Monash University.
Hawthorne G, Osborne R, McNeil H, & Richardson J 1996, The Australian Multi-Attribute Utility (AMAU): Construction and Initial Evaluation, Working Paper 56, Centre for Health Program Evaluation, Monash University.
Hawthorne G, Richardson J, Day N & McNeil H 2000, Construction and utility scaling of the Assessment of Quality of Life (AQoL) Instrument, Working Paper101, Centre for Health Program Evaluation, Monash University.
Hogan A, Hawthorne G, Kethel L, Giles E, White K et al, Health related quality of life outcomes from Addle cochlear implantation: a cross sectional survey, Cochlear Implants International, 2, 2, 115-128.
McDowell I & Newell C 1987, Measuring Health: A Guide to Rating Scales and Questionnaires, Oxford University Press, Oxford.
Murray, C. and Lopez, A., 1996. The Global Burden of Disease, Geneva: WHO. Harvard University Press.
Nord E 1999, Cost Value Analysis, Cambridge University Press, Cambridge.
Nord E, Richardson J & Macarounas-Kirchmann K 1993, ‘Social evaluation of health care versus personal evaluation of health states’, International Journal of Technology Assessment and Health Care, 9:4, 463-478.
Osborne R, Hawthorne G, Lew E & Gray C, ‘Quality of life assessment in the community dwelling elderly: Validation of the Assessment of Quality of Life (AQoL) instrument and comparison with the SF 36’, Journal of Clinical Epidemiology (in press).
Conceptualising the Assessment of Quality of Life Instrument Mark 2 (AQoL II): Methodological Innovations and the Development of the AQoL Descriptive System 25
Pope R 1983, ‘The pre-outcome period and the utility of gambling’, in B Stigun and F Wenstop (eds), Foundations of Utility and Risk Theory with Applications, D Reidel Dordrecht 37-177.
Pope R 1995, ‘Towards a more precise decision framework: A separation of the negative utility of chance from the diminishing marginal utility and the preference for safety’, in Theory and Decision, 39, 241-265.
Richardson J & Hawthorne G 2001, Negative Utility Scores and Evaluating the AQoL All Worst Health State, Working Paper113, Centre for Health Program Evaluation, Monash University.
Richardson J, Hawthorne G and Day NA 2001, ‘A comparison of the assessment of quality of life (AQoL) with four other generic utility instruments’, Annals of Medicine, vol 33, no 5, pp 358-370.
Rosser R 988, ‘A health index and output measure’, in S Walker and R Rosser (eds) Quality of Life: Assessment and Application, MTP Press.
Sheill, A., Seymour, J., Hawe, P. and Cameron, S., 2000. ‘Are preferences over health states complete?’, Health Economics, 9, 47–55.
Sintonen H 1995, The 15D Measure of Health Related Quality of Life, Feasibility, Reliability and Validity of its Valuation System, Working Paper 42, National Centre for Health Program Evaluation, Monash University.
Sturm JW, Osborne RH, Dewey HM et al, 2002, Brief comprehensive quality of life assessment after stroke: the Assessment of Quality of Life instrument in the North East Melbourne Stroke Incidence study (NEMESIS), Stroke, December 1-7.
Williams A 1995, The Measurement and Validation of Health: A Chronicle, Discussion Paper 136, Centre for Health Economics, The University of York.
Winterfedt C Von & Edwards W 1986, Decision Analysis and Behavioural Research, Cambridge University Press, Cambridge.
World Health Organisation (WHO) 1980, International Classifications of Impairments, Disabilities and Handicaps, World Health Organisation, Geneva.

Conceptualising the Assessment of Quality of Life Instrument Mark 2 (AQoL II): Methodological Innovations and the Development of the AQoL Descriptive System 26
Appendix 1 Deliberative Methods A key feature of the AQOL II has been the development of spontaneous and deliberative utility weights. To date, all QALY (Quality Adjusted Life Year) scores have been based on MAU instruments which have used a single interview format to elicit spontaneous utility weights from a population sample. However, the universal practice of obtaining utility scores from a single interview has been questioned in two significant studies.
The WHO DALY (Disability Adjusted Life Year) study (Murray and Lopez 1996) replaced a single interview strategy with a two stage procedure. Initial surveys were administered using PTO (Person Trade-Off) and TTO (Time Trade-Off) techniques. These were followed by focus groups of expert respondents discussing inconsistencies and conflicts from earlier responses, producing deliberative utility scores. Spontaneous and deliberative scores were found to be virtually uncorrelated.
Sheill et al (2000) obtained valuations for two health states over three separate interviews held within a 1 to 8 week period using a convenience sample of Medical Faculty staff. 36 percent of participants showed evidence of reflection i.e. the first interview prompted them to think about their valuations and to change their answers at the second interview. 24 percent of participants showed evidence of reflection at the third interview. Only 40 percent of participants had stable valuations over time, suggesting spontaneous valuations may be unreliable.
The findings raise questions about the validity of QALY scores based on spontaneous utility weights and the degree of correspondence between repeat administration of valuation questions.
AQOL II Survey Design
Utility weights for the AQOL II were elicited from respondents over two face-to-face interviews. The study adopted a novel survey design to test the reliability of TTO valuations (test-retest) and to test for differences between spontaneous and deliberative TTO valuations. The survey design is shown in figure 1.
The population sample was randomly drawn from the Victorian population using the White Pages. Potential respondents were contacted by mail, and those agreeing to participate were stratified into one of five SEIFA groups based on postcode of residence. The study sought to recruit approximately 400 participants, to obtain valuations from 360 respondents (allows for 10 percent drop out/invalid responses).
All respondents were asked to complete the AQOL I and AQOL II questionnaires, a baseline socio-economic and demographic questionnaire. All respondents completed 11 TTO questions at interview I: 6 TTOs for AQOL dimension worst health states, 1 TTO for the AQOL all-worst health state, 3 TTOs on AQOL multi-attribute health states, and 1 TTO on their own, current, health state (‘self-TTO’). 6 sorts of TTO questions were used. Each sort contained the same dimension worst TTOs, the AQOL all-worst TTO and the self-TTO, but the order of the dimension worst TTOs was varied to remove any bias from question ordering effects. Each sort contained a different set of 3 multi-attribute health state TTOs (making a total of 18 multi-attribute health state questions used in the study) which are to be used for econometric modelling. Respondents were assigned to one of the six sorts prior to interview I.
At the end of interview I, respondents were randomly assigned to either the control or the deliberative arm of the study. This led to the survey recruitment matrix shown in figure 2.

Figure A.1 AQOL II Survey Design
Control Arm
Wash Out
Interview II
Conceptualising the Assessment of Quality of Life Instrument Mark 2 (AQoL II): Methodological Innovations and the Development of the AQoL Descriptive System 27
Population Sample
Interview I Assignment to study arm
Deliberation Tasks
Interview II
Deliberative Arm
Figure A.2 Survey Recruitment Matrix – Numbers of Respondents
Sort 1 Sort 2 Sort 3 Sort 4 Sort 5 Sort 6
C D C D C D C D C D C D TOTAL
SEIFA Group1
6 6 6 6 6 6 6 6 6 6 6 6 72
SEIFA Group2
6 6 6 6 6 6 6 6 6 6 6 6 72
SEIFA Group3
6 6 6 6 6 6 6 6 6 6 6 6 72
SEIFA Group4
6 6 6 6 6 6 6 6 6 6 6 6 72
SEIFA Group5
6 6 6 6 6 6 6 6 6 6 6 6 72
TOTAL 30 30 30 30 30 30 30 30 30 30 30 30 360
(C = control arm, D = deliberative arm)
Respondents assigned to the control arm were only told to come back for Interview II in 2-3 weeks time. The 2-3 week period was therefore used as a ‘wash-out’ period, during which respondents should forget their responses from interview I. This allowed the testing of test-retest reliability of valuations between the two interviews.
Respondents assigned to the deliberative arm were given a set of “deliberation tasks” to complete in the 2-3 week period before interview II. These were designed to stimulate reflection and further consideration of valuations before interview II. This allowed testing of the effects of deliberation
Conceptualising the Assessment of Quality of Life Instrument Mark 2 (AQoL II): Methodological Innovations and the Development of the AQoL Descriptive System 28
on valuations made at interview I compared to valuations made at interview II. The deliberation tasks asked respondents in the deliberative arm to:
• Complete the AQOL II questionnaire for the worst health state they had ever experienced.
• Complete a TTO on the worst health they had ever experienced.
• Complete a TTO on the AQOL all-worst (AQoL 2) health state.
• Complete a TTO on one of the AQOL dimension worst health states.
Deliberative respondents were provided with a blank AQOL II questionnaire and TTO sheets for self completion at home. Critically, deliberative respondents were asked to discuss the questions, their answers, and their reasons for their valuations (e.g. what particular aspect of a health state made it so bad) with a family member or friend. Respondents were asked to speak with the person they might discuss health related problems with in real life, e.g. a spouse, close relative or close friend etc. The rationale for these procedures was twofold:
1. Imagining the worst health state a respondent had ever experienced should encourage greater critical reflection on different aspects of health, and recollection of personal experiences should make the descriptions of AQOL health states more meaningful to the individual.
2. Discussion with a family member or friend who they would turn to with real life health related problems should also encourage greater critical reflection, should broaden issues considered in arriving at valuations, and should clarify thinking on different aspects of health.
It was also recognised that, in real life, some individuals may choose not to discuss health problems with a family member or friend (e.g. due to social isolation, or because they prefer their own counsel). It was important that these people were not excluded from the deliberative tasks, because deliberation was designed to encourage the type of reflection that would occur in real life situations. Therefore, at the end of interview I deliberative respondents were asked if they would choose to discuss health problems with anyone in real life, and if they would not they were asked to complete the deliberation tasks just as if they were facing a real life trade-off decision on their own.
At then end of the first interview all respondents were asked whether they would be willing to complete the deliberation tasks. Those who were not willing were assigned to the control arm. Those who had found interview 1 emotionally or cognitively demanding were also assigned to the control arm. Respondents in the deliberative arm spent an additional 10 minutes at the end of the first interview having the deliberation tasks explained to them by the interviewer. Respondents were asked to bring their completed deliberation materials with them to the second interview.
At the second interview all respondents (control and deliberative) completed the same 11 TTOs they had answered in interview I. Those in the deliberative arm also had the opportunity to discuss with the interviewer the deliberation tasks and any changes to their responses.
The AQOL II survey design therefore provides a unique set of tests for the reliability of, and the effects of deliberation on, TTO valuations. More specifically it permits:
• Comparison between TTOs from interview 1 and 2 in the control arm. This provides a “pure” test of TTO test-retest reliability;
Conceptualising the Assessment of Quality of Life Instrument Mark 2 (AQoL II): Methodological Innovations and the Development of the AQoL Descriptive System 29
• Comparison between TTOs from interview I and II in the deliberative arm of this provides a joint test of TTO test-retest reliability and of deliberation on TTO valuations;
• Comparison between TTOs from interview II in the control arm and TTOs from interview II in the deliberative arm. This provides a “pure” test of deliberation on TTO valuations (net of any test-retest reliability effects); and
• Comparison between TTOs from interview I in the control arm and TTOs from interview I in the deliberative arm. This provides a check for any systematic differences from any self selection between survey arms.
References
Murray, C. and Lopez, A., 1996. The Global Burden of Disease. Geneva: WHO. Harvard University Press.
Sheill, A., Seymour, J., Hawe, P. and Cameron, S., 2000. ‘Are preferences over health states complete?’, Health Economics, 9, 47–55.
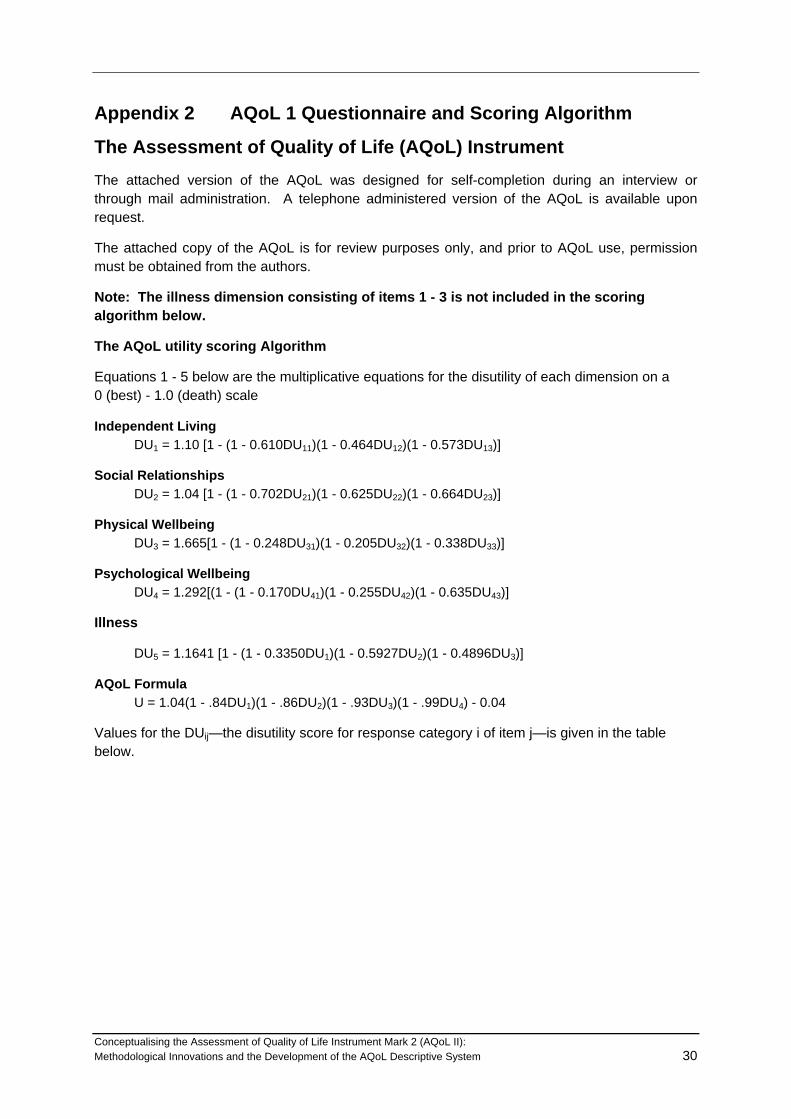
Appendix 2 AQoL 1 Questionnaire and Scoring Algorithm
The Assessment of Quality of Life (AQoL) Instrument The attached version of the AQoL was designed for self-completion during an interview or through mail administration. A telephone administered version of the AQoL is available upon request.
The attached copy of the AQoL is for review purposes only, and prior to AQoL use, permission must be obtained from the authors.
Note: The illness dimension consisting of items 1 - 3 is not included in the scoring algorithm below.
The AQoL utility scoring Algorithm
Equations 1 - 5 below are the multiplicative equations for the disutility of each dimension on a 0 (best) - 1.0 (death) scale
Independent Living DU1 = 1.10 [1 - (1 - 0.610DU11)(1 - 0.464DU12)(1 - 0.573DU13)]
Social Relationships DU2 = 1.04 [1 - (1 - 0.702DU21)(1 - 0.625DU22)(1 - 0.664DU23)]
Physical Wellbeing DU3 = 1.665[1 - (1 - 0.248DU31)(1 - 0.205DU32)(1 - 0.338DU33)]
Psychological Wellbeing DU4 = 1.292[(1 - (1 - 0.170DU41)(1 - 0.255DU42)(1 - 0.635DU43)]
Illness
DU5 = 1.1641 [1 - (1 - 0.3350DU1)(1 - 0.5927DU2)(1 - 0.4896DU3)]
AQoL Formula U = 1.04(1 - .84DU1)(1 - .86DU2)(1 - .93DU3)(1 - .99DU4) - 0.04
Values for the DUij—the disutility score for response category i of item j—is given in the table below.
Conceptualising the Assessment of Quality of Life Instrument Mark 2 (AQoL II): Methodological Innovations and the Development of the AQoL Descriptive System 30
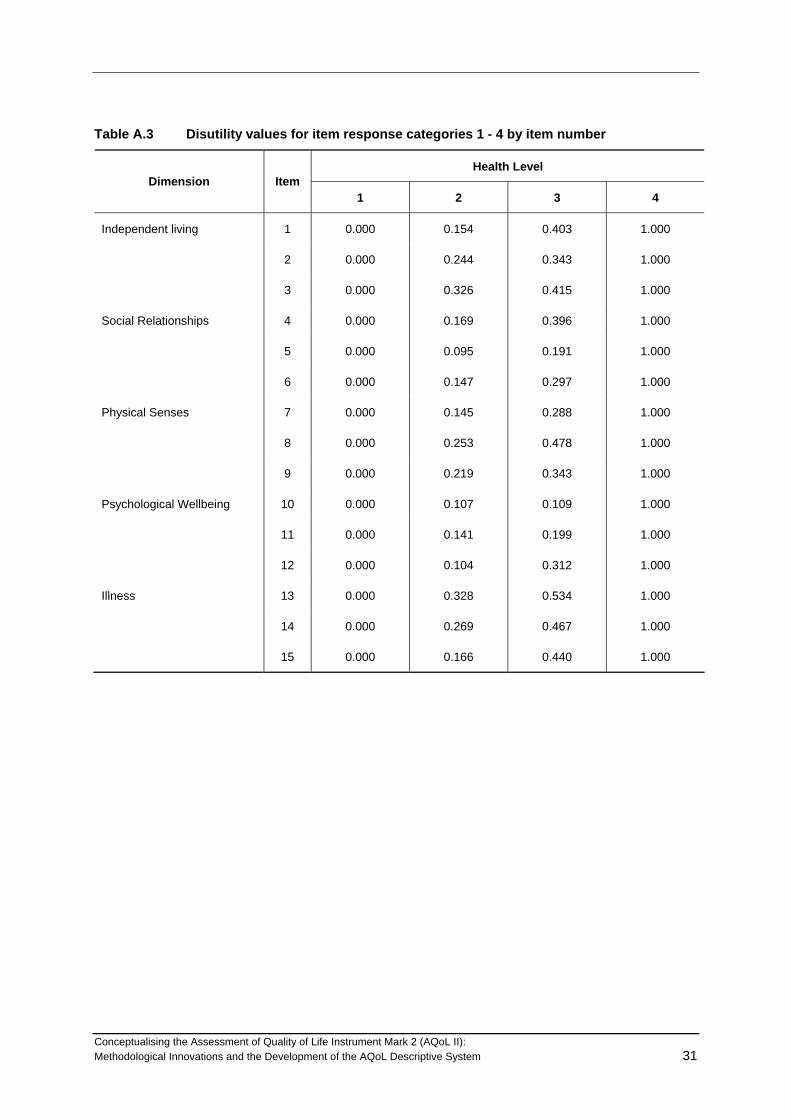
Table A.3 Disutility values for item response categories 1 - 4 by item number
Health Level Dimension Item
1 2 3 4
Independent living 1 0.000 0.154 0.403 1.000
2 0.000 0.244 0.343 1.000
3 0.000 0.326 0.415 1.000
Social Relationships 4 0.000 0.169 0.396 1.000
5 0.000 0.095 0.191 1.000
6 0.000 0.147 0.297 1.000
Physical Senses 7 0.000 0.145 0.288 1.000
8 0.000 0.253 0.478 1.000
9 0.000 0.219 0.343 1.000
Psychological Wellbeing 10 0.000 0.107 0.109 1.000
11 0.000 0.141 0.199 1.000
12 0.000 0.104 0.312 1.000
Illness 13 0.000 0.328 0.534 1.000
14 0.000 0.269 0.467 1.000
15 0.000 0.166 0.440 1.000
Conceptualising the Assessment of Quality of Life Instrument Mark 2 (AQoL II): Methodological Innovations and the Development of the AQoL Descriptive System 31
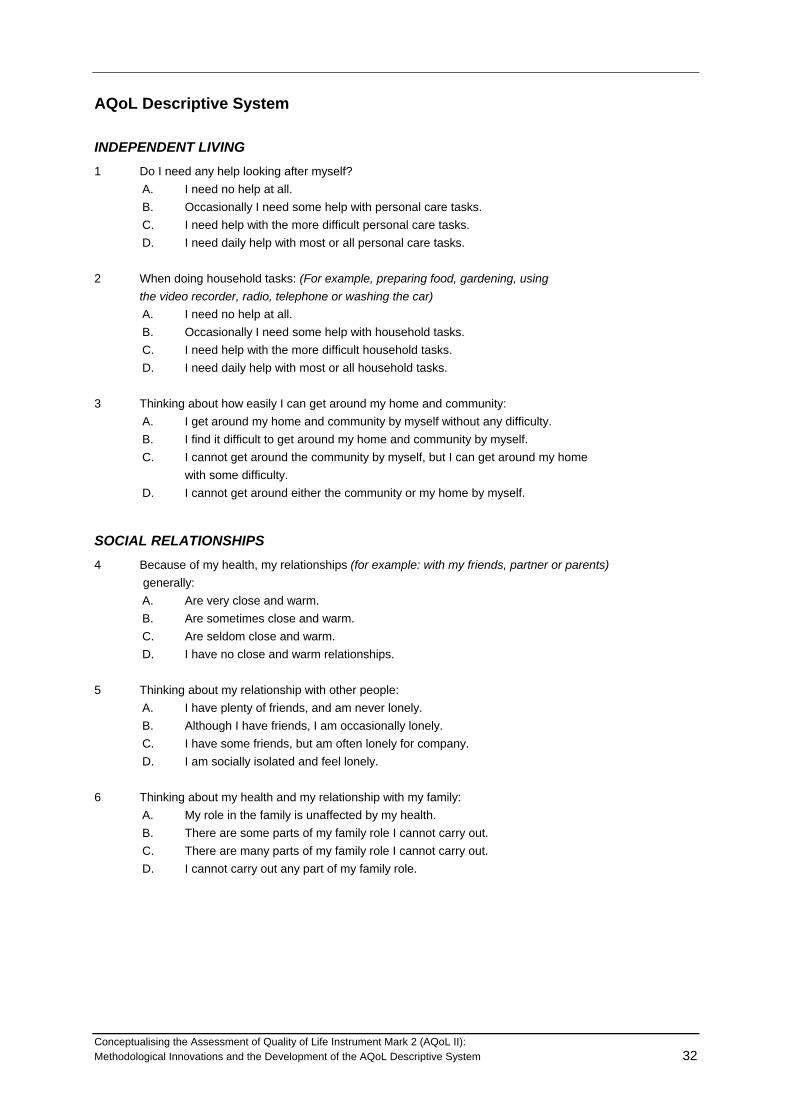
AQoL Descriptive System
INDEPENDENT LIVING 1 Do I need any help looking after myself?
A. I need no help at all. B. Occasionally I need some help with personal care tasks. C. I need help with the more difficult personal care tasks. D. I need daily help with most or all personal care tasks.
2 When doing household tasks: (For example, preparing food, gardening, using the video recorder, radio, telephone or washing the car)
A. I need no help at all. B. Occasionally I need some help with household tasks. C. I need help with the more difficult household tasks. D. I need daily help with most or all household tasks.
3 Thinking about how easily I can get around my home and community:
A. I get around my home and community by myself without any difficulty. B. I find it difficult to get around my home and community by myself. C. I cannot get around the community by myself, but I can get around my home with some difficulty. D. I cannot get around either the community or my home by myself.
SOCIAL RELATIONSHIPS 4 Because of my health, my relationships (for example: with my friends, partner or parents) generally:
A. Are very close and warm. B. Are sometimes close and warm. C. Are seldom close and warm. D. I have no close and warm relationships.
5 Thinking about my relationship with other people:
A. I have plenty of friends, and am never lonely. B. Although I have friends, I am occasionally lonely. C. I have some friends, but am often lonely for company. D. I am socially isolated and feel lonely.
6 Thinking about my health and my relationship with my family:
A. My role in the family is unaffected by my health. B. There are some parts of my family role I cannot carry out. C. There are many parts of my family role I cannot carry out. D. I cannot carry out any part of my family role.
Conceptualising the Assessment of Quality of Life Instrument Mark 2 (AQoL II): Methodological Innovations and the Development of the AQoL Descriptive System 32

PHYSICAL SENSES 7 Thinking about my vision, including when using my glasses or contact lenses if needed:
A. I see normally. B. I have some difficulty focusing on things, or I do not see them sharply. For example: small print, a newspaper, or seeing objects in the distance. C. I have a lot of difficulty seeing things. My vision is blurred. For example: I can see just enough to get by with. D. I only see general shapes, or am blind. For example: I need a guide to move around.
8 Thinking about my hearing, including using my hearing aid if needed:
A. I hear normally. B. I have some difficulty hearing or I do not hear clearly. For example: I ask people to speak up, or turn up the TV or radio volume. C. I have difficulty hearing things clearly. For example: Often I do not understand what is said. I
usually do not take part in conversations because I cannot hear what is said. D. I hear very little indeed. For example: I cannot fully understand loud voices speaking directly to me.
9 When I communicate with others: (For example: by talking, listening, writing or signing)
A. I have no trouble speaking to them or understanding what they are saying. B. I have some difficulty being understood by people who do not know me. I have no trouble understanding what others are saying to me. C. I am only understood by people who know me well. I have great trouble understanding what others are saying to me. D. I cannot adequately communicate with others.
PSYCHOLOGICAL WELL-BEING
10 If I think about how I sleep: A. I am able to sleep without difficulty most of the time. B. My sleep is interrupted some of the time, but I am usually able to go back to sleep without difficulty. C. My sleep is interrupted most nights, but I am usually able to go back to sleep without difficulty. D. I sleep in short bursts only. I am awake most of the night.
11 Thinking about how I generally feel: A. I do not feel anxious, worried or depressed. B. I am slightly anxious, worried or depressed. C. I feel moderately anxious, worried or depressed. D. I am extremely anxious, worried or depressed.
12 How much pain or discomfort do I experience? A. None at all. B. I have moderate pain. C. I suffer from severe pain. D. I suffer unbearable pain.
Conceptualising the Assessment of Quality of Life Instrument Mark 2 (AQoL II): Methodological Innovations and the Development of the AQoL Descriptive System 33

ILLNESS 13 Concerning my use of prescribed medicines:
A. I do not or rarely use any medicines at all. B. I use one or two medicinal drugs regularly. C. I need to use three or four medicinal drugs regularly. D. I use five or more medicinal drugs regularly.
14 To what extent do I rely on medicines or a medical aid? (NOT glasses or a hearing aid.) (For example: walking frame, wheelchair, prosthesis etc.)
A. I do not use any medicines and/or medical aids. B. I occasionally use medicines and/or medical aids. C. I regularly use medicines and/or medical aids. D. I have to constantly take medicines or use a medical aid.
15 Do I need regular medical treatment from a doctor or other health professional?
A. I do not need regular medical treatment. B. Although I have some regular medical treatment, I am not dependent on this. C. I am dependent on having regular medical treatment. D. My life is dependent upon regular medical treatment.
Conceptualising the Assessment of Quality of Life Instrument Mark 2 (AQoL II): Methodological Innovations and the Development of the AQoL Descriptive System 34

Appendix 3 AQoL 2 Descriptive System
How to answer
Please read the Explanatory Statement and sign a consent form before you begin.
Each question has two parts. You answer the first part by ticking the box next to the response that best fits your situation. The second part of each question is a horizontal scale. You mark a cross somewhere along the scale to show how your quality of life is affected by the situation you describe in your answer to the first part of the question. Look at the example answer for more information.
How does this affect my quality of life?
totally ruinedgreatly improved no effect either way
Example answer
Mr Smith’s relationships with his family make him generally happy, so he marks the second box from the top to show his answer :
i) My relationships with my family make me:
very happy generally happy neither happy nor unhappy generally unhappy very unhappy this question is not relevant to me..
Mr Smith feels his quality - of - life is greatly improved by the fact that his relationships with his family make him “generally happy”, so he marks a cross on the left hand end of the scale.
i)
very happy generally happy generally unhappy very unhappy this question is not relevant to me..
Mr Smith feels his quality - of - life is greatly improved by the fact that his relationships with his family make him “generally happy”, so he marks a cross on the left hand end
When you finish answering all the questions, please hand the questionnaire back. Many thanks!
Conceptualising the Assessment of Quality of Life Instrument Mark 2 (AQoL II): Methodological Innovations and the Development of the AQoL Descriptive System 35
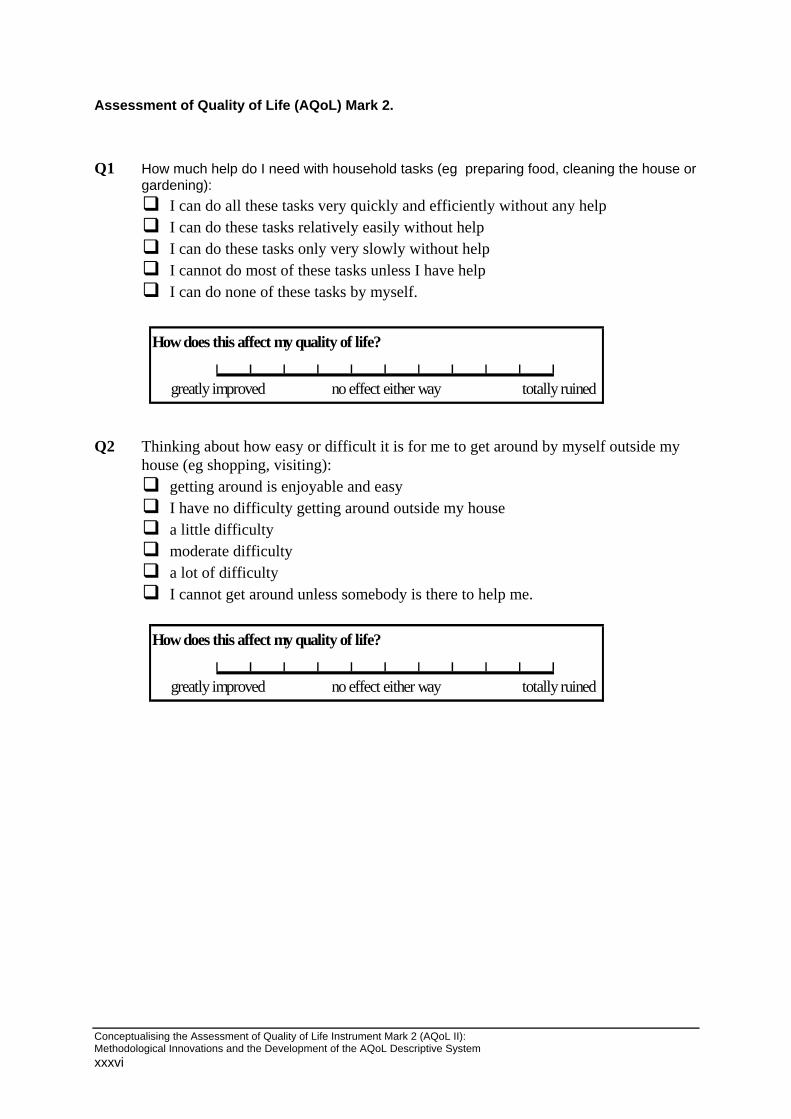
Assessment of Quality of Life (AQoL) Mark 2.
Q1 How much help do I need with household tasks (eg preparing food, cleaning the house or
gardening): I can do all these tasks very quickly and efficiently without any help I can do these tasks relatively easily without help I can do these tasks only very slowly without help I cannot do most of these tasks unless I have help I can do none of these tasks by myself.
How does this affect my quality of life?
totally ruinedgreatly improved no effect either way
Q2 Thinking about how easy or difficult it is for me to get around by myself outside my
house (eg shopping, visiting): getting around is enjoyable and easy I have no difficulty getting around outside my house a little difficulty moderate difficulty a lot of difficulty I cannot get around unless somebody is there to help me.
How does this affect my quality of life?
totally ruinedgreatly improved no effect either way
Conceptualising the Assessment of Quality of Life Instrument Mark 2 (AQoL II): Methodological Innovations and the Development of the AQoL Descriptive System xxxvi
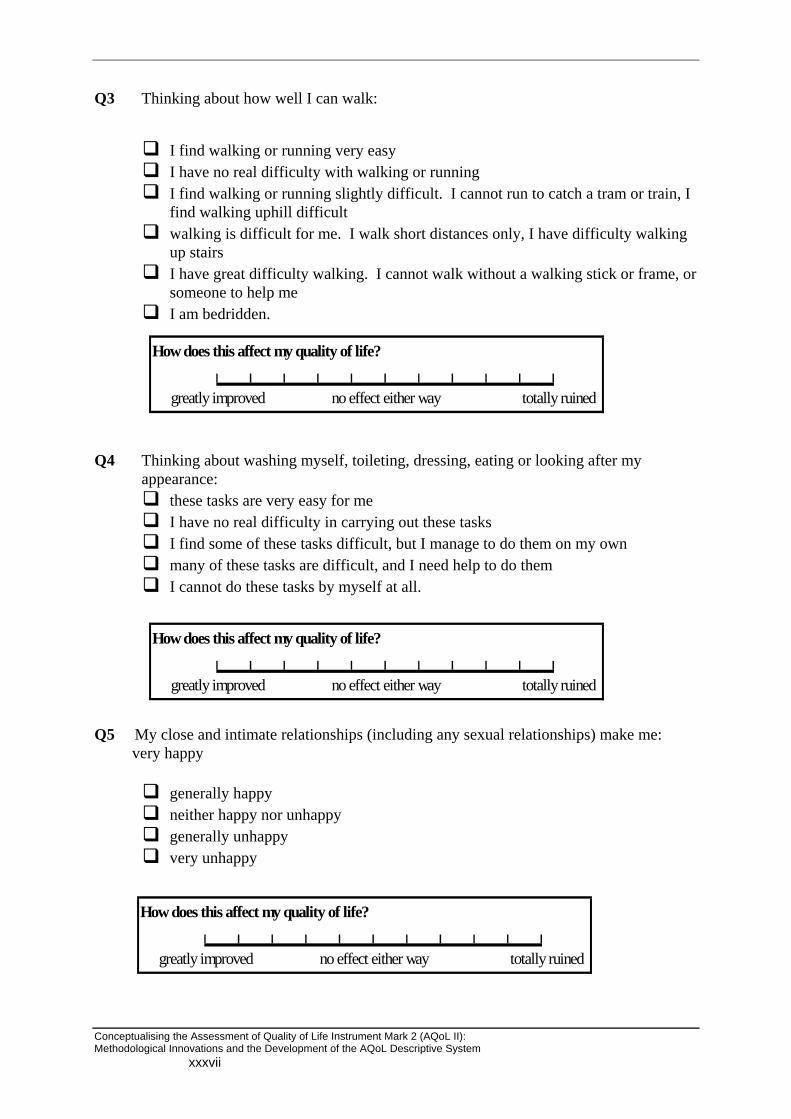
Q3 Thinking about how well I can walk:
I find walking or running very easy I have no real difficulty with walking or running I find walking or running slightly difficult. I cannot run to catch a tram or train, I
find walking uphill difficult walking is difficult for me. I walk short distances only, I have difficulty walking
up stairs I have great difficulty walking. I cannot walk without a walking stick or frame, or
someone to help me I am bedridden.
How does this affect my quality of life?
totally ruinedgreatly improved no effect either way
Q4 Thinking about washing myself, toileting, dressing, eating or looking after my
appearance: these tasks are very easy for me I have no real difficulty in carrying out these tasks I find some of these tasks difficult, but I manage to do them on my own many of these tasks are difficult, and I need help to do them I cannot do these tasks by myself at all.
How does this affect my quality of life?
totally ruinedgreatly improved no effect either way
Q5 My close and intimate relationships (including any sexual relationships) make me:
very happy
generally happy neither happy nor unhappy generally unhappy very unhappy
How does this affect my quality of life?
totally ruinedgreatly improved no effect either way
Conceptualising the Assessment of Quality of Life Instrument Mark 2 (AQoL II): Methodological Innovations and the Development of the AQoL Descriptive System xxxvii

Q6 Thinking about my health and my relationship with my family: my role in the family is unaffected by my health there are some parts of my family role I cannot carry out there are many parts of my family role I cannot carry out I cannot carry out any part of my family role.
How does this affect my quality of life?
totally ruinedgreatly improved no effect either way
Q7 Thinking about my health and my role in my community (that is to say
neighbourhood, sporting, work, church or cultural groups): my role in the community is unaffected by my health there are some parts of my community role I cannot carry out there are many parts of my community role I cannot carry out I cannot carry out any part of my community role.
How does this affect my quality of life?
totally ruinedgreatly improved no effect either way
Q8 How often did I feel in despair over the last seven days?
never occasionally sometimes often all the time.
How does this affect my quality of life?
totally ruinedgreatly improved no effect either way
Conceptualising the Assessment of Quality of Life Instrument Mark 2 (AQoL II): Methodological Innovations and the Development of the AQoL Descriptive System xxxviii
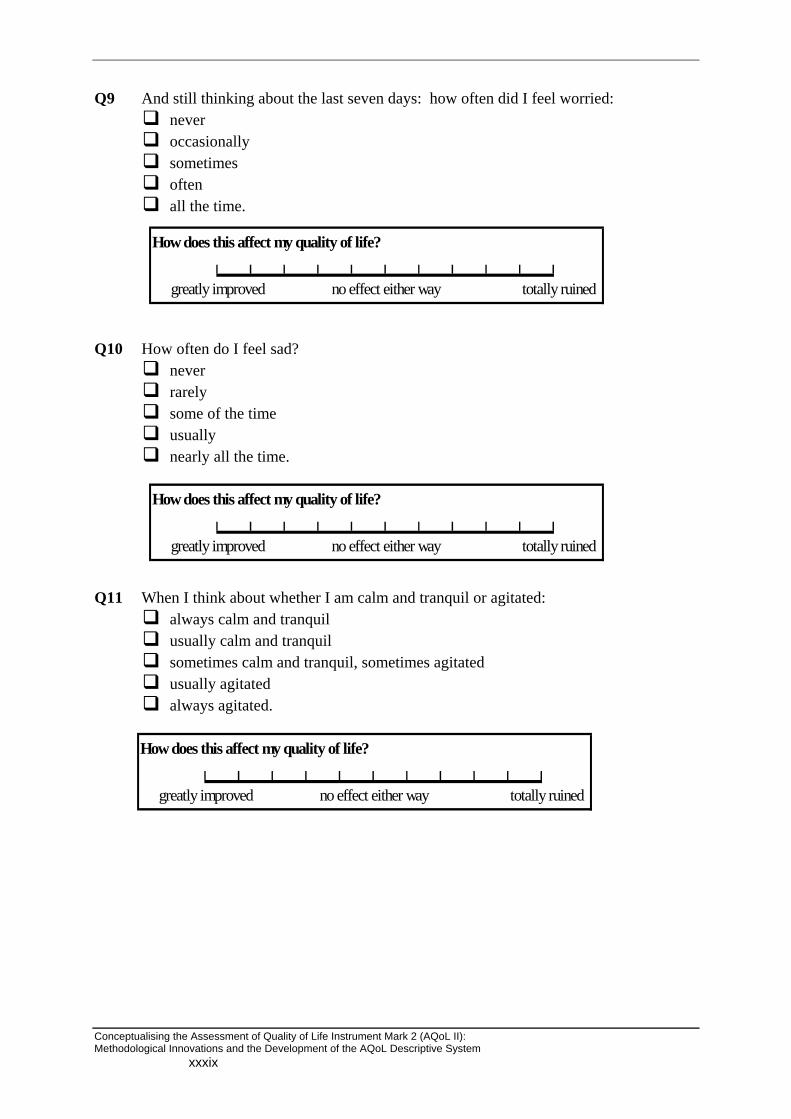
Q9 And still thinking about the last seven days: how often did I feel worried: never occasionally sometimes often all the time.
How does this affect my quality of life?
totally ruinedgreatly improved no effect either way
Q10 How often do I feel sad?
never rarely some of the time usually nearly all the time.
How does this affect my quality of life?
totally ruinedgreatly improved no effect either way
Q11 When I think about whether I am calm and tranquil or agitated: always calm and tranquil usually calm and tranquil sometimes calm and tranquil, sometimes agitated usually agitated always agitated.
How does this affect my quality of life?
totally ruinedgreatly improved no effect either way
Conceptualising the Assessment of Quality of Life Instrument Mark 2 (AQoL II): Methodological Innovations and the Development of the AQoL Descriptive System xxxix

Q12 Thinking about how much energy I have to do the things I want to do, I am: always full of energy usually full of energy occasionally energetic usually tired and lacking energy always tired and lacking energy.
How does this affect my quality of life?
totally ruinedgreatly improved no effect either way
Q13 How often do I feel in control of my life?
always mostly sometimes only occasionally never.
How does this affect my quality of life?
totally ruinedgreatly improved no effect either way
Q14 How much do I feel I can cope with life’s problems?
completely mostly partly very little not at all.
How does this affect my quality of life?
totally ruinedgreatly improved no effect either way
Conceptualising the Assessment of Quality of Life Instrument Mark 2 (AQoL II): Methodological Innovations and the Development of the AQoL Descriptive System xl
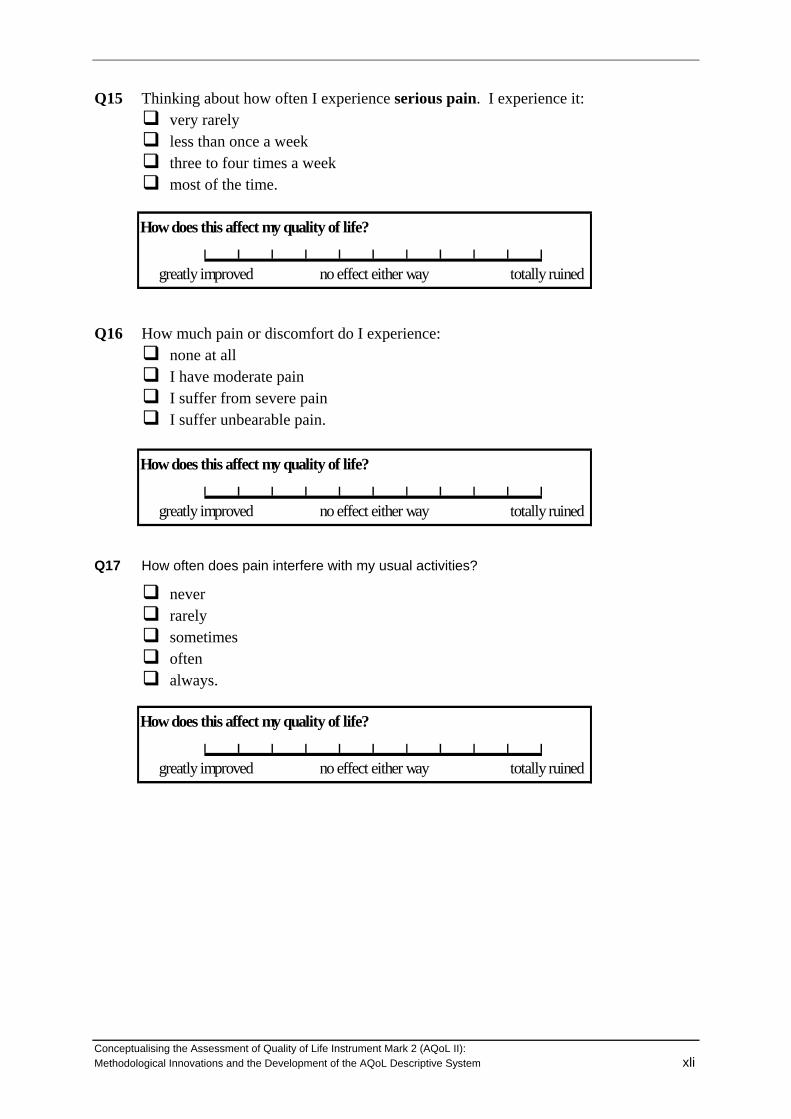
Q15 Thinking about how often I experience serious pain. I experience it: very rarely less than once a week three to four times a week most of the time.
How does this affect my quality of life?
totally ruinedgreatly improved no effect either way
Q16 How much pain or discomfort do I experience:
none at all I have moderate pain I suffer from severe pain I suffer unbearable pain.
How does this affect my quality of life?
totally ruinedgreatly improved no effect either way
Q17 How often does pain interfere with my usual activities?
never rarely sometimes often always.
How does this affect my quality of life?
totally ruinedgreatly improved no effect either way
Conceptualising the Assessment of Quality of Life Instrument Mark 2 (AQoL II): Methodological Innovations and the Development of the AQoL Descriptive System xli

Q18 Thinking about my vision (using my glasses or contact lenses if needed): I have excellent sight I see normally I have some difficulty focusing on things, or I do not see them sharply. E.g. small
print, a newspaper or seeing objects in the distance. I have a lot of difficulty seeing things. My vision is blurred. I can see just
enough to get by with. I only see general shapes. I need a guide to move around I am completely blind.
How does this affect my quality of life?
totally ruinedgreatly improved no effect either way
Q19 Thinking about my hearing (using my hearing aid if needed):
I have excellent hearing I hear normally I have some difficulty hearing or I do not hear clearly. I have trouble hearing
softly-spoken people or when there is background noise. I have difficulty hearing things clearly. Often I do not understand what is said. I
usually do not take part in conversations because I cannot hear what is said. I hear very little indeed. I cannot fully understand loud voices speaking directly
to me. I am completely deaf.
How does this affect my quality of life?
totally ruinedgreatly improved no effect either way
Q20 When I communicate with others, e.g. by talking, listening, writing or signing:
I have no trouble speaking to them or understanding what they are saying I have some difficulty being understood by people who do not know me. I have
no trouble understanding what others are saying to me. I am understood only by people who know me well. I have great trouble
understanding what others are saying to me. I cannot adequately communicate with others.
How does this affect my quality of life?
totally ruinedgreatly improved no effect either way
Conceptualising the Assessment of Quality of Life Instrument Mark 2 (AQoL II): Methodological Innovations and the Development of the AQoL Descriptive System xlii

Conceptualising the Assessment of Quality of Life Instrument Mark 2 (AQoL II): Methodological Innovations and the Development of the AQoL Descriptive System xliii
AQoL Study Background Questions
Please tick one box per question.
21. Are you:
male female
22. In what year were you born? 19____
23. Where were you born?
Australia Other country? Which one? ____________
24. Is English your first language?
yes no Specify: ____________
25. What is your highest level of education?
primary schooling only secondary schooling completed secondary schooling not completed. How many years completed? ___ trade qualification or TAFE: Specify course: _____________ University or other tertiary study Other or not applicable: please describe: ______________________
26. Which best describes your work situation: (Tick as many boxes as apply)
full-time: self-employed or employee part-time: self-employed or employee unemployed, seeking work working in the home / home duties retired student other: please describe: ____________________
IF YOU ARE EMPLOYED OR SELF-EMPLOYED OR SEEKING WORK: 27. What is your occupation? _________________________________ 28. What do you do in your job? _________________________________

Conceptualising the Assessment of Quality of Life Instrument Mark 2 (AQoL II): Methodological Innovations and the Development of the AQoL Descriptive System xliv
29. Do you receive any Government pension or benefit?
no yes Which pension(s) or benefit(s): ___________________
30. Are you:
married or living with a partner single: never married single: widowed single: divorced or separated
31. How would you rate your current level of health, for someone of your age?
excellent very good good fair poor very poor extremely poor
32. Mark one box on the scale to show how important or unimportant is religion or spirituality is in your life
very
important
important unimportant very unimportant
33. Please mark one box to show your HOUSEHOLD income, either annually, monthly or weekly. Include income that comes to the household from all sources. You may estimate either before or after tax.
yearly monthly fortnightly weekly
under $20,000 under $1,665 under $800 under $385
$20,001-$30,000 $1,665-$2,500 $800-$1,155 $385-$575
$30,001-$40,000 $2,501-$3,330 $1,156-$1,535 $576-$770
$40,001-$50,000 $3,331-$4,165 $1,536-$1,925 $771-$960
$50,001-$60,000 $4,166-$5,000 $1,926-$2,305 $961-$1,155
$60,001-$80,000 $5,001-$6665 $2,306-$3,075 $1,156-$1,540
more than $80,000 more than $6665 more than $3,075 more than $1,540
Conceptualising the Assessment of Quality of Life Instrument Mark 2 (AQoL II): Methodological Innovations and the Development of the AQoL Descriptive System xlv
34. Please mark a box to show whether your answer is before or after tax. before tax after tax
Thank you! Please bring this questionnaire with you when you attend the group session/interview.