centrica annual report 2007
TRANSCRIPT

Annual Report and Accounts 2007

wesourceitwegenerateitweprocessitwestoreitwetradeitwesaveitwesupplyitweserviceit
01
Directors’ R
eport – Business R
eviewD
irectors’ Report – G
overnanceFinancial S
tatements
Shareholder Inform
ationCentrica plc Annual Report and Accounts 2007
07 Directors’ Report – Business Review08 Chief Executive’s Review14 Key Performance Indicators16 Operating Review23 Group Financial Review25 Principal Risks and Uncertainties28 Corporate Responsibility Review
01 Our vision02 At a glance04 Financial Highlights05 Chairman’s Statement
33 Directors’ Report – Governance34 Board of Directors and Executive team36 Corporate Governance Report41 Other Statutory Information
42 Remuneration Report
52 Independent Auditors’ Report
53 Financial Statements58 Notes to the Financial Statements140 Company Balance Sheet141 Notes to the Company Balance Sheet147 Gas and Liquid Reserves148 Five Year Record
149 Shareholder InformationIBC Index
DisclaimersThis Report does not constitute an invitation to underwrite, subscribe for, or otherwise acquire or dispose of any Centrica shares. This Report contains certain forward-looking statements with respect to the financial condition, results, operations and businesses of Centrica plc. These statements and forecasts involve risk and uncertainty because they relate to events anddepend on circumstances that will occur in the future. There are a number of factors that couldcause actual results or developments to differ materially from those expressed or implied by theseforward-looking statements or forecasts. Past performance is no guide to future performance andpersons needing advice should consult an independent financial adviser.
Our vision
To view our Annual Report online go to: www.centrica.com/reports2007
Our vision is to be a leading integratedenergy company in our chosen markets.
We are energy experts. We source,generate, process, store, trade, save and supply energy and provide a range of related services.
We have strong brands and distinctive skills which we use to achieve success in our chosen markets of the UK, North America and Europe, and for thebenefit of our employees, our customersand our shareholders.

At a glance
02
Our businesses
Centrica plc Annual Report and Accounts 2007
British Gas ResidentialWe are the biggest energy supplier in Britain’s domestic market.Operating under our British Gas brand (Scottish Gas in Scotland),we had 16 million gas and electricity customer accounts at theend of 2007.
British Gas BusinessWe are Britain’s leading supplier of energy to businesses,dedicated to the needs of small to medium-sized customersthrough to large industrial and commercial users. We offer a range of options from open tariffs to fixed price contracts.
British Gas ServicesWe are Britain’s largest operator in the installation andmaintenance of domestic central heating and gas appliancesemploying more than 9,000 engineers. We also providecomprehensive maintenance and breakdown services for electrical white goods, home wiring and, through ourDyno brand, drains, plumbing and home security services.
Our downstream business delivered 88% of our Group revenue^,51% of our operating profit^*, and employed 95% of our workforcein 2007. It:3 supplies energy to homes and to businesses; and3 provides home and energy services.
Downstream businesses include:3 British Gas;3 Direct Energy in North America; and3 retail operations in Europe.
Our upstream business delivered 12% of our Group revenue^, 49% of our operating profit^*, and employed 5% of ourworkforce in 2007. It:3 generates electricity and produces gas; and3 buys, stores and sells energy internationally.
Upstream businesses include:3 Centrica Energy in the UK, Norway, Nigeria and Trinidad;3 Centrica Storage in the UK;3 Direct Energy in North America; and3 assets and trading operations in Europe.
Centrica’s main operations are in the UK, North America and Europe. We have two types of business – downstream and upstream.
www.britishgas.co.uk
www.britishgasbusiness.co.uk
www.britishgas.co.uk
British Gas New EnergyWe launched British Gas New Energy as a separate business inApril 2007 to supply the growing UK market for low-carbon andenergy efficient products and services. Already we have launchedtwo industry-leading green energy tariffs and begun to supply and install a range of microgeneration technologies including solarthermal, wind turbines and ground source heat pumps. We remainthe largest provider of energy efficiency products, such as loft andcavity wall insulation, in the UK.
We work with other parts of British Gas utilising their skills and resources to help deliver our business objectives.
www.britishgas.co.uk
£6.5bnRevenue^
£571mOperating profit^*
9,200Employees
16mCustomer accounts
£1.3bnRevenue^
£151mOperating profit^*
15,200Employees
7.6mCustomer accounts
£2.4bnRevenue^
£120mOperating profit^*
2,000Employees
954,000Customer supply points
34Employees
17.3mEnergy efficiency productsprovided to UK households

Centrica EnergyWe source gas and electricity from our own production andfrom third parties, mainly to supply British Gas Residential. OurMorecambe gas fields can supply around 6% of the UK’s peakday gas demand; we produce approximately 67% of our peakdomestic demand for our electricity customers from our sevengas-fired power stations and major contracts; and we areexpecting to invest up to £1.5 billion in renewable assets overthe next few years.
03
Directors’ R
eport – Business R
eviewD
irectors’ Report – G
overnanceFinancial S
tatements
Shareholder Inform
ationCentrica plc Annual Report and Accounts 2007
25%Revenue inNorth America
73%Revenuein the UK
2%Revenue in Europe
Centrica StorageOur Rough storage facility is the largest in the UK. It consists of a partially depleted gas field under the North Sea, supportedby a gas processing terminal at Easington, which we also manage.In October 2006 Centrica Storage began operating an adjacentterminal receiving Norwegian gas from the world’s longestunderwater pipeline.
Direct EnergyWe provide energy and energy-related services to residential and business customers in Texas and the north and east of theUnited States, as well as across Canada. We own and operateapproximately 3,000 natural gas wells in Alberta while in Texas,we own three gas-fired power plants and have power purchaseagreements totalling 813MW of wind power.
European EnergyWe are involved in power generation, energy management and retail energy supply in Europe, with operations in Belgium,Germany, the Netherlands and Spain.
www.centricaenergy.com www.centrica-sl.co.uk
www.directenergy.com
www.oxxio.nlwww.luminus.bewww.centricaenergia.eswww.centrica-energie.de
The map illustrates how much revenue each of the regionscontributed to the Group’s 2007 total. The UK, our home market,continues to contribute the majority. North American revenues are growing every year (in local currency) and we expect ouroperations here to become even more significant in the future. Our businesses in Europe remain small but we expect to seegrowth once the markets they are in open fully to competition.
^ from continuing operations* including joint ventures and associates, stated net of interest and taxation,
and before exceptional items and certain re-measurements
Our markets and proportion of Group revenue
£4bnRevenue^
£187mOperating profit^*
4,800Employees
5mCustomer accounts
£392mRevenue^
£17mOperating profit^*
200Employees
£1.5bnRevenue^
£663mOperating profit^*
1,100Employees
4.5GWUK electricity generation capacity
£340mRevenue^
£240mOperating profit^*
190Employees
70%UK gas storage capacity

Financial Highlights
04
Our performance
Centrica plc Annual Report and Accounts 2007
12 months ended 31 December 2007 2006
Financial highlights
Group revenue^ £16.3bn £16.4bn
Operating profit^* £1,949m £1,392m
Adjusted basic earnings* per share 30.6p 19.4p
Ordinary dividend per share 13.0p 11.15p
Statutory results
Group revenue^ £16.3bn £16.4bn
Operating profit^ £2,184m £130m
Basic earnings/(loss) per share 41.0p (4.3p)
^ from continuing operations* including joint ventures and associates, stated net of interest and taxation, and before exceptional items and certain re-measurements† excludes special dividend of 25p
10.6 11.3
13.4
16.4 16.3
958
1,949
1,3291,475
1,392
03 04 05 06 07
Operating profit^* (£m)
860
2,184
1,230
1,919
130
03 04 05 06 07
Statutory operatingprofit^ (£m)
5.4
13.0
8.6
10.511.15
03 04† 05 06 07
Dividend per share (pence)
Earnings and operating profit numbers are stated, throughout the commentary, before exceptional items and certain re-measurements where applicable – see note 2 for definitions.The Directors believe this measure assists with a better understanding of the underlying performance of the Group. The equivalent amounts after exceptional items and certainre-measurements are reflected in note 6 and are reconciled at Group level in the Group Income Statement. Certain re-measurements and exceptional items are described in note 8.Adjusted earnings and adjusted basic earnings per share are reconciled to their statutory equivalents in note 13. All current financial results listed are for the 12 months ended 31 December 2007.The Group adopted IFRS with effect from 1January 2005. The comparative data for 2004 has been restated accordingly. IAS 32 and IAS 39 were adopted with effect from 1January 2005, and thecomparative data for 2004 does not reflect the effect of these standards. Amounts in years prior to 2004 are presented in accordance with generally accepted accounting standards (GAAP) in the UKprevailing at the time. Turnover prior to 2004 excludes Accord trading revenue.All references to ‘the prior year’, ‘2006’ and ‘last year’ mean the 12 months ended 31 December 2006 unless otherwise specified.Throughout this Report references to British Gas include Scottish Gas.
First half Second half

British Gas delivered strong financial returns in a year when it alsoreversed the decline in the size of its customer base. This wasachieved not only through lower commodity costs in the first halfbut also through lower pricing, the continued removal of excesscosts, the launch of more innovative propositions and a dedicationto improving customer service. During the year Centrica Energycompleted a gas acquisition in the North Sea and acquiredadditional gas exploration acreage with strong future potential. We continue to look for opportunities to acquire more substantialgas assets.
Our growth businesses performed very strongly in 2007. BritishGas Business and British Gas Services delivered record results,underpinned by ongoing growth in customer numbers. In NorthAmerica, Direct Energy also delivered record profits against the backdrop of a weakening housing market, early signs of aneconomic downturn in the United States and adverse exchangerate movements. It was also another year of record profits inCentrica Storage. In Europe however, while the Commissionremains supportive of real network unbundling, meaningfulprogress on market deregulation was limited.
DividendThe Board is proposing a final dividend of 9.65 pence (2006: 8.0 pence) for payment in June 2008 bringing our full-year dividend to13.0 pence (2006: 11.15 pence). This represents a17% year-on-year increase, in line with our policy andcommitment to sustained real growth in the ordinary dividend.
05
Centrica plc Annual Report and Accounts 2007
Performance reviewCentrica delivered very strong financial results during anotherchallenging year for UK energy retailers.
New pipelines from Norway and the Netherlands, which wereunderpinned by long-term gas contracts with British Gas, began to bring additional gas to the UK and helped to bring down wholesalegas prices at the start of the year. This allowed us to show leadershipin the market by passing reductions in the wholesale price on to our customers by reducing our retail prices in March and April.Unfortunately the spectre of high wholesale energy prices appearedagain in the second half of the year as global oil prices reachedrecord highs and this has continued into the start of 2008. As aresult it was necessary for us to raise customer tariffs in January.
The management team worked diligently through 2007 to minimisethe impact of rising wholesale energy prices, making substantialinroads into the operating cost base of British Gas and extractingefficiencies where possible. At the same time we must continue to invest in high quality energy assets to serve our UK andinternational customers and this reinvestment in our business canonly be funded through the consistent delivery of reasonable andsustainable profits.
In February 2007 Sam Laidlaw clearly set out four priorities forCentrica and I believe that management has made some realprogress against these objectives. Sam reports on this progress in detail in his review of the year.
Chairman’sStatement Securing shareholder value
Directors’ R
eport – Business R
eviewD
irectors’ Report – G
overnanceFinancial S
tatements
Shareholder Inform
ation07
Centrica delivered verystrong financial resultsduring another challengingyear for UK energy retailers.

We will, however, continue to take all possible actions to minimise the impact to our customers whilst delivering the levelof profitability required to underpin the investments necessary tosecure additional high quality upstream assets.
We have set out a clear agenda for Centrica in the form of fourstrategic priorities and we will continue to focus on these as wemove forward. In doing this we will seek to strike the appropriatebalance between driving increased efficiencies in the current core UK energy business, providing growth across the Group and evaluating and securing additional quality upstream assets to reduce exposure to short-term commodity price movements. Only by delivering against our priorities will we be able to satisfy our customers and reward our employees while maximising returnsfor our shareholders.
Roger Carr Chairman 21 February 2008
Chairman’sStatementcontinued
06
Securing shareholder value
Centrica plc Annual Report and Accounts 2007
Board changesEarly in the year we changed the structure of our executivemanagement team, with Phil Bentley assuming the role ofManaging Director of British Gas, Jake Ulrich adding Europe to his responsibilities as Managing Director of our upstream activitiesand Nick Luff joining Centrica from P&O as Group Finance Director.I believe that under the leadership of Sam Laidlaw the team hasalready begun to make a real difference to both the short-termperformance and the long-term prospects of Centrica.
Our employeesIn a business such as Centrica, people are central to the delivery ofbetter service and improving financial results. Our employees haveworked hard to support the change in systems, working practices,organisation structure and management within the Company. I thank them all for their loyalty, hard work and dedication. It is acredit to them that British Gas Business and British Gas Serviceswere both recognised in the Financial Times Top 50 ‘BestWorkplaces for 2007’.
The futureWholesale energy prices remain extremely volatile and the high gas price at the start of 2008 has squeezed retail supply margins in the UK. In these circumstances retail price increases have beennecessary in order to restore reasonable margins.
Go online
Why not manage yourshares online?
Our electronic communicationservice provides fast, easy accessto shareholder information.www.centrica.com/reports2007
Wholesale energy pricesremain extremely volatileand the high gas price at the start of 2008 hassqueezed retail supplymargins in the UK.

07
Directors’ R
eport – Governance
Financial Statem
entsS
hareholder Information
07 Directors’ Report – Business Review08 Chief Executive’s Review14 Key Performance Indicators16 Operating Review23 Group Financial Review25 Principal Risks and Uncertainties28 Corporate Responsibility Review
Directors’ R
eport – Business R
eview

Chief Executive’sReview
08
Delivering our strategy
Centrica plc Annual Report and Accounts 2007
Centrica delivered a very strong set of financial results during this, my first full year as Chief Executive. We moved the structure and operational performance of the business forwards, but we still have some way to go.
2007 was a year of two very different halves. In the first half,wholesale energy prices in the UK were low as a result of increasedsupply (through new gas pipelines and liquefied natural gas (LNG) facilities) and reduced demand due to warm weather. Over two-thirds of our earnings were delivered in this period.
During the second six months, the day ahead wholesale gas price was, on average, 56% higher than during the first half. Thissignificantly reduced margins in our UK residential business. And,unfortunately, these relatively high wholesale prices have persistedin the first few months of 2008, necessitating a retail price increase.
Centrica operates in a complex, global and constantly changingindustry that is facing some profound long-term challenges.Environmental issues will increasingly influence the shape of theindustry. Tougher targets on reducing energy consumption andcutting greenhouse gases are likely to be implemented worldwide,and these will push up the price of energy.
The cost of developing new upstream resources in the UK has risen by 80% since 2000, and growth in demand for fossil fuelsfrom countries such as China and India is also driving a long-termstructural movement towards higher prices. We estimate that by 2015 around 75% of the UK’s total annual gas demand could be being met by imports, compared to about 20% in 2007.Increasing reliance on imports means that the UK, and Centrica, will not be cushioned from the impact of global market movements, either in terms of price fluctuation or security of supply.
Against this background, our strategy is to create an integratedenergy company, operating upstream by developing new sources of gas and power, and downstream with our strong brands andinnovative propositions, to succeed in our chosen markets.
DownstreamThe UK gas market is the biggest in Europe. We are the largestenergy supplier in the UK and at the end of 2007 British GasResidential once again supplied 16 million customers. British GasServices is the largest central heating and gas appliance installationand maintenance company in the UK, directly employing more than
9,000 engineers. British Gas is the country’s best-recognisedenergy brand. It is also one of the greenest, according to WWF and has the lowest carbon intensity* of all major suppliers. We areone of the UK’s largest producers and suppliers of wind energy and in April we set up British Gas New Energy to expand our offer in low-carbon products and services.
In our North American markets, we had over 5 million customers at the end of 2007. The combined volume of demand for our gas in Canada, the US and Europe will help us to do deals withlarge-scale suppliers of LNG worldwide.
Our experience of deregulated markets in the UK and North Americawill also stand us in good stead when European energy marketsfinally open up to competition. The European Commission publishedproposals in September for the unbundling of electricity and gasgeneration and transmission networks across the European Union.When implemented, these should increase competition in Europe.But it hasn’t happened yet.
UpstreamUpstream, we have a strong and increasingly diverse portfolio oflong-term contracts for gas supplies to the UK from the North Sea,Norway and the Netherlands, as well as our own production. These include our Morecambe gas fields, and interests in over 20 southern North Sea gas fields, including those acquired fromNewfield UK Holdings Limited in October.
From October 2008, we will have LNG import capacity at the Isle of Grain which will be able to supply about 6% of Centrica’sannual gas demand. We are building our eighth gas-fired power station(in Devon) and two wind farms off the Lincolnshire coast which willhave a combined capacity of 180MW. We have interests in threeoperational wind farms which provide access to188MW of renewableelectricity and we are seeking consent for a further 250MW farm.
Internationally, offices are now established in Nigeria and Norwayfollowing the award of exploration and production licence blocks. In 2007 we also acquired further exploration blocks in Norway andTrinidad. Direct Energy bid for Rockyview Energy Inc, an Alberta-based oil and gas company, completing the deal in early 2008.
Centrica has four strategic priorities that underpin how we run thebusiness. Over the next four pages I will explain what these meanand how we have performed against them this year.
2007 was a year ofsubstantial achievement for Centrica during which we made further progress on addressing the key priorities for the business.
*carbon intensity is the amount of carbon dioxide emitted per unit of electricity produced

Lower prices and better service led to an increase in the number of customers. This, combined witha fall in commodity prices in thefirst six months, meant we deliveredan excellent financial result.
09
Directors’ R
eport – Business R
eviewD
irectors’ Report – G
overnanceFinancial S
tatements
Shareholder Inform
ationCentrica plc Annual Report and Accounts 2007
Transforming British Gas is a priority because profitability andservice levels at British Gas Residential, which is the core of our business, have historically been low and variable.
The transformation aims to:3 improve our price competitiveness, service levels and product
offer in order to reverse the decline in customer numbers;3 reduce our costs through ‘best-in-class’ efficiency and
productivity while ensuring that we remain a great place to work;and
3 achieve long-term margins of 6-7%.
ProgressWe led the industry in reducing prices, cutting them twice during 2007.In March and April our tariffs were cut by a total of 17% in electricityand by 20% in gas. We also provided the lowest dual fuel tariff throughour online Click Energy offer. However, because of sharply risingwholesale energy prices during the second half of 2007 andcontinuing into 2008, we were left with no alternative but to increaseretail tariffs in January 2008. Although this was disappointing, retailprices were still lower when compared to January 2007. The15%increase will help us to re-establish the profit margin we need toinvest in the core energy assets that will provide sustainablelong-term earnings.
Having completed the migration of all our customers to our newbilling system by March, we concentrated on improving the servicethat had suffered during the migration process. Service levelsimproved significantly. For example, our speed to answer thetelephone improved by almost 75% from the highest point in April and we eliminated the entire correspondence backlog.
As a result, we saw fewer complaints and customer losses. By December 2007, complaints to energywatch had fallen by 80%since April and contacts to energywatch are now at their lowestlevel since January 2006 when we began to move our customers toa new billing system. Customer churn has also fallen sharply, and thenumber of energy accounts grew by around15,000 during the year.
We continued to reduce operating costs within British Gas comparedto 2006. This, combined with a fall in commodity prices in the first six months, meant we delivered an excellent operating profit* for the year.
* including joint ventures and associates stated net of interest and taxation, and before exceptional items and certain re-measurements
Transform British Gas
British Gas Residential customer accounts
3 We led the industry in reducing prices in 20073 We significantly improved our service levels3 We reduced our operating costs by £139 million
British Gas Residential customer accounts in 2007 (m)
16.1
16.0
15.9
15.8
15.7
Jan MarFeb Apr May Jun Jul Aug Sept Oct Nov Dec

Chief Executive’sReviewcontinued
10
Delivering our strategy
Centrica plc Annual Report and Accounts 2007
Sharpen the organisation and reduce costs
Changes to the organisation of the Group have improvedaccountability and increasedbusiness discipline.
cost savings achievedin BGR in 2007
If we are to compete domestically and internationally in the long term,we need to do what we do better, and at lower cost.
We need to upgrade our skills, increase our business discipline and accountability, and materially reduce costs in each business unitand at the centre.
ProgressOver the past year we have strengthened our executive team withseveral key appointments, including a new Group Finance Directorand a new Managing Director for British Gas, and we havetransferred responsibility for our European businesses to theManaging Director of Centrica Energy.
We have also focused on the structure of our operating businesses.Recent initiatives include the separation of power generation inCentrica Energy to form a line of accountability for our UK powersegment. In North America we introduced a new structure with the creation of four business units on functional rather thangeographic lines.
We have also created three separate profit centres within British GasResidential (BGR) to better reflect different customer groups. The new units have different objectives and propositions, and amanagement structure designed to enhance accountability.
Business discipline has been improved through the introduction of systematic quarterly cost reviews of each business unit, a tightercapital allocation framework, and a new three-year planning horizonto focus performance.
And we have reduced costs significantly. For example, therestructuring of British Gas Services has removed £20 million of cost a year, and BGR is on track to deliver its £200 million costreduction target. Some £139 million of cost savings were achievedin BGR in 2007 with the balance to be achieved in 2008. During theyear we moved 2,250 back-office jobs to India and rationalised thecorporate centre. This included outsourcing a number of supportservices including many of the central finance, information systemand human resource functions.
1,000
862939
800
04 05 06 07
British Gas Residentialoperating expenditure (£m)
3 We have strengthened our executive team3 We have introduced new structures for our businesses
in Direct Energy and in British Gas Residential3 We have reduced costs across the Group

11
Directors’ R
eport – Business R
eviewD
irectors’ Report – G
overnanceFinancial S
tatements
Shareholder Inform
ationCentrica plc Annual Report and Accounts 2007
We want to produce more of the energy that we sell. In the UK weare able to supply around 25% of our gas requirements and around67% of our peak electricity requirements from our own resources ormajor contracts. The remainder has to be purchased in notoriouslyvolatile wholesale markets.
We aim to build a profitable UK upstream business to be able tosupply 50% of our gas needs. Our target is to have 35% of our retail load supplied from production capacity we own, and 15% from new long-term contracts.
ProgressIn October 2007 we bought Newfield UK Holdings Limited for £242 million. This brought us a producing gas field, twodevelopment prospects and interests in six licences with thepotential to add around 300 billion cubic feet (bcf) of gas reserves in the North Sea. The location of the fields also offers synergies with our retail businesses in western Europe, with gas from one of the fields delivered in the Netherlands. We added a further 43bcfof gas reserves by acquiring Rockyview Energy Inc in Alberta,announced in November and completed in February 2008.
We also acquired interests in licences in Norway and Trinidadbringing our total at the end of the year to19. From the winter of 2010/11, we will have access to a further 2.4 billion cubic metres(BCM) of LNG import capacity at the Isle of Grain terminal inaddition to the 3.4BCM we have available from October 2008.
Construction continues on our 885MW power station at Langage in Devon which will increase our UK generation capacity to over5GW. It will come online early in 2009. We have also continued toinvest in wind generation capacity. We acquired a 50% share in the Braes of Doune wind farm in Stirlingshire in July and concludeda new170MW power purchase agreement in Texas that brings to813MW our total power offtake from Texas wind farms. Constructionwork started on the180MW Lynn and Inner Dowsing farms off thecoast of Lincolnshire. Lynn and Inner Dowsing is currently theworld’s largest offshore wind construction project and first power is due towards the end of 2008.
Overall we have 430MW of offshore wind projects in construction or early planning stages, which will keep us at the forefront ofrenewable generation.
Reduce risk through integration
We made some important progressduring the year, though not asmuch as we had hoped for.
planned annual upstream investment 2007 to 2010
3 We bought Newfield UK Holdings Limited3 We acquired exploration opportunities in the UK, Norway and Trinidad3 We continued to invest in renewable generation capacity3 We are building a new gas-fired power station in Devon
Centrica’s UK electricity generation (MW)
5,000
4,000
3,000
2,000
1,000
0 Jan 01 Dec 07

Chief Executive’sReviewcontinued
12
Delivering our strategy
Centrica plc Annual Report and Accounts 2007
Centrica’s growth businesses in the UK, North America and Europe have considerable potential for increasing the Group’sprofitability, and they made strong progress during 2007. In addition,we are focusing on new opportunities to provide low-carbon productsand services to customers concerned about climate change.
ProgressBritish Gas Business delivered record profitability, a growingcustomer base and improving levels of customer satisfaction; while in British Gas Services, account numbers grew by 7% andoperating profits* by 48% as service levels improved dramatically.
We continued to strengthen our Direct Energy business in North America, which was restructured, delivering the targeted cost reductions. It also grew its operating profit^* by more than15% before exchange rate movements, despite increasedcompetitive pressures and a weaker US housing market thataffected the residential and services businesses. We improved the balance of the business too, with one of its four sectors moving into profit for the first time and another doubling its contribution.
Ahead of the European Union becoming a fully competitive energy market, we are aiming to build a gas and power business in north western Europe. In 2007, our operating profits in Europemore than doubled, we established SPE-Luminus as theundisputed number two player in Belgium in the electricity andgas market, and we added 500,000 customer accounts in thenewly liberalised Walloon part of the market.
In April we created a new business unit, British Gas New Energy(BGNE). British Gas is already a noted force in the supply of ‘green’electricity and appliances in the UK. BGNE is therefore well placedto operate successfully in the low-carbon market that is expectedto grow exponentially in the coming years.
In a related move in North America, we formed a new group in the upstream and wholesale energy business to focus solely oncarbon and renewables. Direct Energy also launched its first carbonneutral product as part of its successful market entry into BritishColumbia. This has since been extended across Canada.
^ from continuing operations* including joint ventures and associates stated net of interest and taxation,
and before exceptional items and certain re-measurements
Build on our growth platforms
We intend to grow businessesorganically and through acquisition,driving top and bottom line growth.
new customer product holdings in British Gas Services
120
87
0706
151
102
187173
British GasBusiness
British GasServices
Direct Energyexcluding Income Fund
0706 0706
Operating profit^* (£m)
3 We increased profits considerably in all growth businesses3 We strengthened our positions in North America and Europe3 We launched British Gas New Energy to focus on low-carbon
products and services

13
Directors’ R
eport – Business R
eviewD
irectors’ Report – G
overnanceFinancial S
tatements
Shareholder Inform
ationCentrica plc Annual Report and Accounts 2007
During 2008, we will continue to focus our efforts on the fourpriorities that I set in 2007.
Transforming British Gas Our critical short-term priority will be continued focus on our serviceto customers while delivering sustainable returns. Longer term, we believe that for all energy suppliers to substantially improvecustomer service will require a nationwide investment in smartmetering technology.
We will remove an additional £60 million of operating cost and willinvest in the British Gas brand to rebuild its relevance to consumersnot only as a provider of energy but of energy efficiency advice and services.
Cutting costsWe are making cost reduction central to our business culture.
We will continue to identify and re-engineer outdated processesand procedures with the aim of becoming the most efficient energysupplier with the lowest cost per customer.
We will also introduce new trading and logistic systems intoCentrica Energy to better support our asset portfolio anddownstream businesses, phased over 2008 and 2009.
Strengthening our asset baseWith wholesale energy costs still volatile, the importance of getting more of our gas and power from our own resources cannotbe overestimated. Our acquisition of the Newfield gas propertiesand the investments we are making in both renewables and gas-fired power generation are important steps in the right direction butwe need to do more. This will be a key strategic priority in 2008.
We will need to continue pursuing power generation and gas assetopportunities both in the UK and internationally. But we will alsoassess opportunities in gas storage and develop our gas explorationprospects in the UK, Norway, Nigeria and Trinidad.
We will increase our involvement in LNG, where our aim is to becomethe downstream partner of choice for the oil companies who own therights to the vast majority of the world’s undeveloped gas resources.
Longer term we will also evaluate carefully the opportunity to participatein the replacement of the UK’s fleet of nuclear power stations.
Looking to growOur growth businesses are contributing well to the Group, but thereare opportunities for them to do even better, and we will continue to drive both top and bottom line improvement in these areas.
In the UK, in British Gas Business we will seek to maintain ourcurrent growth trajectory through ongoing development of our routes to market while focusing also on further enhancing theservice we deliver.
British Gas Services is developing additional customer propositionsto make more rapid progress in the on-demand markets. Improvingthe links between British Gas Residential, British Gas Services andBGNE will enable us to make better use of our assets and to developnew revenue by offering customers more cross-business packages.
BGNE will become increasingly important in 2008 with growingcustomer concern about energy efficiency and the positive effectthat this can have on climate change. In January we announced a stronger contractual relationship with Ceres Power on thedevelopment of a domestic combined heat and power boiler usingground-breaking fuel cell technology, supported by a £20 millionequity investment. We will seek to identify more ways of facilitatingthe move towards a low-carbon society while keeping the BritishGas name at the forefront.
In North America there is real potential to grow our business bothorganically and through acquisition in our existing markets andgeographies. Short-term prospects will be affected by the depthand length of any economic downturn but we will seek to minimisethe impact through the increasing diversity of our business streams.
Developing our businesses in Europe remains challenging. Thisyear we will concentrate on simplifying the ownership structure ofSPE in Belgium as the merger of Suez and Gaz de France proceeds.We will also continue to grow our Belgian, Dutch and Spanishbusinesses, and to establish ourselves firmly in the industrial andcommercial market in Germany.
In summary, we will be following the same path in 2008 as we have in 2007, guided by the same priorities that we have laid down.The UK market faces high wholesale energy prices which appear to be taking their lead from the oil-linked gas markets of continentalEurope and our other markets are feeling the effects of weakeningeconomic conditions. In this environment it is important that we remain single-minded in making our operations leaner and more efficient to give us the best chance of success in the UK and internationally.
Centrica is a strong business with a clear sense of direction and themomentum to make the best of its unique strengths. I am confidentthat we will be able to take significant strides in 2008.
Sam LaidlawChief Executive21 February 2008
Key PerformanceIndicators
14
Measuring our performance
Centrica plc Annual Report and Accounts 2007
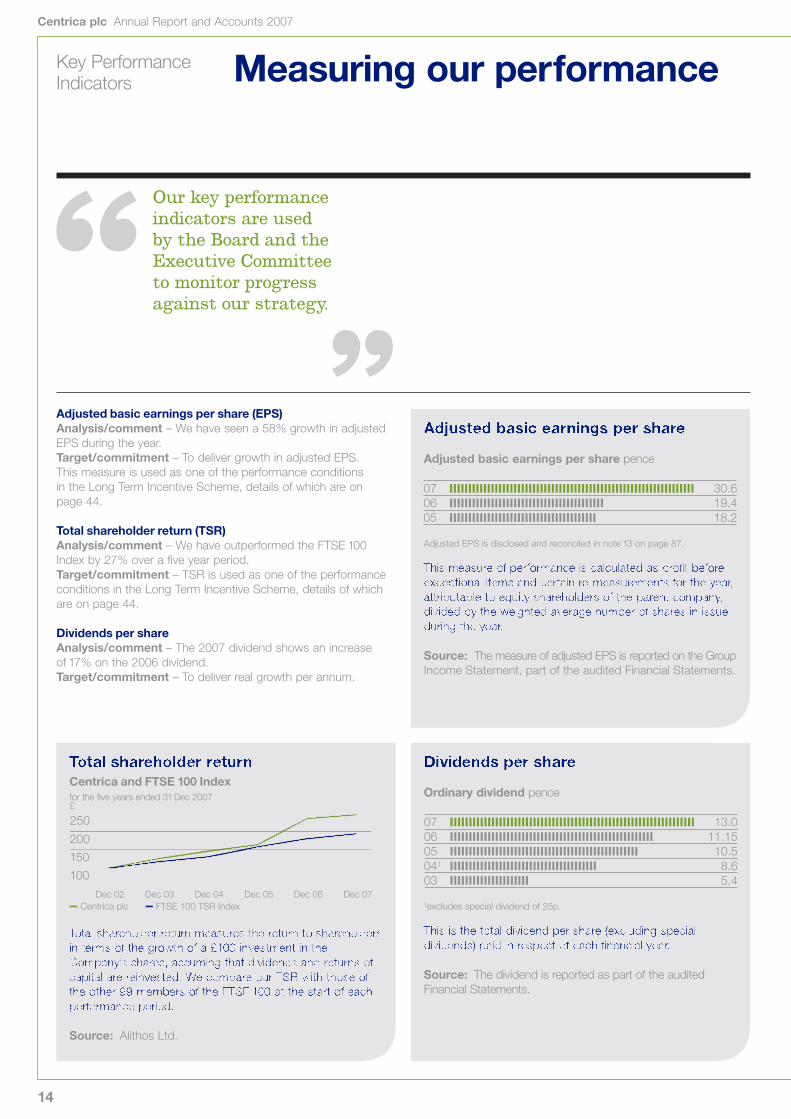
Adjusted basic earnings per share
Adjusted basic earnings per share pence
Adjusted EPS is disclosed and reconciled in note 13 on page 87.
This measure of performance is calculated as profit beforeexceptional items and certain re-measurements for the year,attributable to equity shareholders of the parent company,divided by the weighted average number of shares in issueduring the year.
Source: The measure of adjusted EPS is reported on the GroupIncome Statement, part of the audited Financial Statements.
Total shareholder returnCentrica and FTSE 100 Indexfor the five years ended 31 Dec 2007
Total shareholder return measures the return to shareholdersin terms of the growth of a £100 investment in theCompany’s shares, assuming that dividends and returns ofcapital are reinvested. We compare our TSR with those ofthe other 99 members of the FTSE 100 at the start of eachperformance period.
Source: Alithos Ltd.
Dividends per share
Ordinary dividend pence
†excludes special dividend of 25p.
This is the total dividend per share (excluding specialdividends) paid in respect of each financial year.
Source: The dividend is reported as part of the auditedFinancial Statements.
Adjusted basic earnings per share (EPS)Analysis/comment – We have seen a 58% growth in adjusted EPS during the year.Target/commitment – To deliver growth in adjusted EPS. This measure is used as one of the performance conditions in the Long Term Incentive Scheme, details of which are on page 44.
Total shareholder return (TSR)Analysis/comment – We have outperformed the FTSE 100Index by 27% over a five year period.Target/commitment – TSR is used as one of the performanceconditions in the Long Term Incentive Scheme, details of whichare on page 44.
Dividends per shareAnalysis/comment – The 2007 dividend shows an increase of 17% on the 2006 dividend.Target/commitment – To deliver real growth per annum.
Centrica plcDec 02 Dec 03 Dec 04 Dec 05 Dec 06 Dec 07
FTSE 100 TSR Index
250
150
200
100
£
070605
30.619.418.2
07060504†
03
13.011.15
10.58.65.4
Our key performanceindicators are used by the Board and theExecutive Committee to monitor progress against our strategy.

15
Directors’ R
eport – Business R
eviewD
irectors’ Report – G
overnanceFinancial S
tatements
Shareholder Inform
ationCentrica plc Annual Report and Accounts 2007
Key highlights
+58%Increase in adjusted earnings per share up from 19.4p to 30.6p
27%Our TSR outperformed the FTSE 100 by 27% over the last five years
13.0pDividend per share up by 17% to 13.0p
Employee engagement
Engagement score
The Centrica employee survey measures engagement andcommitment levels for every team at all levels across theGroup. The overall engagement score reflects the attitudesand opinions of our employees and measures, on a scaleof one to five, their feelings about working for us.
Source: The survey is managed by an external supplier.
Carbon intensity of UK power generation
394g* CO2/kWhCarbon intensity measures the volume of carbon dioxide(CO2) emitted per unit of electricity generated. We arecommitted to maintaining this leadership position byinvesting in low-carbon generation such as high-efficiencygas-fired power stations and offshore wind farms.
Source: Based on verified emissions data under the requirements of the EU Emissions Trading Scheme.
Customer satisfaction
Net promoter score 2007
Net promoter score (NPS) is a measure of customeradvocacy. It shows the percentage of customers who wouldrecommend us, minus the percentage who would not.
The British Gas and Direct Energy NPS are combinedfigures for the residential, business and services divisions.
Source: Internal calculations based on NPS performance for 12 months ending 31December 2007.
Customer satisfactionAnalysis/comment – There was a low 2007 NPS score for BritishGas Residential, reflecting the 2007 customer service challenges. Target/commitment – Continued focus on our service tocustomers will remain a critical short-term priority. We will look toimprove on our 2007 scores in both the UK and North America.
Carbon intensityAnalysis/comment – The carbon intensity of the power wegenerate for our British Gas customers is already significantlylower than the other five major UK suppliers.Target/commitment – To reduce our UK power generationcarbon intensity to 380g* CO2/kWh by 2012.
Employee engagementAnalysis/comment – Our 2007 engagement score showed a year-on-year increase of 3% with 84% employee participation. Target/commitment – In 2008 we will change how we measureemployee engagement, and begin to measure the percentage of employees who are committed to Centrica.
070605
3.963.843.78
3.1%British Gas
6.1%Direct Energy
*Carbon intensity figures are based on the average annual emissionsfrom all wholly owned UK power generation assets and all other powergeneration assets from which Centrica is entitled to output under sitespecific contracts in the UK.

Operating Review
16
British Gas Residential
Centrica plc Annual Report and Accounts 2007
British Gas ResidentialWe reorganised the business to improveaccountability and performance
We stabilised customer accounts at16 million
We increased our operating profit* by £476 million
British Gas Residential has around 16 million customeraccounts in the UK, and is the country’s largest supplier of both gas and electricity to residential customers. We are also playing a leading role in providing customers with low-carbon products.
British Gas ResidentialPerformance indicatorsFor the period ended 31 December 2007 2006 ∆%
Customer numbers (period end)Residential gas (’000) 10,018 10,263 (2.4)Residential electricity (’000) 6,019 5,759 4.5Total (’000) 16,037 16,022 0.1Estimated market share (%)Residential gas^ 46.4 47.9 (1.5)pptsResidential electricity^ 22.4 21.6 0.8pptsAverage consumptionResidential gas (therms) 541 569 (4.9)Residential electricity (kWh) 3,945 4,069 (3.0)Total consumptionResidential gas (mmth) 5,443 6,120 (11)Residential electricity (GWh) 23,001 23,842 (3.5)Transportation & distribution costs (£m)Residential gas 1,172 1,110 6Residential electricity 541 511 6Total 1,713 1,621 6Energy Efficiency Commitment (£m)EEC 91 90 1.1Operating costs (£m)British Gas Residential 800 939 (15)Revenue (£m)Residential gas 4,296 4,832 (11)Residential electricity 2,161 2,280 (5)Total 6,457 7,112 (9)Operating profit (£m)*British Gas Residential 571 95 501Operating margin (%)British Gas Residential 8.8 1.3 7.5ppts
∆% has been used to express ‘percentage change’.
* including joint ventures and associates stated net of interest and taxation, and beforeexceptional items and certain re-measurements.
^ Market shares for 2006 are based on a gas market size of 21,403,959 and an electricitymarket size of 26,695,229, as stated by Ofgem in its Domestic Market Retail Report –March 2006.Market shares for 2007 are based on a gas market size of 21,567,261 and an electricity marketsize of 26,917,561, as stated by Ofgem in its Domestic Market Retail Report – June 2007.
Overall 2007 was a strong year for British Gas as we delivered an excellent financial result, with margins above our long-runexpectations. We also made considerable progress in improvingcustomer service and stabilising the size of our customer base.
The commodity price environment during the year was extremelyvolatile, with a fall in wholesale gas prices early in the year leading to a rapid expansion in margins and enabling British Gas to be thefirst energy supplier to announce reduced prices for customers. In March we lowered prices for credit customers in gas by17% and in electricity by 11% and followed this up in April with a further3% reduction in gas prices and 6% in electricity prices. However,wholesale gas and power prices rose through the second half of theyear and squeezed margins in this period to just above breakeven.
The quality of our customer service had suffered through 2006 and into the early part of 2007 as we migrated all of our customersto a new billing system. Since completing this migration operationalexceptions have been running at a higher level. We have continuedto improve the data quality in our systems and have focused on theoverall service levels we provide to our customers. In the secondhalf of the year we improved the time taken to answer inboundcustomer telephone calls by 75% from its highest point in April and we eliminated the entire backlog of customer email and writtencorrespondence. The results of our improving service were reflectedin the level of customer complaints to energywatch which had fallenfrom the high point in April by over 80% by December.
Our more competitive pricing and the improvements we have madeto customer service helped us to stabilise our customer base in 2007.From a low point in April of 15.8 million energy accounts we havereturned once again to serving just over 16 million accounts.
As part of the transformation of British Gas we have improvedaccountability for the customer experience and the operatingperformance by reorganising into three separate lines of business.This resulted in the creation of a dedicated ‘pay as you go’ businessto focus directly on customers who use prepayment meters, where fundamentally different processes are required. We have also split the remaining business between the lower volumecustomers and those who make up the highest value segment.
Revenue for the year decreased by 9% to £6,457 million (2006: £7,112 million) due to lower average customer numbersacross the year and lower average energy consumption levels as a result of unusually warm weather, particularly in the early part of the year.Operating profit* however increased to £571million(2006: £95 million) with the majority delivered in the first half of theyear, £533 million (2006: a loss of £143 million). This was due tolower commodity costs and lower controllable operating costs.
Commodity costs were down by just over £1billion to £3.2 billion,more than offsetting the revenue reduction. This net benefit waspartially offset by the ongoing increases in energy transportationand distribution costs which were up by £92 million over 2006. The cost of delivering our Energy Efficiency Commitment (EEC) inthe year was £91million (2006: £90 million). As EEC is a mandatorycost of supply for all the major UK energy suppliers we now account for this cost within cost of goods rather than operating expensesand have restated the comparable figures for 2006 accordingly.

17
British Gas BusinessBritish Gas Services
Directors’ R
eport – Business R
eviewD
irectors’ Report – G
overnanceFinancial S
tatements
Shareholder Inform
ationCentrica plc Annual Report and Accounts 2007
Operating costs decreased by £139 million to £800 million (2006:£939 million). While we continued our drive to reduce costs therewas a delay in this reduction in 2007 as we placed an even greaterpriority on the improvement in customer service. We expect to remove an additional £60 million of operating costs in 2008,achieving the full £200 million of targeted savings against the 2006 baseline.
British Gas BusinessWe continued to have high contract renewal rates
We increased the number of customer supplypoints by more than 2%
We increased our operating margins
British Gas Business sells gas, electricity and energy-relatedservices – including carbon-offsetting – to small, mediumand large corporate businesses. The introduction of ourdedicated account managers has helped to improve levels of customer service.
British Gas Business performed well during the year. Against a backdrop of volatility in commodity markets we delivered a record financial result and grew our customer base whilecontinuing to improve our customer satisfaction measures.
Revenue increased by 6% to £2,431million (2006: £2,303 million)due to the net positive impact of price changes during 2006 and2007, higher customer numbers in both fuels and higher averageconsumption in electricity driven by the increase in the number of large corporate customers. This was only partially offset by the lower average consumption in gas which resulted from warmweather primarily in the first half of the year. Customer supply pointnumbers increased by 2% to 954,000 (2006: 932,000) on strongsales performance and the maintenance of high contract renewalrates particularly in our SME business.
Operating profit* was up 38% to £120 million (2006: £87 million).This included a contribution of £38 million (2006: £29 million) from a favourable historic electricity procurement contract. This contractwill also provide a small benefit in 2008 before it expires. The primarydrivers of the year-on-year uplift were the widening of marginsduring the contract renewal process and the positive effect of thelower commodity prices on the tariff book. These positive impactson gross margin enabled us to lift operating margins in the year to 4.9% (2006: 3.8%).
In customer service we are beginning to see positive results fromour implementation of a differentiated service model based ondedicated account managers. During the year, while migrating the majority of our gas customer accounts to our new gas billingsystem, we improved the level of customer satisfaction across the business.
British Gas ServicesWe increased our operating profit* by 48%
We delivered improved levels of customer service
British Gas Services is the largest domestic central heating and gas appliance installation and maintenancecompany in the UK. We directly employ more than 9,000engineers who also provide comprehensive maintenanceand breakdown services for electrical white goods andhome wiring. Our Dyno brand provides plumbing, drains and home security services across the UK.
British Gas Services performed strongly in 2007 both financially and operationally. This was supported by the improvements madeto customer service, engineer deployment and system stability,which provide us with a strong platform for continued growth.
British Gas BusinessPerformance indicatorsFor the period ended 31 December 2007 2006 ∆%
Customer supply points (period end)Gas (’000) 412 400 3.0Electricity (’000) 542 532 1.9Total (’000) 954 932 2.4Average consumptionGas (therms) 3,729 4,015 (7)Electricity (kWh) 32,644 30,464 7Total consumptionGas (mmth) 1,524 1,597 (4.6)Electricity (GWh) 17,356 15,864 9Transportation & distribution costs (£m)Gas 174 149 17Electricity 298 261 14Total 472 410 15Revenue (£m)Gas 1,037 1,115 (7)Electricity 1,394 1,188 17Total 2,431 2,303 6Operating profit (£m)*British Gas Business 120 87 38Operating margin (%)British Gas Business 4.9 3.8 1.1ppts
∆% has been used to express ‘percentage change’.
* including joint ventures and associates stated net of interest and taxation, and beforeexceptional items and certain re-measurements.
Operating Reviewcontinued
18
Centrica plc Annual Report and Accounts 2007
British Gas ServicesCentrica Energy
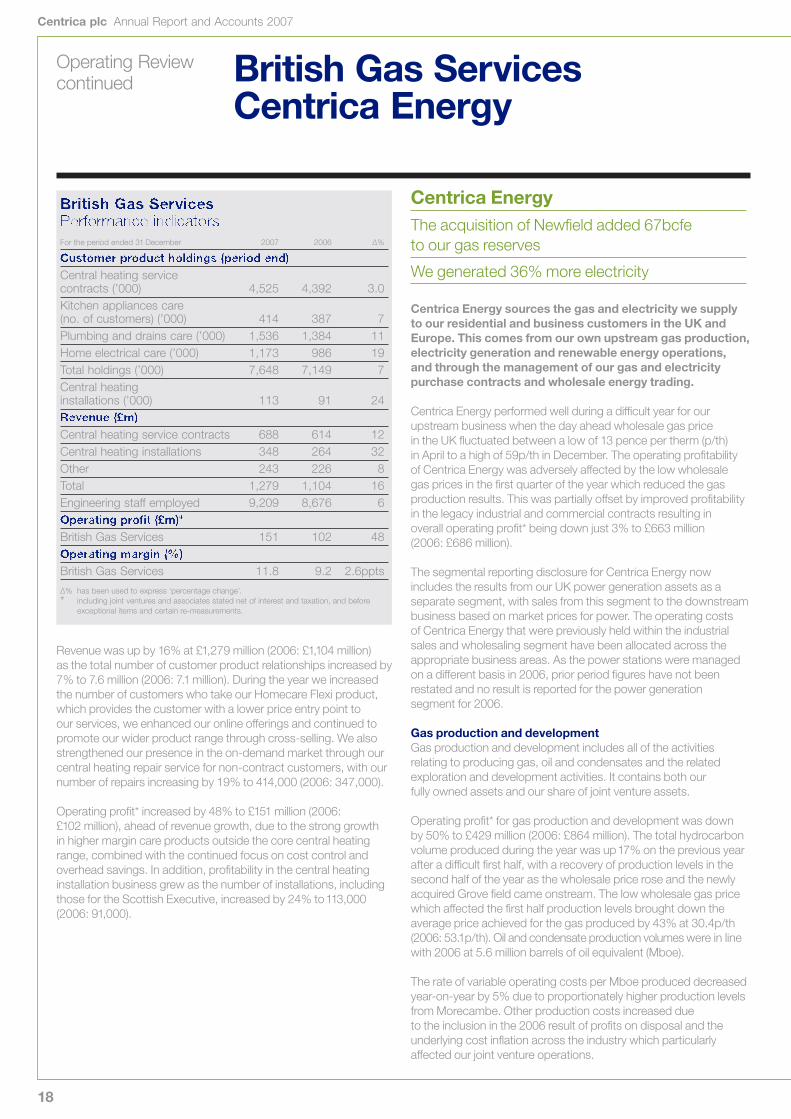
Revenue was up by 16% at £1,279 million (2006: £1,104 million) as the total number of customer product relationships increased by7% to 7.6 million (2006: 7.1 million). During the year we increasedthe number of customers who take our Homecare Flexi product,which provides the customer with a lower price entry point to our services, we enhanced our online offerings and continued topromote our wider product range through cross-selling. We alsostrengthened our presence in the on-demand market through ourcentral heating repair service for non-contract customers, with ournumber of repairs increasing by 19% to 414,000 (2006: 347,000).
Operating profit* increased by 48% to £151 million (2006: £102 million), ahead of revenue growth, due to the strong growth in higher margin care products outside the core central heatingrange, combined with the continued focus on cost control andoverhead savings. In addition, profitability in the central heatinginstallation business grew as the number of installations, includingthose for the Scottish Executive, increased by 24% to113,000(2006: 91,000).
British Gas ServicesPerformance indicatorsFor the period ended 31 December 2007 2006 ∆%
Customer product holdings (period end)Central heating service contracts (’000) 4,525 4,392 3.0Kitchen appliances care (no. of customers) (’000) 414 387 7Plumbing and drains care (’000) 1,536 1,384 11Home electrical care (’000) 1,173 986 19Total holdings (’000) 7,648 7,149 7Central heating installations (’000) 113 91 24Revenue (£m)Central heating service contracts 688 614 12Central heating installations 348 264 32Other 243 226 8Total 1,279 1,104 16Engineering staff employed 9,209 8,676 6Operating profit (£m)*British Gas Services 151 102 48Operating margin (%)British Gas Services 11.8 9.2 2.6ppts
∆% has been used to express ‘percentage change’.* including joint ventures and associates stated net of interest and taxation, and before
exceptional items and certain re-measurements.
Centrica EnergyThe acquisition of Newfield added 67bcfe to our gas reserves
We generated 36% more electricity
Centrica Energy sources the gas and electricity we supplyto our residential and business customers in the UK andEurope. This comes from our own upstream gas production,electricity generation and renewable energy operations, and through the management of our gas and electricitypurchase contracts and wholesale energy trading.
Centrica Energy performed well during a difficult year for ourupstream business when the day ahead wholesale gas price in the UK fluctuated between a low of 13 pence per therm (p/th) in April to a high of 59p/th in December. The operating profitability of Centrica Energy was adversely affected by the low wholesale gas prices in the first quarter of the year which reduced the gasproduction results. This was partially offset by improved profitabilityin the legacy industrial and commercial contracts resulting in overall operating profit* being down just 3% to £663 million (2006: £686 million).
The segmental reporting disclosure for Centrica Energy nowincludes the results from our UK power generation assets as aseparate segment, with sales from this segment to the downstreambusiness based on market prices for power. The operating costs of Centrica Energy that were previously held within the industrialsales and wholesaling segment have been allocated across theappropriate business areas. As the power stations were managedon a different basis in 2006, prior period figures have not beenrestated and no result is reported for the power generation segment for 2006.
Gas production and developmentGas production and development includes all of the activitiesrelating to producing gas, oil and condensates and the relatedexploration and development activities. It contains both our fully owned assets and our share of joint venture assets.
Operating profit* for gas production and development was down by 50% to £429 million (2006: £864 million). The total hydrocarbonvolume produced during the year was up17% on the previous yearafter a difficult first half, with a recovery of production levels in thesecond half of the year as the wholesale price rose and the newlyacquired Grove field came onstream. The low wholesale gas pricewhich affected the first half production levels brought down theaverage price achieved for the gas produced by 43% at 30.4p/th(2006: 53.1p/th). Oil and condensate production volumes were in linewith 2006 at 5.6 million barrels of oil equivalent (Mboe).
The rate of variable operating costs per Mboe produced decreasedyear-on-year by 5% due to proportionately higher production levelsfrom Morecambe. Other production costs increased due to the inclusion in the 2006 result of profits on disposal and theunderlying cost inflation across the industry which particularlyaffected our joint venture operations.
19
Directors’ R
eport – Business R
eviewD
irectors’ Report – G
overnanceFinancial S
tatements
Shareholder Inform
ationCentrica plc Annual Report and Accounts 2007
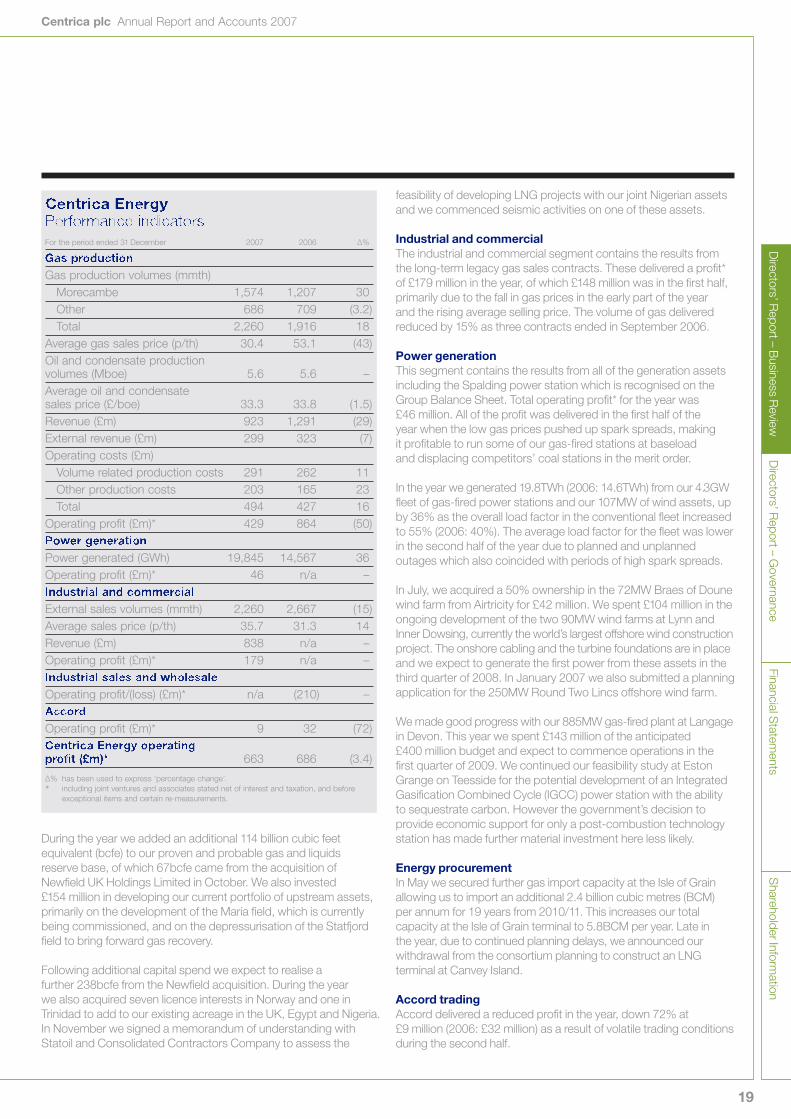
During the year we added an additional 114 billion cubic feetequivalent (bcfe) to our proven and probable gas and liquids reserve base, of which 67bcfe came from the acquisition of Newfield UK Holdings Limited in October. We also invested £154 million in developing our current portfolio of upstream assets,primarily on the development of the Maria field, which is currentlybeing commissioned, and on the depressurisation of the Statfjordfield to bring forward gas recovery.
Following additional capital spend we expect to realise a further 238bcfe from the Newfield acquisition. During the year we also acquired seven licence interests in Norway and one inTrinidad to add to our existing acreage in the UK, Egypt and Nigeria. In November we signed a memorandum of understanding withStatoil and Consolidated Contractors Company to assess the
Centrica EnergyPerformance indicatorsFor the period ended 31 December 2007 2006 ∆%
Gas productionGas production volumes (mmth)
Morecambe 1,574 1,207 30Other 686 709 (3.2)Total 2,260 1,916 18
Average gas sales price (p/th) 30.4 53.1 (43)Oil and condensate production volumes (Mboe) 5.6 5.6 –Average oil and condensate sales price (£/boe) 33.3 33.8 (1.5)Revenue (£m) 923 1,291 (29)External revenue (£m) 299 323 (7)Operating costs (£m)
Volume related production costs 291 262 11Other production costs 203 165 23Total 494 427 16
Operating profit (£m)* 429 864 (50)Power generationPower generated (GWh) 19,845 14,567 36Operating profit (£m)* 46 n/a –Industrial and commercialExternal sales volumes (mmth) 2,260 2,667 (15)Average sales price (p/th) 35.7 31.3 14Revenue (£m) 838 n/a –Operating profit (£m)* 179 n/a –Industrial sales and wholesaleOperating profit/(loss) (£m)* n/a (210) –AccordOperating profit (£m)* 9 32 (72)Centrica Energy operatingprofit (£m)* 663 686 (3.4)
∆% has been used to express ‘percentage change’.
* including joint ventures and associates stated net of interest and taxation, and beforeexceptional items and certain re-measurements.
feasibility of developing LNG projects with our joint Nigerian assetsand we commenced seismic activities on one of these assets.
Industrial and commercial The industrial and commercial segment contains the results fromthe long-term legacy gas sales contracts. These delivered a profit*of £179 million in the year, of which £148 million was in the first half,primarily due to the fall in gas prices in the early part of the year and the rising average selling price. The volume of gas deliveredreduced by 15% as three contracts ended in September 2006.
Power generationThis segment contains the results from all of the generation assetsincluding the Spalding power station which is recognised on theGroup Balance Sheet. Total operating profit* for the year was £46 million. All of the profit was delivered in the first half of the year when the low gas prices pushed up spark spreads, making it profitable to run some of our gas-fired stations at baseload and displacing competitors’ coal stations in the merit order.
In the year we generated 19.8TWh (2006: 14.6TWh) from our 4.3GWfleet of gas-fired power stations and our 107MW of wind assets, upby 36% as the overall load factor in the conventional fleet increasedto 55% (2006: 40%). The average load factor for the fleet was lowerin the second half of the year due to planned and unplannedoutages which also coincided with periods of high spark spreads.
In July, we acquired a 50% ownership in the 72MW Braes of Dounewind farm from Airtricity for £42 million. We spent £104 million in theongoing development of the two 90MW wind farms at Lynn andInner Dowsing, currently the world’s largest offshore wind constructionproject. The onshore cabling and the turbine foundations are in placeand we expect to generate the first power from these assets in thethird quarter of 2008. In January 2007 we also submitted a planningapplication for the 250MW Round Two Lincs offshore wind farm.
We made good progress with our 885MW gas-fired plant at Langagein Devon. This year we spent £143 million of the anticipated £400 million budget and expect to commence operations in the first quarter of 2009. We continued our feasibility study at EstonGrange on Teesside for the potential development of an IntegratedGasification Combined Cycle (IGCC) power station with the abilityto sequestrate carbon. However the government’s decision toprovide economic support for only a post-combustion technologystation has made further material investment here less likely.
Energy procurementIn May we secured further gas import capacity at the Isle of Grainallowing us to import an additional 2.4 billion cubic metres (BCM) per annum for 19 years from 2010/11. This increases our totalcapacity at the Isle of Grain terminal to 5.8BCM per year. Late in the year, due to continued planning delays, we announced ourwithdrawal from the consortium planning to construct an LNGterminal at Canvey Island.
Accord tradingAccord delivered a reduced profit in the year, down 72% at £9 million (2006: £32 million) as a result of volatile trading conditionsduring the second half.

Operating Review continued
20
Centrica plc Annual Report and Accounts 2007
Centrica StorageWe delivered strong financial results
We launched a new virtual storage product
Centrica Storage owns and operates the UK’s largest gasstorage facility. We sell gas storage and other services to a wide range of gas market participants includingCentrica Energy.
Centrica Storage delivered a strong financial and operational result,reporting a record operating profit* of £240 million (2006: £228million). This improvement reflects both the increase in the averageStandard Bundled Unit (SBU) price for the year, up1.6% to 57.4 pence(2006: 56.5 pence) driven by a wider spread between summer andwinter forward gas prices, and the continued growth in non-SBUrevenue. A subsequent narrowing of the summer/winter gas pricespread reduced the average SBU price for the 2007/08 storageyear to 53.4 pence (2006/07: 65.6 pence).
Ongoing investment in Rough to improve its injection and withdrawalcapabilities enabled us both to continue to sell significant volumesof additional space, 172 million therms (mmth) in 2007 (2006:157mmth), and generate additional revenue, particularly from thenew virtual storage product, V Store. Launched in May 2007 thisproduct has the equivalent rights to an SBU but delivery of gas isguaranteed to the National Balancing Point. This guarantee meantthat this product sold at a substantial premium to the price of an SBU.
Operationally the Rough field performed well, delivering injectionand production availability of more than 98%. This was achievedwhilst also securing and improving our health and safetyperformance. A recent review undertaken by the Health and SafetyExecutive, into systems to ensure asset integrity, placed Rough in the top quartile of all North Sea installations surveyed.
Centrica StoragePerformance indicatorsFor the period ended 31 December 2007 2006 ∆%
Average SBU price (calendar year) (pence) 57.4 56.5 1.6Revenue (£m)Standard SBUs 261 254 2.8Extra space 28 30 (7)Gas sales 77 58 33Other 37 16 131Total 403 358 13External turnover (£m) 340 294 16Cost of gas (£m) 87 58 50Operating profit (£m)* 240 228 5
∆% has been used to express ‘percentage change’.
* including joint ventures and associates stated net of interest and taxation, and beforeexceptional items and certain re-measurements.
Direct EnergyWe delivered another successive year of profit growth*
We made continued progress on diversification of the business
Our Direct Energy brand is one of North America’s largestenergy and energy service providers, with over 5 millionresidential and business customers in Canada and the US.We own and operate gas reserves in Canada, and electricitygeneration capacity in Texas.
Direct Energy performed well during a year in which we continued to develop our activities beyond the mass markets energy supplyoperations. We also restructured the business into four pan-NorthAmerican lines of business. This enables greater focus on key groupsof customers to drive growth and efficiencies of scale throughshared operations.
Due to changes during the year in the relationship with The Consumers’ Waterheater Income Fund, which are explained in more detail under Discontinued Operations on page 22, the decision was taken to deconsolidate the Fund’s results with effect from1December 2007. This commentary covers the results of the remaining Direct Energy operations.
Excluding the negative impact of exchange rate movements, Direct Energy delivered top and bottom line underlying growth. The reported results were adversely impacted by the weakness of the US dollar against sterling through the year and, to a lesserextent, the Canadian dollar in the first half of the year. Whilst reportedrevenue^ was down 1.4% at £3.99 billion (2006: £4.05 billion),underlying revenue^ was up 4.9%. This was driven by strong growthboth in commercial and industrial energy and in upstream andwholesale energy, which offset lower revenues in mass marketsenergy and in home and business services.
Reported operating profit*^ was up 8% at £187 million (2006: £173 million), with underlying profit* before exchange ratemovements up more than 15%. The significant fall in profits* in mass markets energy was more than offset by improvements in other areas of the business.
Centrica StorageDirect Energy

21
Directors’ R
eport – Business R
eviewD
irectors’ Report – G
overnanceFinancial S
tatements
Shareholder Inform
ationCentrica plc Annual Report and Accounts 2007
Mass markets energyMass markets energy comprises natural gas and electricity sales toresidential and small commercial customers across North America.
Mass markets energy experienced difficult trading conditions duringthe year, particularly the second half, following the expiry of five-yearelectricity contracts in Ontario, signed at market opening in 2002,combined with the expected competitive pressures in our Texasbusiness following the expiry of Price to Beat regulation and theimpact on margins of the takeover of TXU. These factors resulted in a fall in customer numbers. However by the year end this positionhad stabilised and we were once again growing the overall customerbase in the last two months of the year.
Reported revenue was down 12% to £2,437 million (2006: £2,765million) and reported operating profit* was down 22% at £123 million(2006: £157 million). Before the impact of exchange rate movementsunderlying revenue was down 6% with operating profit* down15%.
Commercial and industrial energyCommercial and industrial energy comprises natural gas andelectricity sales to medium and large-sized businesses, publicinstitutions and government.
Rapid growth in this segment continued during the year withvolumes up13% and 24% in gas and electricity respectively.Reported revenue was up15% to £978 million (2006: £847 million),with underlying revenues up 24%. The business moved into profitduring the second half as volumes grew and it recorded a £1millionprofit* for the full year (2006: loss* of £12 million) with profits* in themore mature Canadian and Texas businesses offset by the costs of continued rapid growth in the north eastern US.
Home and business servicesThis line of business comprises home and business services across North America.
Services had a good year despite challenging market conditions,with continued deepening of the housing recession in the US.During the year we grew our customer numbers by 3.5% to over 2 million for the first time. In the US, our mainly residential newconstruction business weathered the housing market downturnwell, gained market share in a shrinking market and expanded itsconsumer service business. The acquisition in January of MABE, a service provider for white goods, enabled us to launch anappliance protection and repair business across Canada.
Reported revenue^ was down 7% to £351million (2006: £378 million), although it remained flat on an underlying basis.Following the restructuring of the business services operation andthe increased focus on cost control to improve competitiveness, this has resulted in a near doubling of operating profit*^ to £17 million (2006: £9 million).
Upstream and wholesale energyThis business unit comprises our upstream and midstreamactivities which include upstream gas, power generation, gas storage and transportation leases, wholesale power and gas transactions, wind power purchase agreements andproprietary trading.
We delivered operating profit* of £46 million, up 142% on the prioryear (2006: £19 million) with strong contributions from our powerstations, wind power contracts as 433MW of new capacity cameonstream, wholesale energy auctions and proprietary trading.Power generated increased by 14% to 5.1TWh, whilst gasproduction was broadly unchanged at 297 million therms. Duringthe year, through our ongoing drilling programme, we replaced117% of the gas we produced.
In November we announced an agreed offer to acquire RockyviewEnergy Inc for around £57 million including debt. On successfulcompletion in February 2008, this added 2,700boe per day to ourhydrocarbon production, largely as natural gas. This acquisition is in line with our strategy of increasing the overall level of verticalintegration and further developing this revenue stream.
Direct EnergyPerformance indicatorsFor the period ended 31 December 2007 2006 ∆%
Customer numbers (period end)Mass markets energy (’000) 3,005 3,386 (11)Home and business services (’000) 2,033 1,964 3.5VolumesC&I gas sales (mmth) 627 557 13C&I electricity sales (GWh) 13,925 11,221 24Gas production (mmth) 297 304 (2.3)Electricity generation (GWh) 5,053 4,450 14Revenue^ (£m)Mass markets energy 2,437 2,765 (12)Commercial and industrial energy 978 847 15Home and business services 351 378 (7)Upstream and wholesale energy 226 60 277Total 3,992 4,050 (1.4)Operating profit/(loss) (£m)*Mass markets energy 123 157 (22)Commercial and industrial energy 1 (12) n/mHome and business services 17 9 89Upstream and wholesale energy 46 19 142Total excluding Income Fund 187 173 8The Consumers’ WaterheaterIncome Fund† 39 50 (22)Operating margin (%)*Total Direct Energy 4.7 4.3 0.4ppts
∆% has been used to express ‘percentage change’.
* including joint ventures and associates stated net of interest and taxation, and beforeexceptional items and certain re-measurements.
^ from continuing operations.† including consolidation entries and £7m 2006 H1 gain on sell-down.

Operating Review continued
22
Centrica plc Annual Report and Accounts 2007
European EnergyWe increased our customer base in Belgium
We re-entered the Spanish electricity market
We agreed a 20-year tolling contract for a newgas-fired power station in the Netherlands
We are involved in power generation, energy managementand retail energy supply, particularly in the increasinglyinterconnected energy markets of north western Europe.
Our European Energy business performed well in 2007, more thandoubling its operating profit* to £17 million (2006: £7 million).
In Belgium in January 2007 we completed the transfer of around500,000 Wallonian residential customer accounts to ourSPE-Luminus business, increasing our total energy customer baseto 1.4 million. As part of the remedies required to enable the mergerof Gaz de France (GdF) and Suez, GdF must dispose of their 25.5%holding in SPE. Centrica has pre-emption rights over this stake.
In the Netherlands we continued to grow our customer basethrough the Oxxio brand and now supply approximately 754,000customer accounts. During the year we installed around 75,000smart meters and are working with the regulator to ensure Oxxio’smeters are compatible with future industry standards. We alsoentered into a 20-year tolling contract with Intergen for a 400MWgas-fired power station in Rijnmond, near Rotterdam, which isexpected to be commercially operational by summer 2010.
In January 2007 we rebranded our Spanish operation from Luseo to Centrica Energía. As market conditions improved wesuccessfully re-entered the electricity supply market and havealready contracted 0.9TWh of annual consumption. We also grewour portfolio of energy managed on behalf of ‘special regime’generators to 650MW.
As a result of the positive developments in the legal and regulatoryframework for competition within the German energy market we opened an operation in Düsseldorf selling to the commercialsupply market through Centrica Energie GmbH.
Discontinued operations
The Consumers’ Waterheater Income Fund was deconsolidated on1December 2007, the date of an Internalisation Agreement enteredinto between Direct Energy and the Fund which materially alteredthe relationship between the two entities. Details of the impact of the deconsolidation are included in note 3 and note 35.
European Energy
* including joint ventures and associates stated net of interest and taxation, and before exceptional items and certain re-measurements

23
Directors’ R
eport – Business R
eviewD
irectors’ Report – G
overnanceFinancial S
tatements
Shareholder Inform
ationCentrica plc Annual Report and Accounts 2007
Centrica’s financial aim is to achieve a total shareholder return (TSR) ranking in the first quartile of UK FTSE 100 Index companies,taking into account share price growth and dividends received andreinvested over a sustained period. Centrica seeks to maximise thereturn on capital it achieves in excess of its cost of capital, within aprudent risk management framework. The Remuneration Reportsummarises our TSR performance over recent years against ourcomparator FTSE 100 Index group.
Financial statements
Group revenueGroup revenue from continuing operations remained broadly flat at£16.3 billion (2006: £16.4 billion). Increases in British Gas Servicesand British Gas Business as well as the first reported revenues from our Power Generation business were offset by the reductionseen in British Gas Residential due to lower gas and powerconsumption levels.
Group operating profitGroup operating profit* from continuing operations was up 40% to£1,949 million (2006: £1,392 million). The year-on-year movementwas primarily due to the turnaround in the profitability of British GasResidential and the industrial and commercial gas supply contractsdue to the reduction in the wholesale gas price in the first half of 2007.Record operating profits* were also made in British Gas Business,British Gas Services, Centrica Storage and Direct Energy.
The statutory profit for the year was £1,505 million (2006: loss of£155 million). The reconciling items between adjusted Group profit* andthe statutory profit are exceptional items, certain re-measurementsand discontinued operations, which are explained below.
Group earningsGroup earnings* on a continuing basis were up by 60% to £1,121million (2006: £701 million). This growth in earnings* came from thehigher operating profit* combined with a significant change in profitmix towards greater downstream contributions, resulting in a lowereffective group tax rate of 40% in the year (2006: 44%). Interestpayments were also lower, at £73 million (2006: £141 million),following the favourable cash flow position held for most of the year.
The interest charge includes a one-off charge of £40 million relatingto the early repayment of the finance lease on the Humber powerstation, which helps simplify the Group’s debt structure.
Earnings per share and dividendsAdjusted earnings per share* improved by 58% to 30.6 pence in 2007, up from 19.4 pence in 2006. The Group reported basicearnings per share of 41.0 pence, up from a basic loss per share of 4.3 pence in 2006, reflecting the post-tax impact of exceptionalcharges and certain re-measurements which were positive in 2007, having been negative in 2006.
In addition to the interim dividend of 3.35 pence, per share, we propose a final dividend of 9.65 pence, giving a total ordinarydividend of 13.00 pence for the year (2006: 11.15 pence), an increase of 17%.
Cash flowGroup operating cash flow before movements in working capitalwas up from £1,892 million in 2006 to £2,494 million. After workingcapital adjustments, operational interest, tax, exceptional charges anddiscontinued items, this stood at £2,357 million (2006: £737million). This increase in operating cash flow is primarily due toincreased earnings and a decrease in the amount of tax paid. Thenet cash outflow from investing activities increased to £964 million (2006: £720 million), 34% higher than last year due to the Group’sacquisition of Newfield UK Holdings Limited and a 50% share in the Braes of Doune wind farm. The net cash outflow from financingactivities increased to £888 million (2006: £597 million), an increaseof 49% on 2006, due mainly to the prepayment of the Humberfinance lease. This resulted in a net cash outflow of £368 millionrelating to principal and £54 million relating to interest.
Net debt and interestThe Group’s net recourse debt level at 31 December 2007 was£795 million (2006: £1,527 million). This was down from 2006, due primarily to improved operating cash flow. This debt includes£417 million of finance lease commitments on the Spalding power station.
As a result of changes in the relationship with The Consumers’Waterheater Income Fund, with effect from 1 December 2007 we no longer consolidate the period results and the Balance Sheetof the Fund in Centrica’s Group accounts. This has reduced the
Group FinancialReview Increasing returns to
shareholders
2007 was a year of sound growth in earnings*, driven by a turnaround in theprofitability of British Gas Residential and record operating profits* in ourgrowth businesses.
* including joint ventures and associates stated net of interest and taxation, and before exceptional items and certain re-measurements
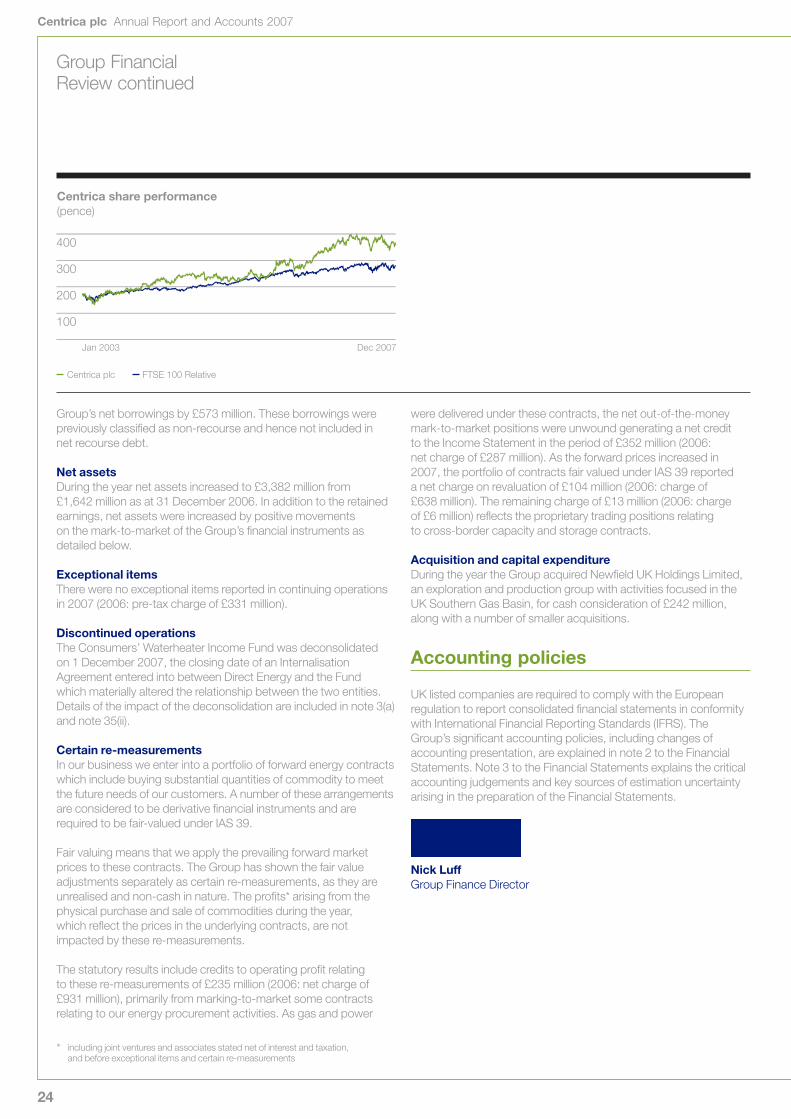
24
Centrica plc Annual Report and Accounts 2007
Group’s net borrowings by £573 million. These borrowings werepreviously classified as non-recourse and hence not included in net recourse debt.
Net assetsDuring the year net assets increased to £3,382 million from £1,642 million as at 31 December 2006. In addition to the retainedearnings, net assets were increased by positive movements on the mark-to-market of the Group’s financial instruments asdetailed below.
Exceptional itemsThere were no exceptional items reported in continuing operationsin 2007 (2006: pre-tax charge of £331 million).
Discontinued operationsThe Consumers’ Waterheater Income Fund was deconsolidated on 1 December 2007, the closing date of an InternalisationAgreement entered into between Direct Energy and the Fund which materially altered the relationship between the two entities.Details of the impact of the deconsolidation are included in note 3(a)and note 35(ii).
Certain re-measurementsIn our business we enter into a portfolio of forward energy contractswhich include buying substantial quantities of commodity to meetthe future needs of our customers. A number of these arrangementsare considered to be derivative financial instruments and arerequired to be fair-valued under IAS 39.
Fair valuing means that we apply the prevailing forward marketprices to these contracts. The Group has shown the fair valueadjustments separately as certain re-measurements, as they areunrealised and non-cash in nature. The profits* arising from thephysical purchase and sale of commodities during the year, which reflect the prices in the underlying contracts, are notimpacted by these re-measurements.
The statutory results include credits to operating profit relating to these re-measurements of £235 million (2006: net charge of£931 million), primarily from marking-to-market some contractsrelating to our energy procurement activities. As gas and power
were delivered under these contracts, the net out-of-the-moneymark-to-market positions were unwound generating a net credit to the Income Statement in the period of £352 million (2006: net charge of £287 million). As the forward prices increased in 2007, the portfolio of contracts fair valued under IAS 39 reported a net charge on revaluation of £104 million (2006: charge of £638 million). The remaining charge of £13 million (2006: charge of £6 million) reflects the proprietary trading positions relating to cross-border capacity and storage contracts.
Acquisition and capital expenditureDuring the year the Group acquired Newfield UK Holdings Limited,an exploration and production group with activities focused in theUK Southern Gas Basin, for cash consideration of £242 million,along with a number of smaller acquisitions.
Accounting policies
UK listed companies are required to comply with the Europeanregulation to report consolidated financial statements in conformitywith International Financial Reporting Standards (IFRS). TheGroup’s significant accounting policies, including changes ofaccounting presentation, are explained in note 2 to the FinancialStatements. Note 3 to the Financial Statements explains the criticalaccounting judgements and key sources of estimation uncertaintyarising in the preparation of the Financial Statements.
Nick LuffGroup Finance Director
Centrica share performance(pence)
Centrica plc
Jan 2003 Dec 2007
FTSE 100 Relative
400
300
200
100
* including joint ventures and associates stated net of interest and taxation, and before exceptional items and certain re-measurements
Group FinancialReview continued

25
Directors’ R
eport – Business R
eviewD
irectors’ Report – G
overnanceFinancial S
tatements
Shareholder Inform
ationCentrica plc Annual Report and Accounts 2007
Centrica, like all businesses, faces risks and uncertainties as we conduct our operations and there are a number of risks that could impact the Group’s short and long-term performance.
We place great importance on internal control and risk management.A risk-aware and control-conscious environment is promoted andencouraged throughout the Group. We take steps to understand andevaluate risks to support the creation of long-term sustainable returnsfor shareholders. We have a robust risk management process inplace, which is designed to identify, manage and mitigate businessrisk. This process is described in more detail in the CorporateGovernance Report on page 36.
The factors described below highlight the principal risks anduncertainties that affect the Group but are not intended to be anexhaustive analysis of all the risks which may arise in the ordinarycourse of business or otherwise. Some risks may be unknown to the Group and other risks, currently regarded as immaterial, could turn out to be material.
External market factors
Commodity prices Our energy requirements to serve our gas and electricity customersare dependent on the wholesale commodity markets for gas, oil, coal, carbon and power prices, all of which have been volatile in recent years. The outlook for 2008 continues to be difficult topredict due in part to the uncertain economic environment and theimpact of geopolitical events. The price of gas in the UK market isparticularly important for us given the high proportion of the retailgas market we serve and our fleet of gas-fired power stations.
To manage this risk, we optimise our asset and contract portfoliothrough an approach based on extensive analysis of our supply and demand position and continuous assessment of the commoditymarkets in which we operate (see note 4 to the Financial Statementson page 69). Our policy is to hedge a proportion of the exposure for a number of years ahead linked to the underlying profiles of our customers’ energy requirements through bilateral agreementsfor gas and power and the use of financial instruments such as oil and gas swaps.
While this hedging strategy has mitigated increases in commodityprices for a period, we had to increase retail energy prices inJanuary 2008. A continuing volatile commodity price environment,particularly with regard to gas costs, may lead to further retail priceadjustments. The combination of variable commodity costs and the extent to which these costs are passed through to consumers,will mean that margins will remain volatile, thereby affecting Groupearnings. Furthermore, the unpredictability of commodity prices,including carbon (particularly with the uncertainty of the futuretrading regime), hampers the calculation of reliable forecasts to support investment decisions potentially leading to lower than expected returns.
ConsumptionGas sales volumes, and to a lesser extent electricity sales volumes,are affected by temperature and other weather factors. Customers’demand behaviour will also be influenced by the national economicclimate, gas and electricity prices and an increasing awareness of the environmental impact of energy use. The development andapplication of new technologies, either from the use of domesticenergy generating units (such as micro-combined heat and powerunits), and/or greater use of demand-side management technology(such as smart metering), could also affect demand in the mediumterm and therefore the Group’s earnings. We monitor consumptiontrends and have developed a portfolio of low-carbon products andservices for our customers.
In addition, we use historical consumption patterns to estimatecustomer usage and therefore the value of the future benefits that will flow to us. Any change in those benefits would change the value of the revenue recognised. For further details see note 3to Financial Statements on page 67.
Level of competitive activityThe markets in which we operate are highly competitive and subjectto customer churn rates that are sensitive to price changes andlevels of customer service.
To ensure we retain our competitive position, we need to combineattractive products and propositions with high quality customerservice, maintain an efficient cost structure and, for energy supply,procure energy competitively. Accordingly, we actively monitorcustomer trends and competitor activity to respond to changingcircumstances by developing retention campaigns and innovative
Principal Risks andUncertainties Managing our risks
The identification and assessment of risks, together with theimplementation of effectivemitigating controls, are fundamental to achieving our strategicobjectives.
26
Centrica plc Annual Report and Accounts 2007
customer offerings. In addition, we retain a strong focus on reducingoperating costs, as failure to sustain competitive cost levels willchallenge our ability to deliver sustainable operating margins.
Regulatory factorsThe energy markets in the UK, North America and Europe aresubject to comprehensive operating requirements as defined by the relevant sector regulators and/or government departments.Amendments to the regulatory regime could have an impact on ourability to achieve our financial goals. Furthermore, we are obligedto comply with supply and wholesale industry procedures,amendments to which could have an impact on our operatingcosts. We are also subject to regulated charges for transportationand distribution of energy. Material increases in these charges will impact our margins, to the extent that any such increases cannot be passed on to our customers.
The UK Energy Bill has had little adverse impact on the Group. We continue to monitor drafting amendments and revisions duringthe passage of the Bill which could introduce new requirements in relation to smart meters (with the potential for additional costsif existing meters become obsolete) and supplier social tariffs.
In Europe, while the European Commission remains supportive ofnetwork unbundling, meaningful progress on European marketderegulation continues to be limited. The need for effectivecompetition is emphasised by the current level of consolidationactivity in Europe, which could not only have an impact on ourparticipation in European energy markets but also the ability tosource and transport gas across Europe to the UK.
In North America the risk of political or regulatory intervention inenergy markets remains an uncertainty and could have an impacton the projected growth of our operations. While the 2007 sessionof the Texas legislature concluded without any material changes to the electricity market or competition rules, this issue remains inthe political spotlight and could be reviewed during the nextlegislative session which begins in early 2009. Specific reviewsregarding electricity deregulation are ongoing in a limited number of jurisdictions but energy policy, particularly electricity, remains a highly politicised topic throughout North America.
In order to mitigate these risks, we continue to monitor political andregulatory developments and engage with the relevant stakeholdersthrough targeted contact programmes with regulators, governmentministers and senior officials.
Operational factors
Climate changeWith the increasing recognition of the impact of climate change onour environment, we believe we can make an important contributionto support a low-carbon economy. Our climate change strategyrecognises both the risks and opportunities that will shape our futureoperations and ultimately the longer-term success of our business.Our strategy is designed to address the risks this may present,such as new legislation, changing customer behaviour includinggrowing demand for low-carbon products and services, and thereputational risks of not taking a leadership position.
Further information on our approach to climate change is available in the Corporate Responsibility Review on page 30.
Information systemsLarge, effective and secure information systems are critical for the efficient management and accurate billing of our customers and to support our energy trading and optimisation activities. Any significant disruption to these systems could adversely affectour operations and so there are business continuity plans in place.To improve efficiency, we continue to invest in our systems supportedby strong project management to minimise the associatedimplementation risk. In addition, controls to ensure the confidentiality,availability and integrity of customer and Company data remain acore element of system development and continuous improvement.
Security of supplyAs UK gas reserves have declined, the UK energy market hasbecome increasingly reliant on pipelines from Norway and mainlandEurope together with liquefied natural gas supplies from other parts of the world. Accordingly, a key element of security of supply is access to these reserves and the reliability of the pipeline and gas processing infrastructure operated by Centrica and third partiesboth in the UK and abroad. Any break in this supply chain couldjeopardise the supply to customers and impact our earnings.
To respond to this changing environment, we have supported newinfrastructure development to bring gas to the UK, such as theLangeled pipeline. In addition, we continue to acquire assets, such as Newfield UK Holdings Limited, and sign long-term supply contracts to replace declining gas reserves. We will continue to seekopportunities to secure and develop gas and power assets in the UK and overseas, and continually review our security arrangementsto protect those assets.
Health and safetyWe manage significant health and safety risks associated with theoperation of our onshore and offshore gas production, gas storageand power generation assets. In addition, our service engineers in the UK and North America complete more than 8 million homevisits each year to carry out essential work on gas and electricalinstallations, appliance maintenance and plumbing and drainservices. We are committed to maintaining high standards of healthand safety and our risk management and governance processesmeet internationally recognised standards of good practice.Significant health and safety events could have an adverse impacton personal safety, gas and/or power production or our reputation.Although the likelihood of such events is low, we continue to target risk reduction in our operations to minimise the possibility of incidents occurring.
Further information on our approach is available in the CorporateResponsibility Review on page 31.
UK customer serviceThe delivery of good quality customer service is central to ourbusiness strategy. The implementation of a new billing system forour UK residential energy customers led to levels of customer servicethat were lower than we aspire to. Through continued focus in thisarea during 2007 we are now seeing improved levels of customer
Principal Risks andUncertaintiescontinued

27
Directors’ R
eport – Business R
eviewD
irectors’ Report – G
overnanceFinancial S
tatements
Shareholder Inform
ationCentrica plc Annual Report and Accounts 2007
service and reduced customer complaints. We carefully monitorthese service levels and performance throughout our retailoperations, to ensure continual improvement.
Outsourcing and offshoringWe have entered into a number of outsourcing contracts, some ofwhich are offshore, in respect of certain support functions for ourbusinesses in the UK and North America. As with any contractualrelationship, there are inherent risks to be considered and mitigated.
We have worked closely with our chosen suppliers to ensure the delivery of benefits with strong focus by management in theretained organisation playing an important part in the successfultransition and implementation. The Centrica Executive Committeeregularly reviews progress and, in addition, a centre of expertise has been developed to capture and share best practice.
Brand and reputationOur business principles, which apply to all employees and businesspartners, set out our commitment to operate professionally, fairlyand with integrity wherever we work in the world. Failure to followthese principles could harm our reputation, damage our brand and affect our operational performance and financial position. A combination of awareness training and targeted controls(including fraud and data protection) is in place to encourage and monitor adherence to these principles.
As part of the demerger in 1997, Centrica was assigned ownershipof the British Gas trademark and related logos for use in the UK. BGGroup plc has the right to call for a reassignment of this intellectualproperty if control of Centrica is acquired by a third party. If, as aresult of a change of control, we are unable to continue to use theBritish Gas trademark and logos, this could adversely affect ourcompetitive position.
Financial factors
LiquidityCash forecasts identifying the liquidity requirements for the Groupare produced frequently. These are stress-tested for differentscenarios and are reviewed regularly by the Board to ensure thatsufficient headroom exists for at least a 12-month period. Any failure to maintain sufficient headroom could have an impact on ouroperations. Our policy is to maintain a minimum level of committedfacilities and ensure that a proportion of debt should be long-termand spread over a range of maturities.
CurrencyThrough wholly-owned US and Canadian subsidiaries and wholly-owned and partly-owned European entities, the Group has operational exposure in US and Canadian dollars and euros.Our policy is to maintain the sterling book value of our foreigncurrency investment through balance sheet hedging instruments.US dollar, Canadian dollar and euro balance sheet translationexposure is hedged by maintaining foreign currency borrowingsand/or derivative financial liabilities which approximate to the net asset value of the foreign operations.
Other material foreign currency cash flow exposures are hedgedwhere there is sufficient certainty that the cash flows will occur.Where there is significant uncertainty over the potential timing of material currency exposures the senior treasury and financemanagement decide on the appropriate hedging activity requiredon a case-by-case basis.
Interest rateOur policy is to manage interest rate risk on long-term borrowingswhile ensuring that the exposure to fixed rates remains within a30% to 70% range. This is achieved by using derivative financialinstruments, such as interest rate swaps, to adjust the interestbasis of the portfolio of long-term debt.
CounterpartyOur policy is to limit counterparty exposures by setting credit limitsfor each counterparty, where possible by reference to publishedcredit ratings. Exposures are measured in relation to the nature,market value and maturity of each contract or financial instrument.Surplus cash is invested in short-term financial instruments andonly deposited with counterparties with minimum long-term andshort-term credit ratings of A3/A-/A-or P1/A1/F1 from any of Moody’s,S&P or Fitch Ratings. Energy trading activities are undertaken withcounterparties for whom specific credit limits are set. Exposures are reviewed by the Financial Risk Management Committee.
Credit ratingThe current strong credit rating of the Group (long-term debt: A3 stable outlook (Moody’s), A negative outlook (S&P); short-termdebt: P-2 stable outlook (Moody’s), A-1 negative outlook (S&P)),means that it benefits from high levels of credit for its existingcounterparty relationships. Any material deterioration of this ratingwould mean that we would need to increase our levels of security forexisting energy procurement and hedging contracts, which mayhave a material effect on our cash position or limit our ability to trade in commodity markets. As described above, sufficient liquidityheadroom is maintained to limit the immediate financial impact of a reduction in the credit rating. Further details on these financialrisks can be found in notes 4 and 5 to the Financial Statements on pages 69 and 74.
PensionsWe maintain a variety of pension schemes including defined benefitschemes. The pension fund liabilities are partially matched with aportfolio of assets, which leaves potential risk around the mortalityrate, wage inflation and returns on assets. The scheme contains a high proportion of equity assets that are expected to provide a better return in the long term than alternative investments such asbonds. However, in the short term, the difference between the valueof liabilities and assets may vary significantly, potentially resulting ina large deficit having to be recognised on the Group’s balance sheet.
In addition, actions by the pension regulators or the trustees and/or any material revisions to the existing pension legislationcould require increased contributions by the Group to the pensionfund. The risks associated with the pension schemes are regularlyreviewed and, in combination with expert external advice, anyappropriate action is identified and acted upon accordingly. Forfurther details see note 34 to the Financial Statement on page 126.
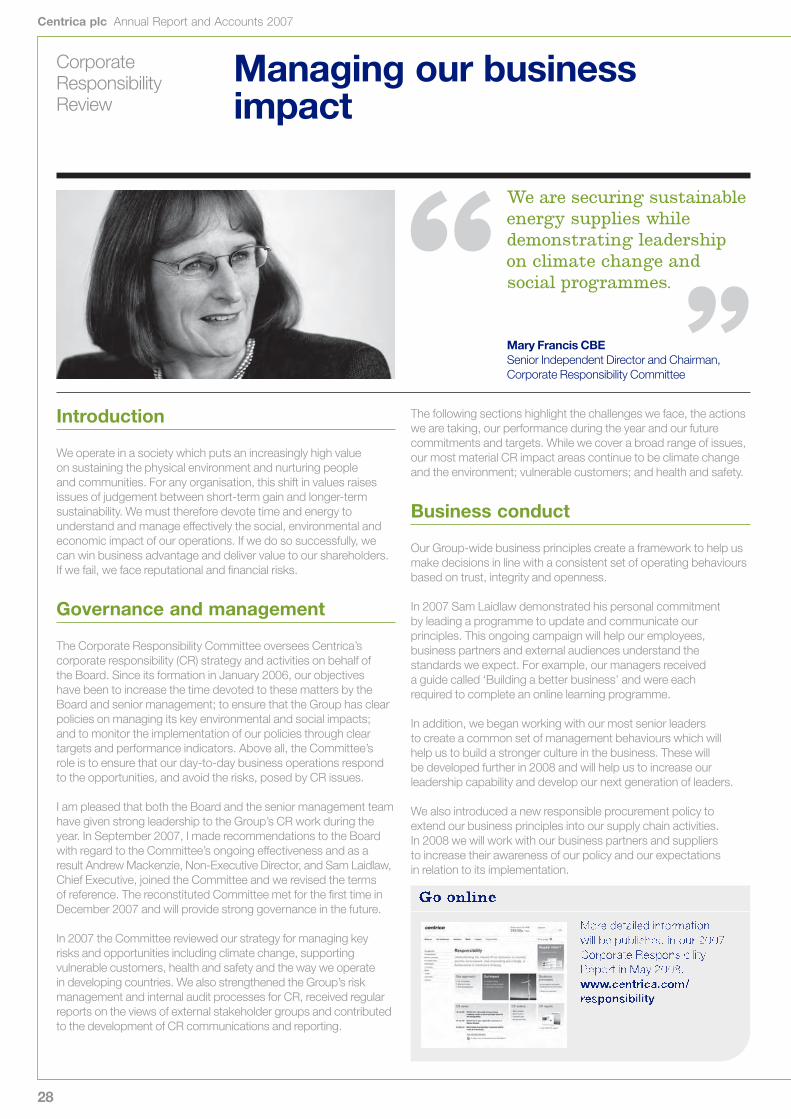
CorporateResponsibilityReview
28
Centrica plc Annual Report and Accounts 2007
Introduction
We operate in a society which puts an increasingly high value on sustaining the physical environment and nurturing people and communities. For any organisation, this shift in values raisesissues of judgement between short-term gain and longer-termsustainability. We must therefore devote time and energy tounderstand and manage effectively the social, environmental andeconomic impact of our operations. If we do so successfully, wecan win business advantage and deliver value to our shareholders.If we fail, we face reputational and financial risks.
Governance and management
The Corporate Responsibility Committee oversees Centrica’scorporate responsibility (CR) strategy and activities on behalf of the Board. Since its formation in January 2006, our objectives have been to increase the time devoted to these matters by theBoard and senior management; to ensure that the Group has clearpolicies on managing its key environmental and social impacts; and to monitor the implementation of our policies through cleartargets and performance indicators. Above all, the Committee’s role is to ensure that our day-to-day business operations respondto the opportunities, and avoid the risks, posed by CR issues.
I am pleased that both the Board and the senior management teamhave given strong leadership to the Group’s CR work during theyear. In September 2007, I made recommendations to the Boardwith regard to the Committee’s ongoing effectiveness and as aresult Andrew Mackenzie, Non-Executive Director, and Sam Laidlaw,Chief Executive, joined the Committee and we revised the terms of reference. The reconstituted Committee met for the first time inDecember 2007 and will provide strong governance in the future.
In 2007 the Committee reviewed our strategy for managing keyrisks and opportunities including climate change, supportingvulnerable customers, health and safety and the way we operate in developing countries. We also strengthened the Group’s riskmanagement and internal audit processes for CR, received regularreports on the views of external stakeholder groups and contributedto the development of CR communications and reporting.
The following sections highlight the challenges we face, the actionswe are taking, our performance during the year and our futurecommitments and targets. While we cover a broad range of issues,our most material CR impact areas continue to be climate changeand the environment; vulnerable customers; and health and safety.
Business conduct
Our Group-wide business principles create a framework to help usmake decisions in line with a consistent set of operating behavioursbased on trust, integrity and openness.
In 2007 Sam Laidlaw demonstrated his personal commitment by leading a programme to update and communicate ourprinciples. This ongoing campaign will help our employees,business partners and external audiences understand thestandards we expect. For example, our managers received a guide called ‘Building a better business’ and were each required to complete an online learning programme.
In addition, we began working with our most senior leaders to create a common set of management behaviours which will help us to build a stronger culture in the business. These will be developed further in 2008 and will help us to increase ourleadership capability and develop our next generation of leaders.
We also introduced a new responsible procurement policy toextend our business principles into our supply chain activities. In 2008 we will work with our business partners and suppliers to increase their awareness of our policy and our expectations in relation to its implementation.
Go online
More detailed informationwill be published in our 2007Corporate ResponsibilityReport in May 2008.www.centrica.com/responsibility
Managing our businessimpact
We are securing sustainableenergy supplies whiledemonstrating leadership on climate change and social programmes.
Mary Francis CBE Senior Independent Director and Chairman, Corporate Responsibility Committee

29
Directors’ R
eport – Business R
eviewD
irectors’ Report – G
overnanceFinancial S
tatements
Shareholder Inform
ationCentrica plc Annual Report and Accounts 2007
Listening to stakeholders
It is essential that we are alert to evolving trends and opinions –among employees, customers, policy-makers, investors and wider stakeholders – so that we can fully understand our impact on society and the environment and contribute our expertise andexperience to public debate.
Helping shape the policy environmentWe are committed to playing a full and active role in the politicalprocess to support the creation of competitive energy markets that deliver consumer choice, support vulnerable customers,promote security of supply and facilitate the move towards a low-carbon society.
Competitive marketsIn 2007 we continued to support the creation of a truly competitiveEuropean energy market. We welcomed the European Commission’sproposals for the unbundling of electricity and gas transmissionnetworks and will support their implementation. In addition, DirectEnergy continued to advocate market change across North Americato improve energy market competitiveness and consumer choice.
Reducing carbon emissionsWe played an active part in the debate on reducing carbonemissions, including the development of EU emissions reductiontargets and phase three of the EU Emissions Trading Scheme(ETS). In North America, we continued to engage with federal, stateand provincial policy-makers as well as industry groups to informthinking on carbon legislation. The price of carbon is a significantfactor in our investment decisions and we believe that effective capand trade systems such as the ETS will provide long-term visibility.
Talking to investorsIn 2007 we hosted our fourth annual CR investor roadshow to brief analysts on our CR strategy and performance on key areas ofimpact. We continued to be included in the Dow Jones SustainabilityIndex and FTSE4Good indices during the year. We were recognisedas a sector leader by the Carbon Disclosure Project and ranked firstin an assessment of UK energy suppliers’ action on climate change,undertaken by Innovest on behalf of WWF. Our online CR report wasranked third best in Europe by internet consultancy Jungle Rating.
Corporate ResponsibilityPerformance indicators
2007 2006 ∆%
Climate changeCarbon intensity of UK power generation (g CO2/kWh)* 394 412 (4)UK household energy efficiency products provided (million)1 17.3 13.5 28Lifetime carbon savings for UK household energy efficiency products provided (million tonnes)2 1.2 1.0 20Social programmes forvulnerable customersCustomers on British Gas ‘Essentials’ social energy tariff 340,000 – –Health and safetyLost-time injuries/1,000 employees 18.7 14.3 31Lost-time injuries/100,000 hours worked 1.03 0.80 29Total accidents/100,000 hours worked3 5.7 3.9 46Total number of fatalities 0 74 –Local impactTotal community contributions (£m)5 6 5.2 7.4 (30)Voluntary social contributions (£m)7 25 – –Mandatory social contributions (£m)8 51 – –EmployeesEmployee engagement score 3.96 3.84 3Human capital ROI ratio9 2.5 2.1 19Employees from ethnic minority groups (%)10 15.2 15.9 (4)Employee gender (female/male %) 30.2/69.8 29.9/70.1 –Employees with a disability (%) 3.2 2.7 19
∆% has been used to express ‘percentage change’.1 UK Energy Efficiency Commitment.2 Source: www.nef.org.uk/greencompany/co2calculator.htm.3 We stated total injuries/100,000 hours worked in our 2006 Annual Report.4 Morecambe Bay helicopter accident: four employees and three contractors.5 Calculated using London Benchmarking Group methodology.6 Cash donations in the UK during the year amounted to £4.1 million (2006: £6.1 million).
This included a donation of £1.1 million to the British Gas Energy Trust, which supportsvulnerable customers. In line with Group policy, no donations were made for politicalpurposes. The Group, in the normal course of its business, has paid for its management to attend events at which politicians and other opinion-formers have been present, but does not consider these payments to be political donations.
7 Cost of voluntary programmes to support vulnerable customers in the UK.8 Cost of mandatory programmes to support vulnerable customers in the UK.9 PwC Saratoga – a measurement of financial return for investment in employee
remuneration, benefits and training.10 2,007 employees in the UK have not disclosed their ethnic profile.
We were recognised as a sector leader by the Carbon Disclosure Project in 2007
Our sustainability performance wasrecognised as Gold Class by SustainableAsset Management in 2007
Our online CR report wascommended by theAssociation of Chartered andCertified Accountants in 2007
Key highlights

CorporateResponsibilityReviewcontinued
30
Centrica plc Annual Report and Accounts 2007
Tackling climate change
Reducing carbon emissions while securing future energy suppliesfor our customers is a very significant challenge. But climatechange science makes unequivocal the case for a low-carbonfuture and we have an important role to play in making it happen.Our strategy is to lead the market in responding to growingconsumer demand for low-carbon products and services; to maintain our low-carbon position on power generation; and to work with our employees and suppliers to reduce the environmental impact of our operations.
Commercial opportunitiesIn 2007 we launched a new business unit – British Gas New Energy– to lead our low-carbon strategy in the UK. In North America, we formed a cross-business team to co-ordinate Direct Energy’sclimate change activities within each business unit. On both sidesof the Atlantic, our increased focus on developing innovative low-carbon products and services for our customers is animportant growth opportunity.
Low-carbon productsBritish Gas launched ‘Zero Carbon’11, our greenest tariff available todomestic customers, and introduced a scheme offering a council taxrebate of £500 to customers installing solar panels. Direct Energyextended its carbon neutral gas programme to Ontario, Alberta andManitoba after a successful launch in British Columbia. It providescustomers with the ability to reduce their carbon footprint byoffsetting the greenhouse gases they produce in their homes withcarbon credits that fund clean energy projects around the world.
Energy efficiencyBritish Gas remained the largest provider of household energyefficiency products in the UK, providing more than 17 millionproducts in 2007. Our Green Streets campaign, which links 64 households in eight cities across the UK, aims to highlight thepositive impact simple energy efficiency products and behaviourscan have.
Low-carbon power generationThe carbon intensity of the power we generate for our British Gascustomers is already significantly lower than the other five major UK suppliers. In 2007, 394 grams of carbon dioxide were emittedfor every kilowatt hour (g CO2/kWh) of power we generated*.
To ensure we maintain this leadership position, we have set a target to reduce our UK power generation carbon intensity to 380g CO2/kWh by 2012 and aim to go even further by cutting our intensity to 350g CO2/kWh by 2020.†
This is a significant challenge, but we believe that our focus onrelative, rather than absolute, targets will enable us to reduce CO2 emissions and continue to provide secure energy supplies for our customers. Our strategy to invest in low-carbon generationsuch as high-efficiency gas-fired power stations and offshore windfarms will not only enable us to meet our own targets but enableCentrica to play a key role in meeting broader UK and Europeanemissions reduction targets.
Investing in renewables During the year we acquired 50% ownership of the 72MW Braes of Doune onshore wind farm in Stirlingshire, Scotland. We madegood progress with our Lynn and Inner Dowsing development andsubmitted a planning application for the construction of the Lincsoffshore wind farm. Together with other wind farms in development,our UK generation capacity in the next few years is expected to reachmore than1.6GW. In Texas Direct Energy signed a seven-year dealto buy the output of AES Corporation’s 170MW Buffalo Gap WindFarm 3, bringing our total wind power offtake commitment in North America to 813MW.
Reducing our operational footprint We introduced a new Group-wide environment policy to provideclear direction for our programmes and developed a GroupEnvironmental Management System ready for implementation,commencing with British Gas in 2008. We launched a newcompany car policy to remove the most polluting vehicles, enablingall eligible employees to select from cars emitting less than 200g ofCO2 per km. Green parking spaces were also created for cars withemissions below 120g of CO2 per km and for those car-sharing. We initiated a ‘Being Green’ campaign across the Company toencourage employees to help reduce our operational footprint.
380g†
2012 targetTo reduce our UK power generation carbon intensity to 380g CO2/kWh†
10%Office energy targetWe achieved our target to reduce UK officeenergy use by10% in 2007; we are aiming for a further 5% reduction in 2008
17m1
Energy efficient UK household energy efficiencyproducts provided
11 Zero Carbon is the name of the tariff. We offset the CO2 emissions from the gas and electricity customers consume using carbon offsets certified by the United Nations.
* Based on verified emissions data under the requirements of the EU EmissionsTrading Scheme.
† Carbon intensity figures are based on the average annual emissions from all wholly-owned UK power generation assets and all other power generationassets from which Centrica is entitled to output under site-specific contractsin the UK.
Key highlights
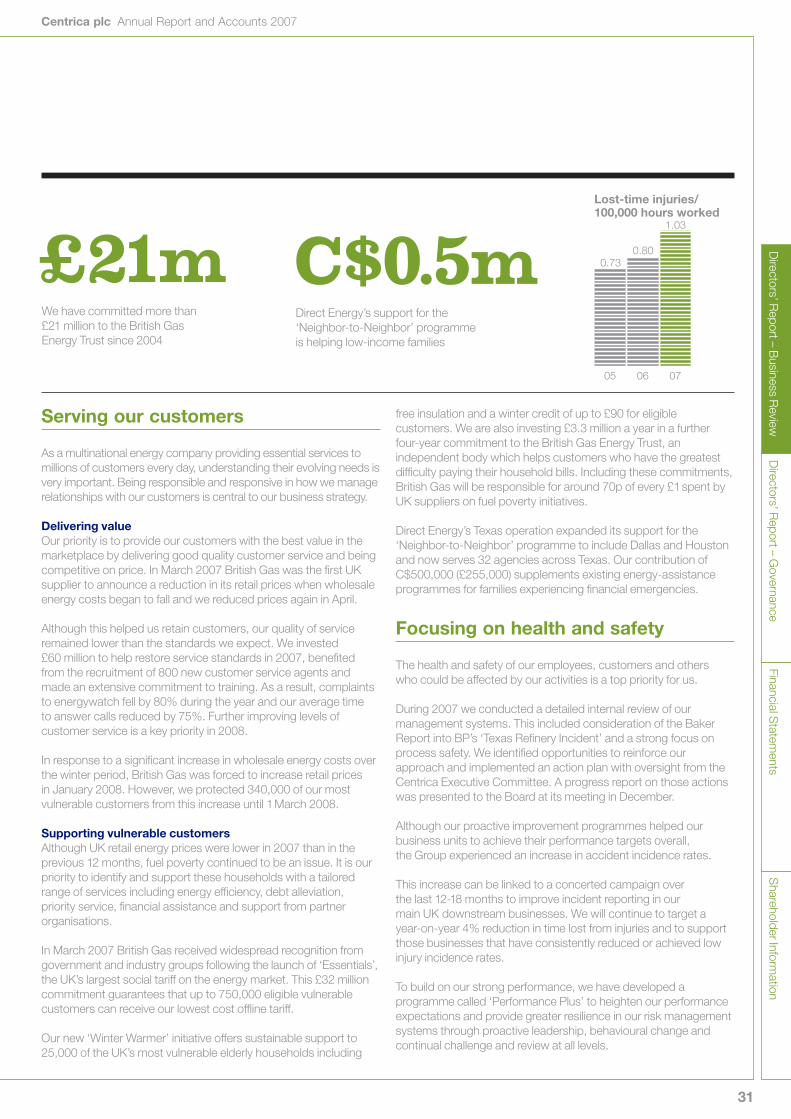
31
Directors’ R
eport – Business R
eviewD
irectors’ Report – G
overnanceFinancial S
tatements
Shareholder Inform
ationCentrica plc Annual Report and Accounts 2007
Serving our customers
As a multinational energy company providing essential services tomillions of customers every day, understanding their evolving needs isvery important. Being responsible and responsive in how we managerelationships with our customers is central to our business strategy.
Delivering value Our priority is to provide our customers with the best value in themarketplace by delivering good quality customer service and beingcompetitive on price. In March 2007 British Gas was the first UKsupplier to announce a reduction in its retail prices when wholesaleenergy costs began to fall and we reduced prices again in April.
Although this helped us retain customers, our quality of serviceremained lower than the standards we expect. We invested £60 million to help restore service standards in 2007, benefitedfrom the recruitment of 800 new customer service agents andmade an extensive commitment to training. As a result, complaintsto energywatch fell by 80% during the year and our average time to answer calls reduced by 75%. Further improving levels ofcustomer service is a key priority in 2008.
In response to a significant increase in wholesale energy costs overthe winter period, British Gas was forced to increase retail prices in January 2008. However, we protected 340,000 of our mostvulnerable customers from this increase until 1March 2008.
Supporting vulnerable customersAlthough UK retail energy prices were lower in 2007 than in theprevious 12 months, fuel poverty continued to be an issue. It is ourpriority to identify and support these households with a tailoredrange of services including energy efficiency, debt alleviation,priority service, financial assistance and support from partnerorganisations.
In March 2007 British Gas received widespread recognition fromgovernment and industry groups following the launch of ‘Essentials’,the UK’s largest social tariff on the energy market. This £32 millioncommitment guarantees that up to 750,000 eligible vulnerablecustomers can receive our lowest cost offline tariff.
Our new ‘Winter Warmer’ initiative offers sustainable support to25,000 of the UK’s most vulnerable elderly households including
free insulation and a winter credit of up to £90 for eligiblecustomers. We are also investing £3.3 million a year in a furtherfour-year commitment to the British Gas Energy Trust, anindependent body which helps customers who have the greatestdifficulty paying their household bills. Including these commitments,British Gas will be responsible for around 70p of every £1spent byUK suppliers on fuel poverty initiatives.
Direct Energy’s Texas operation expanded its support for the‘Neighbor-to-Neighbor’ programme to include Dallas and Houstonand now serves 32 agencies across Texas. Our contribution ofC$500,000 (£255,000) supplements existing energy-assistanceprogrammes for families experiencing financial emergencies.
Focusing on health and safety
The health and safety of our employees, customers and others who could be affected by our activities is a top priority for us.
During 2007 we conducted a detailed internal review of ourmanagement systems. This included consideration of the BakerReport into BP’s ‘Texas Refinery Incident’ and a strong focus onprocess safety. We identified opportunities to reinforce ourapproach and implemented an action plan with oversight from theCentrica Executive Committee. A progress report on those actionswas presented to the Board at its meeting in December.
Although our proactive improvement programmes helped ourbusiness units to achieve their performance targets overall, the Group experienced an increase in accident incidence rates.
This increase can be linked to a concerted campaign over the last 12-18 months to improve incident reporting in our main UK downstream businesses. We will continue to target a year-on-year 4% reduction in time lost from injuries and to supportthose businesses that have consistently reduced or achieved lowinjury incidence rates.
To build on our strong performance, we have developed aprogramme called ‘Performance Plus’ to heighten our performanceexpectations and provide greater resilience in our risk managementsystems through proactive leadership, behavioural change andcontinual challenge and review at all levels.
C$0.5mDirect Energy’s support for the‘Neighbor-to-Neighbor’ programme is helping low-income families
£21mWe have committed more than £21 million to the British Gas Energy Trust since 2004
1.03
0.730.80
05 06 07
Lost-time injuries/100,000 hours worked

CorporateResponsibilityReviewcontinued
32
Centrica plc Annual Report and Accounts 2007
Valuing our people
The calibre and the conduct of our people are central to buildingsuccessful relationships with our customers, shareholders,business partners and the communities in which we operate.
During the year we employed an average of 33,908 people: 28,829 in the UK; 4,839 in North America; and 240 in the rest of the world.
Employee engagementEmployees are regularly updated on our performance against ourstrategy. We want Centrica to be a great place to work and ourengagement survey helps us to measure the attitudes and opinionsof our employees. In 2007 more than 84% of employees respondedand our overall engagement score increased by 3%, demonstratinga high level of commitment from our people. We maintain regulardialogue with representatives of local employee consultative bodiesand recognised trade unions to ensure we fully understandemployees’ views.
Diversity and inclusion We are committed to pursuing equality and diversity in all our activities and we continue to support initiatives to provideemployment opportunities for people from minority groups in the community, including people with a disability, carers and loneparents. For example, we pledged our support to the LocalEmployment Partnerships scheme, which aims to help 250,000disadvantaged people in the UK get back into work.
Following the introduction of the Employment Equality (Age)Regulations 2006, we delivered an awareness and trainingprogramme to enable employees to understand the new legislation,for which we won an award from the Employers’ Forum on Age.
Canada’s Association for the Fifty Plus recognised Direct Energy for the opportunities we have created for older employees. In addition, we received the Alfred P Sloan Award for businessexcellence in workplace flexibility for our programmes in Texas and the Stevie Award for the ‘Best Multinational Company’ in North America.
In the UK we were recognised as an ‘exemplar employer’ by Opportunity Now for our flexible working initiatives and our diversity recruitment strategy for engineers.
Training and development Our British Gas Engineering Academy achieved ‘grade one’performance in an Ofsted inspection. Ofsted commended ourefforts to recruit from underrepresented groups, with femaletrainees accounting for almost 13% of all those recruited in 2007.We also introduced a General Management DevelopmentProgramme. It is an integral part of our talent strategy, which aimsto build our senior management capability and develop successorsfor key roles.
Reward In 2007 we conducted a fifth comparative review of the levels of pay for male and female employees. The results showed that thegender pay gap in Centrica is much narrower than publishednational norms. We were the first organisation to enable UKemployees to make a direct contribution to fighting climate changevia their flexible benefits allowance which offers a personal carbonoffset in partnership with Pure, the Clean Planet Trust.
We encourage our employees to own shares in the company byoperating a number of all-employee share schemes. In the UK12,186 employees participated in Sharesave and 5,873 participatedin our Share Incentive Plan. In North America1,100 employeesparticipated in our Employee Share Purchase Plan.
We also operate a Share Award Scheme and a Restricted ShareScheme. Participation in these share schemes is on a highlyselective basis at the discretion of the Chief Executive and GroupDirector, Human Resources. Neither the Executive Directors nor the next tier of executive management is eligible to participate.Further information on these schemes is given in note 33 to theFinancial Statements on page 118.
Investing in communities
By understanding our impact on the communities in which wework, we can develop successful partnerships of mutual benefit.We aim to deepen our understanding of social and environmentalissues and contribute to action that addresses them. We do this by supporting outside agencies and encouraging our ownemployees to get involved.
In 2007 we contributed £5.2 million6 to community causes through a combination of cash, time and in-kind support5. Across theCompany, our people invested more than18,000 hours in volunteeringactivities, which equates to more than £260,000 of in-kind support.
In June a memorial service was held for those who lost their lives inthe Morecambe Bay helicopter tragedy on 27 December 2006. Thefirst donation from the fund, set up in memory of those who died,was made to North West Air Ambulance and a memorial stone wasunveiled outside our Heysham base.
Direct Energy completed its three-year support of ‘Youthworks’, an initiative tackling homelessness among young people, run byCanadian charity Raising The Roof. In Canada, we supportedHabitat for Humanity’s first EnergyStar® building project with afinancial donation and products including high-efficiency furnaces.
In addition, British Gas launched the third phase of ‘HelpYourselves’ in partnership with Save the Children. The schemeprovides grants to young people to tackle issues of social exclusionin their local communities – www.helpyourselves.org.uk.

33
Directors’ R
eport – Business R
eviewFinancial S
tatements
Shareholder Inform
ation
33 Directors’ Report – Governance34 Board of Directors and Executive team36 Corporate Governance Report41 Other Statutory Information
42 Remuneration Report
52 Independent Auditors’ Report
Directors’ R
eport – Governance

Governance
34
Board of Directorsand Executive team
Centrica plc Annual Report and Accounts 2007
Board of Directors
1. Roger CarrChairman (61) * †Roger Carr joined the Board as a Non-Executive Director in January 2001. He was appointed Chairman of the Board in May 2004 and is Chairmanof the Nominations Committee. He is Chairman of Mitchells & Butlers plc,Deputy Chairman of Cadbury Schweppes plc and a senior adviser toKohlberg Kravis Roberts & Co Ltd. In June 2007, he was appointed Non-Executive Director of the Court of the Bank of England.
2. Sam LaidlawChief Executive (52) ■ ● ◆ *Sam Laidlaw joined Centrica plc as Chief Executive in July 2006. He isChairman of the Executive Committee and the Disclosure Committee. He was previously Executive Vice President of the Chevron Corporation,Chief Executive Officer at Enterprise Oil and President and ChiefOperating Officer at Amerada Hess. In January 2008 he was appointed a Non-Executive Director of HSBC Holdings plc. Until August 2007 hewas a Non-Executive Director of Hanson plc. He is Trustee of the medicalcharity RAFT and a Director of the Business Council for InternationalUnderstanding.
3. Helen Alexander CBENon-Executive Director (51) ▲ * †Helen Alexander joined the Board in January 2003 and is Chairman of the Remuneration Committee. She is Chief Executive of The EconomistGroup, a Trustee of the Tate Gallery and an Honorary Fellow of HertfordCollege, Oxford. In September 2007 she was appointed a Non-ExecutiveDirector of Rolls-Royce plc. Formerly, she was a Non-Executive Directorof BT Group plc and Northern Foods plc.
4. Phil BentleyManaging Director, British Gas (49) ■ ◆Phil Bentley joined Centrica plc as Group Finance Director in November2000, a position he held until the end of February 2007 when he was
appointed Managing Director, British Gas. He was also ManagingDirector, Europe between July 2004 and September 2006. Formerly, hewas Finance Director of UDV Guinness from 1999 and Group Treasurerand Director of Risk Management of Diageo plc from 1997. Previously, hespent 15 years with BP plc in various international oil and gas explorationroles. He is also a Non-Executive Director and the Chairman of the AuditCommittee of Kingfisher plc.
5. Mary Francis CBESenior Independent Director (59) ▲ ■ * †Mary Francis joined the Board in June 2004 and is Senior IndependentDirector and Chairman of the Corporate Responsibility Committee. Sheis a Non-Executive Director of Aviva plc, St. Modwen Properties plc andAlliance & Leicester plc, and a Director of the Almeida Theatre. She is aformer Director General of the Association of British Insurers, a formerNon-Executive Director of the Court of the Bank of England and was a senior civil servant in the Treasury and the Prime Minister’s Office.
6. Nick LuffGroup Finance Director (40) ● ◆Nick Luff joined Centrica plc as Group Finance Director in March 2007.He was previously Chief Financial Officer of The Peninsular & OrientalSteam Navigation Company (P&O) and has held a number of other senior financial roles at P&O having qualified as a chartered accountantat KPMG. He is a Non-Executive Director of QinetiQ Group plc.
7. Andrew MackenzieNon-Executive Director (51) ▲ ■ * †Andrew Mackenzie joined the Board in September 2005. In November2007 he was appointed Group Executive and Chief Executive NonFerrous at BHP Billiton, a position he will take up during 2008. From 2004he was with Rio Tinto plc, latterly as Chief Executive Diamonds andMinerals. Previously, he spent 22 years with BP plc in a range of seniortechnical and engineering positions, and ultimately as Group VicePresident, BP Petrochemicals. From 2005 to 2007 he was Chairman ofthe Board of Trustees of the think tank, Demos, and he remains a Trustee.
1 2 3
7 8 9 10

35
Directors’ R
eport – Business R
eviewD
irectors’ Report – G
overnanceFinancial S
tatements
Shareholder Inform
ationCentrica plc Annual Report and Accounts 2007
8. Paul RaynerNon-Executive Director (53) ▲ * †Australian citizenPaul Rayner joined the Board in September 2004 and is Chairman of the Audit Committee. He has been Finance Director of British American Tobacco plc since January 2002. In 1991 he joinedRothmans Holdings Ltd in Australia, holding senior executive appointments,and became Chief Operating Officer of British American TobaccoAustralasia Ltd in September 1999.
9. Jake UlrichManaging Director, Centrica Energy (55) ◆Jake Ulrich was appointed to the Board in January 2005. He wasappointed Managing Director, Centrica Energy in 1997. He assumedresponsibility for the Group’s activities in continental Europe inSeptember 2006. Between 1994 and 1997 he was Managing Director ofAccord Energy Ltd, a joint venture between Natural Gas Clearinghouse(NGC) and British Gas plc. He previously worked for NGC, Union CarbideCorporation and the OXY/Mid Con/Peoples Energy Group.
10. Paul WalshNon-Executive Director (52) ▲ * †Paul Walsh joined the Board in March 2003. He is Chief Executive ofDiageo plc, having previously been its Chief Operating Officer and havingserved in a variety of management roles. He is a Non-Executive Directorof Federal Express Corporation, a Governor of the Henley ManagementCentre and Deputy Chairman of the Prince of Wales InternationalBusiness Leaders Forum.
Key to membership of committees▲ Audit Committee■ Corporate Responsibility Committee● Disclosure Committee ◆ Executive Committee * Nominations Committee† Remuneration Committee
Executive team
11. Grant DawsonGeneral Counsel and Company Secretary (48) ● ◆Grant Dawson has been General Counsel and Company Secretary of Centrica since the demerger from British Gas plc in February 1997,having joined British Gas in October 1996.
12. Deryk KingManaging Director, Centrica North America (60) ■ ◆Deryk King is responsible for all of Centrica’s activities in North America.He joined Centrica in September 2000, having previously been GroupManaging Director of Powergen plc.
13. Catherine MayGroup Director, Corporate Affairs (43) ■ ◆Catherine May joined Centrica as Group Director, Corporate Affairs inSeptember 2006, having previously been Group Director of CorporateRelations for Reed Elsevier.
14. Anne Minto OBEGroup Director, Human Resources (54) ◆Anne Minto was appointed Group Director, Human Resources in October 2002. Prior to that she was Director, Human Resources forSmiths Group plc, a position which she held since early 1998.
15. Chris WestonManaging Director, British Gas Services (44) ◆Chris Weston was appointed Managing Director, British Gas Services inJune 2005. Prior to this he was Managing Director, British Gas Businessfrom January 2002.
5 6
11 12 13 14 15
4
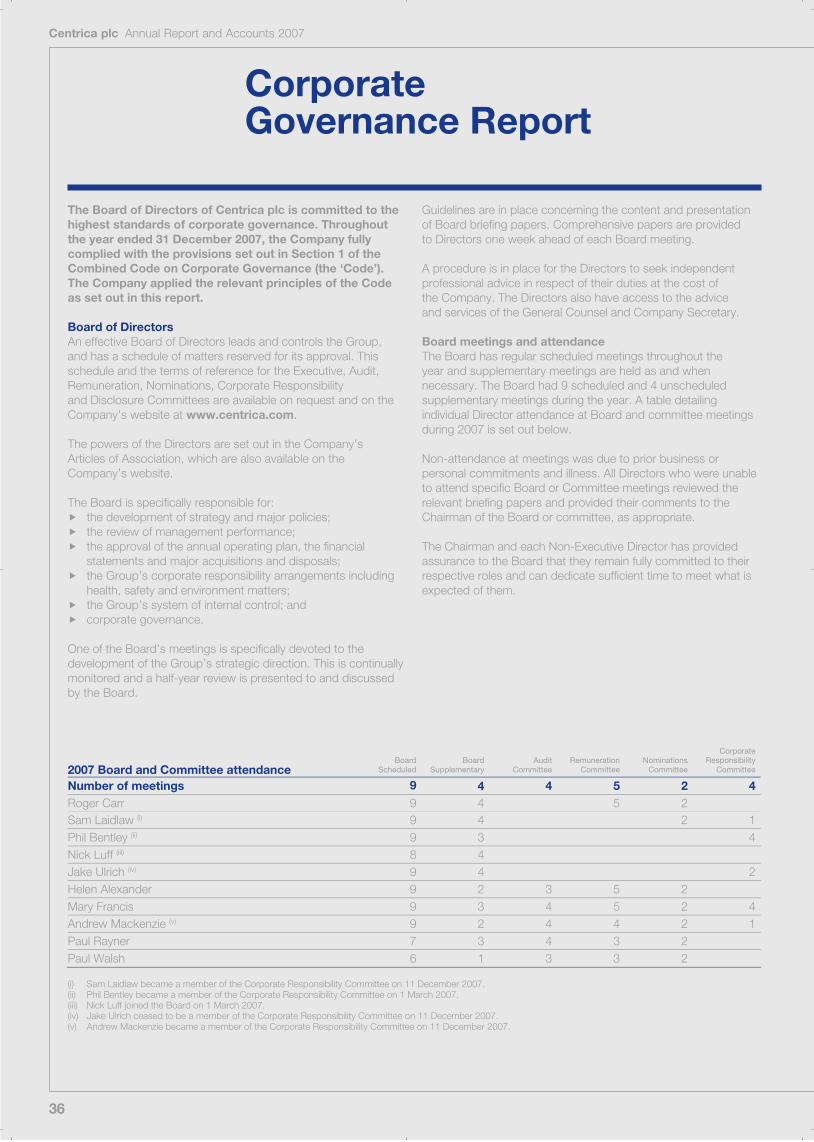
36
Centrica plc Annual Report and Accounts 2007
Corporate Governance Report
The Board of Directors of Centrica plc is committed to the highest standards of corporate governance. Throughout the year ended 31 December 2007, the Company fully complied with the provisions set out in Section 1 of the Combined Code on Corporate Governance (the ‘Code’). The Company applied the relevant principles of the Codeas set out in this report.
Board of Directors An effective Board of Directors leads and controls the Group, and has a schedule of matters reserved for its approval. This schedule and the terms of reference for the Executive, Audit, Remuneration, Nominations, Corporate Responsibility and Disclosure Committees are available on request and on the Company’s website at www.centrica.com.
The powers of the Directors are set out in the Company’s Articles of Association, which are also available on the Company’s website.
The Board is specifically responsible for: � the development of strategy and major policies; � the review of management performance; � the approval of the annual operating plan, the financial
statements and major acquisitions and disposals; � the Group’s corporate responsibility arrangements including
health, safety and environment matters; � the Group’s system of internal control; and � corporate governance.
One of the Board’s meetings is specifically devoted to the development of the Group’s strategic direction. This is continually monitored and a half-year review is presented to and discussed by the Board.
Guidelines are in place concerning the content and presentation of Board briefing papers. Comprehensive papers are provided to Directors one week ahead of each Board meeting.
A procedure is in place for the Directors to seek independent professional advice in respect of their duties at the cost of the Company. The Directors also have access to the advice and services of the General Counsel and Company Secretary.
Board meetings and attendance The Board has regular scheduled meetings throughout the year and supplementary meetings are held as and when necessary. The Board had 9 scheduled and 4 unscheduledsupplementary meetings during the year. A table detailing individual Director attendance at Board and committee meetings during 2007 is set out below.
Non-attendance at meetings was due to prior business or personal commitments and illness. All Directors who were unable to attend specific Board or Committee meetings reviewed the relevant briefing papers and provided their comments to the Chairman of the Board or committee, as appropriate.
The Chairman and each Non-Executive Director has providedassurance to the Board that they remain fully committed to their respective roles and can dedicate sufficient time to meet what is expected of them.
2007 Board and Committee attendance Board
Scheduled Board
Supplementary Audit
CommitteeRemuneration
CommitteeNominations
Committee
CorporateResponsibility
Committee
Number of meetings 9 4 4 5 2 4Roger Carr 9 4 5 2Sam Laidlaw (i) 9 4 2 1Phil Bentley (ii) 9 3 4Nick Luff (iii) 8 4Jake Ulrich (iv) 9 4 2Helen Alexander 9 2 3 5 2Mary Francis 9 3 4 5 2 4Andrew Mackenzie (v) 9 2 4 4 2 1Paul Rayner 7 3 4 3 2Paul Walsh 6 1 3 3 2
(i) Sam Laidlaw became a member of the Corporate Responsibility Committee on 11 December 2007. (ii) Phil Bentley became a member of the Corporate Responsibility Committee on 1 March 2007. (iii) Nick Luff joined the Board on 1 March 2007. (iv) Jake Ulrich ceased to be a member of the Corporate Responsibility Committee on 11 December 2007. (v) Andrew Mackenzie became a member of the Corporate Responsibility Committee on 11 December 2007.

37
Directors’ R
eport – Business R
eviewD
irectors’ Report – G
overnanceFinancial S
tatements
Shareholder Inform
ationCentrica plc Annual Report and Accounts 2007
Board membership and appointments The roles of Chairman and Chief Executive are separate and their responsibilities are clearly established, formalised in writing and agreed by the Board. There is also a balance of Executive and independent Non-Executive Directors. The Board of Directors’ biographies including their Board committee membership are set out on pages 34 and 35.
Nick Luff was appointed to the Board as Group Finance Director on 1 March 2007 and was subsequently elected by shareholders at the 2007 Annual General Meeting (AGM). Nick Luff replaced Phil Bentley, who became Managing Director of British Gas on 1 March 2007.
As part of its annual review of corporate governance, the Board considered the independence of the Non-Executive Directors (other than the Chairman) against the criteria specified in theCode and determined that each remained independent.
Mary Francis, the Senior Independent Director, is available to shareholders if they have concerns that contact through the normal channels has either failed to resolve or is inappropriate.
During the year the Non-Executive Directors, including the Chairman, met independently of management on a regular basis.
Full details of Directors’ service contracts, emoluments and share interests are set out in the Remuneration Report onpages 42 to 51.
There is a formal, rigorous and transparent process in place for the appointment of new Directors to the Board. This process is described in the section on the Nominations Committee onpage 39.
In accordance with the Code and the Company’s Articles of Association, all Directors are subject to election by shareholdersat the first AGM following their appointment to the Board and thereafter are subject to re-election every third year. Non-Executive Directors are initially appointed for a three-year termand, subject to rigorous review and re-election, can serve up to a maximum of three such terms. Upon the recommendation of the Nominations Committee, Jake Ulrich, Mary Francis andPaul Rayner will be proposed for re-election at the 2008 AGM,each to serve a further three-year term.
Directors’ insurance and indemnities In accordance with the Company’s Articles of Association, the Company has granted a deed of indemnity, to the extentpermitted by law, to each of the Directors and the General Counsel and Company Secretary. The Company also maintains directors’ and officers’ liability insurance for its Directors and officers.
Board evaluation During the year the Board conducted a formal and rigorous performance evaluation of its own performance and that of its committees and individual Directors, with the assistance of an independent external facilitator, Egon Zehnder International.
The 2007 Board evaluation built upon the positive results and output of such previous exercises and focused on a number of key topics including: � Board structure and composition; � Board dynamics and relationships; � Board meetings; � information flows and decision-making processes; � committees; � people and succession planning; and � reporting to shareholders.
The evaluation process was carried out with one-to-one interviews between the facilitator and each of the Directors and the General Counsel and Company Secretary. In addition, the Senior Independent Director chaired a meeting of the independent Non-Executive Directors in the absence of the Chairman to appraise the Chairman’s performance. The outputfrom those interviews was compiled into a report prepared by the facilitator and this was presented to the Board at its meeting in December 2007, along with a number of recommendationsto address the issues raised.
The evaluation report concluded that the Board and its committees continue to operate effectively and build upon the progress of previous years. A small number of actions and improvements was identified from the evaluation and these will be incorporated into the future Board programme. The report also highlighted the importance of maintaining a focus on key subjects from the Board Planning Conference at future Board meetings.
The Board will continue to review its procedures, its effectiveness and development throughout the year ahead.
As part of the Company’s performance management system that applies to management at all levels across the Group, the Chief Executive’s performance is reviewed regularly by the Chairman and that of the other Executive Directors by the Chief Executive. The Remuneration Committee also assesses the performance of the Executive Directors in connection with its determinationof remuneration levels as explained in the Remuneration Report on pages 42 to 51.
Board trainingAn induction programme tailored to meet the needs of individual Directors is provided for each new Director. Directors also receive training throughout the year.
At Board meetings and, where appropriate, committee meetings, the Directors receive regular updates and presentations on changes and developments to the business, and to the legislative and regulatory environments. During 2007 the Board was briefed on a variety of issues including: � commodity risk and hedging strategy; � the risks and opportunities of upstream exploration activities; � climate change strategy; � improvements to customer service; � Health & Safety – Baker Report review; and � changes introduced by the Companies Act 2006, including
the codification of Directors’ duties.

38
Centrica plc Annual Report and Accounts 2007
Corporate Governance Report continued
Board committees The Board has delegated authority to its committees onspecific aspects of management and control of the Group. Written terms of reference for each of the Board committees have been approved by the Board and published on the Company’s website.
Minutes of committee meetings are made available to all Directors on a timely basis.
All of the independent Non-Executive Directors are members of the Audit, Remuneration and Nominations Committees. This membership structure gives the Non-Executive Directors insight into the nature of the matters being discussed, brings continuity to membership and avoids undue reliance on particular members. The full membership of each committee is detailed within the following committee reports:
Executive Committee During 2007 the Executive Committee comprised the Executive Directors and those key senior managers whose biographical details are set out on pages 34 and 35. Sam Laidlaw is Chairmanof the Committee.
The Committee oversees the management of the Group and is the decision-making body for those matters not specifically reserved to the Board and within the limits set out in the Group’s delegated authority and expenditure control policy.
Following a review of decision-making arrangements during the year, the Committee moved from weekly to monthly meetings from November 2007. At this time, the Committee established a separate Investment Sub-Committee to consider and approve proposed investment opportunities. The core members of the Investment Sub-Committee are Sam Laidlaw, Nick Luff and Grant Dawson with other members of the Executive Committee attending, as appropriate. The Investment Sub-Committee meets on a regular basis as business dictates, and the papers and minutes are made available to all members of the Executive Committee.
The following are also sub-committees of the Executive Committee, with membership drawn from among the Executive Committee members and appropriate senior management: � the Group Risk Management Committee; � the Group Financial Risk Management Committee; and � the Health, Safety and Environment Committee.
Audit Committee During 2007 the Audit Committee comprised Paul Rayner (Chairman), Helen Alexander, Mary Francis, Andrew Mackenzie and Paul Walsh. Paul Rayner, the finance director of a FTSE100 company, is identified as having recent and relevant financial experience, as required by the Code. The Board has determined that the members of the Committee are independent and that the membership meets the requirements of the Code.
In accordance with its terms of reference, the Committee, which reports its findings to the Board, is authorised to: � monitor the integrity of the interim and annual financial
statements, including a review of the significant financial reporting judgements contained in them;
� review the Company’s internal financial controls, internalcontrol and risk management systems;
� monitor and review the effectiveness of the Company’s internal audit function;
� establish and oversee the Company’s relationship withthe external auditors, including the monitoring of their independence; and
� monitor matters raised pursuant to the Company’s whistleblowing arrangements.
During 2007 the Audit Committee met four times and received comprehensive reports from the Director of Business Assurance, senior management and the external auditors, PricewaterhouseCoopers LLP. The Committee also commissioned further reports in response to developing issues, as appropriate, and, in respect of all ongoing issues, requested clear objectives, timetables and achievement milestones against which performance could be measured. The output from each of these meetings was reported by the Committee Chairmanto the next Board meeting.
At each of its scheduled meetings, the Committee met privately with the external auditors, and separately with the Head of Business Assurance.
Significant areas of review by the Committee during the year included: � the new British Gas billing system; � information technology general controls; � risk profile of the Group’s business model and risk mitigation; � the internal financial control improvement programme; � electricity prepayment debt and industry reconciliation
process; and � ongoing compliance with the undertakings in respect
of Centrica Storage Ltd.
The Board has approved policies that restrict the types of non-audit work that can be undertaken by the external auditors and restrict the employment by the Group of former employees of the external auditors. The award of non-audit work, within categories that the external auditors are permitted to carry out under the Board-approved policies, is subject to pre-clearance by the Audit Committee if the fee exceeds specified thresholds. The Group’s policy to seek competitive tenders for all major consultancies and advisory projects is set out in note 7 to the Financial Statements on page 81. In addition, the Committee was provided with reports of all non-audit assignments awarded to the external auditors and, on a quarterly basis, a full breakdown of non-audit fees incurred during the year.
In accordance with International Standard on Auditing (UK & Ireland) 260 and Ethical Statement 1 issued by the Accounting Practices Board and as a matter of best practice, the externalauditors have confirmed their independence as auditors of the Company in a letter addressed to the Directors.

39
Directors’ R
eport – Business R
eviewD
irectors’ Report – G
overnanceFinancial S
tatements
Shareholder Inform
ationCentrica plc Annual Report and Accounts 2007
Remuneration Committee A report detailing the composition, responsibilities and work carried out by the Remuneration Committee during the year,including an explanation of how it applies the principles of theCode in setting Executive Directors’ remuneration, is included within the Remuneration Report on pages 42 to 51.
Nominations Committee During 2007 the Nominations Committee comprised Roger Carr (Chairman), Helen Alexander, Mary Francis, Sam Laidlaw, Andrew Mackenzie, Paul Rayner and Paul Walsh. Throughout the year a majority of the Committee’s members were independent Non-Executive Directors.
The Committee is responsible for making appropriate recommendations to the Board for the appointment of replacement or additional Directors. It is also responsible for succession planning and Board evaluation. In making its recommendations, the Committee reviews the balance of skills, knowledge and experience on the Board against current and future requirements of the Company and, as appropriate, draws up a list of required attributes.
The Committee met twice during the year and considered the proposed appointment of a new Group Finance Director, Nick Luff, as replacement for Phil Bentley. The Committee also considered: � the reappointment of Directors retiring by rotation at the
2007 AGM; � senior management succession planning; and � talent management.
Corporate Responsibility Committee During 2007 the Corporate Responsibility Committee comprised Mary Francis (Chairman), Phil Bentley (from 1 March 2007), Deryk King, Sam Laidlaw (from 11 December 2007), Andrew Mackenzie (from 11 December 2007) and Catherine May. Ian Peters and John Way ceased to be members of the Committee on 1 March 2007 and 31 July 2007 respectively. Mark Crosbie, Grant Dawson, Anne Minto, Jake Ulrich and Chris Westonceased to be members of the Committee on 11 December 2007. A report detailing the work carried out by the CorporateResponsibility Committee during the year is included within the Corporate Responsibility section on pages 28 to 32.
At its November meeting, the Board approved the Committee’s revised terms of reference and membership.
Disclosure Committee The Disclosure Committee, which met on a number of occasions throughout the year, comprised Sam Laidlaw, Nick Luff (from 1 March 2007) and Grant Dawson. Phil Bentley was a member of the Committee until 28 February 2007. The Committee is responsible for implementing and monitoring systems and controls in respect of the management and disclosure of inside information.
Relations with shareholders The Board recognises the importance of maintaining an effective investor relations and communication programme as part of its ongoing relationship with the Company’s shareholders.
Centrica’s website contains a wealth of up-to-date informationfor shareholders including share price information, news releases, annual reports, speeches from the AGM, presentations to the investment community and a section on shareholder services.
At its 2007 AGM, the Company passed a resolution allowingthe website to be used as the primary means of communication with its shareholders. This facility provides significant benefits forshareholders and the Company. Shareholders can still opt to receive their communications in a paper format.
The AGM provides all shareholders with the opportunity to develop their understanding of the Company and ask questions of the Board on the matters put to the meeting, including this Annual Report and Accounts. At the AGM, the Chairman and the Chief Executive present a review of the Group’s business. All shareholders also have the opportunity to cast their votes in respect of proposed AGM resolutions by proxy, either electronically or by post, at least 48 hours before the start of the meeting.
The Chief Executive and Group Finance Director hold regular meetings with the Company’s major shareholders. The Chairman and the Senior Independent Director attend the meetings at which the annual and interim results are presented to major investors and analysts. The Chairman also met a number of major institutional shareholders during the year to gain a first-hand understanding of any issues or concerns they may have had.
Formal reports of investor feedback are included in the papersfor each Board meeting. The Board also commissioned an external survey of investors in order to assist in developing anunderstanding of the views of major shareholders. The results of this survey were circulated to the Directors.
Risk management and internal control The Board regards the identification and assessment of risks, together with the mitigating internal controls, to be fundamental to achieving the Group’s strategic objectives. It either directly or through its committees, sets objectives, performance targets and policies for management of key risks facing the Group. The Board has overall responsibility for the Group’s system of internal control and risk management, which is designed to manage rather thaneliminate the risk of failure to achieve the objectives and can provide only reasonable, and not absolute, assurance against material misstatement or loss.
Across the Group, each business has a Risk Management Committee that seeks to identify, assess and advise on the management of risks. These assessments are reported to the Group Risk Management Committee to develop the Company’s overall risk profile including those risks that might affect the Company at a Group level. Where significant risks have been identified, a control infrastructure has been established to ensure day-to-day monitoring and management of risks. Centrica Storage Ltd, which is subject to undertakings given to the
40
Centrica plc Annual Report and Accounts 2007
Corporate Governance Report continued
Secretary of State for Business, Enterprise and Regulatory Reform,operates separately but to the same standards of internal controland risk management as the rest of the Group. The processes of newly acquired companies are integrated with those of the Group.
At each of its four meetings in 2007, the Audit Committee received a Group Risk Report providing an assessment of the key risks facing the Company including the adequacy of the associated controls. Details of the principal risks and uncertainties are set out on pages 25 to 27 of this report. In addition, the Audit Committee is provided with the results of internal audit reviews conducted by the Business Assurance function according to a plan approved by the Committee. These reports, supplemented by management presentations, enable the Audit Committee to track a number of issues, monitor performance against objectives and ensure that necessary actions were taken to remedy any significant failings or weaknesses identified from those reports. The Chairman of the Audit Committee reported the issues discussed and conclusions reached at the following Board meeting.
The Board’s review of the system of internal control A process of hierarchical self-certification has been established throughout the Group whereby the effectiveness of internal controls and compliance with Group business principles and policies is assessed. The results of this certification process, together with the conclusions of the internal reviews by business assurance, informs the annual assessment performed by the Audit Committee.
The Board, with the advice of the Audit Committee, has reviewed the effectiveness of the system of internal control, for the period from 1 January 2007 to the date of this report, and is satisfied that the Group complies with the Turnbull Guidance. The Board will continue to routinely challenge management to ensure thesystem of internal control is constantly improving.
Going concernAfter making enquiries, the Board has a reasonable expectation that the parent Company and the Group as a whole has adequate resources to continue in operational existence for the foreseeable future. For this reason, we continue to adopt the going concernbasis in preparing the Financial Statements, which are shown onpages 54 to 148.
Directors’ responsibility statement The Directors are responsible for preparing, in respect of each financial year, the Annual Report and Group Financial Statements. They are also responsible for ensuring that the Financial Statements give a true and fair view and that they have beenproperly prepared in accordance with applicable law and International Financial Reporting Standards (IFRS) as adopted by the European Union.
The Group Financial Statements have been prepared in accordance with the Companies Act 1985 and IFRS pursuant to Article 4 of the IAS Regulations. The Parent Company Financial Statements have been prepared in accordance with the Companies Act 1985 and United Kingdom Generally Accepted Accounting Practice. The Directors’ Report and the RemunerationReport have been prepared in accordance with the Companies Act 1985 and the UK Listing Authority Listing Rules.
In preparing the Financial Statements the Directors are required to: � select suitable accounting policies and then apply
them consistently; � make judgements and estimates that are reasonable
and prudent; � state whether applicable accounting standards have been
followed, subject to any material departures disclosed and explained in the Financial Statements; and
� prepare the Financial Statements on the going concern basis, unless it is inappropriate to presume that the Group will continue in business.
The Directors confirm that they have complied with the above requirements in preparing the Financial Statements.
The Directors are responsible for keeping proper accounting records that disclose with reasonable accuracy at any time the financial position of the Company and the Group and enablethem to ensure that the Financial Statements comply with the Companies Act 1985. They are also responsible for safeguarding the assets of the Company and the Group and hence for taking reasonable steps for the prevention and detection of fraud and other irregularities.
Disclosure of information to auditorsEach of the Directors who held office at the date of approval of this Directors’ Report confirm that: so far as he/she is aware, there is no relevant audit information of which the Company’s auditors are unaware; and he/she has taken all steps that he/she ought to have taken as a Director to make him/herself aware of any relevant audit information and to establish that the Company’s auditors are aware of that information.

41
Directors’ R
eport – Business R
eviewD
irectors’ Report – G
overnanceFinancial S
tatements
Shareholder Inform
ationCentrica plc Annual Report and Accounts 2007
41
Other Statutory Information
Major acquisitions and disposals Full details of acquisitions and disposals are disclosed in theBusiness Review on pages 8 to 22 and note 35 to the Financial Statements on page 130.
Events after the balance sheet date Events after the balance sheet date are disclosed in note 39 tothe Financial Statements on page 137.
Related party transactions Related party transactions are set out in note 37 to the Financial Statements on pages 134 and 135.
Creditor payment policy It is the Group’s policy to: � agree the terms of payment in advance with the supplier; � ensure that suppliers are aware of the terms of payment; and � pay in accordance with contractual and other legal
obligations.
The number of days’ purchases outstanding as at 31 December 2007 was 37 (2006: 32) for the Group (excludingAccord Energy Ltd) and 28 (2006: 32) for the Company.
Share capital The Company’s authorised and issued share capital as at 31 December 2007, together with details of shares issued during the year, is set out in note 29 to the Financial Statements on page 112. Each ordinary share of the Company carries one vote.
Authority to purchase shares The Company was authorised at the 2007 AGM to purchase its own shares, within certain limits and as permitted by the Articles of Association. A renewal of this authority will be proposed at the 2008 AGM. Shares repurchased may be cancelled or retained as treasury shares to accommodate requirements for shares under the Group’s share incentive schemes. No shares were purchased under this authority during 2007.
Material shareholdings At 20 February 2008, Centrica had received notification of thefollowing material shareholdings pursuant to the Disclosure and Transparency Rules:
Ordinary shares% of share
capital Nature of
holding
Legal & General Group 194,972,537 5.30 Direct
Legal & General Group 18,637,022 0.51 Indirect
Petronas 145,000,000 3.94 Direct
Auditors PricewaterhouseCoopers LLP have expressed their willingness to be reappointed as auditors of the Company. Upon the recommendation of the Audit Committee, resolutions to reappoint them as the Company’s auditors and to authorise the Directors to determine their remuneration will be proposed at the AGM.
This Directors’ Report comprising pages 8 to 41 has beenapproved by the Board and signed on its behalf by:
Grant Dawson General Counsel and Company Secretary 21 February 2008 Registered office: Millstream Maidenhead Road Windsor Berkshire SL4 5GD Company registered in England and Wales No. 3033654

42
Centrica plc Annual Report and Accounts 2007
Remuneration Report
Composition and role of the Remuneration CommitteeThroughout 2007, the Remuneration Committee comprised Helen Alexander (Chairman), Roger Carr, Mary Francis, Andrew Mackenzie, Paul Rayner and Paul Walsh. The Committee met five times during the year. Its terms of reference are available at www.centrica.com.
The Committee makes recommendations to the Board, withinformal terms of reference, on the policy and framework of executive remuneration and its cost to the Company. The Committee is also responsible for the implementation of remuneration policy and determining specific remuneration packages for each of the Executive Directors. It has access to the advice and views of the Group Reward Director (CathyAldwinckle), the Group Human Resources Director (Anne Minto), the General Counsel and Company Secretary (Grant Dawson), the Chief Executive (Sam Laidlaw) and external consultants.
At its meetings in 2007, the Committee considered, amongst other things, the following: � the 2006 Remuneration Report; � the achievement of the performance targets in respect of
the 2006 AIS and the vesting of existing awards made under the long-term share-based incentive arrangements;
� levels of base salary; � the setting of levels of award and performance targets in
respect of the 2007 AIS and awards made under the long-term share-based incentive arrangements;
� the proposed terms of appointment of the new Group Finance Director; and
� the effectiveness of the annual incentive scheme (AIS).
During the year, Kepler Associates (Kepler) acted as independent executive remuneration adviser to the Committee, having been formally appointed in 2005. Kepler provided advice on executive compensation to assist in the formulation of the Committee’s recommendations. The Committee also consulted, but did notformally appoint, Towers Perrin.
This report, which will be submitted to the forthcoming Annual General Meeting (AGM) for approval, explains how the Company has applied the principles of the Combined Code on Corporate Governance (the ‘Code’) that relate to directors’ remuneration during the year. No Director is involved in the determination of,or votes on any matter relating to, his or her own remuneration.
Executive Directors’ remuneration policy and framework It is the role of the Committee to ensure that the Group’s remuneration policy and framework provides competitive reward for its Executive Directors and other senior executives, taking into account the Company’s performance, the markets in which it operates and pay and conditions elsewhere in the Group.
In constructing the remuneration packages, the Committee aims to achieve an appropriate balance between fixed and variablecompensation for each executive. Accordingly, a significant proportion of the remuneration package depends on the attainment of demanding performance objectives, both short and long-term. The AIS is designed to incentivise and rewardthe achievement of demanding financial and business-related
objectives. Long-term share-based incentives are designed to align the interests of Executive Directors and other senior executives with the longer-term interests of shareholders by rewarding them for delivering sustained, increased shareholder value.
The Committee reviews the packages and varies individual elements when appropriate from year to year. Those reviews are conducted with the assistance of Kepler and the internal advisers named above to ensure that the remuneration arrangements continue to provide a strong alignment with the achievement of strategic objectives and the delivery of value to shareholders; reflect current best practice, while meeting the Group’s particular business needs; and enable the Group to continue to attract and retain high calibre management in a highly challenging businessenvironment. In agreeing the level of base salaries and the performance-related elements of the remuneration package, the Committee considers the potential maximum remuneration that executives could receive.
Having conducted a review against those criteria, the Committee proposed changes in 2006 to the future policy and framework of executive remuneration arrangements, which were endorsed by shareholders upon the approval of the Remuneration Report and new share-based incentive schemes at the 2006 AGM. These new arrangements were fully implemented in 2007 and are described in this report.
In 2007, the Committee conducted a review of the overall effectiveness of the AIS including: the appropriateness of the architecture to ensure that the targets set in the future would satisfy the criteria described above; the robustness of the targets and their evaluation; the target and maximum levels as a proportion of total reward and the degree of stretch in the targets compared with other FTSE 50 companies. Following that review, the Committee approved a number of changes to the AIS architecture and target setting for future years. It was agreed in respect of the Executive Directors that consideration shouldbe given to increasing the target and maximum AIS levels, withsome of the increase being linked to individual performance asmeasured by robust, stretching personal objectives. It was also agreed to introduce a differential in the maximum bonus opportunity between the Chief Executive and the other Executive Directors.
In 2007, executive remuneration comprised base salary, AIS, an allocation of shares under the Long Term Incentive Scheme(LTIS), and an allocation of shares under the new Deferred andMatching Share Scheme (DMSS). No Executive Share Option Scheme (ESOS) grants were made during the year, although the Committee retains the discretion to make grants under the ESOS in the future if there are exceptional circumstances in which it considers it is appropriate to do so.
A minimum shareholding policy requires the retention of a value of shares as follows: the Chief Executive – twice his base salary; all other Executive Directors – 1.25 times their base salary; and executives immediately below Board level – base salary. Achievement against this requirement for Executive Directors is set out in the table on page 48.

43
Directors’ R
eport – Business R
eviewD
irectors’ Report – G
overnanceFinancial S
tatements
Shareholder Inform
ationCentrica plc Annual Report and Accounts 2007
The Centrica Management Pension Scheme (CMPS)(a contributory final salary arrangement) was closed to new employees on 30 June 2003. Executive Directors in office prior to this date participated in that scheme during 2007. Alternative arrangements are made for new employees, including Executive Directors, after that date. Full disclosure of the pensionarrangements for the Executive Directors is given on page 51.
The Committee believes that these arrangements, which are further explained below, are important in providing a potential remuneration package that will attract, retain and continue to motivate Executive Directors and other senior executives in a marketplace that is challenging and competitive in both commercial and human resource terms. It is currently intendedthat this remuneration policy and framework, which is fully endorsed by the Board, will continue for 2008 and thereafter.
In 2007, the total emoluments of the Executive Directors, detailed on page 47, consisted of components in the following proportions:
Relative proportions of the components of each Executive Director’s remuneration (%): 2007
Note: Salary and benefits are the actual amounts received during 2007; other payments include a salary supplement in lieu of pension paid to Sam Laidlaw and Nick Luff – see page 51; pension,for those Directors in the Centrica Management Pension Scheme, is the increase in actual transfer value for 2007 over the notional transfer value for 2006 less the Director’s contributions during2007; pension for Sam Laidlaw is the actual amount of the contribution made by the Companyto his personal pension; AIS is that payable in respect of 2007 as reflected in the emoluments table on page 47; and DMSS and LTIS are the estimated value in accordance with note 2 to the Financial Statements on page 61, of the awards made in 2007, provided that all performance conditions are met in full at the end of the relevant performance periods.
The total emoluments of the five senior executives immediately below Board level for 2007, calculated on the same basis as the emoluments of the Executive Directors detailed on page 47, fell into the following bands:
Bands £000 No. of senior executives
900–1,000 1800–900 –700–800 1600–700 2500–600 1
Components of remuneration Base salaryThe Committee seeks to establish a base salary for each Executive Director and other senior executives, determined byindividual performance and having regard to market salary levels for similar positions in comparable companies derived from independent sources. Base salaries are reviewed annually. For members of the CMPS, base salary is the only element of remuneration that is pensionable.
Annual Incentive Scheme (AIS) At the beginning of each year, the Committee reviews the AIS to ensure that it remains competitive in the marketplace, continues to incentivise the Executive Directors and other executives and aligns their interests with those of shareholders. For 2007, the maximum bonus payable to Executive Directors, should every element of every objective be achieved in full, was 125% of base salary. The maximum bonus payable to executives immediately below Board level, assuming all objectives are achieved in full,ranges between 100% and 125%. In 2007, the maximum achievable bonus related to financial performance targets andbusiness-related targets, split 64% and 36% respectively for Executive Directors and 60% and 40% respectively for executives immediately below Board level. From 2007 20% of any annual bonus paid is deferred automatically and invested in the DMSS (see below). In line with current policy, a bonus will be forfeited if overall performance is deemed to be unsatisfactory. The Committee will also take into consideration performance inrelation to corporate responsibility including health, safety andenvironmental matters when determining the level of bonuses to be paid.
In 2008, the maximum bonus opportunity will be 180% of basesalary for the Chief Executive and 150% of base salary for the other Executive Directors.
Deferred and Matching Share Scheme (DMSS) Following approval at the 2006 AGM, an initial award under the DMSS was made in 2007 to Executive Directors and other seniorexecutives. 20% of the annual bonus payable was deferredautomatically for a period of three years and invested in Centricashares (deferred shares), during which time they cannot bewithdrawn. Participants were given the opportunity to invest anadditional amount in Centrica shares (investment shares) to befunded from the actual bonus payable which, when added tothe value of the deferred shares, would bring the total amountinvested up to 50% of the individual’s maximum bonus entitlement inrespect of 2006. The Remuneration Committee approved certaininitial arrangements in respect of Sam Laidlaw (who joined the Company on 1 July 2006 and whose bonus was paid in respect of a half-year only) and Nick Luff (who joined the Company on 1 March 2007 and therefore was not entitled to a bonus in respect of 2006) to ensure that they were incentivised on the same basis as the other Executive Directors. These arrangements, which are explained indetail in the footnotes to the table on page 49, involved those participants investing their own funds into the scheme as investmentshares up to an amount equal to 50% of the maximum bonus opportunity that they would have been entitled to had they beenemployed throughout 2006. Deferred and investment shares were matched with conditional shares (matching shares), which will bereleased upon the achievement of a performance target (see table onpage 44). For the purposes of matching, the investment shares are grossed up for income tax and National Insurance contributions. To provide a closer alignment with the interests of shareholders, the number of matching shares that are released following thesatisfaction of the performance condition will be increased to reflect the dividends that would have been paid during the three-yearperformance period. In the event of a change of control the numberof matching shares that vest will be subject to time-apportionmentin line with best practice.
Nick LuffJake Ulrich
Sam LaidlawPhil BentleyCurrent Directors 0 20 40 60 80 100
Salary Benefits PensionAdditional PaymentAIS DMSS and LTIS

44
Centrica plc Annual Report and Accounts 2007
Remuneration Report continued
Long Term Incentive Scheme (LTIS) Conditional allocations of shares up to a maximum of 200% of base salary may be made to Executive Directors and other senior executives under the LTIS approved by shareholders at the 2006 AGM.
In 2007, LTIS allocations equal to 200% of base salary were awarded to Executive Directors and, at lower rates, to other senior executives. Before approving the maximum permitted allocation of LTIS for the Executive Directors, the RemunerationCommittee carefully considered the adjusted earnings per share (EPS) performance condition attaching to the award to ensure it was sufficiently stretching. Having reviewed the challenging growth and cost reduction targets inherent in the strategic plan, the Committee concluded that the proposed EPS growth target (to exceed the Retail Prices Index (RPI) by 30% or more over the
performance period for full vesting) was sufficiently stretching, but nevertheless agreed that a proportion of the increased award should be subject to an even more demanding performance condition as summarised below. The maximum number of shares that could be transferred to each Executive Director upon satisfaction of the performance conditions in full appears on page 49. The release of allocations will be subject to the performance conditions set out in the table below.
To create a closer alignment with the interests of shareholders, the number of shares that are released following the satisfaction of the performance conditions will be increased to reflect the dividends that would have been paid during the three-year performance period. In the event of a change of control the number of shares that vest will be subject to time-apportionment in line with best practice.
Performance Condition Summary
Deferred and Matching Share Scheme
Award Year Vesting Criteria Performance Condition over three-year period
2007 100% of matching shares on three-year 2:1 match will be achieved for cumulative EP growth of 25% or more.cumulative group economic performance Zero matching for no cumulative EP growth. Vesting of matching sharesprofit (EP) performance targets will increase on a straight-line basis between points.
Long Term Incentive Scheme
Award Year Vesting Criteria Performance Condition over three-year period
2007 50% on EPS† growth against RPI growth 37.5%; full vesting for EPS† growth exceeding RPI growth by 30%. Zero vesting if EPS† growth fails to exceed RPI growth by 9%. Vesting willincrease on a straight-line basis between 25% and 100% if EPS† growthexceeds RPI growth by between 9% and 30%.
12.5%; full vesting for EPS† growth exceeding RPI growth by 40%. Zero vesting if EPS† growth fails to exceed RPI growth by 20%. Vesting will increase on a straight-line basis between 25% and 100% if EPS† growth exceeds RPI growth by between 20% and 40%.
50% on TSR against FTSE 100* Full vesting for upper quintile ranking. Zero vesting for sub-median ranking. Vesting will increase on a straight-line basis for ranking between median and upper quintile.
2006 50% on EPS† growth against RPI growth Full vesting for EPS† growth exceeding RPI growth by 30%. Zero vesting if EPS† growth fails to exceed RPI growth by 9%. Vesting will increase on a straight-line basis between 25% and 100% if EPS† growth exceedsRPI growth by between 9% and 30%.
50% on TSR against FTSE 100* Full vesting for upper quintile ranking. Zero vesting for sub-median ranking.Vesting will increase on a straight-line basis for ranking between medianand upper quintile.
2004–2005 100% on TSR against FTSE 100* Full vesting for upper quartile ranking. Zero vesting for sub-median ranking.Vesting will increase on a sliding-scale basis for ranking between medianand upper quartile.
Executive Share Option Scheme
Award Year Vesting Criteria Performance Condition over three-year period
2001–2006 100% of options based on EPS† growth Full vesting for EPS† growth exceeding RPI growth by 18%. Zero vestingagainst RPI growth. Retesting for further if EPS† growth fails to exceed RPI growth by 9%. Vesting will increase two years for options granted up to and on a straight-line basis between 40% and 100% if EPS† growth exceedsincluding April 2004. RPI growth by between 9% and 18%.
* The Committee has determined that, for the pre 2006 LTIS and for that part of the new LTIS subject to the comparative TSR performance conditions, the most appropriate comparator group for the Companyis the companies comprising the FTSE 100 at the start of the relevant performance period (the LTIS comparator group).
† EPS represents the Group's adjusted earnings per share.

45
Directors’ R
eport – Business R
eviewD
irectors’ Report – G
overnanceFinancial S
tatements
Shareholder Inform
ationCentrica plc Annual Report and Accounts 2007
Prior to 2006, allocations of shares were made annually to Executive Directors and other senior executives under the old LTIS, in accordance with the remuneration policy adopted in 2001. Such allocations were subject to a performance condition as set out in the table below.
Prior to the release of share allocations under both the old and new LTIS arrangements, the Committee reviews whether theextent to which the performance conditions have been achieved is a genuine reflection of the Company’s financial performance. In assessing the extent of satisfaction of the performance conditions, the Committee uses data provided by Alithos Ltd (an independent third party) in respect of comparative TSR and audited figures in respect of EPS.
Executive Share Option Scheme (ESOS) No grants of options were made during 2007. Details of options granted prior to 2007 and still held by Executive Directors are shown on page 50.
If, and to the extent that, performance conditions are satisfied,options normally become exercisable three years after the date of grant and remain so until the tenth anniversary of grant.
The EPS performance conditions in respect of options granted from 2001 to March 2004 under the ESOS (as set out in the table on page 44) can be measured annually for a further two years from the date of grant of the options, with the performance conditions increasing proportionately. Having reviewed market practice, the Committee removed the provision for retesting of performance measures in respect of all option grants from September 2004.
Performance conditions under IFRS Following the adoption of IFRS in 2005, the Committee agreed, having taken advice from Kepler and having consulted withthe ABI and the RREV, to continue: with the financial target of economic profit in respect of the AIS and new DMSS; and EPS in respect of the ESOS and the new LTIS, both subject to certainadjustments to the figures calculated in accordance with IFRS. It was agreed that for the purposes of determining performance in respect of those schemes, the relevant figures produced under IFRS should be adjusted for exceptional items and certain re-measurements arising on the application of IAS 32 and IAS 39.
Source: Alithos Ltd 31 December 2002 = 100
The graph below compares the Company’s TSR performance with that of the FTSE 100 Index for the five years ended 31 December 2007.
As required by Schedule 7A of the Companies Act 1985, a rolling definition of the FTSE 100 has been used, whereas the definitionused for the purposes of the LTIS is the FTSE 100 as constituted at the beginning of the period. In order to demonstrate the delivery of shareholder value during the relevant performance period, the TSR graph for the LTIS award that vested in April 2007 is shown on page 50.
Funding of share schemes It is the Company’s current intention to satisfy the requirements of its share schemes, in a method best suited to the interests of the Company, either by acquiring shares in the market or, subject to institutional guidelines, issuing new shares or using sharesheld in treasury. To satisfy the release of shares under the LTIS and meet the requirements of the ESOS in 2007, newly-issued shares were used.
Pension The pension arrangements of the Executive Directors are fully disclosed on page 51.
Other employment benefitsIn common with other senior management, Executive Directors are entitled to a range of benefits, including a company car, life assurance, private medical insurance and a financial counselling scheme. Sam Laidlaw and Jake Ulrich were also provided with a driver for limited personal mileage. Such benefits are subject to financial limits as set out in appropriate policies. They are also eligible to participate in the Company’s HMRC-approved Sharesave Scheme and Share Incentive Plan, which are open to all eligible employees on the same basis, providing a long-term savings and investment opportunity.
Service contracts It is the Company’s policy that the notice period in Executive Directors’ service contracts does not exceed one year. The Executive Directors’ service contracts have no fixed term but provide that either the Director or the Company may terminate the employment by giving one year’s written notice and that the Company may pay compensation in lieu of notice.
In the case of new external appointments to the Board, the Committee retains a level of flexibility, as permitted by the Code, in order to attract and retain suitable candidates. It therefore reserves the right to offer contracts which contain an initial notice period in excess of one year, provided that at the end of the first such period the notice reduces to one year. The Committee exercised this discretion in respect of the appointment of Sam Laidlaw on 1 July 2006 and Nick Luff on 1 March 2007. Each has a service contract that contains a notice period of two years, which will reduce to one year on the second anniversary of their respective date of appointment.
The dates of the Executive Directors’ service contracts are set out in the table on page 47.
Total Shareholder Return Indices – Centrica and FTSE 100 Index for the five years ended 31 December 2007
Centrica plc
02 0403 0605
FTSE 100 TSR Index
250
200
150
100 07

46
Centrica plc Annual Report and Accounts 2007
Remuneration Report continued
External appointments of Executive Directors The Board believes that experience of other companies’ practices and challenges is valuable both for the personal development of its Executive Directors and for the Company.
It is therefore the Company’s policy to allow each Executive Director to accept one non-executive directorship of another company, although the Board retains the discretion to vary this policy. Fees received in respect of external appointments are retained by the individual Director.
In 2007, Phil Bentley received £65,625 as a Non-Executive Director of Kingfisher plc, Sam Laidlaw received £37,556 as a Non-Executive Director of Hanson plc and, in respect of the period he was a Director of the Company, Nick Luff received£35,083 as a Non-Executive Director of QinetiQ Group plc.
Non-Executive Directors Non-Executive Directors including the Chairman do not hold service contracts. Their appointment is subject to the Articles of Association and the dates they joined the Board are shown in the table on page 47. Roger Carr’s letter of appointment contains a six-month notice period. The fees of the Non-Executive Directors are approved by the Board upon the recommendation of the Executive Committee, whose members are: the Executive Directors (Sam Laidlaw, Phil Bentley, Nick Luff and Jake Ulrich)and five other senior executives (Grant Dawson, Deryk King, Catherine May, Anne Minto and Chris Weston) whose biographies are included on pages 34 and 35.
Centrica’s policy on Non-Executive Directors’ fees takes into account the need to attract individuals of the right calibre and experience, their responsibilities and time commitment, as envisaged in the Code, and the fees paid by other companies.
The current annual fees payable to the Non-Executive Directors are:
Chairman £450,000Other Non-Executive Directors £60,000Additional fees:Chairman of Audit Committee £18,000Chairman of Remuneration Committee £12,000Chairman of Corporate Responsibility Committee £12,000Senior Independent Director £20,000
The fees are normally reviewed every two years. The Non-Executive Directors, including the Chairman, do not participate in any of the Company’s share schemes, incentive plans or pension schemes.
The Remuneration Report from page 42 to page 46 up to this statement has not been audited. From this point until the end of the report on page 51, the disclosures, with the exception of the graph on page 50, have been audited by the Company’s auditors, PricewaterhouseCoopers LLP.

47
Directors’ R
eport – Business R
eviewD
irectors’ Report – G
overnanceFinancial S
tatements
Shareholder Inform
ationCentrica plc Annual Report and Accounts 2007
Directors’ emoluments
Basesalary/fees
£000
Annualincentive scheme
(AIS) £000 (i)
Additionalpayments
£000 (ii) Benefits £000 (iii)
Totalemoluments
2007£000 (iv)
Totalemoluments
2006£000 (iv)
Executive Directors Date of service contract
Phil Bentley 13 September 2000 567 516 – 42 1,125 1,136Sam Laidlaw(v) 1 July 2006 873 753 180 64 1,870 1,079Nick Luff 1 March 2007 442 399 145 3 989 –Jake Ulrich (vi) 1 January 2005 567 427 – 39 1,033 1,102
2,449 2,095 325 148 5,017 3,317Non-Executive Directors Date of appointment
Helen Alexander 1 January 2003 69 – – – 69 60Roger Carr 1 January 2001 413 – – – 413 344Mary Francis 22 June 2004 84 – – – 84 56Andrew Mackenzie 1 September 2005 58 – – – 58 50Paul Rayner 23 September 2004 75 – – – 75 65Paul Walsh 1 March 2003 58 – – – 58 50
757 – – – 757 625Past Directors Date of cessation
Mark Clare 30 September 2006 – – – – – 412Sir Roy Gardner 30 June 2006 – – – – – 784Patricia Mann 19 May 2006 – – – – – 21
1,217Total emoluments 3,206 2,095 325 148 5,774 5,159
(i) Of the AIS bonus agreed by the Remuneration Committee, 80% is paid in cash and is included above. 20% of the agreed AIS bonus (25% of the amounts shown underthe AIS column above) is deferred automatically and invested as deferred shares in the Deferred and Matching Share Scheme (DMSS) – see pages 48 and 49.
(ii) Sam Laidlaw is contractually entitled to a salary supplement of 40% of base pay in lieu of any pension provision. This amounted to £349,180 in 2007 of which £168,750was paid directly by the Company into his personal pension plan and is disclosed in the notes on page 51. The balance of £180,430 is included above under the heading ‘Additional payments’. Nick Luff is contractually entitled to a salary supplement of 30% of base pay in lieu of any pension provision. This amount is included above under the heading ‘Additional payments’. Cash payment in lieu of provision of a company car paid to Nick Luff is also included under the heading’Additional payments’.
(iii) Benefits include all taxable benefits arising from employment by the Company, including the provision of a car (Sam Laidlaw and Jake Ulrich were also provided witha driver for limited personal mileage), financial counselling, medical insurance and life assurance premiums.
(iv) The following are excluded from the table above:(a) pensions – see page 51; (b) share options – see page 50. The aggregate of the amount of gains made by Executive Directors on the exercise of share options was £615,839
(2006: £3,462,389); and (c) Long Term Incentive Scheme (LTIS) – see pages 48 and 49. The aggregate value of shares vested to Executive Directors under the LTIS was £2,211,361
(2006: £2,352,203). (v) The 2006 total emoluments figure in respect of Sam Laidlaw is for the six-month period 1 July 2006 (being the date of his appointment to the Board) to 31 December
2006. It includes an additional payment of £255,000 (being the balance of an initial payment to him that was not paid in to his personal pension plan and a salarysupplement of 40% of base pay in lieu of any pension provision).
(vi) The 2006 total emoluments figure in respect of Jake Ulrich includes an amount of £22,000 that was paid to him in 2006 in respect of the non-payment of a car allowance for 2005 that he was contractually entitled to.

48
Centrica plc Annual Report and Accounts 2007
Remuneration Report continued
Directors’ interests in sharesThe following table and the tables on pages 49 and 50 show the beneficial interests of the Directors who held office at the end of the year in the ordinary shares of the Company and the interests of the Executive Directors who served during the year in the Company’s share schemes:
Directors as at 31 December 2007
Shareholdingsas at
31 December 2007
Shareholdingsas at 1 January
2007 or onappointment (i)
DMSS total matching
shares as at 31 December
2007
DMSS total matching
shares as at 1January
2007 or onappointment (i)
LTIS total allocations of
shares as at 31 December
2007
LTIS total allocations of shares as at
1 January2007 or on
appointment (i)
Executive Directors Phil Bentley (ii) (iii) 623,718 460,880 181,727 – 740,346 606,064Sam Laidlaw (ii) (iii) 341,964 200,106 272,431 – 891,320 431,837Nick Luff (i) (ii) (iii) 200,255 200,000 169,871 – 276,545 –Jake Ulrich (ii) (iii) 861,229 719,341 181,726 – 743,626 613,998Non-Executive Directors Helen Alexander 2,520 2,520 – – – –Roger Carr 19,230 19,230 – – – –Mary Francis 981 981 – – – –Andrew Mackenzie 21,000 21,000 – – – –Paul Rayner 5,000 5,000 – – – –Paul Walsh 4,500 4,500 – – – –
(i) Shareholdings and LTIS allocations are shown as at 1 January 2007 or in the case of Nick Luff, 1 March 2007, his date of appointment. (ii) As at 21 February 2008, the beneficial shareholdings of Phil Bentley and Jake Ulrich had each increased by 113 shares and those of Sam Laidlaw and Nick Luff had
increased by 114 shares acquired through the Share Incentive Plan. (iii) Executive Directors’ shareholdings above include those held in the Share Incentive Plan and the deferred and investment shares held in the DMSS. Matching shares held
in the DMSS and shares held in the LTIS are provided separately in the table above and in more detail in their respective tables on page 49.
From 1 January 2007 to 21 February 2008, none of the Directors had any beneficial interests in the Company’s securities other than ordinary shares, nor any non-beneficial interests in any of the Company’s securities, nor in those of its subsidiary or associated undertakings.
Executive Directors’ Minimum Shareholding Policy As stated on page 42, the Executive Directors are required to hold shares with a value based on a multiple of their base salary. Under that policy the Executive Directors have a period of five years in which to achieve their minimum shareholding requirement. The table below sets out, in respect of each Executive Director, their requirement and achievement as at 31 December 2007 against that requirement.
Directors as at 31 December 2007 Base salary
£000
Value of shareholdings
£000 (i)
Minimum shareholding requirement
as % of base salary
Actualshareholding as
% of base salary Target to be achieved by
Executive Directors Phil Bentley 567 2,238 125 395 –Sam Laidlaw 881 1,227 200 139 30 June 2011Nick Luff 530 718 125 136 –Jake Ulrich 567 3,090 125 545 –
(i) The value of shareholdings is based on the closing price of a Centrica ordinary share on the last trading day of 2007 (31 December) of 358.75 pence.

49
Directors’ R
eport – Business R
eviewD
irectors’ Report – G
overnanceFinancial S
tatements
Shareholder Inform
ationCentrica plc Annual Report and Accounts 2007
The following table gives details of the DMSS allocations held by Executive Directors who served during the year:
Total number of deferred, investmentand transferred shares held in the DMSS
at 31 December 2007 (i) (ii) (iii)
Total number of conditional matchingshares held in the DMSS at
31 December 2007 (ii) (iii)
Phil Bentley 65,507 181,727Sam Laidlaw 88,451 272,431Nick Luff 50,112 169,871Jake Ulrich 64,368 181,726
Market price at allocation date 391.50p 391.50pEnd of performance period 3 Apr 2010 3 Apr 2010
(i) Normally, 20% of gross bonus (before the deduction of income tax and National Insurance contributions) is automatically deferred and invested in Centrica shares(deferred shares). Participants have the opportunity to make a further investment (investment shares), funded from net annual performance bonus, so that the maximum total investment (on a gross basis) is 50% of the individual’s maximum bonus entitlement for the preceding year. Certain initial arrangements were agreed in respect of Sam Laidlaw and Nick Luff who joined the Board on 1 July 2006 and 1 March 2007 respectively. Sam Laidlaw invested his entire bonus paid in respect of the period 1 July to 31 December 2006. He also transferred shares into the scheme that he already held, such that thetotal value of the investment as calculated on the basis as set out above was equal to 50% of the maximum bonus opportunity had he been employed for the wholeyear. Nick Luff transferred shares into the scheme that he already held equal in value to 50% of the maximum bonus opportunity had he been employed for thewhole of 2006.
(ii) The calculation of the conditional matching shares is made on a gross basis. Investment shares are grossed up (to reflect the impact of income tax and National Insurance contributions) for the calculation of the matching shares so that the deferred and investment shares are matched on the same basis. The number of matchingshares that vest will be determined on a straight-line basis from a zero match for no growth in economic profit to a two-times match for growth of 25% or above over a three-year period. The number of matching shares that will be released following the satisfaction of the performance condition will be increased to reflect the dividends that would have been paid during the three-year performance period. Dividends are paid on the deferred and investment shares to the participants on the normaldividend payment date.
(iii) The scheme commenced in 2007. The purchase of deferred and investment shares, the transfer of shares already held and the conditional award of matching shareswere made on 4 April 2007.
The following table gives details of the LTIS allocations held by Executive Directors who served during the year:
Vested during 2007 In performance period
Date of allocation1 April
2004 (i) 1 April
2005 (ii) 3 April
2006 (iii)(iv)4 September
2006 (iii) 4 April 2007 (iii)
Phil Bentley 161,569 165,646 278,849 – 295,851Sam Laidlaw – – – 431,837 459,483Nick Luff – – – – 276,545Jake Ulrich 166,223 168,926 278,849 – 295,851
Market price at allocation date 232.00p 228.00p 284.00p 302.50p 391.50pEnd of performance period 31 Mar 07 31 Mar 08 31 Mar 09 31 Aug 09 31 Mar 10Market price at vesting date (i) 386.00p
(i) At the end of the performance period to 31 March 2007, the Company ranked 38th in the relevant comparator group. Accordingly, 78.3% of the original allocations werereleased to participants on 4 April 2007. The released shares were subject to income tax at the individual’s marginal rate and National Insurance contributions (NICs) at the rate of 1%, based on the market value of the shares at the date of vesting. The income tax and NICs liability was satisfied by the sale of sufficient shares and,accordingly, the Executive Directors only received the net number of shares following disposal, which, to the extent retained, is reflected in the shareholdings as at31 December 2007 on page 48.
(ii) At the end of the performance period the Company’s TSR performance will be assessed against that of the relevant LTIS comparator group. If, and to the extent thatthe performance conditions are met, the relevant number of shares will be released to the Directors at the Trustee’s discretion as soon as practicable thereafter.
(iii) The percentage of the allocation eventually to vest is dependent on the satisfaction of performance criteria over a three-year performance period: half of the shares (EPS shares) will be subject to a performance condition based on the Group’s adjusted EPS growth relative to the growth in RPI over three financial years. EPS growth will be calculated by comparing the Group’s adjusted EPS figure for the financial period preceding the date of allocation with that for the financial period three years later;and half of the shares will be determined by the Company’s Total Shareholder Return (TSR) performance relative to the other companies comprising the LTIScomparator group – the FTSE 100 at the start of the three-year performance period (the TSR shares). At the end of the performance period, the TSR performance condition will be measured, the same calculation made for all the other 99 companies in the LTIS comparator group and a ranking list will be compiled.
(iv) The first awards under the new LTIS (approval was sought and given by shareholders at the AGM held on 19 May 2006) were made to participants other than theExecutive Directors on 3 April 2006 (on the date that allocations would normally be made under the previous LTIS and within the 42-day period following the release of the Company’s annual results). The awards to the Executive Directors then in office could only be made after shareholder approval, but in order to align their awards withthose of other participants, their first awards were deemed to have been made on 3 April 2006 for all purposes of the new LTIS, including the calculation of the number of shares, the adjusted EPS and relative TSR performance tests and the three-year vesting period.

50
Centrica plc Annual Report and Accounts 2007
Remuneration Report continued
The following graph, provided by Alithos Ltd (an independent third party), shows the TSR performance of the Company and that ofthe relevant TSR comparator group. It has not been audited by the Company’s auditors, PricewaterhouseCoopers LLP. It relates tothe 2004 LTIS allocations that vested in 2007.
Source: Alithos Ltd 1 April 2004 = 100
Directors’ interests in share options Full details of the options over ordinary shares in the Company held by Executive Directors who served during the year, and anymovements in those options in the year, are shown below:
Options heldas at 1 January
2007 Options grantedduring the year
Options exercised during the year
Options lapsedduring the year
Options held as at
31 December 2007
Exercise price (pence)
Date from whichexercisable Expiry date
Phil Bentley
ESOS (i) 308,269 – – – 308,269 240.05 Jun 2004 May 2011ESOS (i) 364,768 – – – 364,768 224.80 Apr 2005 Apr 2012ESOS (i) 559,345 – – – 559,345 146.60 Mar 2006 Mar 2013ESOS (i) 401,875 – – – 401,875 223.95 Mar 2007 Mar 2014ESOS (i) 441,723 – – – 441,723 228.65 Apr 2008 Mar 2015ESOS (i) 371,799 – – – 371,799 285.10 Apr 2009 Apr 2016Sharesave (ii) 5,161 – 5,161 – – 182.60 Jun 2007 Nov 2007Sharesave (ii) – 3,244 – – 3,244 291.30 Jun 2010 Nov 2010 2,452,940 3,244 5,161 – 2,451,023Sam Laidlaw
Sharesave (ii) – 3,244 – – 3,244 291.30 Jun 2010 Nov 2010 – 3,244 – – 3,244
Jake Ulrich
ESOS (i) 337,429 – – – 337,429 240.05 Jun 2004 May 2011ESOS (i) 387,010 – – – 387,010 224.80 Apr 2005 Apr 2012ESOS (i) 593,451 – – – 593,451 146.60 Mar 2006 Mar 2013ESOS (i) 419,736 – 356,145 – 63,591 223.95 Mar 2007 Mar 2014ESOS (i) 450,470 – – – 450,470 228.65 Apr 2008 Mar 2015ESOS (i) 371,799 – – – 371,799 285.10 Apr 2009 Apr 2016Sharesave (ii) – 3,244 – – 3,244 291.30 Jun 2010 Nov 2010 2,559,895 3,244 356,145 – 2,206,994
(i) Executive Share Option Scheme (ESOS)Options were granted to the Executive Directors under the terms of the ESOS on 31 May 2001, 2 April 2002, 24 March 2003, 18 March 2004, 1 April 2005 and 3 April 2006. Details of the operation of the scheme are provided on pages 44 and 45.
(ii) Sharesave SchemeThe Company operates an HMRC-approved all-employee savings-related share option scheme in the UK. The scheme is designed to provide a long-term savings and investment opportunity for employees.
The closing price of a Centrica ordinary share on the last trading day of 2007 (31 December) was 358.75 pence. The range duringthe year was 335.00 pence (low) and 397.00 pence (high).
TSR Indices – Centrica and LTIS comparator groupApril 2004 LTIS allocation – period from 1 April 2004 to 31 March 2007
Centrica return index
04 05 06 07
LTIS comparator group (FTSE 100 companies as at 2004)
200
175
150
125
100
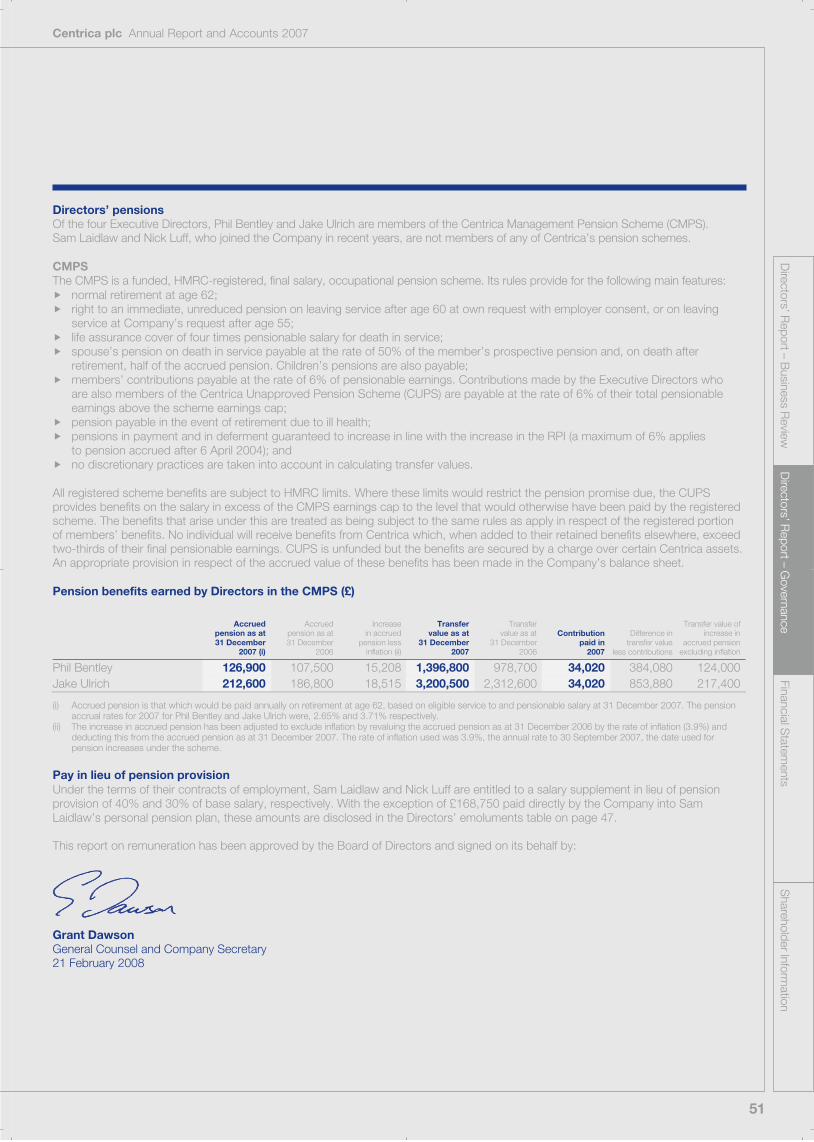
51
Directors’ R
eport – Business R
eviewD
irectors’ Report – G
overnanceFinancial S
tatements
Shareholder Inform
ationCentrica plc Annual Report and Accounts 2007
Directors’ pensionsOf the four Executive Directors, Phil Bentley and Jake Ulrich are members of the Centrica Management Pension Scheme (CMPS). Sam Laidlaw and Nick Luff, who joined the Company in recent years, are not members of any of Centrica’s pension schemes.
CMPS The CMPS is a funded, HMRC-registered, final salary, occupational pension scheme. Its rules provide for the following main features: � normal retirement at age 62; � right to an immediate, unreduced pension on leaving service after age 60 at own request with employer consent, or on leaving
service at Company’s request after age 55; � life assurance cover of four times pensionable salary for death in service;� spouse’s pension on death in service payable at the rate of 50% of the member’s prospective pension and, on death after
retirement, half of the accrued pension. Children’s pensions are also payable;� members’ contributions payable at the rate of 6% of pensionable earnings. Contributions made by the Executive Directors who
are also members of the Centrica Unapproved Pension Scheme (CUPS) are payable at the rate of 6% of their total pensionable earnings above the scheme earnings cap;
� pension payable in the event of retirement due to ill health; � pensions in payment and in deferment guaranteed to increase in line with the increase in the RPI (a maximum of 6% applies
to pension accrued after 6 April 2004); and � no discretionary practices are taken into account in calculating transfer values.
All registered scheme benefits are subject to HMRC limits. Where these limits would restrict the pension promise due, the CUPS provides benefits on the salary in excess of the CMPS earnings cap to the level that would otherwise have been paid by the registered scheme. The benefits that arise under this are treated as being subject to the same rules as apply in respect of the registered portion of members’ benefits. No individual will receive benefits from Centrica which, when added to their retained benefits elsewhere, exceed two-thirds of their final pensionable earnings. CUPS is unfunded but the benefits are secured by a charge over certain Centrica assets. An appropriate provision in respect of the accrued value of these benefits has been made in the Company’s balance sheet.
Pension benefits earned by Directors in the CMPS (£)
Accrued pension as at 31 December
2007 (i)
Accrued pension as at 31 December
2006
Increase in accrued
pension less inflation (ii)
Transfervalue as at
31 December 2007
Transfervalue as at
31 December 2006
Contribution paid in
2007
Difference in transfer value
less contributions
Transfer value ofincrease in
accrued pension excluding inflation
Phil Bentley 126,900 107,500 15,208 1,396,800 978,700 34,020 384,080 124,000Jake Ulrich 212,600 186,800 18,515 3,200,500 2,312,600 34,020 853,880 217,400
(i) Accrued pension is that which would be paid annually on retirement at age 62, based on eligible service to and pensionable salary at 31 December 2007. The pension accrual rates for 2007 for Phil Bentley and Jake Ulrich were, 2.65% and 3.71% respectively.
(ii) The increase in accrued pension has been adjusted to exclude inflation by revaluing the accrued pension as at 31 December 2006 by the rate of inflation (3.9%) anddeducting this from the accrued pension as at 31 December 2007. The rate of inflation used was 3.9%, the annual rate to 30 September 2007, the date used for pension increases under the scheme.
Pay in lieu of pension provision Under the terms of their contracts of employment, Sam Laidlaw and Nick Luff are entitled to a salary supplement in lieu of pension provision of 40% and 30% of base salary, respectively. With the exception of £168,750 paid directly by the Company into Sam Laidlaw’s personal pension plan, these amounts are disclosed in the Directors’ emoluments table on page 47.
This report on remuneration has been approved by the Board of Directors and signed on its behalf by:
Grant DawsonGeneral Counsel and Company Secretary 21 February 2008

52
Centrica plc Annual Report and Accounts 2007
Independent Auditors’ Report to the Members of Centrica plc
Independent Auditors’ report to the members of Centrica plc We have audited the Group Financial Statements of Centrica plc for the year ended 31 December 2007 which comprise the Group Income Statement, the Group Balance Sheet, the Group CashFlow Statement, the Group Statement of Recognised Income and Expense and the related notes. These Group Financial Statements have been prepared under the accounting policiesset out therein.
We have reported separately on the parent Company Financial Statements of Centrica plc for the year ended 31 December 2007 and on the information in the Directors’ Remuneration Report that is described as having been audited.
Respective responsibilities of Directors and Auditors The Directors’ responsibilities for preparing the Annual Report and the Group Financial Statements in accordance with applicable law and International Financial Reporting Standards (IFRSs) as adopted by the European Union are set out in the Statement of Directors’ Responsibilities.
Our responsibility is to audit the Group Financial Statements inaccordance with relevant legal and regulatory requirements and International Standards on Auditing (UK and Ireland). This report, including the opinion, has been prepared for and only for theCompany’s members as a body in accordance with Section 235 of the Companies Act 1985 and for no other purpose. We do not, in giving this opinion, accept or assume responsibility for any other purpose or to any other person to whom this report is shown or into whose hands it may come save where expressly agreed by our prior consent in writing.
We report to you our opinion as to whether the Group Financial Statements give a true and fair view and whether the Group Financial Statements have been properly prepared in accordance with the Companies Act 1985 and Article 4 of the IAS Regulation. We also report to you whether, in our opinion the information given in the Directors’ Report (comprising the Directors’ Report – Business Review and the Directors’ Report – Governance) is consistent with the Group Financial Statements.
In addition we report to you if, in our opinion, we have not received all the information and explanations we require for our audit, or if information specified by law regarding Directors’ remuneration and other transactions is not disclosed.
We review whether the Corporate Governance Report reflects the Company’s compliance with the nine provisions of the Combined Code (2006) specified for our review by the Listing Rules of the Financial Services Authority, and we report if it does not. We are not required to consider whether the Board’s statements on internal control cover all risks and controls, or form an opinion on the effectiveness of the Group’s corporate governance procedures or its risk and control procedures.
We read other information contained in the Annual Report and consider whether it is consistent with the audited Group Financial Statements. The other information comprises only the Chairman’s Statement, the Directors’ Report, the Gas and Liquids Reserves, Five Year Record and Shareholder Information. We consider the implications for our report if we become aware of any apparentmisstatements or material inconsistencies with the Group Financial Statements. Our responsibilities do not extend to any other information.
Basis of audit opinion We conducted our audit in accordance with International Standards on Auditing (UK and Ireland) issued by the Auditing Practices Board. An audit includes examination, on a test basis, of evidence relevant to the amounts and disclosures in the Group Financial Statements. It also includes an assessment of the significant estimates and judgements made by the Directors inthe preparation of the Group Financial Statements, and ofwhether the accounting policies are appropriate to the Group’s circumstances, consistently applied and adequately disclosed.
We planned and performed our audit so as to obtain all the information and explanations which we considered necessary in order to provide us with sufficient evidence to give reasonable assurance that the Group Financial Statements are free from material misstatement, whether caused by fraud or other irregularity or error. In forming our opinion we also evaluated the overall adequacy of the presentation of information in the Group Financial Statements.
Opinion In our opinion:� the Group Financial Statements give a true and fair view, in
accordance with IFRSs as adopted by the European Union, of the state of the Group’s affairs as at 31 December 2007 and of its profit and cash flows for the year then ended;
� the Group Financial Statements have been properly prepared in accordance with the Companies Act 1985 and Article 4 of the IAS Regulation; and
� the information given in the Directors’ Report is consistentwith the Group Financial Statements.
PricewaterhouseCoopers LLP Chartered Accountants and Registered Auditors London21 February 2008

53
Directors’ R
eport – Business R
eviewD
irectors’ Report – G
overnanceS
hareholder Information
53 Financial Statements58 Notes to the Financial Statements140 Company Balance Sheet141 Notes to the Company Balance Sheet147 Gas and Liquid Reserves148 Five Year Record
Financial Statem
ents

54
Centrica plc Annual Report and Accounts 2007
Group Income Statement Financial Statements
2007 2006 (restated) (ii)
Year ended 31 December Notes
Results for the year before
exceptional items and certainre-measurements
(i)£m
Exceptionalitems and certainre-measurements
(i)£m
Results forthe year
£m
Results forthe year before
exceptional items and certain re-measurements
(i) £m
Exceptionalitems and certain re-measurements
(i)£m
Results forthe year
£m
Continuing operations Group revenue 6 16,342 – 16,342 16,403 – 16,403Cost of sales (ii) 7 (12,217) – (12,217) (12,764) – (12,764)Re-measurement of energy contracts (i) 6,8 – 244 244 – (916) (916)Gross profit 4,125 244 4,369 3,639 (916) 2,723
Operating costs before exceptional items (ii) (2,190) – (2,190) (2,250) – (2,250) Systems write-down 8 – – – – (196) (196)
Business restructuring costs 8 – – – – (87) (87) Rough storage incident 8 – – – – (48) (48)Operating costs (ii) 7 (2,190) – (2,190) (2,250) (331) (2,581)Share of profits/(losses) in joint ventures and associates, net of interest and taxation (i) 8,18 14 (9) 5 3 (15) (12)Group operating profit 6 1,949 235 2,184 1,392 (1,262) 130 Interest income 10 258 – 258 105 – 105
Interest expense 10 (331) – (331) (246) – (246)Net interest expense 10 (73) – (73) (141) – (141)Profit/(loss) from continuing operationsbefore taxation 1,876 235 2,111 1,251 (1,262) (11)Taxation on profit from continuing operations 11 (753) (60) (813) (549) 363 (186)Profit/(loss) from continuing operationsafter taxation 1,123 175 1,298 702 (899) (197)
Profit/(loss) from discontinued operations (i) 35 1 (19) (18) 14 37 51Gain/(loss) on disposal of discontinuedoperations 35 – 227 227 (8) – (8)
Discontinued operations 1 208 209 6 37 43Profit/(loss) for the year 1,124 383 1,507 708 (862) (154)Attributable to:
Equity holders of the parent 1,122 383 1,505 707 (862) (155) Minority interests 31 2 – 2 1 – 1
1,124 383 1,507 708 (862) (154)Pence Pence Pence Pence
Earnings/(loss) per ordinary share From continuing and discontinued operations: Basic 13 41.0 (4.3) Adjusted basic 13 30.6 19.4 Diluted 13 40.3 (4.3)From continuing operations: Basic 13 35.3 (5.4) Adjusted basic 13 30.5 19.2 Diluted 13 34.7 (5.4)
Interim dividend paid per share 12 3.35 3.15Final dividend proposed per share 12 9.65 8.00
(i) Certain re-measurements (notes 2 and 8) included within operating profit comprise re-measurement arising on our energy procurement activities and re-measurementof proprietary trades in relation to cross-border transportation or capacity contracts. Certain re-measurements included within profit from discontinued operationscomprise re-measurement of the publicly traded units of The Consumers’ Waterheater Income Fund. All other re-measurement is included within results before exceptional items and certain re-measurements.
(ii) Restated to present costs incurred under the energy savings programmes in cost of sales and to present The Consumers’ Waterheater Income Fund as a discontinuedoperation. Note 2 details the change of accounting presentation and note 3 details the deconsolidation of The Consumers’ Waterheater Income Fund.
The notes on pages 58 to 138 form part of these Financial Statements.

55
Directors’ R
eport – Business R
eviewD
irectors’ Report – G
overnanceFinancial S
tatements
Shareholder Inform
ationCentrica plc Annual Report and Accounts 2007
Group Balance Sheet
31 December Notes 2007
£m 2006 (restated) (i)
£m
Non-current assets Goodwill 14 1,074 1,055Other intangible assets 15 465 446Property, plant and equipment 17 3,910 3,655Interests in joint ventures and associates 18 285 220Deferred tax assets 26 27 226Trade and other receivables 20 33 16Derivative financial instruments 21 72 17Available-for-sale financial assets 28 39 37Retirement benefit assets 34 152 –
6,057 5,672Current assetsInventories 19 241 270Current tax assets 26 40 98Trade and other receivables 20 3,423 3,590Derivative financial instruments 21 914 760Available-for-sale financial assets 28 50 49Cash and cash equivalents 23 1,130 640
5,798 5,407Total assets 11,855 11,079Current liabilities Trade and other payables 24 (3,371) (3,291)Current tax liabilities (281) (180)Bank overdrafts, loans and other borrowings 25 (221) (181)Derivative financial instruments 21 (1,404) (1,737)Provisions for other liabilities and charges 27 (140) (130)
(5,417) (5,519)Net current assets/(liabilities) 381 (112)Non-current liabilities Trade and other payables 24 (20) (55)Bank loans and other borrowings 25 (1,793) (2,555)Derivative financial instruments 21 (11) (220)Deferred tax liabilities 26 (596) (241)Retirement benefit obligations 34 (55) (296)Provisions for other liabilities and charges 27 (581) (551)
(3,056) (3,918)Net assets 3,382 1,642Equity Called up share capital 29,30 227 226Share premium account 30 685 657Merger reserve 30 467 467Capital redemption reserve 30 16 16Other reserves 30 1,928 219Shareholders’ equity 30 3,323 1,585Minority interests in equity 31 59 57Total minority interests and shareholders’ equity 3,382 1,642
(i) Restated to present exploration and evaluation expenditure, previously reported in property, plant and equipment, in other intangible assets on the Balance Sheet.Note 2 details the change of accounting presentation.
The Financial Statements on pages 54 to 138 were approved and authorised for issue by the Board of Directors on 21 February 2008 and were signed below on its behalf by:
Sam Laidlaw Nick Luff Chief Executive Group Finance Director
The notes on pages 58 to 138 form part of these Financial Statements.

56
Centrica plc Annual Report and Accounts 2007
Group Statement of Recognised Income and Expense
Financial Statements continued
Year ended 31 December Notes 2007
£m 2006
£m
Profit/(loss) for the year 1,507 (154)Gains on revaluation of available-for-sale investments 30 1 –Gains/(losses) on cash flow hedges 30 169 (645)Exchange differences on translation of foreign operations 30 15 (23)Actuarial gains on defined benefit pension schemes 30 284 475Tax on items taken directly to equity 30 (120) 73
Net income/(expense) recognised directly in equity 349 (120)Transferred to income and expense on cash flow hedges 30 382 (294)Exchange differences transferred to income and expense on disposal of subsidiaries 30, 35 (4) –Tax on items transferred from equity 30 (128) 96
Transfers 250 (198)Total recognised income and expense for the year 2,106 (472)Total income and expense recognised in the year is attributable to:
Equity holders of the parent 2,104 (473) Minority interests 2 1
2,106 (472)
The notes on pages 58 to 138 form part of these Financial Statements.

57
Directors’ R
eport – Business R
eviewD
irectors’ Report – G
overnanceFinancial S
tatements
Shareholder Inform
ationCentrica plc Annual Report and Accounts 2007
Group Cash Flow Statement
Year ended 31 December Notes 2007
£m 2006 (restated) (i)
£m
Operating cash flows before movements in working capital 32 2,494 1,892Decrease/(increase) in inventories 38 (83)Decrease/(increase) in receivables 181 (259)Increase/(decrease) in payables 44 (150)Cash generated from continuing operations 2,757 1,400Interest received 27 13Interest paid (3) (9)Tax paid (401) (627)Payments relating to exceptional charges (90) (113)Net cash flow from continuing operating activities 32 2,290 664Net cash flow from discontinued operating activities 32 67 73Net cash flow from operating activities 2,357 737Purchase of interests in subsidiary undertakings and businesses net of cash and cash equivalents acquired 35 (262) (97)Disposal of interests in subsidiary undertakings and businesses net of cash and cash equivalents disposed 35 – (3)Purchase of intangible assets (i) (185) (167)Disposal of intangible assets 14 13Purchase of property, plant and equipment (i) (563) (489)Disposal of property, plant and equipment (i) 76 15Investments in joint ventures and associates (45) (16)Disposal of interests in associates and other investments – 4Interest received 63 40Net (purchase)/sale of other financial assets (2) 5Net cash flow from continuing investing activities (904) (695)Net cash flow from discontinued investing activities (60) (25)Net cash flow from investing activities (964) (720)Repurchase of ordinary share capital – (23)Issue of ordinary share capital 22 56Purchase of treasury shares (2) –
Interest paid in respect of finance leases (110) (43)Other interest paid (114) (136)
Interest paid (224) (179)Cash inflow from additional debt 256 838Cash outflow from payment of capital element of finance leases (383) (21)Cash outflow from repayment of other debt (107) (880)
Net cash flow from decrease in debt (234) (63)Realised net foreign exchange loss on cash settlement of derivative contracts (8) (21)Equity dividends paid (417) (384)Net cash flow from continuing financing activities (863) (614)Net cash flow from discontinued financing activities (25) 17Net cash flow from financing activities (888) (597)Net increase/(decrease) in cash and cash equivalents 505 (580)Cash and cash equivalents at 1 January (ii) 592 1,177Effect of foreign exchange rate changes 3 (5)Cash and cash equivalents at 31 December (ii) 23 1,100 592
(i) Restated to present exploration and evaluation expenditure, previously reported in property, plant and equipment, in other intangible assets on the Balance Sheet and to present The Consumers’ Waterheater Income Fund as a discontinued operation. Note 2 details the change of accounting presentation and note 3 explains the deconsolidation of The Consumers’ Waterheater Income Fund.
(ii) Cash and cash equivalents are stated net of overdrafts of £30 million (2006: £48 million).
The notes on pages 58 to 138 form part of these Financial Statements.
58
Centrica plc Annual Report and Accounts 2007
Notes to the Financial Statements
1. General information
Centrica plc is a Company domiciled and incorporated in the United Kingdom under the Companies Act 1985. The address of the registered office is given on page 41. The nature of the Group’s operations and its principal activities are set out in note 6 and in the Directors’ Report – Business Review on pages 8 to 32.
The consolidated Financial Statements of Centrica plc arepresented in pounds sterling. Operations and transactions conducted in currencies other than pounds sterling are included in the consolidated Financial Statements in accordance with the foreign currencies accounting policy set out in note 2.
2. Summary of significant accounting policies
The principal accounting policies applied in the preparation of these consolidated Financial Statements are set out below. These policies have been consistently applied to all the years presented, unless otherwise stated.
Basis of preparation The consolidated Financial Statements have been prepared inaccordance with International Financial Reporting Standards (IFRS) as adopted by the European Union (EU) and therefore comply with Article 4 of the EU IAS Regulation.
The consolidated Financial Statements have been prepared onthe historical cost basis, except for derivative financial instruments and available-for-sale investments, and the assets and liabilities of the Group pension schemes that have been measured at fair value. The carrying values of recognised assets and liabilities that are hedged items in fair value hedges, and are otherwise carried at cost, are adjusted to record changes in the fair valuesattributable to the risks that are being hedged. The principalaccounting policies adopted are set out below.
The preparation of Financial Statements in conformity withIFRS requires the use of certain critical accounting estimates.It requires management to exercise its judgement in the processes of applying the Group’s accounting policies. The areas involving a higher degree of judgement, complexity or areas where assumptions and estimates are significant to the consolidated Financial Statements are described in note 3.
(a) Standards, amendments and interpretations effective in 2007 In the current year the Group has adopted IFRS 7, Financial Instruments: Disclosures, which is effective for annual reporting periods beginning on or after 1 January 2007, and the related amendments to IAS 1, Presentation of Financial Statements. The impact of the adoption of IFRS 7 and the changes to IAS 1 has been to expand the disclosures provided in these Financial Statements regarding the Group’s financial instruments and management of capital.
Four interpretations issued by the International Financial Reporting Interpretations Committee are effective for the current
period. These are IFRIC 7, Applying the Restatement Approach under IAS 29, Financial Reporting in Hyperinflationary Economies; IFRIC 8, Scope of IFRS 2; IFRIC 9, Re-assessment of Embedded Derivatives; and IFRIC 10, Interim Financial Reporting and Impairment. The adoption of these interpretations has not led to any changes in the Group’s accounting policies.
(b) Standards, amendments and interpretations that are not yet effective and that have not been early adopted by the Group At the date of authorisation of these Financial Statements, the following standards, amendments to existing standards and interpretations which have not been applied in these FinancialStatements were in issue but not yet effective: � IAS 23 (Amendment), Borrowing Costs, effective from
1 January 2009. The amendment to this standard is subject to EU endorsement. It requires an entity to capitalise borrowing costs directly attributable to the acquisition, construction or production of a qualifying asset (one that takes a substantial period of time to get ready for use or sale) as part of the cost of that asset. The option of immediately expensing such borrowing costs will be removed. The Group intends to apply IAS 23 (Amended) from 1 January 2008, subject to endorsement by the EU. Subject to being endorsed, it will require a change to the Group’s existing accounting policy, where such costs are immediately expensed;
� IFRS 8, Operating Segments, effective from 1 January 2009. This standard replaces IAS 14, Segment Reporting and requires segmental information reported to be based on that which Directors use internally for evaluating the performance of operating segments. The Group will apply IFRS 8 from 1 January 2009. The impact of adopting IFRS 8 is under assessment;
� IFRS 3 (Revised), Business Combinations was issued on 10 January 2008 and is subject to EU endorsement. It is applicable to business combinations effected on or after 1 January 2010, with earlier application permitted. The impactof adopting IFRS 3 in future periods will be considered inthe event of a future business combination; and
� IAS 27 (Revised), Consolidated and Separate Financial Statements was issued on 10 January 2008 and is subject to EU endorsement. The revised standard is effective for annual periods beginning on or after 1 July 2009. The impact of adopting IAS 27 in future periods is under assessment.
The Directors anticipate that the adoption of the followingamendments to standards and interpretations in future periods, which were also in issue but not effective at the date of authorisation of these Financial Statements, will have no material impact on the Financial Statements of the Group: � IAS 1 (Amendment), Presentation of Financial Statements,
effective from 1 January 2009, subject to EU endorsement;� IAS 32 (Amendment), Financial Instruments: Presentation and
IAS 1 (Amendment), Presentation of Financial Statements, effective from 1 January 2009, subject to EU endorsement;
� IFRS 2 (Amendment), Share Based Payment – Vesting Conditions and Cancellations, effective from 1 January 2009, subject to EU endorsement;
59
Directors’ R
eport – Business R
eviewD
irectors’ Report – G
overnanceFinancial S
tatements
Shareholder Inform
ationCentrica plc Annual Report and Accounts 2007
� IFRIC 11, IFRS 2 – Group and Treasury Share Transactions, effective for annual periods beginning on or after 1 March 2007;
� IFRIC 12, Service Concession Arrangements, effective for annual periods beginning on or after 1 January 2008;
� IFRIC 13, Customer Loyalty Programmes, effective for annual periods beginning on or after 1 July 2008; and
� IFRIC 14, IAS 19 – The Limit on a Defined Benefit Asset, Minimum Funding Requirements and their Interaction, effective for annual periods beginning on or after 1 January 2008.
(c) Changes of accounting presentation The Group has adopted the following changes of accounting presentation in the year: � Domestic energy suppliers are given energy savings targets
by the Government related to the size of their customer base. Costs incurred by British Gas Residential under such energy saving programmes are presented as part of cost of sales in the Income Statement. Previously such costs were presented as operating costs. The Directors consider the change of accounting presentation better reflects the nature of the costs as a direct cost of supplying energy to domestic customers. The impact of the change of accounting presentation is to report £91 million of costs in the year within cost of sales. The impact on comparatives is to reclassify £90 million from operating costs to cost of sales.
� Capitalised exploration and evaluation costs associated with oil and gas activities, such as licence acquisition costs, exploratory drilling costs, trenching and sampling costs, are presented as intangible assets. Previously the Group presented such capitalised costs as property, plant andequipment. The Directors consider the change of accounting presentation better reflects the nature of such costs. The impact of the change in accounting presentation is to report £41 million of exploration and evaluation costs within intangible assets as at 31 December 2007 and £29 million in investing cash outflows relating to purchases of intangible assets for the year ending 31 December 2007. The impact on comparatives is to reclassify £24 million of capitalised costs from property, plant and equipment to intangible assetsas at 31 December 2006 and to reclassify £23 million of investing cash outflows from purchases of property, plant and equipment to purchases of intangible assets for the year ending 31 December 2006.
(d) Change to reported segments In 2007 the Group changed its reportable segments creating a Power generation segment and an Industrial and commercial reportable segment. Prior to 2007 these two segments were reported together as Industrial sales and wholesaling.
The new Power generation segment comprises the Group’s UK generation assets including the Spalding power station,associated emissions activity, as well as flexible volume power procurement contracts. Beginning in 2007, sales of generated power from Centrica Energy to other Group segments is transferred and reported at fair value. Prior to 2007, the sale of generated power from Centrica Energy to other Group segments was transferred and reported at cost. As a result of the change,
Power generation and Industrial and commercial are now reported separately. Consequently, the basis on which operating costs are allocated to other Group segments has also changed. Prior period comparatives have not been restated as it is impracticable to provide this information on an equivalent basis. For the purpose of comparison, had the Group continued withits previous basis of segmental reporting with inter-segment transfers of power reported on a cost basis, and operating costs allocated to segments with reference to the cost methodology, the Power generation and Industrial and commercial segments together would have reported gross segment revenues of £1,027 million, inter-segment revenue of £185 million andexternally reported segment revenue of £842 million and anoperating profit before exceptional items and certain re-measurements of £130 million (loss of £8 million after exceptional items and certain re-measurements) for the year ending 31 December 2007. In addition for the year ending 31 December 2007, British Gas Residential would have reported an increase to operating profit of £61 million, British Gas Business wouldhave reported an increase to operating profit of £9 million, Gas production and development would have reported an increase in operating profit of £24 million and Accord energy trading would have reported an increase in operating profit of £1 million, all before exceptional items and certain re-measurements.
(e) Income statement presentation The Group’s Income Statement and segmental note separately identify the effects of re-measurement of certain financial instruments, and items which are exceptional, in order to provide readers with a clear and consistent presentation of the Group’s underlying performance, as described below.
Certain re-measurements As part of its energy procurement activities the Group enters into a range of commodity contracts designed to achieve security of energy supply. These contracts comprise both purchases and sales and cover a wide range of volumes, prices and timescales. The majority of the underlying supply comes from high volume long-term contracts which are complemented by short-term arrangements. These short-term contracts are entered into for the purpose of balancing energy supplies and customer demand and to optimise the price paid by the Group. Short-term demand canvary significantly as a result of factors such as weather, power generation profiles and short-term movements in market prices.
Many of the energy procurement contracts are held for the purpose of receipt or delivery of commodities in accordance with the Group’s purchase, sale or usage requirements and are therefore out of scope of IAS 39, Financial Instruments: Recognition and Measurement. However, a number of contracts are considered to be derivative financial instruments and arerequired to be fair valued under IAS 39, primarily because their terms include the ability to trade elements of the contracted volumes on a net-settled basis.
The Group has shown the fair value adjustments arising on these contracts separately in the certain re-measurements column. This is because the intention of management is, subject to short-term demand balancing, to use these energy supplies to meetcustomer demand. Accordingly, management believe the ultimate net charge to cost of sales will be consistent with the price of energy agreed in these contracts and that the fair value

60
Centrica plc Annual Report and Accounts 2007
Notes to the Financial Statements continued
adjustments will reverse as the energy is supplied over the life of the contract. This makes the fair value re-measurements very different in nature from costs arising from the physical delivery of energy in the period.
At the balance sheet date the fair value represents the difference between the prices agreed in the respective contracts and the actual or anticipated market price of acquiring the same amount of energy on the open market. The movement in the fair value taken to certain re-measurements in the Income Statement represents the unwind of the contracted volume delivered or consumed during the period, combined with the change in fairvalue of future contracted energy as a result of movements in forward energy prices during the year.
These adjustments represent the significant majority of the items included in certain re-measurements. In addition to these, however, the Group has identified a number of comparable contractual arrangements where the difference between the price which the Group expects to pay or receive under a contract and the market price is required to be fair valuedby IAS 39. These additional items relate to cross-border transportation or transmission capacity, storage capacity and contracts relating to the sale of energy by-products, on which economic value has been created which is not wholly recognised under the requirements of IAS 39. For these arrangements therelated fair value adjustments are also included under certain re-measurements.
These arrangements are managed separately from proprietary energy trading activities where trades are entered into speculatively for the purpose of making profits in their own right. These proprietary trades are included in the results before certain re-measurements.
Exceptional items As permitted by IAS 1, Presentation of Financial Statements, certain items are presented separately. The items that the Group separately presents as exceptional are items which are of a non-recurring nature and, in the judgement of the Directors, need to be disclosed separately by virtue of their nature, size or incidence in order to obtain a clear and consistent presentation of the Group’s underlying business performance. Items which may be considered exceptional in nature include disposals of businesses, business restructurings, the renegotiation of significant contracts and asset write-downs.
Basis of consolidation The Group Financial Statements consolidate the Financial Statements of the Company and entities controlled by the Company (its subsidiaries) made up to 31 December each year, and incorporate the results of its share of jointly controlled entities and associates using the equity method of accounting.
Control is achieved where the Company has the power to governthe financial and operating policies of an investee entity so as to obtain benefits from its activities.
The results of subsidiaries acquired or disposed of during the year are consolidated from the effective date of acquisition or up to the effective date of disposal, as appropriate. Where necessary adjustments are made to the financial statements of subsidiaries,
associates and jointly controlled entities to bring the accounting policies used into line with those used by the Group.
All intra-group transactions, balances, income and expensesare eliminated on consolidation.
Interests in joint ventures A jointly controlled entity is a joint venture which involves the establishment of an entity to engage in economic activity, which the Group jointly controls with its fellow venturers. Under the equity method, investments in jointly controlled entities are carried at cost plus post-acquisition changes in the Group’s share of net assets of the jointly controlled entity, less any impairment in value in individual investments. The Income Statement reflects the Group’s share of the results of operations after tax of the jointly controlled entity.
Certain of the Group’s exploration and production activity is conducted through joint ventures where the venturers havea direct interest in and jointly control the assets of the venture. The results, assets, liabilities and cash flows of these jointly controlled assets are included in the consolidated Financial Statements in proportion to the Group’s interest.
Interests in associatesAn associate is an entity in which the Group has an equity interest and over which it has the ability to exercise significantinfluence. Under the equity method, investments in associates are carried at cost plus post-acquisition changes in the Group’s share of the net assets of the associate, less any impairment invalue in individual investments. The Income Statement reflects the Group’s share of the results of operations after tax of the associate.
Revenue Revenue is recognised to the extent that it is probable that the economic benefits will flow to the Group and the revenue canbe reliably measured. Revenue includes amounts receivable for goods and services provided in the normal course of business, net of discounts, rebates, VAT and other sales related taxes.
Energy supply: Revenue is recognised on the basis of energy supplied during the period. Revenue for energy supply activities includes an assessment of energy supplied to customers between the date of the last meter reading and the year end (unread). Unread gas and electricity is estimated using historical consumption patterns, taking into account the industry reconciliation process for total gas and total electricity usage by supplier, and is included in accrued energy income within trade and other receivables.
Proprietary energy trading: Revenue comprises both realised (settled) and unrealised (fair value changes) net gains and losses from trading in physical and financial energy contracts.
Storage services: Storage capacity revenues are recognised evenly over the contract period, whilst commodity revenues for the injection and withdrawal of gas are recognised at the point of gas flowing into or out of the storage facilities.
Home services and fixed-fee service contracts: Where the Group has an ongoing obligation to provide services, revenues are

61
Directors’ R
eport – Business R
eviewD
irectors’ Report – G
overnanceFinancial S
tatements
Shareholder Inform
ationCentrica plc Annual Report and Accounts 2007
apportioned on a time basis and amounts billed in advance are treated as deferred income and excluded from current revenue. For one-off services, such as installations, revenue is recognised at the date of service provision. Revenue from fixed-fee service contracts is recognised on a straight-line basis over the life of the contract, reflecting the benefits receivable by the customer, which span the life of the contract as a result of emergency maintenance being available throughout the contract term.
Gas production: Revenue associated with exploration and production sales (of natural gas, crude oil and condensates) is recognised when title passes to the customer. Revenue from the production of natural gas, oil and condensates in which the Group has an interest with other producers is recognised based on the Group’s working interest and the terms of the relevantproduction sharing arrangements (the entitlement method). Differences between production sold and the Group’s share of production are not significant.
Power generation: Revenue is recognised on the basis of power supplied during the period.
Interest income: Interest income is accrued on a time basis,by reference to the principal outstanding and at the effective interest rate applicable, which is the rate that exactly discounts estimated future cash receipts through the expected life of thefinancial asset to that asset’s net carrying value.
Cost of salesEnergy supply includes the cost of gas and electricity produced and purchased during the period taking into account the industry reconciliation process for total gas and total electricity usage by supplier, and related transportation, distribution, royalty costs and bought in materials and services.
Home services’ and fixed-fee service contracts cost of sales includes direct labour and related overheads on installationwork, repairs and service contracts in the period.
Employee share schemes The Group has a number of employee share schemes, detailed in the Directors’ Report – Corporate Responsibility Review on page 32, the Remuneration Report on pages 42 to 45 and in note 33, under which it makes equity-settled share-based payments to certain employees. Equity-settled share-based payments are measured at fair value at the date of grant (excluding the effect of non market-based vesting conditions). The fair value determined at the grant date is expensed on a straight-line basis together with a corresponding increase in equity over the vesting period, based on the Group’s estimate of the number of awards that will vest and adjusted for the effect of non market-based vesting conditions.
Fair value is measured using methods appropriate to each of the different schemes as follows:
LTIS: awards up to 2005
A Black-Scholes valuation augmented by a Monte Carlo simulation to predict the total shareholder return performance
LTIS: EPS awards after 2005
Market value on the date of grant
LTIS: TSR awards after 2005
A Monte Carlo simulation to predict the total shareholder return performance
Sharesave Black-Scholes ESOS Black-Scholes using an adjusted option
life assumption to reflect the possibility of early exercise
SAS, SIP, DMSSand RSS
Market value on the date of grant
Foreign currencies The consolidated Financial Statements are presented in pounds sterling, which is the functional currency of the Company and the Group’s presentational currency. Each entity in the Group determines its own functional currency and items included in the Financial Statements of each entity are measured using that functional currency. Transactions in foreign currencies are initially recorded at the functional currency rate ruling at the date of the transaction. Monetary assets and liabilities denominated in foreign currencies are retranslated at the functional currency rate of exchange ruling at the balance sheet date. All differences are included in the Income Statement for the period with the exception of exchange differences on foreign currency borrowings that provide a hedge against a net investment in aforeign entity. These are taken directly to equity until the disposal of the net investment, at which time they are recognised in the Income Statement. Non-monetary items that are measured interms of historical cost in a currency other than the functionalcurrency of the entity concerned are translated using theexchange rates as at the dates of the initial transactions.
For the purpose of presenting consolidated Financial Statements, the assets and liabilities of the Group’s foreign subsidiary undertakings, jointly controlled entities and associates are translated into pounds sterling at exchange rates prevailing on the balance sheet date. The results of foreign subsidiary undertakings, jointly controlled entities and associates are translated into pounds sterling at average rates of exchangefor the relevant period. Exchange differences arising from theretranslation of the opening net assets and the results are transferred to the Group’s foreign currency translation reserve, a separate component of equity, and are reported in the Statement of Recognised Income and Expense. In theevent of the disposal of an undertaking with assets and liabilities denominated in a foreign currency, the cumulative translationdifference arising in the foreign currency translation reserve is charged or credited to the Income Statement on disposal.
Exchange differences on foreign currency borrowings, foreign currency swaps and forward exchange contracts used to hedge foreign currency net investments in foreign subsidiaryundertakings, jointly controlled entities and associates are taken directly to reserves and are reported in the Statement of Recognised Income and Expense. All other exchange movements are recognised in the Income Statement for the period.
Business combinations and goodwill The acquisition of subsidiaries is accounted for using thepurchase method. The cost of the acquisition is measured as the cash paid and the aggregate of the fair values, at the date of exchange, of other assets given, liabilities incurred or assumed,

62
Centrica plc Annual Report and Accounts 2007
Notes to the Financial Statements continued
and equity instruments issued by the Group in exchange for control of the acquiree, plus any costs directly attributable to the business combination. The acquiree’s identifiable assets, liabilities and contingent liabilities that meet the conditions for recognition under IFRS 3, Business Combinations are recognised at their fair value at the acquisition date, except for non-current assets (or disposal groups) that are classified as held for resale in accordance with IFRS 5, Non-Current Assets Held for Sale and Discontinued Operations, which are recognised and measuredat fair value less costs to sell.
Goodwill arising on a business combination represents the excess of the cost of acquisition over the Group’s interest in the fair value of the identifiable assets and liabilities of a subsidiary, jointly controlled entity or associate at the date of acquisition.Goodwill is initially recognised as an asset at cost and is subsequently measured at cost less any accumulated impairment losses. If, after reassessment, the Group’s interest in the net fair value of the acquiree’s identifiable assets, liabilities and contingent liabilities exceeds the cost of the business combination, the excess is recognised immediately in the Income Statement.
The interest of minority shareholders in the acquiree is initially measured at the minority’s proportion of the net fair value of the assets, liabilities and contingent liabilities recognised.
Goodwill which is recognised as an asset is reviewed for impairment, annually, or more frequently if events or changes in circumstances indicate that the carrying amount may be impaired. Any impairment is recognised immediately in theIncome Statement and is not subsequently reversed.
For the purpose of impairment testing, goodwill is allocated to each of the Group’s cash-generating units or groups of cash-generating units that expect to benefit from the business combination in which the goodwill arose. Cash-generating unitsto which goodwill has been allocated are tested for impairment annually, or more frequently when there is an indication that the unit may be impaired. If the recoverable amount of the cash-generating unit or groups of cash-generating units is less than the carrying amount of the unit, the impairment loss is allocatedfirst to reduce the carrying amount of any goodwill allocated tothe unit and then to the other assets of the unit pro-rata on the basis of the carrying amount of each asset in the unit.
On disposal of a subsidiary, associate or jointly controlled entity, the attributable amount of goodwill is included in thedetermination of the profit or loss on disposal.
Other intangible assetsIntangible assets acquired separately are measured on initial recognition at cost. Intangible assets include emissions trading schemes, renewable obligation certificates and certain exploration and evaluation expenditures, the accounting policies for which are dealt with separately below. For purchased application software, for example investments in customer relationship management and billing systems, cost includes contractors’ charges, materials, directly attributable labour and directly attributable overheads.
Capitalisation begins when expenditure for the asset is being incurred and activities necessary to prepare the asset for use are in progress. Capitalisation ceases when substantially
all the activities that are necessary to prepare the asset for use are complete. Amortisation commences at the point of commercial deployment. The cost of intangible assets acquired in a business combination is their fair value as at the date of acquisition. Following initial recognition, intangible assets are carried at cost less any accumulated amortisation and any accumulated impairment losses. The useful lives of intangibleassets are assessed to be either finite or indefinite. Intangibleassets with finite lives are amortised over the useful economic life and assessed for impairment whenever there is an indication that the intangible asset may be impaired. The amortisation periodand the amortisation method for an intangible asset are reviewed at least at each financial year-end. Changes in the expected useful life or the expected pattern of consumption of future economic benefits embodied in the asset are accounted for on a prospective basis by changing the amortisation period or method, as appropriate, and treated as changes in accounting estimates.
Intangible assets are derecognised on disposal, or when no future economic benefits are expected from their use.
Intangible assets with indefinite useful lives are tested for impairment annually either individually or at the cash-generating unit level. Such intangibles are not amortised. The useful life of an intangible asset with an indefinite useful life is reviewed annuallyto determine whether the indefinite life assessment continues to be supportable. If not, the change in the useful life assessment from indefinite to finite is made on a prospective basis.
The amortisation period for the principal categories of intangible assets are as follows:
Application software up to 10 years Licences up to 20 years Consents up to 25 years Contractual customer relationships up to 20 years Identifiable acquired brand Indefinite
EU Emissions Trading Scheme and renewable obligations certificates Granted CO2 emissions allowances received in a period are initially recognised at nominal value (nil value). Purchased CO2
emissions allowances are initially recognised at cost (purchaseprice) within intangible assets. A liability is recognised when the level of emissions exceed the level of allowances granted. Theliability is measured at the cost of purchased allowances up to the level of purchased allowances held, and then at the market price of allowances ruling at the balance sheet date, with movements in the liability recognised in operating profit. Forward contracts for the purchase or sale of CO2 emissions allowances are measured at fair value with gains and losses arising from changes in fair value recognised in the Income Statement. The intangible asset is surrendered at the end of the compliance period reflecting the consumption of economic benefit. As a result no amortisationis recorded during the period.
Purchased renewable obligation certificates are initially recognised at cost within intangible assets. A liability for the renewables obligation is recognised based on the level of electricity supplied to customers, and is calculated in accordance with percentages set by the UK Government and the renewable
63
Directors’ R
eport – Business R
eviewD
irectors’ Report – G
overnanceFinancial S
tatements
Shareholder Inform
ationCentrica plc Annual Report and Accounts 2007
obligation certificate buyout price for that period. The intangibleasset is surrendered at the end of the compliance period reflecting the consumption of economic benefit. As a result no amortisation is recorded during the period.
Property, plant and equipment Property, plant and equipment is included in the Balance Sheet at cost, less accumulated depreciation and any provisions for impairment.
The initial cost of an asset comprises its purchase price or construction cost and any costs directly attributable to bringingthe asset into operation. The purchase price or constructioncost is the aggregate amount paid and the fair value of any other consideration given to acquire the asset.
Freehold land is not depreciated. Other property, plant and equipment, except upstream production assets, are depreciated on a straight-line basis at rates sufficient to write off the cost, less estimated residual values, of individual assets over their estimated useful lives. The depreciation periods for the principal categories of assets are as follows:
Freehold and leasehold buildings up to 50 years Plant 5 to 20 years Power stations and wind farms up to 30 years Equipment and vehicles 3 to 10 years Storage up to 28 years
Assets held under finance leases are depreciated over their expected useful economic lives on the same basis as for owned assets, or where shorter, the lease term.
The carrying values of property, plant and equipment are reviewed for impairment when events or changes in circumstances indicate that the carrying value may not be recoverable.
Residual values and useful lives are re-assessed annually and if necessary changes are accounted for prospectively.
Exploration, evaluation and production assets Centrica uses the successful efforts method of accounting for exploration and evaluation expenditure. Exploration and evaluation expenditure associated with an exploration well, including acquisition costs related to exploration and evaluation activities, are initially capitalised as intangible assets. Certain expenditures such as geological and geophysical exploration costs are expensed. If the prospects are subsequently determined to be successful on completion of evaluation, the relevant expenditure including licence acquisition costs istransferred to property, plant and equipment and depreciated on a unit of production basis. If the prospects are subsequently determined to be unsuccessful on completion of evaluation, the associated costs are expensed in the period in which that determination is made.
All field development costs are capitalised as property, plant and equipment. Such costs relate to the acquisition and installation of production facilities and include development drilling costs, project-related engineering and other technical services costs. Property, plant and equipment, including rights and concessions
related to production activities, are depreciated from the commencement of production in the fields concerned, using the unit of production method, based on all of the proven and probable reserves of those fields. Changes in these estimates are dealt with prospectively.
The net carrying value of fields in production and development is compared on a field-by-field basis with the likely discountedfuture net revenues to be derived from the remaining commercial reserves. An impairment loss is recognised where it is considered that recorded amounts are unlikely to be fully recovered from the net present value of future net revenues. Exploration and productionassets are reviewed annually for indicators of impairment.
Decommissioning costs Provision is made for the net present value of the estimated cost of decommissioning gas production facilities at the end of the producing lives of fields, and storage facilities and power stations at the end of the useful life of the facilities, based on price levels and technology at the balance sheet date.
When this provision gives access to future economic benefits,a decommissioning asset is recognised and included within property, plant and equipment. Changes in these estimates and changes to the discount rates are dealt with prospectively and reflected as an adjustment to the provision and corresponding decommissioning asset included within property, plant and equipment. For gas production facilities and offshore storage facilities the decommissioning asset is amortised using the unit of production method, based on proven and probable reserves. For power stations the decommissioning asset is amortised on a straight-line basis over the useful life of the facility. The unwinding of the discount on the provision is included in the Income Statement within interest expense.
Leases The determination of whether an arrangement is, or contains, a lease is based on the substance of the arrangement and requires an assessment of whether the fulfilment of the arrangement is dependent on the use of a specific asset or assets and the arrangement conveys a right to use the asset. Leases are classified as finance leases whenever the terms of the leasetransfer substantially all the risks and rewards of ownership tothe lessee. All other leases are classified as operating leases. Assets held under finance leases are capitalised and includedin property, plant and equipment at their fair value, or if lower,at the present value of the minimum lease payments, each determined at the inception of the lease. The obligations relating to finance leases, net of finance charges in respect of future periods, are included within bank loans and other borrowings, with the amount payable within 12 months included in bankoverdrafts and loans within current liabilities. Lease payments are apportioned between finance charges and reduction of the finance lease obligation so as to achieve a constant rate of interest on the remaining balance of the liability. Finance charges are charged directly against income.
Payments under operating leases are charged to the Income Statement on a straight-line basis over the term of the relevant lease.

64
Centrica plc Annual Report and Accounts 2007
Notes to the Financial Statements continued
Impairment of property, plant and equipment and intangible assets excluding goodwill At each balance sheet date, the Group reviews the carrying amounts of its intangible assets and property, plant and equipment to determine whether there is any indication that those assets have suffered an impairment loss. If any such indication exists, the recoverable amount of the asset is estimated in order to determine the extent of any impairment loss. Where the asset does not generate cash flows that are independent from other assets, the Group estimates the recoverable amount of the cash-generating unit to which the asset belongs. An intangible asset with an indefinite useful life is tested for impairment annually and whenever there is an indication that the asset may be impaired.
Recoverable amount is the higher of fair value less costs to sell and value in use. In assessing value in use, the estimated future cash flows are discounted to their present value using a pre-tax discount rate that reflects current market assessments of the time value of money and the risks specific to the asset concerned.
If the recoverable amount of an asset (or cash-generating unit) is estimated to be less than its carrying amount, the carrying amount of the asset (cash-generating unit) is reduced to its recoverable amount. An impairment loss is recognised immediately as an expense.
An impairment loss is reversed only if there has been a change in the estimate used to determine the asset’s recoverable amount since the last impairment loss was recognised. Where animpairment loss subsequently reverses, the carrying amount of the asset (cash-generating unit) is increased to the revised estimate of its recoverable amount, but so that the increased carrying amount does not exceed the carrying amount that would have been determined had no impairment loss been recognised for the asset (cash-generating unit) in prior years. A reversal of an impairment loss is recognised as income immediately. After such a reversal the depreciation or amortisation charge, where relevant, is adjusted in future periods to allocate the asset’s revised carrying amount, less any residual value, on a systematic basis over its remaining useful life.
Non-current assets held for sale Non-current assets (and disposal groups) classified as held for sale are measured at the lower of carrying amount and fair value less costs to sell. No depreciation is charged in respect of non-current assets classified as held for sale.
Non-current assets and disposal groups are classified as heldfor sale if their carrying amount will be recovered through a saletransaction rather than through continuing use. This condition is regarded as met only when the sale is highly probable and the asset (or disposal group) is available for immediate sale in its present condition. Management must be committed to the sale which should be expected to qualify for recognition as a completed sale within one year from the date of classification.
Inventories Inventories, excluding inventories of gas and oil, are valued on a first-in, first-out basis, at the lower of cost and estimated net realisable value after allowance for redundant and slow-moving items. Inventories of gas and oil are valued on a weighted average basis, at the lower of cost and estimated net realisable value.
Take-or-pay contracts Where payments are made to external suppliers under take-or-pay obligations for gas not taken, they are treated as prepayments and included within other receivables, as they generate future economic benefits.
Pensions and other post-retirement benefits The Group operates a number of defined benefit pension schemes. The cost of providing benefits under the defined benefit schemes is determined separately for each scheme using theprojected unit credit actuarial valuation method. Actuarial gains and losses are recognised in full in the period in which they occur. They are recognised outside the Income Statement andpresented in the Statement of Recognised Income and Expense.
The cost of providing retirement pensions and other benefits is charged to the Income Statement over the periods benefitingfrom employees’ service. Past service cost is recognised immediately to the extent that the benefits are already vested, and otherwise is amortised on a straight-line basis over the average period until the benefits become vested. The difference between the expected return on scheme assets and the change in present value of scheme obligations resulting from the passage of time is recognised in the Income Statement within interest income or interest expense.
The retirement benefit obligation/asset recognised in the Balance Sheet represents the present value of the defined benefit obligation of the schemes as adjusted for unrecognised past service cost, and the fair value of the schemes’ assets.
ProvisionsProvisions are recognised when the Group has a present obligation (legal or constructive) as a result of a past event, thatcan be reliably measured, and it is probable that the Group will be required to settle that obligation. Provisions are measured atthe Directors’ best estimate of the expenditure required to settle the obligation at the balance sheet date, and are discounted to present value where the effect is material. Where discounting is used, the increase in the provision due to the passage of time is recognised in the Income Statement included withininterest expense.
TaxationCurrent tax, including UK corporation tax, UK petroleum revenuetax and foreign tax, is provided at amounts expected to be paid (or recovered) using the tax rates and laws that have been enacted or substantively enacted by the balance sheet date.
Deferred tax is recognised in respect of all temporary differences identified at the balance sheet date, except to the extent that the deferred tax arises from the initial recognition of goodwill (if amortisation of goodwill is not deductible for tax purposes) or the initial recognition of an asset or liability in a transaction which is not a business combination and at the time of the transaction affects neither accounting profit nor taxable profit and loss. Temporary differences are differences between the carrying amount of the Group’s assets and liabilities and their tax base.
Deferred tax liabilities may be offset against deferred tax assets within the same taxable entity or qualifying local tax group. Any remaining deferred tax asset is recognised only when, on the

65
Directors’ R
eport – Business R
eviewD
irectors’ Report – G
overnanceFinancial S
tatements
Shareholder Inform
ationCentrica plc Annual Report and Accounts 2007
basis of all available evidence, it can be regarded as probable that there will be suitable taxable profits, within the same jurisdiction, in the foreseeable future, against which the deductible temporary difference can be utilised.
Deferred tax is provided on temporary differences arising on subsidiaries, jointly controlled entities and associates, except where the timing of the reversal of the temporary difference canbe controlled and it is probable that the temporary difference will not reverse in the foreseeable future.
Deferred tax is measured at the average tax rates that are expected to apply in the periods in which the asset is realisedor liability settled, based on tax rates and laws that have beenenacted or substantively enacted by the balance sheet date.Measurement of deferred tax liabilities and assets reflects the tax consequences expected to fall from the manner in which the asset or liability is recovered or settled.
Financial instruments Financial assets and financial liabilities are recognised in the Group Balance Sheet when the Group becomes a party to the contractual provisions of the instrument. Financial assets are de-recognised when the Group no longer has the rights to cashflows, the risks and rewards of ownership or control of the asset. Financial liabilities are de-recognised when the obligation under the liability is discharged, cancelled or expires.
(a) Trade receivables Trade receivables are recognised and carried at original invoice amount less an allowance for any uncollectible amounts. Provision is made when there is objective evidence that the Group may not be able to collect the trade receivable. Balances are written off when recoverability is assessed as being remote.
(b) Share capital Ordinary shares are classified as equity. Incremental costs directly attributable to the issue of new shares are shown in equity as a deduction from the proceeds received. Own equity instrumentsthat are reacquired (treasury shares) are deducted from equity. No gain or loss is recognised in the Income Statement onthe purchase, sale, issue or cancellation of the Group’s ownequity instruments.
(c) Cash and cash equivalents Cash and cash equivalents comprise cash in hand and currentbalances with banks and similar institutions, which are readily convertible to known amounts of cash and which are subject toinsignificant risk of changes in value and have an original maturity of three months or less.
For the purpose of the consolidated Cash Flow Statement, cash and cash equivalents consist of cash and cash equivalents as defined above, net of outstanding bank overdrafts.
(d) Interest-bearing loans and other borrowings All interest-bearing loans and other borrowings are initially recognised at fair value net of directly attributable transaction costs.
After initial recognition, interest-bearing loans and other borrowings are subsequently measured at amortised cost using the effective interest method, except when they are the hedged
item in an effective fair value hedge relationship where the carrying value is also adjusted to reflect the fair value movements associated with the hedged risks. Such fair value movements are recognised in the Income Statement. Amortised cost is calculated by taking into account any issue costs, and any discount or premium.
(e) Units issued by The Consumers’ Waterheater Income Fund Prior to deconsolidation as explained in note 3, units issued by The Consumers’ Waterheater Income Fund which contain redemption rights providing unit holders with the right to redeem units back to the Fund for cash or another financial asset are treated as a financial liability and recorded at the present value of the redemption amount. Gains and losses related to changes in the carrying value of the financial liability up to the date of deconsolidation are included in the Income Statement within discontinued operations.
(f) Other financial assets Available-for-sale financial assets are those non-derivative financial assets that are designated as available-for-sale, which are initially recognised at fair value, and included within other financial assets within the Balance Sheet. Available-for-sale financial assets are subsequently recognised at fair value with gains and losses arising from changes in fair value recogniseddirectly in equity and presented in the Statement of Recognised Income and Expense, until the asset is disposed of or is determined to be impaired, at which time the cumulative gain or loss previously recognised in equity is included in the IncomeStatement for the period. Accrued interest or dividends arising on available-for-sale financial assets are recognised in the Income Statement.
Impairment losses recognised in the Income Statement for equity investments classified as available-for-sale are not subsequently reversed through the Income Statement. Impairment losses recognised in the Income Statement for debt instruments classified as available-for-sale are subsequently reversed if an increase in the fair value of the instrument can be objectively related to an event occurring after the recognition of the impairment loss.
(g) Derivative financial instruments The Group routinely enters into sale and purchase transactions for physical delivery of gas, power and oil. A portion of these transactions take the form of contracts that were entered into and continue to be held for the purpose of receipt or delivery of the physical commodity in accordance with the Group’s expected sale, purchase or usage requirements, and are not within the scope of IAS 39.
Certain purchase and sales contracts for the physical delivery of gas, power and oil are within the scope of IAS 39 because they net settle or contain written options. Such contracts are accounted for as derivatives under IAS 39 and are recognised in the Balance Sheet at fair value. Gains and losses arising from changes in fair value on derivatives that do not qualify for hedge accounting are taken directly to the Income Statement for the year.

66
Centrica plc Annual Report and Accounts 2007
Notes to the Financial Statements continued
The Group uses a range of derivatives for both trading and to hedge exposures to financial risks, such as interest rate, foreign exchange and energy price risks, arising in the normal course of business. The use of derivative financial instruments is governed by the Group’s policies approved by the Board of Directors. Further detail on the Group’s risk management policies is included within the Directors’ Report – Governance on pages 39 to 40 and in note 4 to the Financial Statements.
The accounting treatment for derivatives is dependent on whether they are entered into for trading or hedging purposes. A derivative instrument is considered to be used for hedging purposes when it alters the risk profile of an underlying exposure of the Group in line with the Group’s risk management policies and is inaccordance with established guidelines, which require that thehedging relationship is documented at its inception, ensure that the derivative is highly effective in achieving its objective, and require that its effectiveness can be reliably measured. The Group also holds derivatives which are not designated as hedges and are held for trading.
All derivatives are recognised at fair value on the date on whichthe derivative is entered into and are re-measured to fair valueat each reporting date. Derivatives are carried as assets when the fair value is positive and as liabilities when the fair value is negative. Derivative assets and derivative liabilities are offset and presented on a net basis only when both a legal right of set-off exists and the intention to net settle the derivative contracts is present.
The Group enters into certain energy derivative contracts covering periods for which observable market data does not exist. The fair value of such derivatives is estimated by reference in part to published price quotations from active markets, to the extent that such observable market data exists, and in part byusing valuation techniques, whose inputs include data, which is not based on or derived from observable markets. Where the fair value at initial recognition for such contracts differs from the transaction price, a fair value gain or fair value loss will arise.This is referred to as a day-one gain or day-one loss. Such gains and losses are deferred and amortised to the Income Statement based on volumes purchased or delivered over the contractual period until such time observable market data becomes available. When observable market data becomes available, any remaining deferred day-one gains or losses are recognised within the Income Statement. Recognition of the gain or loss that results from changes in fair value depends on the purpose for issuing or holding the derivative. For derivatives that do not qualify for hedge accounting, any gains or losses arising from changes in fair value are taken directly to the Income Statement and are included within gross profit or interest income and interest expense. Gains and losses arising on derivatives entered into for speculative energy trading purposes are presented on a net basis within revenue.
Embedded derivatives: Derivatives embedded in other financialinstruments or other host contracts are treated as separate derivatives when their risks and characteristics are not closely related to those of the host contracts and the host contracts are not carried at fair value, with gains or losses reported in the Income Statement. The closely related nature of embedded derivatives is re-assessed when there is a change in the terms
of the contract which significantly modifies the future cash flows under the contract. Where a contract contains one or more embedded derivatives and providing that the embedded derivative significantly modifies the cash flows under the contract, the option to fair value the entire contract may be taken and the contract will be recognised at fair value with changes in fair value recognised in the Income Statement.
(h) Hedge accounting For the purposes of hedge accounting, hedges are classifiedeither as fair value hedges, cash flow hedges or hedges of net investments in foreign operations.
Fair value hedges: A derivative is classified as a fair value hedge when it hedges the exposure to changes in the fair value of a recognised asset or liability. Any gain or loss from re-measuring the hedging instrument at fair value is recognised immediately in the Income Statement. Any gain or loss on the hedged item attributable to the hedged risk is adjusted against the carrying amount of the hedged item and recognised in the Income Statement. The Group discontinues fair value hedge accounting if the hedging instrument expires or is sold, terminated or exercised, the hedge no longer qualifies for hedge accountingor the Group revokes the designation. Any adjustment to the carrying amount of a hedged financial instrument for which the effective interest method is used is amortised to the Income Statement. Amortisation may begin as soon as an adjustmentexists and shall begin no later than when the hedged item ceases to be adjusted for changes in its fair value attributable to the risk being hedged.
Cash flow hedges: A derivative is classified as a cash flow hedge when it hedges exposure to variability in cash flows that is attributable to a particular risk either associated with a recognised asset, liability or a highly probable forecast transaction. Theportion of the gain or loss on the hedging instrument which is effective is recognised directly in equity while any ineffectiveness is recognised in the Income Statement. The gains or losses that are recognised directly in equity are transferred to the Income Statement in the same period in which the highly probable forecast transaction affects income, for example when the future sale of physical gas or physical power actually occurs. Where the hedged item is the cost of a non-financial asset or liability, the amounts taken to equity are transferred to the initial carrying amount of the non-financial asset or liability on its recognition. Hedge accounting is discontinued when the hedging instrument expires or is sold, terminated or exercised without replacement or rollover, no longer qualifies for hedge accounting or the Group revokes the designation.
At that point in time, any cumulative gain or loss on the hedging instrument recognised in equity remains in equity until the highlyprobable forecast transaction occurs. If the transaction is no longer expected to occur, the cumulative gain or loss recognised in equity is recognised in the Income Statement.
Net investment hedges: Hedges of net investments in foreign operations are accounted for similarly to cash flow hedges. Any gain or loss on the effective portion of the hedge is recognised in equity, any gain or loss on the ineffective portion of the hedge is recognised in the Income Statement. On disposal of the foreign

67
Directors’ R
eport – Business R
eviewD
irectors’ Report – G
overnanceFinancial S
tatements
Shareholder Inform
ationCentrica plc Annual Report and Accounts 2007
operation, the cumulative value of any gains or losses recognised directly in equity is transferred to the Income Statement.
3. Critical accounting judgements and key sources of estimation uncertainty
(a) Critical judgements in applying the Group’s accounting policies In the process of applying the Group’s accounting policies as described in note 2, management has made the followingjudgements that have the most significant effect on the amounts recognised in the Financial Statements (apart from those involving estimations which are dealt with below).
The Consumers’ Waterheater Income Fund The Group has deconsolidated The Consumers’ Waterheater Income Fund (the ‘Fund’) with effect from 1 December 2007,the date of an Internalisation Agreement entered into betweenCentrica and the Fund.
Centrica created the Fund in 2002 to refinance the water heater assets acquired with the Enbridge Services acquisition. The Group consolidated the Fund in accordance with the requirements of SIC-12, Consolidation – Special Purpose Entities, as the substance of the agreements put in place by Centrica indicated that the Fund was created for and on behalf of theGroup. These agreements both predetermined the Fund’sactivities and provided Centrica with operational control, via responsibilities for servicing the Fund’s asset portfolio and administering the Fund’s activities.
In October 2006 the Trustees of the Fund appointed anindependent Chief Executive Officer. The activities undertaken by the Fund started to change following this appointment throughthe independent acquisition of an immaterial business in late 2006, and the independent acquisition of the Toronto Hydro water heater rental business in February 2007, which provided the Fund with a limited number of rental customers held outside of the original contractual arrangements entered into withCentrica. Almost all the significant parts of the relationship, however, remained predetermined or controlled by Centrica. These changes in the conduct of the Fund were judged not to be sufficiently material to alter the Fund’s status as a subsidiary in the 2006 Group accounts.
In 2007 the Trustees of the Fund have sought further changes inthe conduct of the Fund. The Fund has recruited an independentChief Financial Officer and has made further small acquisitions outside of the original contractual arrangements entered into withCentrica. On 1 December 2007, the existing Administration Agreement was replaced, at the instigation of the Fund, by a new Internalisation Agreement, which provides the Fund with access rights to key operational data and provides a basis for employees and business infrastructure to transfer to the Fund, such that itis capable of independent operation from Centrica. Subsequent to this Agreement the Fund has independently refinanced its activities. The Directors believe that the Internalisation Agreement represents a change to the original contractual arrangements with the Fund, and demonstrates that the Fund has both the
desire and the ability to manage its own affairs. Accordingly, in2007 the Directors judge that the Fund’s activities are no longer predetermined such that its activities are being conducted on behalf of Centrica, and thus the Fund ceases to represent a subsidiary of the Centrica Group.
The Group has deconsolidated the Fund with effect from 1 December 2007, the date the Internalisation Agreement became effective and the date of the resultant loss of control, recognising an exceptional profit on disposal amounting to £227 million. The Fund’s activities represented a separate major line of business of the Direct Energy segment, and contributed materially to Group borrowings. In order to provide a clear presentation of the impact of deconsolidating the Fund, the results in the current year and prior year have been presented as a discontinued operation distinct from continuing operations within the Group Income Statement. The details of the disposal and discontinued results are provided in note 35.
Finance lease – Third-party power stationtolling arrangement The Group has entered into a long-term tolling arrangement with the Spalding power station. The contract provides Centrica with the right to nominate 100% of the plant output until 2021 in returnfor a mix of capacity payments and operating payments. The capacity payments comprise both fixed-price and market-priced elements and are dependent on plant availability. Centrica holds an option to extend the tolling arrangement for a further 8 years, notice of which must be provided to the power station operator by 30 September 2020. If the extension option is exercised, Centrica is granted an option to purchase the station at the end of the extended tolling period. The option to purchase must be exercised by serving notice to the generator between30 September 2027 and 30 September 2028. Should Centrica exercise the purchase option the generator can exercise an option to retain the station. Should both options be exercised the valuation of the options, and hence ownership of the asset, will be determined by an expert panel, appointed by both parties. Market-based compensation will be payable to Centrica ifownership is retained by the generator. The Directors have judged that the arrangement should be accounted for as a finance lease as the lease term is judged to be a major part of the economic life of the power station and the present value of the minimum lease payments at inception date of the arrangement amounted to a large part of the fair value of the power station at that time. Details of the finance lease asset, finance lease creditor and interest charges are included innotes 17, 25 and 10 respectively.
EU Emissions Trading Scheme The Group has been subject to the European Emissions Trading Scheme (EU ETS) since 1 January 2005. IFRIC 3, EmissionRights was withdrawn by the IASB in June 2005, and has not yet been replaced by definitive guidance. The Group has adopted an accounting policy, which recognises CO2 emissions liabilities when the level of emissions exceeds the level of allowances granted by the Government in the period. The liability is measured at the cost of purchased allowances up to the level of purchased allowances held, and then at market price of allowances ruling at the balance sheet date. Movements in the liability are reflected within operating profit. Forward contracts for sales and purchases of allowances are measured at fair value.
68
Centrica plc Annual Report and Accounts 2007
Notes to the Financial Statements continued
Petroleum revenue tax (PRT) The definitions of an income tax in IAS 12, Income Taxes, haveled management to judge that PRT should be treated consistently with other income taxes. The charge for the year is presented within taxation on profit from continuing operations in the Income Statement. Deferred amounts are included within deferred tax assets and liabilities in the Balance Sheet.
(b) Key sources of estimation uncertainty The key assumptions concerning the future, and other key sources of estimation uncertainty at the balance sheet date,that have a significant risk of causing a material adjustment to the carrying amounts of assets and liabilities within the next financial year, are discussed below.
Revenue recognition – unread gas and electricity meters Revenue for energy supply activities includes an assessment ofenergy supplied to customers between the date of the last meter reading and the year end (unread). Unread gas and electricity is estimated applying industry standards and using historical consumption patterns taking into account the industry reconciliation process for total gas and electricity usage by supplier. Management applies judgement to the measurement of the estimated energy supplied to customers and to the valuationof that energy consumption. An assessment is made of any factors that are likely to materially affect the ultimate economicbenefits which will flow to the Group, including delays in processing, bill cancellation and re-bill rates and any customer or industry data quality issues. In the period subsequent to the implementation of the new billing system, operational exceptions have been running at a higher level and this has been taken account of in the judgements made. To the extent that the economic benefits are not expected to flow to the Group, the value of the revenue is not recognised. The judgements applied, and the assumptions underpinning these judgements, are considered to be appropriate. However, a change in these assumptions would have an impact on the amount of revenue recognised.
Industry reconciliation process – cost of sales The industry reconciliation process is required as differences arise between the estimated quantity of gas and electricity the Group deems to have supplied and billed customers, and the estimated quantity the industry system operator deems the individual suppliers, including the Group, to have supplied to customers. This difference in deemed supply is referred to as imbalance. The reconciliation process can result in either a higher or lower value of industry deemed supply than has been estimated as being supplied to customers by the Group, but in practice tends to result in a higher value of deemed supply. The Group then reviews the difference to ascertain whether there is evidence that its estimate of amounts supplied to customers is inaccurate or whether the difference arises from other causes. The Group’s share of the resulting imbalance is included within commodity costs charged to cost of sales. Management estimates the level of recovery of imbalance which will be achieved either through subsequent customer billing or through the developing industry settlement process.
Determination of fair values – energy derivatives Derivative contracts are carried in the Balance Sheet at fair value, with changes in fair value recorded in either the Income Statement or equity. Fair values of energy derivatives are estimated by reference in part to published price quotations inactive markets and in part by using valuation techniques. More detail on the assumptions used in determining fair valuations is provided in notes 4 and 28.
Gas and liquids reserves The volume of proven and probable gas and liquids reserves is an estimate that affects the unit of production depreciation of producing gas and oil property, plant and equipment as well as being a significant estimate affecting decommissioning estimates and impairment calculations. The factors impacting gas and liquids estimates, and the process for estimating reserve quantities, are described on page 147.
The impact of a change in estimated proven and probable reserves is dealt with prospectively by depreciating the remaining book value of producing assets over the expected future production. If proven and probable reserves estimates are revised downwards, earnings could be affected by higher depreciation expense or an immediate write-down (impairment) of the asset’s book value.
Decommissioning costs The estimated cost of decommissioning at the end of the producing lives of fields is reviewed periodically and is based on proven and probable reserves, price levels and technology at the balance sheet date. Provision is made for the estimated cost of decommissioning at the balance sheet date. The payment dates of total expected future decommissioning costs are uncertain and dependent on the lives of the facilities, but are currently anticipated to be between 2008 and 2042.
Impairment of goodwill and indefinite livedintangible assets The Group determines whether goodwill and indefinite lived intangible assets are impaired at least on an annual basis. Thisrequires an estimation of the value in use of the cash-generatingunits to which goodwill and indefinite lived intangibles are allocated. Estimating the value in use requires the Group to make an estimate of the expected future cash flows from the cash-generating unit and also to choose a suitable discount rate inorder to calculate the present value of those cash flows. Further detail on the assumptions used in determining value in use calculations is provided in note 16.
Pensions and other post-retirement benefits The Group operates a number of defined benefit pension schemes. The cost of providing benefits under the defined benefit schemes is determined separately for each scheme under theprojected unit credit actuarial valuation method. Actuarial gains and losses are recognised in full in the period in which they occur. The key assumptions used for the actuarial valuation are based on the Group’s best estimate of the variables that will determine the ultimate cost of providing post-employment benefits, onwhich further detail is provided in note 34.

69
Directors’ R
eport – Business R
eviewD
irectors’ Report – G
overnanceFinancial S
tatements
Shareholder Inform
ationCentrica plc Annual Report and Accounts 2007
4. Financial risk management
The Group’s normal operating, investing and financing activities expose it to a variety of financial risks: market risk (including commodity price risk, currency risk, interest rate risk and equity price risk), credit risk and liquidity risk. The Group’s overall risk management process is designed to identify, manage and mitigate business risk, which includes, among others, financial risk. Further detail on the Group’s overall risk management process is included within the Directors’ Report – Governance on pages 39 to 40.
Financial risk management is overseen by the Group Financial Risk Management Committee (FRMC) according to objectives, targets and policies set by the Board. Commodity price risk management, and the associated credit risk management, is carried out in accordance with individual business unit financial risk management policies, as approved by the FRMC and the Board. Treasury risk management, including management of currency risk, interest rate risk, equity price risk and liquidity risk, and the associated credit risk management, is carried out by a central Group Treasury function in accordance with the Group’s financing and treasury policy, as approved by the Board. Downstream credit risk management is carried out in accordance with business unit credit policies.
(a) Market risk management Market risk is the risk of loss that results from changes in market prices (commodity prices, foreign exchange rates, interest rates and equity prices). The level of market risk to which the Group is exposed at a point in time varies depending on market conditions, expectations of future price or market rate movements and the composition of the Group’s physical asset and contract portfolios.
(i) Commodity price risk management The Group is exposed to commodity price risk in its energy procurement, downstream and proprietary energy trading activities.
Energy procurement and downstream activities The Group’s energy procurement and downstream activities consist of downstream positions, equity gas and liquids production andpower generation, strategic procurement and sales contracts, market-traded purchase and sales contracts and derivative positions taken on with the intent of securing gas and power for the Group’s downstream customers in the UK, Europe and North America from a variety of sources at an optimal cost. The Group actively manages commodity price risk by optimising its asset and contract portfolios making use of volume flexibility.
The Group is exposed to commodity price risk in its energy procurement and downstream activities because the cost of procuring gas and electricity to serve its downstream customers varies with wholesale commodity prices. The risk is primarily that market prices for commodities will fluctuate between the time that sales prices are fixed or tariffs are set and the time at which the corresponding procurement cost is fixed, thereby potentially reducing expected margins or making sales unprofitable.
The Group uses specific volumetric limits to manage the exposure to market prices associated with the Group’s energy procurement and downstream activities to an acceptable level. Volumetric limits are supported by a Profit at Risk (PaR) methodology in the UK and a Value at Risk (VaR) methodology in North America and Europe to measure the Group’s exposure to commodity price risk. PaR measures the estimated potential loss in a position or portfolio of positions associated with the movement of a commodity price for a given confidence level, over the remaining term of the position or contract portfolio. VaR measures the estimated potential loss for a given confidence level, over a predetermined holding period. The standard confidence level used is 95%.
The Group measures and manages the commodity price risk associated with the Group’s entire energy procurement and downstream portfolio. Only certain of the Group’s energy procurement and downstream contracts constitute financial instruments under IAS 39(note 2). As a result, while the Group manages the commodity price risk associated with both financial and non-financial energyprocurement and downstream contracts, it is the notional value of energy contracts being carried at fair value that represents the exposure of the Group’s energy procurement and downstream books to commodity price risk according to IFRS 7. This is because energy contracts that are financial instruments under IAS 39 are accounted for on a fair value basis and changes in fair valueimmediately impact profit or equity. Conversely, energy contracts that are not financial instruments under IAS 39 are accounted for as executory contracts and changes in fair value do not immediately impact profit or equity, and as such, are not exposed to commodity price risk as defined by IFRS 7. So while the PaR or the VaR associated with energy procurement and downstream contracts outside the scope of IAS 39 is monitored for internal risk management purposes, these measures are not required to comply with IFRS 7.
The carrying value of energy contracts used in energy procurement and downstream activities at 31 December 2007 is disclosed in note21 and a sensitivity analysis that is intended to illustrate the sensitivity of the Group’s financial position and performance to changes in the fair value or future cash flows of financial instruments associated with the Group’s energy procurement and downstream activities as a result of changes in commodity prices is provided below in section (v).

70
Centrica plc Annual Report and Accounts 2007
Notes to the Financial Statements continued
Proprietary energy trading The Group’s proprietary energy trading activities consist of physical and financial commodity purchases and sales contracts taken on with the intent of benefiting in the short-term from changes in market prices or differences between buying and selling prices. The Group conducts its trading activities over the counter and through exchanges in the UK, North America and parts of the restof Europe. The Group is exposed to commodity price risk as a result of its proprietary energy trading activities because the value of its trading assets and liabilities will fluctuate with changes in market prices for commodities.
The Group sets volumetric and VaR limits to manage the commodity price risk exposure associated with the Group’s proprietary energy trading activities. The VaR used measures the estimated potential loss for a 95% confidence level over a one-day holdingperiod. The holding period used is based on market liquidity and the number of days the Group would expect it to take to close off a trading position.
As with any modelled risk measure, there are certain limitations that arise from the assumptions used in the VaR analysis. VaR assumes that the future will behave like the past and that the Group’s trading positions can be unwound or hedged within the predetermined holding period. Furthermore the use of a 95% confidence level, by definition, does not take into account changes invalue that might occur beyond this confidence level.
The VaR, before taxation, associated with the Group’s proprietary energy trading activities at 31 December 2007 was £9 million (2006: £8 million). The carrying value of energy contracts used in proprietary energy trading activities at 31 December 2007 isdisclosed in note 21.
(ii) Currency risk managementThe Group is exposed to currency risk on foreign currency denominated forecast transactions, firm commitments, monetary assets and liabilities (transactional exposure) and on its net investments in foreign operations (translational exposure).
Transactional currency risk The Group is exposed to transactional currency risk on transactions denominated in currencies other than the underlying functionalcurrency of the commercial operation transacting. The Group’s primary functional currencies are pounds sterling in the UK, Canadian dollars in Canada, US dollars in the US and euros in Europe. The risk is that the functional currency value of cash flows will vary as a result of movements in exchange rates. Transactional exposure arises from the Group’s energy procurement activities in the UK and inCanada, where a proportion of transactions are denominated in euros or US dollars and on certain capital commitments denominated in foreign currencies. In addition, in order to optimise the cost of funding, the Group has, in certain cases, issued foreign currency denominated debt, primarily in US dollars, euros or Japanese yen.
It is the Group’s policy to hedge all material transactional exposures using forward contracts to fix the functional currency value of non-functional currency cash flows. At 31 December 2007, there were no material unhedged non-functional currency monetary assets or liabilities, firm commitments or probable forecast transactions (2006: £nil).
Translational currency risk The Group is exposed to translational currency risk as a result of its net investments in North America and Europe. The risk is that the pounds sterling value of the net assets of foreign operations will decrease with changes in foreign exchange rates. The Group’s policy is to protect the pounds sterling book value of its net investments in foreign operations, subject to certain targets monitored by the FRMC, by holding foreign currency debt, entering into foreign currency derivatives or a mixture of both.
The Group measures and manages the currency risk associated with all transactional and translational exposures. In contrast, IFRS 7 requires disclosure of currency risk arising on financial instruments denominated in a currency other than the functional currency of the commercial operation transacting only. As a result, for the purposes of IFRS 7, currency risk excludes the Group’s net investments in North America and Europe as well as foreign currency denominated forecast transactions and firm commitments. A sensitivity analysis that is intended to illustrate the sensitivity of the Group’s financial position and performance to changes in the fair value or future cash flows of foreign currency denominated financial instruments as a result of changes in foreign exchange rates is provided below in section (v).
(iii) Interest rate risk management In the normal course of business the Group borrows to finance its operations. The Group is exposed to interest rate risk because thefair value of fixed rate borrowings and the cash flows associated with floating rate borrowings will fluctuate with changes in interest rates. The Group’s policy is to manage the interest rate risk on long-term recourse borrowings by ensuring that the exposure tofloating interest rates remains within a 30% to 70% range, including the impact of interest rate derivatives. Note 25 details the interestrates on the Group’s bank overdrafts, loans and other borrowings by the earlier of contractual re-pricing and maturity date and a sensitivity analysis that is intended to illustrate the sensitivity of the Group’s financial position and performance to changes in interest rates is provided below in section (v).

71
Directors’ R
eport – Business R
eviewD
irectors’ Report – G
overnanceFinancial S
tatements
Shareholder Inform
ationCentrica plc Annual Report and Accounts 2007
(iv) Equity price risk management The Group is exposed to equity price risk because certain available-for-sale financial assets, held by the Law Debenture Trust onbehalf of the Company as security in respect of the Centrica Unapproved Pension Scheme, are linked to equity indices (note 34).Investments in equity indices are inherently exposed to less risk than individual equity investments because they represent a naturally diverse portfolio. Note 34 details the Group’s other retirement benefit assets and liabilities.
(v) Sensitivity analysisA financial instrument is defined in IAS 32 as any contract that gives rise to a financial asset of one entity (effectively the contractual right to receive cash or another financial asset from another entity) and a financial liability (effectively the contractual obligation to deliver cash or another financial asset to another entity) or equity instrument (effectively a residual interest in the assets of an entity) of another. IFRS 7 requires disclosure of a sensitivity analysis that is intended to illustrate the sensitivity of the Group’s financial position and performance to changes in market variables (commodity prices, foreign exchange rates, interest rates and equity prices) as a result of changes in the fair value or cash flows associated with the Group’s financial instruments. The sensitivity analysis provided discloses the effect on profit or loss and equity at 31 December 2007 assuming that a reasonably possible change in the relevant risk variable had occurred at 31 December 2007 and been applied to the risk exposures in existence at that date to show the effects of reasonably possible changes in price on profit or loss and equity to the next annual reporting date. The reasonably possible changes inmarket variables used in the sensitivity analysis were determined based on implied volatilities where available or historical data.
The sensitivity analysis has been prepared based on 31 December 2007 balances and on the basis that the balances, the ratio of fixed to floating rates of debt and derivatives, the proportion of energy contracts that are financial instruments, the proportion of financial instruments in foreign currencies and the hedge designations in place at 31 December 2007 are all constant. Excluded from this analysis are all non-financial assets and liabilities and energy contracts that are not financial instruments under IAS 39. The sensitivity to foreign exchange rates relates only to monetary assets and liabilities denominated in a currency other than the functional currency of the commercial operation transacting, and excludes the translation of the net assets of foreign operations to pounds sterling, but not the corresponding impact of net investment hedges.
The sensitivity analysis provided is hypothetical only and should be used with caution as the impacts provided are not necessarily indicative of the actual impacts that would be experienced because the Group’s actual exposure to market rates is constantly changing as the Group’s portfolio of commodity, debt, foreign currency and equity contracts changes. Changes in fair values or cash flows based on a variation in a market variable cannot be extrapolated because the relationship between the change in market variable and the change in fair value or cash flows may not be linear. In addition, the effect of a change in a particular market variable on fair values or cash flows is calculated without considering interrelationships between the various market rates or mitigating actions that would be taken by the Group. The sensitivity analysis provided below excludes the impact of proprietary energy trading assets and liabilities because the VaR associated with the Group’s proprietary energy trading activities has already been provided above in section (i).

72
Centrica plc Annual Report and Accounts 2007
Notes to the Financial Statements continued
4. Financial risk management continued
The impacts of reasonably possible changes in commodity prices on profit and equity, both after taxation, based on the assumptions provided above are as follows:
2007 2006
Energy prices Base price (i)
Reasonablypossible increase
in variable
Reasonablypossible
decreasein variable Base price (i)
Reasonably possible increase
in variable
Reasonably possible
decrease in variable
UK gas (p/therm) 51 +12 -12 35 +6 -6UK power (£/MWh) 52 +11 -11 35 +9 -9UK coal (US$/tonne) 101 +15 -15 70 +10 -10UK emissions (€/tonne) 24 +5 -5 7 +4 -4UK oil (US$/bbl) 88 +14 -14 66 +7 -7North American gas (p/therm) 38 +4 -4 36 +6 -6North American power (£/MWh) 28 +5 -5 29 +5 -5
(i) The base price represents the average forward market price over the duration of the active market curve used in the sensitivity analysis provided.
2007 2006
Incremental profit/(loss)
Impact onprofit
£m
Impact on equity
£m
Impact onprofit
£m
Impact onequity
£m
UK energy prices (combined) – increase 34 56 91 67UK energy prices (combined) – decrease (34) (56) (91) (67)North American energy prices (combined) – increase 103 54 78 95North American energy prices (combined) – decrease (103) (54) (78) (95)
The impacts of reasonably possible changes in interest rates on profit and equity, both after taxation, based on the assumptions provided above are as follows:
2007 2006
Interest rates and incremental profit/(loss)
Reasonablypossible change
in variable%
Impact onprofit
£m
Impact onequity
£m
Reasonably possible change
in variable %
Impact on profit
£m
Impact onequity
£m
UK interest rates +0.50 5 4 +0.50 1 –-0.50 (5) (4) -0.50 (1) –
US interest rates +0.50 – 2 +0.25 1 3-0.50 – (2) -0.25 (1) (3)
Canadian interest rates +0.50 (2) – +0.25 – –-0.50 2 – -0.25 – –
73
Directors’ R
eport – Business R
eviewD
irectors’ Report – G
overnanceFinancial S
tatements
Shareholder Inform
ationCentrica plc Annual Report and Accounts 2007
4. Financial risk management continued
The impacts of reasonably possible changes in foreign currency rates relative to pounds sterling on profit and equity, both after taxation, based on the assumptions provided above are as follows:
2007 2006
Foreign exchange rates and incremental profit/(loss)
Reasonablypossible change
in variable%
Impact on profit
£m
Impact on equity
£m
Reasonably possible change
in variable %
Impact on profit
£m
Impact on equity
£m
US dollar +10 (32) 14 +5 (1) (1)-10 28 (12) -5 1 1
Canadian dollar +10 3 12 +5 (1) 5-10 1 (10) -5 1 (5)
Euro +10 (1) 18 +5 (1) 8-10 1 (17) -5 1 (8)
The impacts of reasonably possible changes in equity prices on profit and equity, both after taxation, based on the assumptionsprovided above are as follows:
2007 2006
Equity prices and incremental profit/(loss)
Reasonably possible
change in variable
%
Impact on profit
£m
Impact on equity
£m
Reasonably possible change
in variable %
Impact on profit
£m
Impact on equity
£m
FTSE 100 +5 – 1 +5 – 1-5 – (1) -5 – (1)
(b) Credit risk management Credit risk is the risk of loss associated with a counterparty’s inability or failure to discharge its obligations under a contract. The Group is exposed to credit risk in its treasury, trading, energy procurement and downstream activities.
Treasury, trading and energy procurement activities Counterparty credit exposures are monitored by individual counterparty and by category of credit rating, and are subject to approved limits. The majority of significant exposures are with A-rated counterparties or better. The Group uses master netting agreements to reduce credit risk and net settles payments with counterparties where net settlement provisions exist. In addition, the Group employs a variety of other methods to mitigate credit risk: margining, various forms of bank and parent company guarantees and letters of credit.
100% of the Group’s credit risk associated with its treasury, trading and energy procurement activities is with counterparties in related energy industries or with financial institutions. The Group measures and manages the credit risk associated with the Group’s entire treasury, trading and energy procurement portfolio. In contrast, IFRS 7 defines credit risk as the risk that one party to a financial instrument will cause a financial loss for the other party by failing to discharge an obligation and requires disclosure of informationabout the exposure to credit risk arising from financial instruments only. Only certain of the Group’s energy procurement contracts constitute financial instruments under IAS 39 (note 2). As a result, while the Group manages the credit risk associated with bothfinancial and non-financial energy procurement contracts, it is the carrying value of financial assets within the scope of IAS 39 (note 28) that represents the maximum exposure to credit risk in accordance with IFRS 7 because credit losses associated with contracts thatare not recognised on the Balance Sheet will not be recognised as such in the Income Statement.

74
Centrica plc Annual Report and Accounts 2007
Notes to the Financial Statements continued
4. Financial risk management continued
Downstream activities In the case of business customers credit risk is managed by checking a company’s creditworthiness and financial strength both before commencing trade and during the business relationship. For residential customers, creditworthiness is ascertained normally before commencing trade by reviewing an appropriate mix of internal and external information to determine the payment mechanism required to reduce credit risk to an acceptable level. Certain customers will only be accepted on a prepayment basis.
In some cases, an ageing of receivables is monitored and used to manage the exposure to credit risk associated with both business and residential customers. In other cases, credit risk is monitored and managed by grouping customers according to method of payment or profile.
Note 21 provides further detail of the Group’s exposure to credit risk on derivative financial instruments, note 20 provides detail of the Group’s exposure to credit risk on trade and other receivables, note 23 provides detail of the Group’s exposure to credit risk on cash and cash equivalents and note 28 provides the carrying value of all financial assets representing the Group’s maximum exposure to credit risk.
(c) Liquidity risk managementLiquidity risk is the risk that the Group will not have sufficient funds to meet it obligations as they come due. Cash forecasts identifying the Group’s liquidity requirements are produced regularly and are stress-tested for different scenarios to ensure sufficient financial headroom exists for at least a 12-month period to safeguard the Group’s ability to continue as a going concern.
In order to manage liquidity risk it is the Group’s policy to maintain committed facilities of at least £1,000 million less available surplus cash resources, to raise at least 50% of its net debt (excluding non-recourse debt) over £200 million in the long-term debt market, to hold a maximum of £400 million of debt maturing in the same calendar year (excluding finance leases and non-recourse borrowings) and to maintain an average term to maturity in the recourse long-term debt portfolio greater than three years.
At 31 December 2007, the Group had undrawn committed bank borrowing facilities of £1,300 million (2006: £1,300 million), 321% (2006: 76%) of the Group’s net debt over £200 million has been raised in the long-term debt market, the average term to maturity of the long-term debt portfolio was 7.1 years (2006: 7.3 years) and there is no calendar year where more than £400 million of debt (excluding finance leases and non-recourse borrowings) will be maturing (2006: same).
5. Capital management
The Group’s objective when managing capital is to maintain an optimal capital structure and strong credit rating to minimise the cost of capital. In addition, in a number of areas in which the Group operates, the Group’s strong capital structure and good credit standing are important elements of the Group’s competitive position.
At 31 December 2007, the Group’s long-term credit rating was A3 for Moody’s Investor Services Inc. (2006: A3) and A for Standard & Poor’s Rating Services (2006: A).
The Group monitors capital, using a medium-term view of 3-5 years, on the basis of a number of financial ratios generally used by industry and by the rating agencies. This includes monitoring gearing ratios, interest cover and cash flow to debt ratios. The Group is not subject to externally imposed capital requirements but as is common for most companies the level of debt that can be raised is restricted by the Company’s Articles of Association. Net debt is limited to the greater of £5 billion and a gearing ratio of three times adjusted capital and reserves. This restriction can be amended or removed by the shareholders of the Company passing an ordinary resolution. As a result of the volatility introduced to the Group’s reserves resulting from IAS 39, Financial Instruments: Recognition and Measurement, and IAS 19, Employee Benefits, changes are being sought to the definition of reserves in the Articles of Association at this year’s Annual General Meeting.
The Group’s capital structure is managed against the various financial ratios as required to maintain strong credit ratings.
In order to maintain or adjust the capital structure, the Group may adjust the amount of dividends paid to shareholders, return capital to shareholders, issue new shares, repurchase shares, issue debt or repay debt.

75
Directors’ R
eport – Business R
eviewD
irectors’ Report – G
overnanceFinancial S
tatements
Shareholder Inform
ationCentrica plc Annual Report and Accounts 2007
6. Segmental analysis
(i) Primary reporting format – business segments The Group’s business segments are distinguished on the basis of the internal management reporting system, and reflect the day-to-day management of the business. The products and services included within each segment are described in the Directors’ Report –Business Review, on pages 8 to 32.
2007
2006(restated)
(v),(vii)
(a) Revenue
Gross segmentrevenue
£m
Less inter-segmentrevenue
(i),(ii),(iii),(v)£m
Grouprevenue
£m
Gross segment revenue
£m
Less inter-segmentrevenue
(i),(ii),(iii),(v)£m
Grouprevenue
£m
Continuing operations: British Gas Residential 6,457 – 6,457 7,112 – 7,112
British Gas Business 2,431 – 2,431 2,303 – 2,303
British Gas Services 1,279 – 1,279 1,104 – 1,104
Gas production and development (i) 923 (624) 299 1,291 (968) 323Power generation (ii),(iv) 880 (578) 302 – – –Industrial and commercial (iv) 838 – 838 – – –Industrial sales and wholesaling (ii),(iv) – – – 1,035 (152) 883Accord energy trading (v) 24 (12) 12 57 (18) 39
Centrica Energy 2,665 (1,214) 1,451 2,383 (1,138) 1,245
Centrica Storage (iii) 403 (63) 340 358 (64) 294
Direct Energy (vi),(vii) 3,992 – 3,992 4,050 – 4,050
European Energy 395 (3) 392 295 – 29517,622 (1,280) 16,342 17,605 (1,202) 16,403
Discontinued operations: The Consumers’ Waterheater Income Fund (vii)
(note 35) 42 – 42 47 – 4742 – 42 47 – 47
Group revenue from continuing operations is derived from the following activities:
2007£m
2006 (restated) (vii)
£m
Sales of goods 14,621 14,840Rendering of services 1,693 1,539Other income 28 24Group revenue 16,342 16,403
(i) Inter-segment revenue arising in Gas production and development is derived from sales of gas produced for other Group segments.(ii) Beginning in 2007, sales of generated power from Power generation to other Group segments is transferred and reported at fair value. Prior to 2007, the sale of
generated power from Centrica Energy to other Group segments was transferred and reported at cost. (iii) Inter-segment revenue arising within Centrica Storage represents the provision of storage facilities to other Group companies, on an arm’s length basis.(iv) In 2007, the Group changed its reportable segments creating a Power generation reportable segment and an Industrial and commercial reportable segment. Prior to
2007, these two segments were reported together as Industrial sales and wholesaling. The change to reported segments is detailed in note 2. Prior period comparativeshave not been restated as it is impracticable to provide this information on an equivalent basis.
(v) The external revenue presented for Accord energy trading comprises both realised (settled) and unrealised (fair value changes) from trading in physical and financial energy contracts. Inter-segment revenue arising in Accord represents the recharge of brokerage fees to other Group segments. Gross segment revenue and inter-segment revenue for Accord have both been increased by £18 million in 2006 to reflect the recharge of brokerage fees as inter-segment revenue to be consistent withthe presentation provided in 2007.
(vi) Direct Energy was disclosed as North American Energy and Related Services in the 2006 Annual Report and Accounts. This change was made to align with internalmanagement reporting.
(vii) Restated to present The Consumers’ Waterheater Income Fund as a discontinued operation as explained in note 3. Discontinued operations previously formedpart of the Direct Energy segment. Direct Energy gross segment revenue inclusive of gross revenue from discontinued operations amounted to £4,034 million (2006: £4,097 million).

76
Centrica plc Annual Report and Accounts 2007
Notes to the Financial Statements continued
6. Segmental analysis continued
Operating profit/(loss)before exceptional items and
certain re-measurementsyear ended 31 December
Exceptional items (note 8)
year ended 31 December
Certain re-measurements (note 8)
year ended 31 December
Operating profit/(loss)after exceptional items and
certain re-measurementsyear ended 31 December
(b) Operating profit 2007
£m
2006 (restated) (iii)
£m2007
£m 2006
£m2007
£m 2006
£m2007
£m
2006 (restated) (iii)
£m
Continuing operations: British Gas Residential 571 95 – (214) 39 (724) 610 (843)
British Gas Business 120 87 – – 317 (408) 437 (321)
British Gas Services 151 102 – (66) – – 151 36
Gas production and development 429 864 – – (16) 32 413 896Power generation (i) 46 – – – (43) – 3 –Industrial and commercial (i) 179 – – – (95) – 84 –Industrial sales and wholesaling (i) – (210) – – – 440 – 230Accord energy trading 9 32 – – (3) 6 6 38
Centrica Energy 663 686 – – (157) 478 506 1,164
Centrica Storage 240 228 – (24) (8) 2 232 206
Direct Energy (ii),(iii) 187 173 – – 53 (264) 240 (91)
European Energy 17 7 – – (9) (15) 8 (8)
Other operations (iv) – 14 – (27) – – – (13)1,949 1,392 – (331) 235 (931) 2,184 130
Discontinued operations: The Consumers’ Waterheater Income Fund (iii) (note 35) 39 50 227 – – – 266 50OneTel (note 35) – (11) – – – – – (11)
39 39 227 – – – 266 39
(i) In 2007, the Group changed its reportable segments creating a Power generation reportable segment and an Industrial and commercial reportable segment. Prior to2007, these two segments were reported together as Industrial sales and wholesaling. The change to reported segments is detailed in note 2. Prior period comparativeshave not been restated as it is impracticable to provide this information on an equivalent basis.
(ii) Direct Energy was disclosed as North American Energy and Related Services in the 2006 Annual Report and Accounts. This change was made to align with internalmanagement reporting.
(iii) Restated to present The Consumers’ Waterheater Income Fund as a discontinued operation as explained in note 3. Discontinued operations previously formed partof the Direct Energy segment. The Direct Energy segment result inclusive of the result from discontinued operations amounted to a profit of £226 million (2006:£223 million) before exceptional items and certain re-measurements and £506 million after exceptional items and certain re-measurements (2006: £41 million loss). Exceptional items and certain re-measurements of the Direct Energy segment inclusive of discontinued operations amounted to a credit of £280 million (2006:£264 million charge).
(iv) In 2006, operating profit before exceptional items and certain re-measurements includes a £20 million gain arising on revisions to the assumptions made in calculating the Group’s defined benefit pension liability. The Schemes’ rules were amended from 1 April 2006 to allow employees to commute a larger amount of their pensionto a cash lump sum on retirement, in line with changes in the Finance Act.

77
Directors’ R
eport – Business R
eviewD
irectors’ Report – G
overnanceFinancial S
tatements
Shareholder Inform
ationCentrica plc Annual Report and Accounts 2007
6. Segmental analysis continued
Share of results of joint ventures and associates
net of interest and taxationyear ended 31 December
Depreciation of property, plant and equipment
year ended 31 December
Amortisation and write-downs of intangibles
year ended 31 December
(c) Included within operating profit 2007
£m 2006
£m2007
£m
2006 (restated) (ii)
£m2007
£m
2006 (restated) (ii)
£m
Continuing operations: British Gas Residential – – 16 17 27 35
British Gas Business – – 3 1 19 14
British Gas Services – – 13 13 4 –
Gas production and development (ii) – – 250 235 8 17Power generation (i) 4 – 93 – 1 –Industrial and commercial (i) – – 1 – – –Industrial sales and wholesaling (i) – – – 95 – 1Accord energy trading – – – – – –
Centrica Energy 4 – 344 330 9 18
Centrica Storage – – 24 23 – –
Direct Energy (ii),(iii),(iv) – – 62 61 15 13
European Energy 1 (12) 2 1 10 10
Other operations (v) – – 9 17 8 35 (12) 473 463 92 93
Discontinued operations: The Consumers’ Waterheater Income Fund (ii) (note 35) – – 21 23 1 –
– – 21 23 1 –
(i) In 2007, the Group changed its reportable segments creating a Power generation reportable segment and an Industrial and commercial reportable segment.Prior to 2007, these two segments were reported together as Industrial sales and wholesaling. The change to reported segments is detailed in note 2. Prior period comparatives have not been restated as it is impracticable to provide this information on an equivalent basis.
(ii) Restated to present exploration and evaluation expenditure, previously reported in property, plant and equipment, in other intangible assets on the Balance Sheet andto present The Consumers’ Waterheater Income Fund as a discontinued operation. Note 2 details the change of accounting presentation and note 3 details thedeconsolidation of The Consumers’ Waterheater Income Fund.
(iii) Direct Energy was disclosed as North American Energy and Related Services in the 2006 Annual Report and Accounts. This change was made to align with internalmanagement reporting.
(iv) Discontinued operations previously formed part of the Direct Energy segment.(v) Depreciation of property, plant and equipment and amortisation and write-downs of intangibles in the Other operations segment are charged out to other
Group segments.

78
Centrica plc Annual Report and Accounts 2007
Notes to the Financial Statements continued
6. Segmental analysis continued
Segment assets31 December
Segment liabilities31 December
Net segment assets/(liabilities) 31 December
Average capital employed (vii) year ended 31 December
(d) Assets and liabilities 2007
£m
2006 (restated)
(i),(ii),(iii)£m
2007£m
2006 (restated) (iii)
£m2007
£m 2006
£m2007
£m 2006
£m
British Gas Residential 1,035 1,531 (1,063) (1,193) (28) 338 400 708
British Gas Business 817 807 (430) (390) 387 417 418 358
British Gas Services 258 249 (167) (192) 91 57 67 80
Gas production and development 1,576 1,170 (480) (499) 1,096 671 678 810Power generation (iv) 2,173 – (272) – 1,901 – 1,422 –Industrial and commercial (iv) 1,532 – (1,889) – (357) – (80) –Industrial sales and wholesaling (i),(iv) – 2,999 – (2,338) – 661 – 1,482Accord energy trading 1,243 1,239 (1,377) (1,288) (134) (49) 34 (194)
Centrica Energy 6,524 5,408 (4,018) (4,125) 2,506 1,283 2,054 2,098
Centrica Storage 503 479 (189) (116) 314 363 350 355
Direct Energy (v) 2,560 2,546 (993) (1,041) 1,567 1,505 1,844 1,846
European Energy (ii) 432 349 (113) (80) 319 269 292 279
Other operations (i),(ii),(vi) 99 104 (295) (223) (196) (119) (106) (47)12,228 11,473 (7,268) (7,360) 4,960 4,113 5,319 5,677
Deferred tax assets/(liabilities) 27 226 (596) (241) (569) (15) Current tax assets/(liabilities) 40 98 (281) (180) (241) (82) Short-term deposits and other financial assets 1,166 697 – – 1,166 697 Bank overdrafts and loans – – (2,014) (2,736) (2,014) (2,736) Retirement benefit assets/ (obligations) 152 – (55) (296) 97 (296) Other 7 1 (24) (40) (17) (39)
Non-operating assets/(liabilities) 1,392 1,022 (2,970) (3,493) (1,578) (2,471) 13,620 12,495 (10,238) (10,853) 3,382 1,642
Less inter-segment (receivables)/payables (1,765) (1,416) 1,765 1,416 – –
11,855 11,079 (8,473) (9,437) 3,382 1,642
(i) In 2007, the Group’s investment in Barrow Offshore Wind Limited has been allocated to Power generation for reporting purposes. In 2006, the segment assets of the Industrial sales and wholesaling segment have been restated by £58 million to reflect this change.
(ii) In 2007, the Group’s investment in Segebel SA and the goodwill related to the acquisition of Oxxio have been allocated to European Energy for external reporting purposes to align with internal management reporting. In 2006, the segment assets of the European Energy segment have been increased by £245 million to reflect this change.
(iii) Restated to reflect change in inter-segment settlement process between British Gas Residential, British Gas Business and Centrica Energy to align with the Group’s external settlement process and to re-classify certain inter-segment funding balances from operating assets and liabilities to non-operating assets and liabilities to alignwith internal management reporting.
(iv) In 2007, the Group changed its reportable segments creating a Power generation reportable segment and an Industrial and commercial reportable segment.Prior to 2007, these two segments were reported together as Industrial sales and wholesaling. The change to reported segments is detailed in note 2. Prior period comparatives have not been restated as it is impracticable to provide this information on an equivalent basis.
(v) Direct Energy was disclosed as North American Energy and Related Services in the 2006 Annual Report and Accounts. This change was made to align with internalmanagement reporting.
(vi) Other operations comprise Group Treasury, Information Services and other shared services.

79
Directors’ R
eport – Business R
eviewD
irectors’ Report – G
overnanceFinancial S
tatements
Shareholder Inform
ationCentrica plc Annual Report and Accounts 2007
6. Segmental analysis continued
(vii) Capital employed represents the investment required to operate each of the Group’s segments. Capital employed is used by the Group to calculate the return on capital employed for each of the Group’s segments as part of the Group’s managing for value concept. Additional value is created when the return on capital employed exceeds the cost of capital. Net segment assets of the Group can be reconciled to the Group’s capital employed as follows:
2007£m
2006£m
Net segment assets 4,960 4,113Less:
Derivative financial instruments 429 1,180Power generation assets under constructionand gas assets under development (563) (175)Cash at bank, in transit and in hand (53) (29)Effect of averaging month-end balances 546 588
Capital employed 5,319 5,677
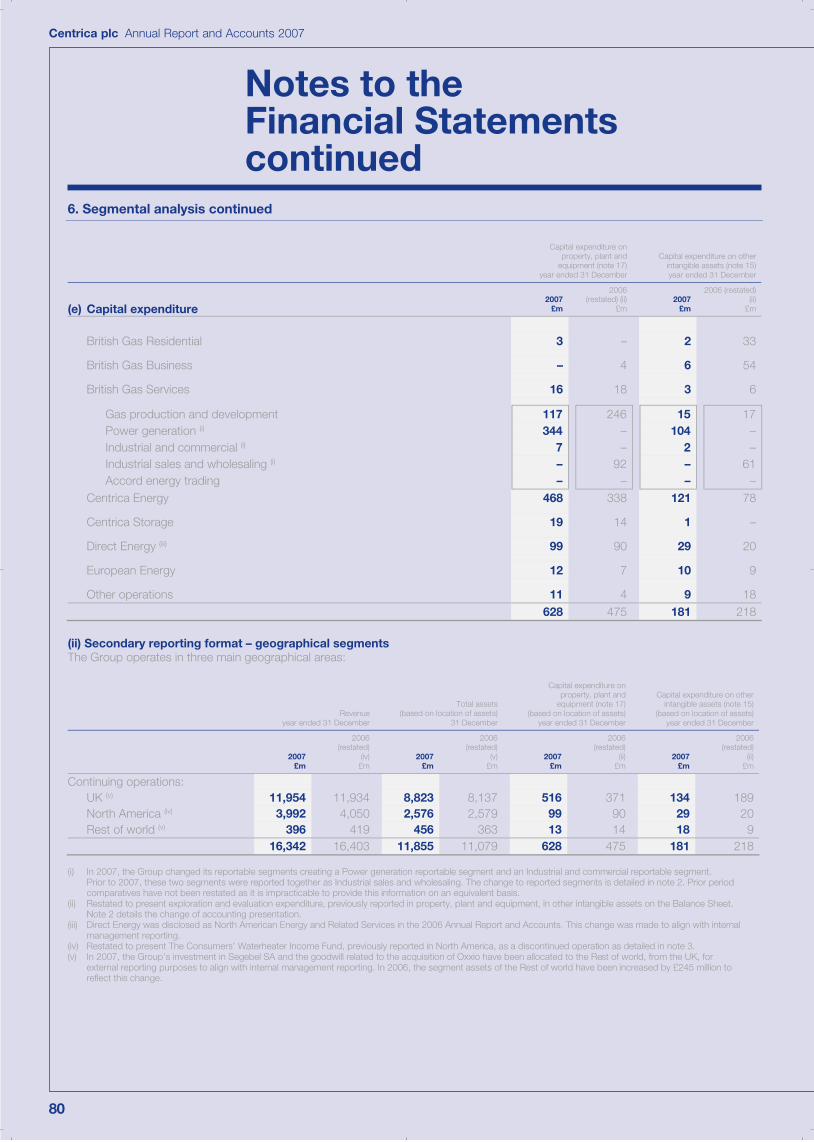
80
Centrica plc Annual Report and Accounts 2007
Notes to the Financial Statements continued
6. Segmental analysis continued
Capital expenditure onproperty, plant and
equipment (note 17) year ended 31 December
Capital expenditure on otherintangible assets (note 15)year ended 31 December
(e) Capital expenditure 2007
£m
2006 (restated) (ii)
£m2007
£m
2006 (restated)(ii)
£m
British Gas Residential 3 – 2 33
British Gas Business – 4 6 54
British Gas Services 16 18 3 6
Gas production and development 117 246 15 17Power generation (i) 344 – 104 –Industrial and commercial (i) 7 – 2 –Industrial sales and wholesaling (i) – 92 – 61Accord energy trading – – – –
Centrica Energy 468 338 121 78
Centrica Storage 19 14 1 –
Direct Energy (iii) 99 90 29 20
European Energy 12 7 10 9
Other operations 11 4 9 18628 475 181 218
(ii) Secondary reporting format – geographical segments The Group operates in three main geographical areas:
Revenueyear ended 31 December
Total assets(based on location of assets)
31 December
Capital expenditure onproperty, plant and
equipment (note 17) (based on location of assets)
year ended 31 December
Capital expenditure on otherintangible assets (note 15)
(based on location of assets)year ended 31 December
2007 £m
2006 (restated)
(iv) £m
2007£m
2006 (restated)
(v)£m
2007£m
2006 (restated)
(ii)£m
2007£m
2006 (restated)
(ii)£m
Continuing operations: UK (v) 11,954 11,934 8,823 8,137 516 371 134 189North America (iv) 3,992 4,050 2,576 2,579 99 90 29 20Rest of world (v) 396 419 456 363 13 14 18 9
16,342 16,403 11,855 11,079 628 475 181 218
(i) In 2007, the Group changed its reportable segments creating a Power generation reportable segment and an Industrial and commercial reportable segment.Prior to 2007, these two segments were reported together as Industrial sales and wholesaling. The change to reported segments is detailed in note 2. Prior period comparatives have not been restated as it is impracticable to provide this information on an equivalent basis.
(ii) Restated to present exploration and evaluation expenditure, previously reported in property, plant and equipment, in other intangible assets on the Balance Sheet.Note 2 details the change of accounting presentation.
(iii) Direct Energy was disclosed as North American Energy and Related Services in the 2006 Annual Report and Accounts. This change was made to align with internalmanagement reporting.
(iv) Restated to present The Consumers’ Waterheater Income Fund, previously reported in North America, as a discontinued operation as detailed in note 3.(v) In 2007, the Group’s investment in Segebel SA and the goodwill related to the acquisition of Oxxio have been allocated to the Rest of world, from the UK, for
external reporting purposes to align with internal management reporting. In 2006, the segment assets of the Rest of world have been increased by £245 million to reflect this change.

81
Directors’ R
eport – Business R
eviewD
irectors’ Report – G
overnanceFinancial S
tatements
Shareholder Inform
ationCentrica plc Annual Report and Accounts 2007
7. Costs of continuing operations
Analysis of costs by nature 2007
£m
2006 (restated) (i),(ii)
£m
Transportation, distribution and metering costs (2,775) (2,658)Commodity costs (7,740) (8,547)Depreciation, amortisation and write-downs (415) (407)Employee costs (415) (366)Other costs relating to energy consumption and provision of services (872) (786)Total cost of sales (12,217) (12,764)
Depreciation, amortisation and write-downs (150) (149)Employee costs (ii) (901) (967)(Loss)/profit on disposal of property, plant and equipment and other intangible assets (7) 17Profit on disposal of businesses 2 3Write-down of inventory – (1)Impairment of trade receivables (note 20) (184) (179)Foreign exchange gains – 3Other operating costs (950) (977)Total operating costs before exceptional items (2,190) (2,250)Exceptional items (note 8) – (331)Total operating costs (2,190) (2,581)
(i) Restated to present costs incurred under the Group’s energy savings programmes in cost of sales and to reflect the deconsolidation of The Consumers’ Waterheater Income Fund. Note 2 details the change of accounting presentation and note 3 explains the deconsolidation of the Fund.
(ii) Employee costs have been increased by £41 million in 2006 to reflect certain employee costs previously reported in other operating costs to align with the currentyear’s presentation of such costs.
Auditors’ remuneration 2007
£m 2006
£m
Fees payable to the Company’s auditor for the audit of the Company’s annual accounts and Group consolidation 2.2 2.2Fees payable to the Company’s auditor and its associates for other services:
The auditing of other accounts within the Group pursuant to legislation (including that of countries and territories outside the UK) (i) 1.2 1.2Other services pursuant to legislation (i) 0.5 0.5Other services relating to taxation – 0.1
All other services 0.5 0.74.4 4.7
Fees in respect of pension schemes: Audit 0.1 0.1
(i) Includes fees in respect of review performed on the interim Financial Statements.
It is the Group’s policy to seek competitive tenders for all major consultancy and advisory projects. Appointments are made taking into account factors including expertise, experience and cost. In addition, the Board has approved a detailed policy defining the types of work for which the auditors can tender and the approvals required. In the past, the auditors have been engaged on assignments additional to their statutory audit duties where their expertise and experience with the Group are particularly important, including tax advice and due diligence reporting on acquisitions.

82
Centrica plc Annual Report and Accounts 2007
Notes to the Financial Statements continued
8. Exceptional items and certain re-measurements
(a) Exceptional items (note 2) 2007
£m 2006
£m
Exceptional items recognised in continuing operations Systems write-down (i) – (196)Business restructuring costs (ii) – (87)
Rough storage incident (iii) – (48)Total exceptional items recognised in continuing operations – (331)Tax credit on exceptional items (i),(ii),(iii) – 93Total exceptional items recognised in continuing operations after taxation – (238)Discontinued operations:
Profit on disposal of The Consumers’ Waterheater Income Fund (note 35) 227 –Total exceptional items recognised 227 (238)
(i) Systems write-down costs in 2006 comprised the write-down of certain major systems developments following a review of their existing and required future functionality.The cost comprises write-downs in British Gas Residential (£178 million) and British Gas Services (£18 million). A tax credit of £59 million was recognised in respect ofthese costs.
(ii) Business restructuring costs in 2006 comprised £67 million from staff reductions at the corporate centre (£3 million), British Gas Residential (£16 million) andBritish Gas Services (£48 million), and £20 million related to the closure of the head office of British Gas Residential. A tax credit of £20 million was recognisedin respect of these costs.
(iii) Centrica Storage operations at Rough suffered a major interruption caused by a fire in February 2006. Our investment in emergency shutdown systems and promptmanagement action mitigated the damage to ensure no loss of life. Following a full assessment of the work needed to restore operations, the costs of the incidentresulted in an exceptional charge before taxation of £48 million (of which £24 million was recognised within Other operations). A tax credit of £14 million was recognisedin respect of the charge.
(b) Certain re-measurements (note 2) 2007
£m 2006
£m
Certain re-measurements recognised in relation to energy contractsNet gains/(losses) arising on delivery of contracts (i) 352 (287)Net losses arising on market price movements and new contracts (ii) (95) (623)Net losses arising on proprietary trades in relation to cross-border transportationor capacity contracts (iii) (13) (6)
Net re-measurement of energy contracts included within gross profit 244 (916)Net losses arising on re-measurement of joint ventures’ energy contracts (iv) (9) (15)Net re-measurement included within Group operating profit 235 (931)Taxation on certain re-measurements (60) 270Net re-measurement after taxation 175 (661)Discontinued operations:
Fair value (losses)/gains arising on re-measurement of the publicly traded units of The Consumers’ Waterheater Income Fund (v) (19) 37
Total certain re-measurements 156 (624)
(i) As energy is delivered or consumed from previously contracted positions, the related fair value recognised in the opening Balance Sheet (representing the difference between forward energy prices at the opening balance sheet date and the contract price of energy to be delivered) is charged or credited to the Income Statement.
(ii) Represents fair value losses arising from the change in fair value of future contracted sales and purchase contracts as a result of changes in forward energy pricesbetween reporting dates (or date of inception and the reporting date, where later).
(iii) Comprises movements in fair value arising on proprietary trades in relation to cross-border transportation or storage capacity, on which economic value has beencreated which is not wholly accounted for under the provisions of IAS 39.
(iv) Certain re-measurements included within Group operating profit also include the Group’s share of the certain re-measurements relating to the energy procurementactivities of joint ventures.
(v) Certain re-measurements included within discontinued operations comprise re-measurement of the publicly traded units of The Consumers’ Waterheater Income Fund. All other re-measurements are included within results before exceptional items and certain re-measurements.
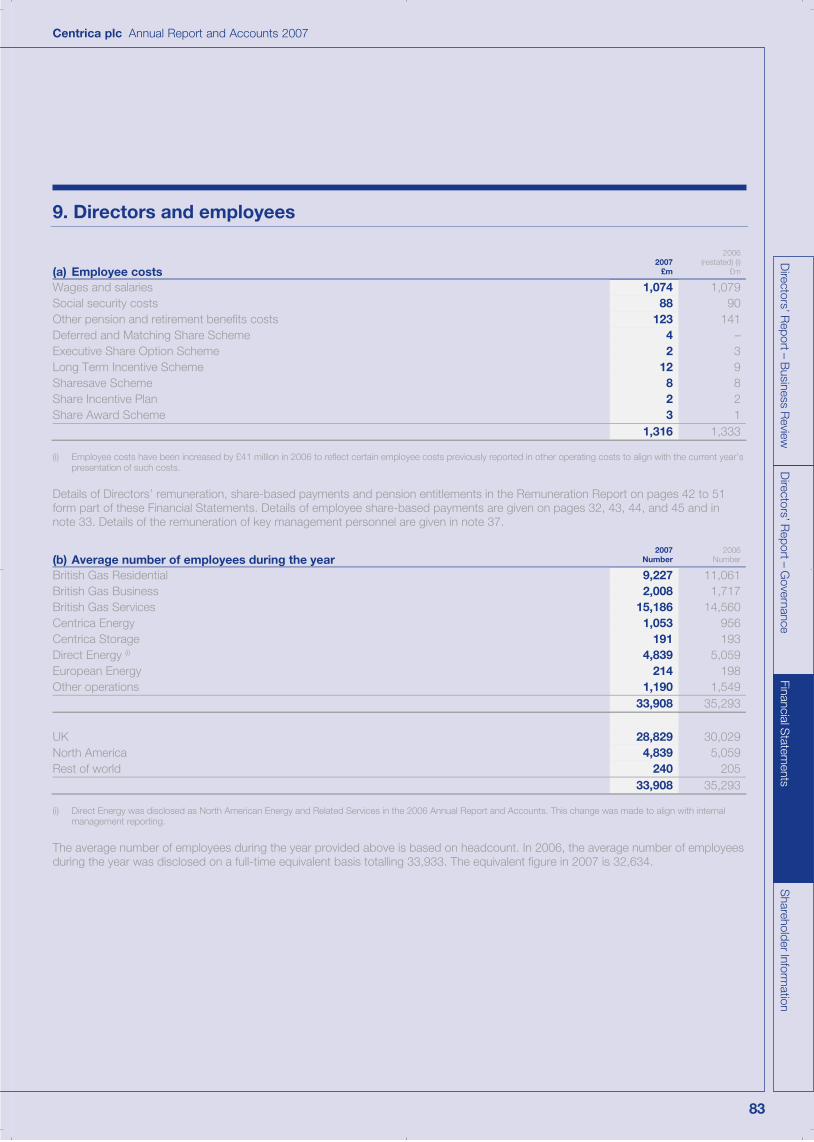
83
Directors’ R
eport – Business R
eviewD
irectors’ Report – G
overnanceFinancial S
tatements
Shareholder Inform
ationCentrica plc Annual Report and Accounts 2007
9. Directors and employees
(a) Employee costs 2007
£m
2006 (restated) (i)
£m
Wages and salaries 1,074 1,079Social security costs 88 90Other pension and retirement benefits costs 123 141Deferred and Matching Share Scheme 4 –Executive Share Option Scheme 2 3Long Term Incentive Scheme 12 9Sharesave Scheme 8 8Share Incentive Plan 2 2Share Award Scheme 3 1
1,316 1,333
(i) Employee costs have been increased by £41 million in 2006 to reflect certain employee costs previously reported in other operating costs to align with the current year’s presentation of such costs.
Details of Directors’ remuneration, share-based payments and pension entitlements in the Remuneration Report on pages 42 to 51form part of these Financial Statements. Details of employee share-based payments are given on pages 32, 43, 44, and 45 and innote 33. Details of the remuneration of key management personnel are given in note 37.
(b) Average number of employees during the year 2007
Number 2006
Number
British Gas Residential 9,227 11,061British Gas Business 2,008 1,717British Gas Services 15,186 14,560Centrica Energy 1,053 956Centrica Storage 191 193Direct Energy (i) 4,839 5,059European Energy 214 198Other operations 1,190 1,549
33,908 35,293
UK 28,829 30,029North America 4,839 5,059Rest of world 240 205
33,908 35,293
(i) Direct Energy was disclosed as North American Energy and Related Services in the 2006 Annual Report and Accounts. This change was made to align with internalmanagement reporting.
The average number of employees during the year provided above is based on headcount. In 2006, the average number of employees during the year was disclosed on a full-time equivalent basis totalling 33,933. The equivalent figure in 2007 is 32,634.
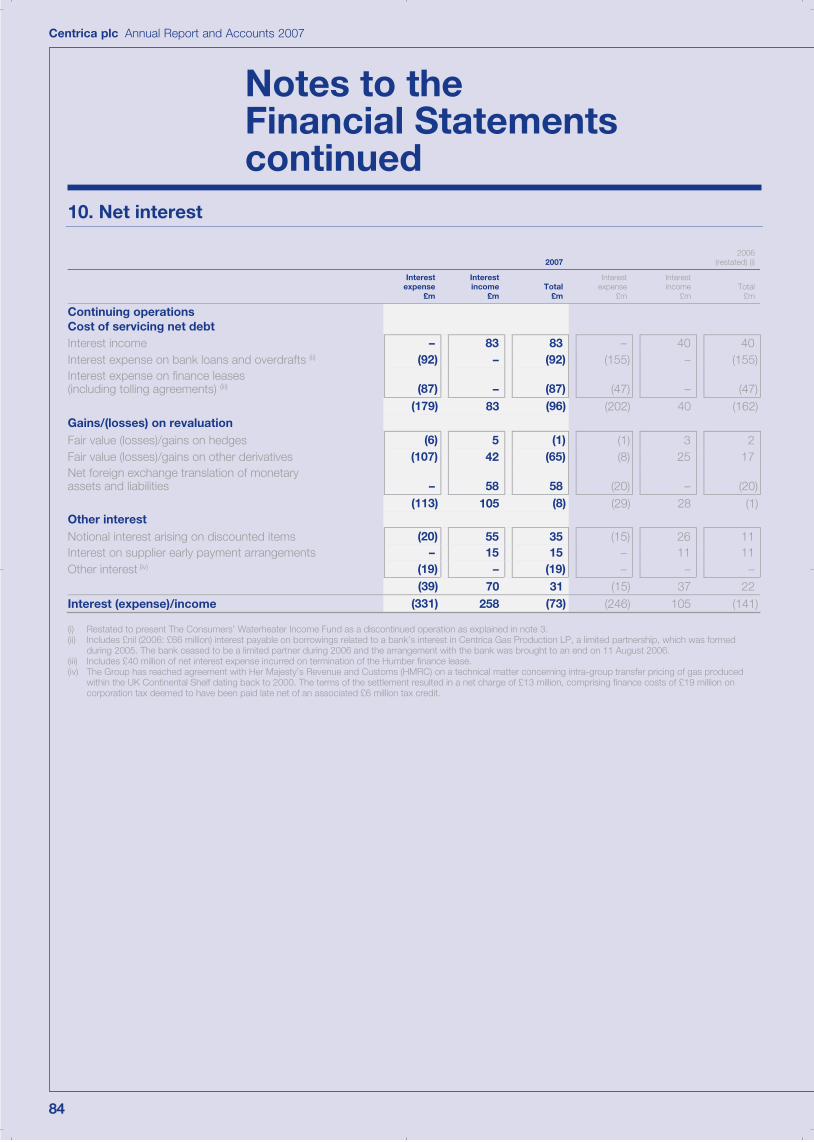
84
Centrica plc Annual Report and Accounts 2007
Notes to the Financial Statements continued
10. Net interest
2007 2006
(restated) (i)
Interestexpense
£m
Interestincome
£m Total
£m
Interestexpense
£m
Interestincome
£mTotal
£m
Continuing operations Cost of servicing net debt Interest income – 83 83 – 40 40Interest expense on bank loans and overdrafts (ii) (92) – (92) (155) – (155)Interest expense on finance leases (including tolling agreements) (iii) (87) – (87) (47) – (47)
(179) 83 (96) (202) 40 (162)Gains/(losses) on revaluation Fair value (losses)/gains on hedges (6) 5 (1) (1) 3 2Fair value (losses)/gains on other derivatives (107) 42 (65) (8) 25 17Net foreign exchange translation of monetary assets and liabilities – 58 58 (20) – (20)
(113) 105 (8) (29) 28 (1)Other interestNotional interest arising on discounted items (20) 55 35 (15) 26 11Interest on supplier early payment arrangements – 15 15 – 11 11Other interest (iv) (19) – (19) – – –
(39) 70 31 (15) 37 22Interest (expense)/income (331) 258 (73) (246) 105 (141)
(i) Restated to present The Consumers’ Waterheater Income Fund as a discontinued operation as explained in note 3.(ii) Includes £nil (2006: £66 million) interest payable on borrowings related to a bank’s interest in Centrica Gas Production LP, a limited partnership, which was formed
during 2005. The bank ceased to be a limited partner during 2006 and the arrangement with the bank was brought to an end on 11 August 2006. (iii) Includes £40 million of net interest expense incurred on termination of the Humber finance lease.(iv) The Group has reached agreement with Her Majesty’s Revenue and Customs (HMRC) on a technical matter concerning intra-group transfer pricing of gas produced
within the UK Continental Shelf dating back to 2000. The terms of the settlement resulted in a net charge of £13 million, comprising finance costs of £19 million oncorporation tax deemed to have been paid late net of an associated £6 million tax credit.

85
Directors’ R
eport – Business R
eviewD
irectors’ Report – G
overnanceFinancial S
tatements
Shareholder Inform
ationCentrica plc Annual Report and Accounts 2007
11. Taxation
(a) Analysis of tax charge for the year 2007
£m
2006 (restated) (i)
£m
The tax charge comprises: Current taxUK corporation tax 309 199UK petroleum revenue tax 200 234Tax on exceptional items and certain re-measurements (note 8) 2 (20)Foreign tax 48 42Adjustments in respect of prior years 4 (25)Total current tax 563 430Deferred taxCurrent year 253 79Adjustments in respect of prior years (19) 10Change in tax rates (ii) (9) 9Tax on exceptional items and certain re-measurements (note 8) 58 (343)UK petroleum revenue tax (32) (7)Foreign deferred tax (1) 8Total deferred tax 250 (244)Total tax on profit from continuing operations 813 186
(i) Restated to present The Consumers’ Waterheater Income Fund as a discontinued operation as explained in note 3.(ii) The effect of the decrease of 2% to the standard rate of UK corporation tax from 1 April 2008 on the relevant temporary differences at 31 December 2007 was a credit
of £12 million. No other material amounts arose as a result of changes introduced by the Finance Act 2007. The effect of changes to foreign tax rates on the relevanttemporary differences at 31 December 2007 was a charge of £3 million. The effect of the increase of 10% to the UK supplementary charge from 1 January 2006 onthe relevant temporary differences at 31 December 2005 was a charge of £9 million.
(iii) Tax on items taken directly to equity is disclosed in note 30.
The Group earns its profits primarily in the UK, therefore the tax rate used for tax on profit on ordinary activities is the standard rate for UK corporation tax, which is currently 30%. A supplementary charge of 20% is also currently applicable on the Group’s UK upstream profits. Taxation for other jurisdictions is calculated at the rates prevailing in those respective jurisdictions.

86
Centrica plc Annual Report and Accounts 2007
Notes to the Financial Statements continued
11. Taxation continued
(b) Factors affecting the tax charge for the year The differences between the total tax shown above and the amount calculated by applying the standard rate of UK corporation taxto the profit before tax is as follows:
2007£m
2006 (restated) (i)£m
Results for theyear before
exceptional itemsand certain
re-measurements£m
Exceptional itemsand certain
re-measurements£m
Results for the year
£m
Results for the year before
exceptional items and certain
re-measurements £m
Exceptional items and certain
re-measurements£m
Results for the year £m
Profit from continuing operations before tax 1,876 235 2,111 1,251 (1,262) (11)
Less: share of (profits)/losses in joint ventures and associates, net of interest and taxation (14) 9 (5) (3) 15 12Group profit from continuing operations before tax 1,862 244 2,106 1,248 (1,247) 1Tax on profit from continuing operations at standard UK corporation tax rate of 30% (2006: 30%) 559 73 632 374 (374) –Effects of:
(Income)/expenses not (chargeable)/deductible for tax purposes 11 – 11 (12) 17 5Adjustments in respect of prior years (15) (15) (30) (15) – (15)Movement in unrecognised deferred tax assets 16 – 16 (71) – (71)UK petroleum revenue tax rates 118 – 118 159 – 159Overseas tax rates 8 5 13 7 (12) (5)Supplementary charge applicable to
upstream profits 65 (3) 62 98 6 104Changes to tax rates (9) – (9) 9 – 9
Group tax charge on profit from continuingoperations 753 60 813 549 (363) 186
(i) Restated to present The Consumers’ Waterheater Income Fund as a discontinued operation as detailed in note 3.
(c) Factors that may affect future tax charges The Group earns income from many activities, including oil and gas production in the UK, North America and elsewhere. On average, the Group pays taxes at higher rates than the UK statutory rate of 30% (2006: 30%). The impact of higher rates, including petroleum revenue tax and the supplementary charge on UK Continental Shelf profits, is subject to the mix of the Group’s income. In the medium-term, the Group’s effective tax rate is expected to remain above the UK statutory rate.
12. Dividends
2007£m
2006£m
Prior year final dividend of 8.00 pence (2006: 7.40 pence) per ordinary share 294 269Interim dividend of 3.35 pence (2006: 3.15 pence) per ordinary share 123 115
417 384
The prior year final dividend was paid on 13 June 2007 (2006: 14 June). The interim dividend was paid on 14 November 2007 (2006: 15 November).
The Directors propose a final dividend of 9.65 pence per share (totalling £355 million) for the year ended 31 December 2007. Thedividend will be submitted for formal approval at the Annual General Meeting to be held on 12 May 2008. These Financial Statements do not reflect this dividend payable, which will be accounted for in shareholders’ equity as an appropriation of retained earnings in the year ending 31 December 2008.

87
Directors’ R
eport – Business R
eviewD
irectors’ Report – G
overnanceFinancial S
tatements
Shareholder Inform
ationCentrica plc Annual Report and Accounts 2007
13. Earnings per ordinary share
Basic earnings per ordinary share has been calculated by dividing the earnings attributable to equity holders of the Company for the year of £1,505 million (2006: loss of £155 million) by the weighted average number of ordinary shares in issue during the year of 3,673 million (2006: 3,643 million).
The Directors believe that the presentation of adjusted basic earnings per ordinary share, being the basic earnings per ordinary share adjusted for certain re-measurements and exceptional items, assists with understanding the underlying performance of the Group.The reconciliation of basic to adjusted basic earnings per ordinary share is as follows:
2007 2006
(a) Continuing and discontinued operations £m
Pence per ordinary
share £m
Pence perordinary
share
Earnings/(loss) – basic 1,505 41.0 (155) (4.3)Net exceptional items after tax (notes 2 and 8) (227) (6.2) 238 6.6Certain re-measurement (gains) and losses after tax (notes 2 and 8) (156) (4.2) 624 17.1Earnings – adjusted basic 1,122 30.6 707 19.4
Earnings/(loss) – diluted 1,505 40.3 (155) (4.3)
Earnings/(loss) – adjusted diluted 1,122 30.0 707 19.0
2007 2006
(b) Continuing operations £m
Pence per ordinary
share £m
Pence perordinary
share
Earnings/(loss) – basic 1,296 35.3 (198) (5.4)Net exceptional items after tax (notes 2 and 8) – – 238 6.6Certain re-measurement (gains) and losses after tax (notes 2 and 8) (175) (4.8) 661 18.0Earnings – adjusted basic 1,121 30.5 701 19.2
Earnings/(loss) – diluted 1,296 34.7 (198) (5.4)
Earnings/(loss) – adjusted diluted 1,121 30.0 701 18.9
2007 2006
(c) Discontinued operations £m
Pence per ordinary
share £m
Pence perordinary
share
Earnings – basic 209 5.7 43 1.1
Earnings – diluted 209 5.6 43 1.1
Certain re-measurements (notes 2 and 8) included within operating profit comprise re-measurements arising on our energy procurement activities and re-measurement of proprietary trades in relation to cross-border transportation or capacity contracts. Certain re-measurements included within discontinued operations comprise re-measurement of the publicly traded units of The Consumers’ Waterheater Income Fund. All other re-measurements are included within results before exceptional items and certain re-measurements.

88
Centrica plc Annual Report and Accounts 2007
Notes to the Financial Statements continued
13. Earnings per ordinary share continued
In addition to basic and adjusted earnings per ordinary share, information is presented for diluted and adjusted diluted earnings per ordinary share. Under this presentation, no adjustments are made to the reported earnings for either 2007 or 2006, however the weighted average number of shares used as the denominator is adjusted for potentially dilutive ordinary shares. In 2006 no adjustment was made to the denominator for diluted earnings per share to reflect potentially dilutive ordinary shares, as to do so would decrease the loss per share.
2007millionshares
2006millionshares
Weighted average number of shares used in the calculation of basic earnings per ordinary share 3,673 3,643Estimated vesting of Long Term Incentive Scheme shares 18 19Dilutive effect of shares to be issued at a discount to market value under the Sharesave Schemes 26 26Potentially dilutive shares issuable under the Executive Share Option Scheme 7 28Estimated vesting of Deferred and Matching Share Scheme shares 7 –Estimated vesting of Share Incentive Plan and Employee Share Purchase Plan shares 3 2Estimated vesting of Share Award Scheme and Restricted Share Scheme shares 2 1Weighted average number of shares used in the calculation of diluted earnings per ordinary share 3,736 3,719
14. Goodwill
2007£m
2006£m
Cost and net book value 1 January 1,055 1,170Acquisitions (note 35) 58 4Disposals (note 35) (124) –Exchange adjustments 85 (119)31 December 1,074 1,055
The net book value of goodwill at 31 December related to the following acquisitions: 2007
£m 2006
£m
Direct Energy 335 288Energy America 23 23Enron Direct/Electricity Direct 133 133Enbridge Services (i) 79 177CPL/WTU 186 188ATCO 46 40Dyno-Rod 17 17Residential Services Group 67 68Oxxio 90 83Newfield UK 55 –Other 43 38
1,074 1,055
(i) The Group has deconsolidated The Consumers’ Waterheater Income Fund with effect from 1 December 2007. Goodwill has been attributed to the Fund on its disposalas explained in note 35.
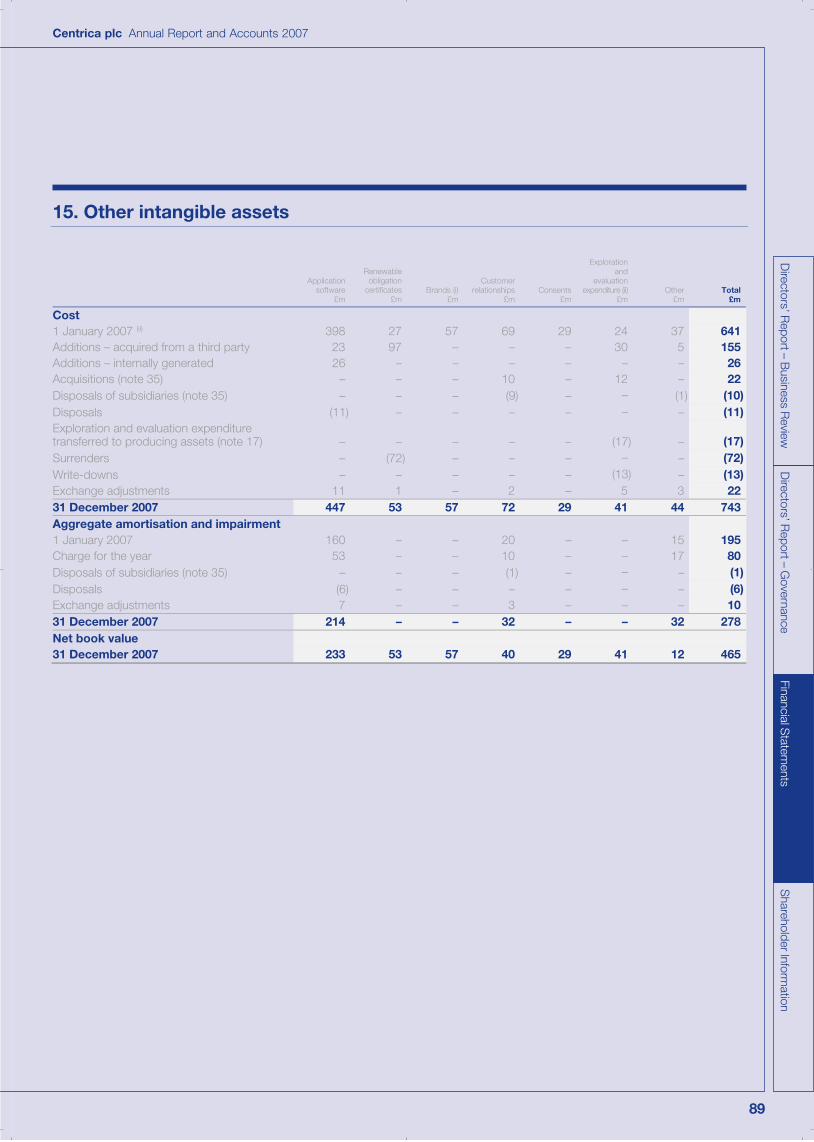
89
Directors’ R
eport – Business R
eviewD
irectors’ Report – G
overnanceFinancial S
tatements
Shareholder Inform
ationCentrica plc Annual Report and Accounts 2007
15. Other intangible assets
Applicationsoftware
£m
Renewable obligation
certificates£m
Brands (i)£m
Customer relationships
£mConsents
£m
Exploration and
evaluationexpenditure (ii)
£mOther
£mTotal
£m
Cost 1 January 2007 (ii) 398 27 57 69 29 24 37 641Additions – acquired from a third party 23 97 – – – 30 5 155Additions – internally generated 26 – – – – – – 26Acquisitions (note 35) – – – 10 – 12 – 22Disposals of subsidiaries (note 35) – – – (9) – – (1) (10)Disposals (11) – – – – – – (11)Exploration and evaluation expenditure transferred to producing assets (note 17) – – – – – (17) – (17)Surrenders – (72) – – – – – (72)Write-downs – – – – – (13) – (13)Exchange adjustments 11 1 – 2 – 5 3 2231 December 2007 447 53 57 72 29 41 44 743Aggregate amortisation and impairment 1 January 2007 160 – – 20 – – 15 195Charge for the year 53 – – 10 – – 17 80Disposals of subsidiaries (note 35) – – – (1) – – – (1)Disposals (6) – – – – – – (6)Exchange adjustments 7 – – 3 – – – 1031 December 2007 214 – – 32 – – 32 278Net book value 31 December 2007 233 53 57 40 29 41 12 465

90
Centrica plc Annual Report and Accounts 2007
Notes to the Financial Statements continued
15. Other intangible assets continued
Applicationsoftware
£m
Renewable obligation
certificates£m
Brands (i)£m
Customer relationships
£mConsents
£m
Exploration and evaluation
expenditure (ii) £m
Other£m
Total£m
Cost 1 January 2006 (ii) 535 48 57 41 29 16 5 731Additions – acquired from a third party 15 60 – 4 – 34 30 143Additions – internally generated 71 – – – – – 4 75Acquisitions – – – 27 – – – 27Disposals (20) – – – – – (2) (22)Exploration and evaluation expenditure transferred to producing assets (note 17) – – – – – (2) – (2)Surrenders – (81) – – – – – (81)Write-downs (196) – – – – (20) – (216)Exchange adjustments (7) – – (3) – (4) – (14)31 December 2006 398 27 57 69 29 24 37 641Aggregate amortisation and impairment 1 January 2006 135 – – 10 – – 1 146Charge for the year 48 – – 11 – – 14 73Disposals (18) – – – – – – (18)Exchange adjustments (5) – – (1) – – – (6)31 December 2006 160 – – 20 – – 15 195Net book value 31 December 2006 238 27 57 49 29 24 22 446
(i) Brands represent the Dyno-Rod brand, acquired on the acquisition of the Dyno group of companies during 2004. In accordance with IAS 38 paragraph 88, management has ascribed the brand an indefinite useful life because there is no foreseeable limit to the period over which the Dyno brand is expected to generate netcash inflows. In reaching this determination, management has reviewed potential threats from competition, the risks of technological obsolescence and the expectedusage of the brand by management.
(ii) Restated to present exploration and evaluation expenditure, previously reported in property, plant and equipment, in other intangible assets on the Balance Sheet.Note 2 details the change of accounting presentation.

91
Directors’ R
eport – Business R
eviewD
irectors’ Report – G
overnanceFinancial S
tatements
Shareholder Inform
ationCentrica plc Annual Report and Accounts 2007
16. Impairment testing of goodwill and intangibles with indefinite useful lives
Goodwill acquired through business combinations and indefinite lived intangibles have been allocated to cash-generating unitsas follows:
2007 2006
Cash-generating unitAcquisition to which goodwill relates
Carryingamount of
goodwill£m
Carryingamount of indefinite
lived brand£m
Total£m
Carrying amount of
goodwill £m
Carryingamount of
indefinitelived brand
£mTotal
£m
British Gas Business Enron Direct/Electricity Direct 133 – 133 133 – 133British Gas Services – Dyno-Rod Dyno-Rod 17 57 74 17 57 74Texas residential energy CPL/WTU 186 – 186 188 – 188Canada mass markets Direct Energy/ATCO 293 – 293 253 – 253Canada Direct Energy business services Direct Energy/ATCO 88 – 88 75 – 75Canada home services (i) Enbridge Services/others 83 – 83 177 – 177US home services Residential Services Group 67 – 67 68 – 68Europe – Oxxio Oxxio 90 – 90 83 – 83Other (ii) Various 117 – 117 61 – 61
1,074 57 1,131 1,055 57 1,112
(i) Carrying amount of goodwill also contains goodwill from other Canada home services acquisitions which are not significant compared with the aggregate carrying value of goodwill reported within the Group. The Group has deconsolidated The Consumers’ Waterheater Income Fund with effect from 1 December 2007. Goodwillhas been attributed to the Fund on its disposal as explained in note 35.
(ii) Goodwill balances allocated across multiple cash-generating units. The amount of goodwill allocated to each cash-generating unit is not significant compared with the aggregate carrying value of goodwill reported within the Group.
Goodwill and indefinite lived intangibles are tested for impairment annually, or more frequently if there are indications that amounts might be impaired. The impairment test involves determining the recoverable amount of the cash-generating units, which corresponds to the fair value less costs to sell or the value in use. Value in use calculations have been used to determine recoverable amounts for the cash-generating units noted above. These are determined using cash flow budgets, which are based on business plans for a period of three years. These business plans have been approved by the Board and are valid when the impairment test is performed. The plans are based on past experience as well as future expected market trends. Cash flows beyond the three-year plan period used in the value in use calculations are increased in line with historic long-term growth rates in the UK, or where applicable the US,Canada, Belgium and the Netherlands. Discount rates applied to the cash flow forecasts in determining recoverable amounts are derived from the Group’s weighted average cost of capital. Discount rates applied to North American cash-generating units range from 9.4% to 9.5%, and from 8.5% to 11.2% for UK and Europe cash-generating units on a pre-tax basis. Growth rates used to extrapolate cash flow projections beyond the period covered by the most recent forecasts range from 1% to 2.5%.
The key assumptions in the value in use calculations determining recoverable amounts for the specific cash-generating units noted above are:
British Gas Business� Budgeted gross margin: for existing contract customers this is based on contracted margins. For new and renewal contract
customers this is based on achieved gross margin in the period prior to the approval of the business plan, adjusted in some areas to reflect market conditions. For tariff customers this is based on current prices in the period prior to the approval of the business plan, adjusted for the Group’s view of the forward energy curve.
� Budgeted market share: based on the average market share achieved immediately prior to the approval of the business plan, adjusted for growth forecasts based on sales and marketing activity.
British Gas Services – Dyno-Rod � Budgeted franchise fee income: based on the average income achieved immediately prior to the approval of the business plan,
adjusted for growth forecasts based on sales and marketing activity. � Budgeted cost growth: based on the cost growth in the period prior to the approval of the business plan.

92
Centrica plc Annual Report and Accounts 2007
Notes to the Financial Statements continued
16. Impairment testing of goodwill and intangibles with indefinite useful lives continued
Texas residential energy � Budgeted gross margin: based on the average gross margin achieved prior to the approval of the business plan, adjusted to reflect
market conditions. � Budgeted market prices: based on a combination of the Group’s view of forward gas and power prices immediately prior to the
approval of the business plan and the price impact of targeted margins. � Budgeted consumption: based on past experience of the average consumption per customer prior to the approval of the
business plan. � Budgeted customer numbers: based on past experience in the three years prior to the approval of the business plan adjusted
for an expected marginal decline in customer numbers.
Canada mass markets � Budgeted gross margin: for existing customers this is based on contracted margins. For new and renewal contract customers this
is based on gross margin achieved in the period immediately prior to the approval of the business plan. � Budgeted market share: based on average market share achieved in the period immediately prior to the approval of the business
plan, adjusted for growth and decline assumptions specific to each of the competitive and regulated businesses. � Budgeted market prices: for existing customers this is based on contracted prices. For new or renewal customers this is based
on the Group’s view of forward gas and power prices in Canada. � Budgeted cost growth: based on current and forecasted experience required to support customer acquisition, renewal, retention
and other servicing activities.
Canada Direct Energy business services � Budgeted gross margin: based on gross margins achieved through recent sales and renewal activity and potentially adjusted
for future expected market conditions. � Budgeted churn: based on historic actual attrition and renewal rates prior to the approval of the business plan. � Budgeted revenue growth: based on management’s view of forward commodity cost curves as provided by the internal energy
management group at the time of approval of the business plan to determine future selling prices. Volume growth is estimated based on average achieved growth in the past, uplifted by expected future growth as a result of the planned sales activities that management believes to be reasonably attainable.
Canada home services � Budgeted gross margin: based on gross margins achieved in the period immediately prior to the approval of the business plan. � Budgeted revenue growth: based on the average revenue growth achieved for the three-year period prior to the approval of the
business plan, uplifted for additional product offerings.
US home services � Budgeted gross margin: based on gross margins achieved in the period immediately prior to the approval of the business plan. � Budgeted revenue growth: based on the average revenue growth achieved over the last three years prior to the approval of the
business plan, uplifted for growth targets based on expected market penetration in certain key US state markets.
Europe – Oxxio � Budgeted revenue growth: based on revenue in the period immediately prior to the approval of the business plan, uplifted
for expected growth in customer base, cross-selling of products and reduction of customer churn.� Budgeted gross margin: based on the average gross margin achieved in periods prior to the approval of the business plan,
adjusted for the expected impact arising from the unbundling of the gas and electricity markets going forward. � Budgeted operating expenditure: based on historical trends, adjusted for cost improvement programmes implemented.
The Group is of the opinion that, based on current knowledge, expected changes in the aforementioned key assumptions on which the determination of the recoverable amounts are based would not cause the recoverable amounts to be less than the carrying amounts of the cash-generating units.
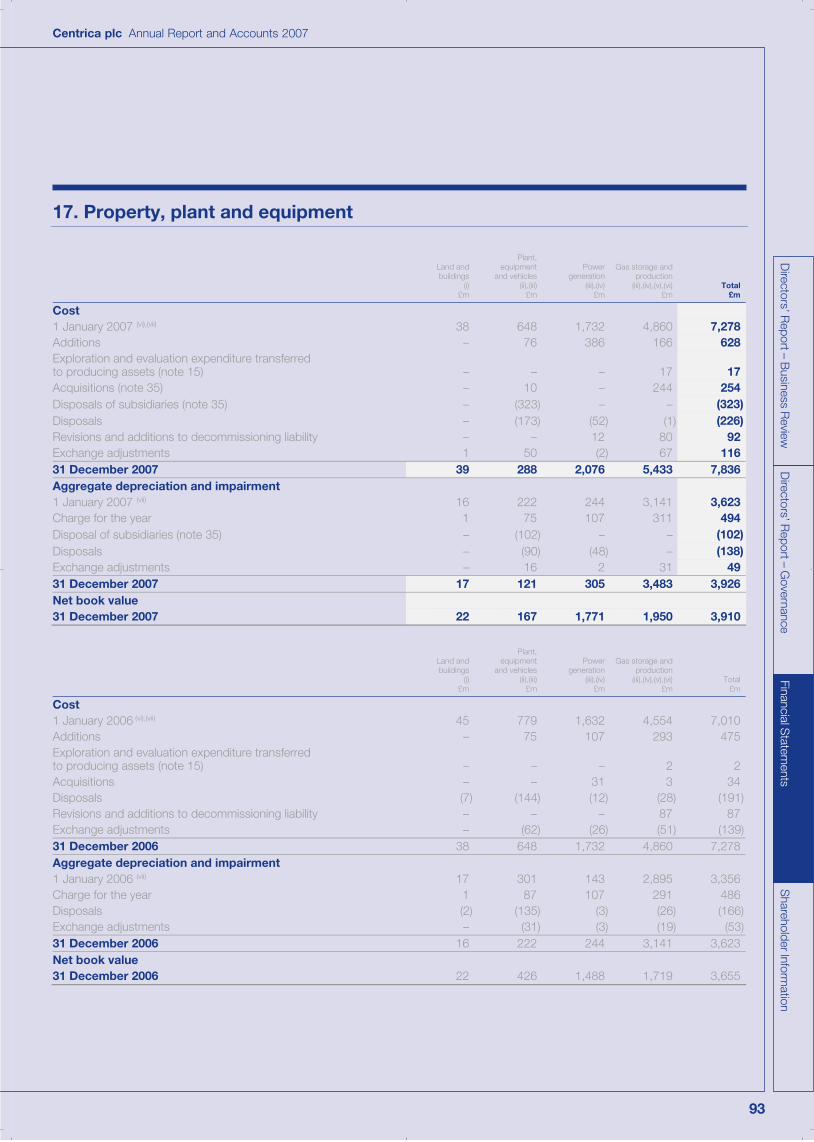
93
Directors’ R
eport – Business R
eviewD
irectors’ Report – G
overnanceFinancial S
tatements
Shareholder Inform
ationCentrica plc Annual Report and Accounts 2007
17. Property, plant and equipment
Land andbuildings
(i)£m
Plant,equipment
and vehicles(ii),(iii)
£m
Power generation
(iii),(iv)£m
Gas storage andproduction
(iii),(iv),(v),(vi)£m
Total£m
Cost 1 January 2007 (vi),(vii) 38 648 1,732 4,860 7,278Additions – 76 386 166 628Exploration and evaluation expenditure transferred to producing assets (note 15) – – – 17 17Acquisitions (note 35) – 10 – 244 254Disposals of subsidiaries (note 35) – (323) – – (323)Disposals – (173) (52) (1) (226)Revisions and additions to decommissioning liability – – 12 80 92Exchange adjustments 1 50 (2) 67 11631 December 2007 39 288 2,076 5,433 7,836Aggregate depreciation and impairment 1 January 2007 (vii) 16 222 244 3,141 3,623Charge for the year 1 75 107 311 494Disposal of subsidiaries (note 35) – (102) – – (102)Disposals – (90) (48) – (138)Exchange adjustments – 16 2 31 4931 December 2007 17 121 305 3,483 3,926Net book value 31 December 2007 22 167 1,771 1,950 3,910
Land andbuildings
(i)£m
Plant,equipment
and vehicles(ii),(iii)
£m
Power generation
(iii),(iv)£m
Gas storage andproduction
(iii),(iv),(v),(vi)£m
Total£m
Cost 1 January 2006 (vi),(vii) 45 779 1,632 4,554 7,010Additions – 75 107 293 475Exploration and evaluation expenditure transferred to producing assets (note 15) – – – 2 2Acquisitions – – 31 3 34Disposals (7) (144) (12) (28) (191)Revisions and additions to decommissioning liability – – – 87 87Exchange adjustments – (62) (26) (51) (139)31 December 2006 38 648 1,732 4,860 7,278Aggregate depreciation and impairment 1 January 2006 (vii) 17 301 143 2,895 3,356Charge for the year 1 87 107 291 486Disposals (2) (135) (3) (26) (166)Exchange adjustments – (31) (3) (19) (53)31 December 2006 16 222 244 3,141 3,623Net book value 31 December 2006 22 426 1,488 1,719 3,655

94
Centrica plc Annual Report and Accounts 2007
Notes to the Financial Statements continued
17. Property, plant and equipment continued
(i) The net book value of land and buildings comprises the following: 2007
£m 2006
£m
Freeholds 14 14Long leaseholds 1 1Short leaseholds 7 7
22 22
(ii) In 2006 the net book value of the fixed assets of The Consumers’ Waterheater Income Fund (the Fund) within plant, equipment and vehicles was £197 million.Debt issued by a subsidiary of the Fund, without recourse to the Group, was secured on the assets. The Fund was deconsolidated with effect from 1 December 2007as explained in note 3.
(iii) Assets in the course of construction are included within the following categories of property, plant and equipment:2007
£m 2006
£m
Plant, equipment and vehicles 7 9Power generation 393 88Gas storage and production 202 73
602 170
2007 2006
(iv) Assets held under finance leases included in totals above
Powergeneration
£m
Gas storageand
production £m
Total £m
Power generation
£m
Gas storageand
production £m
Total£m
Cost at 1 January 882 415 1,297 883 419 1,302Additions 4 – 4 – – –Disposals – – – (1) (4) (5)Transferred out of assets held under finance leases (viii) (417) – (417) – – –Cost at 31 December 469 415 884 882 415 1,297Aggregate depreciation at 1 January 89 344 433 50 340 390Charge for the year 60 8 68 39 6 45Disposals – – – – (2) (2)Transferred out of assets held under finance leases (viii) (59) – (59) – – –Aggregate depreciation at 31 December 90 352 442 89 344 433Net book value at 31 December 379 63 442 793 71 864
Power generation assets are subject to the following restrictions: 2007
£m 2006
£m
Net book value of assets to which title is restricted (Spalding finance lease asset) 379 407Net book value of assets pledged as security for liabilities (viii) – 386
(v) The net book value of decommissioning costs included within gas storage and production assets was £209 million (2006: £124 million). (vi) Restated to present exploration and evaluation expenditure, previously reported in property, plant and equipment, in other intangible assets on the Balance Sheet.
Note 2 details the change of accounting presentation.(vii) 1 January 2006 cost and aggregate depreciation balances for plant, equipment and vehicles were increased to reflect fully depreciated assets that were found to be
still in use. There was no impact on net book value. These assets were fully disposed of on deconsolidation of The Consumers’ Waterheater Income Fund as explainedin note 3.
(viii) Relates to the Humber Power Station that was the subject of a finance lease that was terminated during the year.
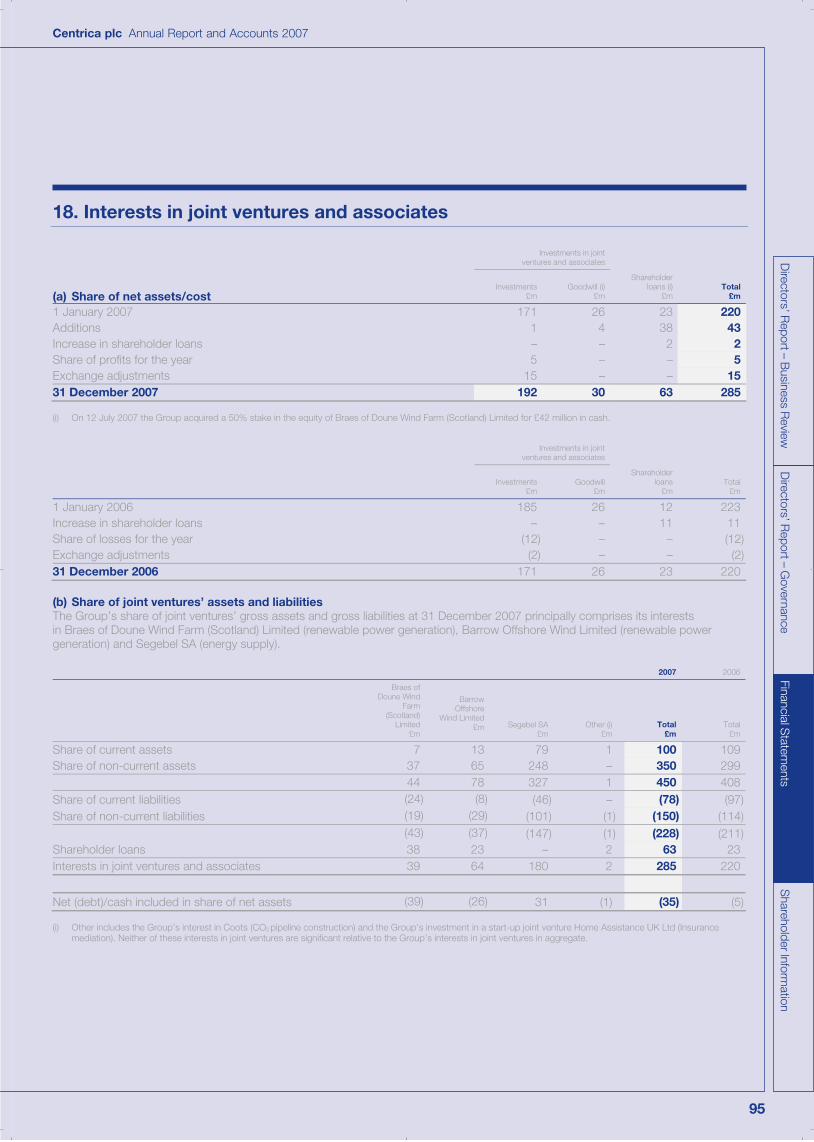
95
Directors’ R
eport – Business R
eviewD
irectors’ Report – G
overnanceFinancial S
tatements
Shareholder Inform
ationCentrica plc Annual Report and Accounts 2007
18. Interests in joint ventures and associates
Investments in jointventures and associates
(a) Share of net assets/cost Investments
£mGoodwill (i)
£m
Shareholderloans (i)
£mTotal
£m
1 January 2007 171 26 23 220Additions 1 4 38 43Increase in shareholder loans – – 2 2Share of profits for the year 5 – – 5Exchange adjustments 15 – – 1531 December 2007 192 30 63 285
(i) On 12 July 2007 the Group acquired a 50% stake in the equity of Braes of Doune Wind Farm (Scotland) Limited for £42 million in cash.
Investments in jointventures and associates
Investments£m
Goodwill£m
Shareholderloans
£mTotal
£m
1 January 2006 185 26 12 223Increase in shareholder loans – – 11 11Share of losses for the year (12) – – (12)Exchange adjustments (2) – – (2)31 December 2006 171 26 23 220
(b) Share of joint ventures’ assets and liabilities The Group’s share of joint ventures’ gross assets and gross liabilities at 31 December 2007 principally comprises its interestsin Braes of Doune Wind Farm (Scotland) Limited (renewable power generation), Barrow Offshore Wind Limited (renewable power generation) and Segebel SA (energy supply).
2007 2006
Braes of Doune Wind
Farm(Scotland)
Limited£m
Barrow Offshore
Wind Limited£m Segebel SA
£mOther (i)
£mTotal
£m Total
£m
Share of current assets 7 13 79 1 100 109Share of non-current assets 37 65 248 – 350 299 44 78 327 1 450 408Share of current liabilities (24) (8) (46) – (78) (97)Share of non-current liabilities (19) (29) (101) (1) (150) (114)
(43) (37) (147) (1) (228) (211)Shareholder loans 38 23 – 2 63 23Interests in joint ventures and associates 39 64 180 2 285 220
Net (debt)/cash included in share of net assets (39) (26) 31 (1) (35) (5)
(i) Other includes the Group’s interest in Coots (CO2 pipeline construction) and the Group’s investment in a start-up joint venture Home Assistance UK Ltd (Insurancemediation). Neither of these interests in joint ventures are significant relative to the Group’s interests in joint ventures in aggregate.

96
Centrica plc Annual Report and Accounts 2007
Notes to the Financial Statements continued
18. Interests in joint ventures and associates continued
2007 2006
(c) Share of joint ventures’ result
Braes of Doune Wind
Farm(Scotland)
Limited£m
Barrow Offshore
Wind Limited£m
Segebel SA £m
Total£m
Total£m
Income 2 7 377 386 344Expenses (2) (2) (375) (379) (363)
– 5 2 7 (19)Tax – (1) (1) (2) 7Share of post-tax results of joint ventures and associates – 4 1 5 (12)
The Group’s share of the investments in and results of Braes of Doune Wind Farm (Scotland) Limited and Barrow Offshore Wind Limited are included within the Power generation segment in 2007. The Group’s share of the investment in and results of Barrow Offshore Wind Limited were included within the Industrial and wholesaling segment in 2006. The Group’s share of the investmentin and results of Segebel SA are included within the European Energy segment.
19. Inventories
2007£m
2006£m
Gas in storage and transportation 134 168Other raw materials and consumables 84 77Finished goods and goods for resale 23 25
241 270
There are no inventories which are carried at fair value less cost to sell (2006: £nil). The Group consumed £488 million of inventories (2006: £390 million) during the year.
20. Trade and other receivables
2007 2006
Current£m
Non-current£m
Current£m
Non-current£m
Financial assets: Trade receivables 1,405 22 1,491 13Accrued energy income 1,678 – 1,730 –Other receivables 553 11 382 3
3,636 33 3,603 16Less: Provision for credit losses (431) – (319) –
3,205 33 3,284 16Non-financial assets:
Prepayments and other receivables 218 – 306 –3,423 33 3,590 16

97
Directors’ R
eport – Business R
eviewD
irectors’ Report – G
overnanceFinancial S
tatements
Shareholder Inform
ationCentrica plc Annual Report and Accounts 2007
20. Trade and other receivables continued
Trade and other receivables include financial assets representing the contractual right to receive cash or other financial assets from residential customers, business customers and treasury, trading and energy procurement counterparties as follows:
2007 2006
Current£m
Non-current£m
Current£m
Non-current£m
Financial assets by class: Residential customers 1,960 23 2,232 12Business customers 802 9 681 4Treasury, trading and energy procurement counterparties 874 1 690 –
3,636 33 3,603 16Less: Provision for credit losses (431) – (319) –
3,205 33 3,284 16
Receivables from residential and business customers are generally considered to be fully performing until such time as the payment that is due remains outstanding past the contractual due date. Contractual due dates range from being due upon receipt to due in30 days. An ageing of the carrying value of trade and other receivables that are past due but not considered to be individually impaired by class is as follows:
2007 2006
Days past due
Residential customers
£m
Business customers
£m
Residentialcustomers
£m
Business customers
£m
Less than 30 days 276 55 281 6830-89 days 174 41 103 28Less than 90 days 450 96 384 9690-182 days 91 47 72 34183-365 days 98 37 62 21Greater than 365 days 62 17 33 7
701 197 551 158
At 31 December 2007 there were £87 million of receivables, net of provisions for credit losses, from residential customers (2006: £98 million) that were considered to be individually impaired. There were no individually impaired receivables, net of provisions for credit losses, from business customers or from treasury, trading and energy procurement counterparties. Receivables from residential customers are generally reviewed for impairment on an individual basis once a customer discontinues their relationship with the Group.
The provision for credit losses is based on an incurred loss model and is determined by application of expected default and loss factors, determined by historical loss experience and current sampling to the various balances receivable from residential and business customers on a portfolio basis, in addition to provisions taken against individual accounts. Balances are written off when recoverability is assessed as being remote. Movements in the provision for credit losses by class are as follows:
2007
Residentialcustomers
£m
Business customers
£mTotal
£m
1 January (270) (49) (319)Impairment of trade receivables (132) (52) (184)Receivables written off 55 20 75Exchange adjustments (3) – (3)31 December (350) (81) (431)

98
Centrica plc Annual Report and Accounts 2007
Notes to the Financial Statements continued
20. Trade and other receivables continued
2006
Residentialcustomers
£m
Business customers
£mTotal
£m
1 January (228) (40) (268)Impairment of trade receivables (143) (36) (179)Receivables written off 102 27 129Exchange adjustments (1) – (1)31 December (270) (49) (319)
At 31 December 2007 the Group held £36 million (2006: £16 million) of customer deposits for the purposes of mitigating the credit risk associated with receivables from residential and business customers.
At 31 December 2007 there was no provision for credit losses associated with receivables from treasury, trading and energy procurement counterparties (2006: £nil) because all balances are considered to be fully recoverable. Exposure to credit risk associated with receivables from treasury, trading and energy procurement counterparties is monitored by counterparty credit rating as follows:
Receivables from treasury, trading and energy procurement counterparties by credit rating
Carrying value£m
AAA£m
AA£m
A£m
BBB £m
BB or lower£m
Unrated£m
2007 875 7 189 277 129 26 2472006 690 4 116 252 125 46 147
The unrated counterparty receivables are comprised primarily of amounts due from subsidiaries of rated entities, exchanges or clearing houses. Receivables from treasury, trading and energy procurement counterparties are managed in accordance with the Group’s credit risk management policies as described in note 4.
21. Derivative financial instruments
Derivative financial instruments are generally held for the purposes of proprietary energy trading, treasury management or energy procurement. Derivatives held for the purposes of proprietary energy trading are carried at fair value, with changes in fair value recognised in the Group’s results for the year before exceptional items and certain re-measurements, with the exception of certain derivatives related to cross-border transportation and capacity contracts (note 2). Derivative financial instruments held for the purposes of treasury management or energy procurement are also carried at fair value, with changes in the fair value of derivatives relating to treasury management reflected in the results for the year before exceptional items and certain re-measurements, and those relating to energy procurement reflected in certain re-measurements. In cases where a derivative qualifies for hedge accounting, derivatives are classified as fair value hedges, cash flow hedges or hedges of a net investment in a foreign operation. Notes 2 and 22 provide further detail on the Group’s hedge accounting.
Energy contracts designated at fair value through profit and loss include certain energy contracts that the Group has, at its option, designated at fair value through profit and loss under IAS 39 because the energy contract contains one or more embedded derivatives that significantly modify the cash flows under the contract (note 2).

99
Directors’ R
eport – Business R
eviewD
irectors’ Report – G
overnanceFinancial S
tatements
Shareholder Inform
ationCentrica plc Annual Report and Accounts 2007
21. Derivative financial instruments continued
The carrying values of derivative financial instruments by product type for accounting purposes are as follows:
2007£m
2006£m
Derivative financial instruments – held for proprietary energy trading Derivative financial instruments – held for trading under IAS 39
Energy derivatives – assets 44 225Energy derivatives – liabilities (52) (199)
(8) 26Derivative financial instruments – held for the purposes of treasury management or energy procurement
Derivative financial instruments – held for trading under IAS 39 Energy derivatives – assets 789 503Energy derivatives – liabilities (1,100) (1,143)Interest rate derivatives – assets 2 2Interest rate derivatives – liabilities (5) (4)Foreign exchange derivatives – assets 19 17Foreign exchange derivatives – liabilities (80) (4)
(375) (629)Energy contracts designated at fair value through profit and loss
Energy derivatives – assets 9 3Energy derivatives – liabilities (86) (57)
(77) (54)Derivative financial instruments in hedge accounting relationships
Energy derivatives – assets 123 16Energy derivatives – liabilities (68) (500)Interest rate derivatives – liabilities (7) (40)Foreign exchange derivatives – assets – 11Foreign exchange derivatives – liabilities (17) (10)
31 (523)Net total (429) (1,180)
The net total reconciles to the Balance Sheet as follows: 2007
£m 2006
£m
Derivative financial instruments – non-current assets 72 17Derivative financial instruments – current assets 914 760
986 777Derivative financial instruments – current liabilities (1,404) (1,737)Derivative financial instruments – non-current liabilities (11) (220)
(1,415) (1,957)Net total (429) (1,180)
The contracts included within energy derivatives are subject to a wide range of detailed specific terms but comprise the following general components:
2007£m
2006£m
Short-term forward market purchases and sales of gas and electricity: UK and Europe 107 (260)
North America (80) (238)Structured gas purchase contracts 250 (226)Structured gas sales contracts (553) (390)Other (65) (38)
Net total (341) (1,152)
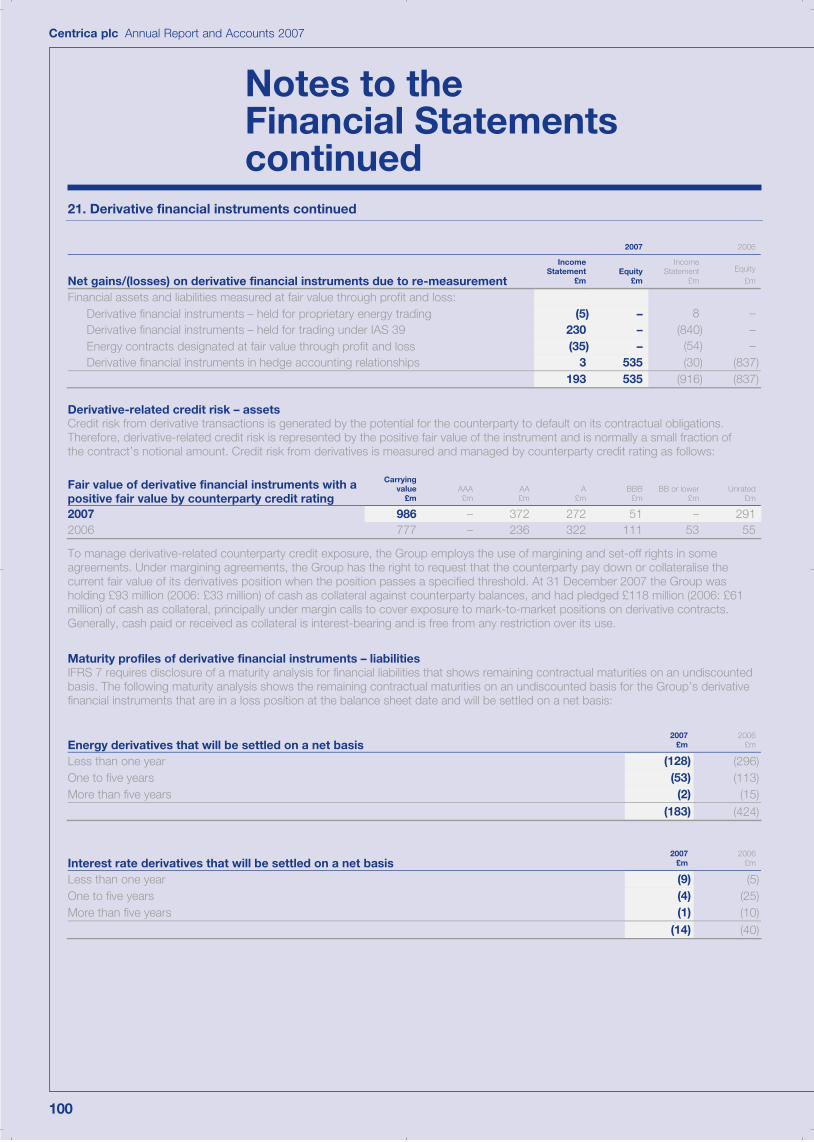
100
Centrica plc Annual Report and Accounts 2007
Notes to the Financial Statements continued
21. Derivative financial instruments continued
2007 2006
Net gains/(losses) on derivative financial instruments due to re-measurement
IncomeStatement
£m Equity
£m
Income Statement
£m
Equity
£m
Financial assets and liabilities measured at fair value through profit and loss: Derivative financial instruments – held for proprietary energy trading (5) – 8 –Derivative financial instruments – held for trading under IAS 39 230 – (840) –Energy contracts designated at fair value through profit and loss (35) – (54) –Derivative financial instruments in hedge accounting relationships 3 535 (30) (837)
193 535 (916) (837)
Derivative-related credit risk – assets Credit risk from derivative transactions is generated by the potential for the counterparty to default on its contractual obligations. Therefore, derivative-related credit risk is represented by the positive fair value of the instrument and is normally a small fraction of the contract’s notional amount. Credit risk from derivatives is measured and managed by counterparty credit rating as follows:
Fair value of derivative financial instruments with a positive fair value by counterparty credit rating
Carrying value
£m AAA£m
AA£m
A £m
BBB £m
BB or lower£m
Unrated£m
2007 986 – 372 272 51 – 2912006 777 – 236 322 111 53 55
To manage derivative-related counterparty credit exposure, the Group employs the use of margining and set-off rights in some agreements. Under margining agreements, the Group has the right to request that the counterparty pay down or collateralise the current fair value of its derivatives position when the position passes a specified threshold. At 31 December 2007 the Group was holding £93 million (2006: £33 million) of cash as collateral against counterparty balances, and had pledged £118 million (2006: £61 million) of cash as collateral, principally under margin calls to cover exposure to mark-to-market positions on derivative contracts. Generally, cash paid or received as collateral is interest-bearing and is free from any restriction over its use.
Maturity profiles of derivative financial instruments – liabilities IFRS 7 requires disclosure of a maturity analysis for financial liabilities that shows remaining contractual maturities on an undiscounted basis. The following maturity analysis shows the remaining contractual maturities on an undiscounted basis for the Group’s derivative financial instruments that are in a loss position at the balance sheet date and will be settled on a net basis:
Energy derivatives that will be settled on a net basis 2007
£m 2006
£m
Less than one year (128) (296)One to five years (53) (113)More than five years (2) (15)
(183) (424)
Interest rate derivatives that will be settled on a net basis 2007
£m 2006
£m
Less than one year (9) (5)One to five years (4) (25)More than five years (1) (10)
(14) (40)

101
Directors’ R
eport – Business R
eviewD
irectors’ Report – G
overnanceFinancial S
tatements
Shareholder Inform
ationCentrica plc Annual Report and Accounts 2007
21. Derivative financial instruments continued
Certain of the Group’s energy contracts that are accounted for as derivatives are for the physical purchase of energy. In thesecases IFRS 7 requires disclosure of a maturity analysis that shows cash outflows on all purchase contracts on an undiscounted basis, including those derivative contracts in a gain position at the balance sheet date as follows:
Energy procurement contracts that are carried at fair value 2007
£m 2006
£m
Less than one year (12,076) (10,652)One to five years (17,559) (16,175)More than five years (6,719) (7,638)
(36,354) (34,465)
The Group’s foreign exchange derivative contracts will be settled on a gross basis. In these cases IFRS 7 requires disclosure of a maturity analysis that shows cash outflows on all derivative contracts on an undiscounted basis, including those derivative contracts in a gain position at the balance sheet date. In addition to cash outflows on all foreign exchange derivative contracts that are gross settled on an undiscounted basis, the following analysis also provides disclosure of the related cash inflows as follows:
2007 2006
Foreign exchange derivatives that will be settled on a gross basis Outflow
£m Inflow
£m Outflow
£mInflow
£m
Less than one year (1,898) 1,851 (1,390) 1,404One to five years (811) 785 (436) 442More than five years (130) 112 (104) 81
(2,839) 2,748 (1,930) 1,927
22. Hedge accounting
For the purposes of hedge accounting, hedges are classified either as fair value hedges, cash flow hedges or hedges of net investments in foreign operations. Note 2 details the Group’s accounting policies in relation to derivatives qualifying for hedgeaccounting under IAS 39. The fair values of derivative and primary financial instruments in hedge accounting relationships at 31 December were as follows:
2007 2006
Assets£m
Liabilities £m
Assets£m
Liabilities£m
Fair value hedges – 9 – 12Cash flow hedges 123 67 21 538Net investment hedges:
Primary financial instruments – 74 – 117Derivative financial instruments – 16 6 –
Fair value hedges The Group’s fair value hedges consist of interest rate swaps, cross-currency interest rate swaps and forward rate agreements used to protect against changes in the fair value of fixed-rate long-term debt due to movements in market interest rates. For qualifying fair value hedges, all changes in the fair value of the hedging instrument and in the fair value of the hedged item in relation to the risk beinghedged are recognised in income within net interest expense.

102
Centrica plc Annual Report and Accounts 2007
Notes to the Financial Statements continued
22. Hedge accounting continued
Gains or losses arising on fair value hedges at 31 December were as follows:
Gains/(losses)2007
£m 2006
£m
On hedging instruments 5 (14)On hedged items attributable to the hedged risk (6) 16
(1) 2
Cash flow hedgesThe Group’s cash flow hedges consist primarily of: (a) physical and financial gas and power purchase contracts used to protect against the variability in future cash flows associated with highly probable forecast purchases of gas and power due to movements in market commodity prices; (b) forward foreign exchange contracts used to protect against the variability of functional currency denominated cash flows associated with non-functional currency denominated highly probable forecast transactions; and (c) interest rate swaps, cross-currency interest rate swaps and forward rate agreements used to protect against the variability in cash flows associated with floating-rate borrowings due to movements in market interest rates.
Gains and losses are initially recognised in the cash flow hedging reserve in equity and are transferred to the Income Statement whenthe forecast cash flows affect the Income Statement. Note 30 details movements in the cash flow hedging reserve. The ineffective portion of gains and losses on cash flow hedging are recognised immediately in the Income Statement. During 2007 the Group recognised a gain of £nil (2006: loss of £9 million) due to cash flow hedge ineffectiveness.
Net investment hedgesThe Group’s net investment hedges consist of foreign currency debt issued in the same currency as the net investment, foreign exchange forwards and cross-currency interest rate swaps used to protect against the variability in the pounds sterling value of theGroup’s net investments in foreign operations due to movements in the relative strength of foreign currencies to pounds sterling.
Gains and losses on the effective portion of the hedge are recognised in equity and transferred to the Income Statement on disposal of the foreign operation. Gains and losses on the ineffective portion of the hedge are recognised immediately in the Income Statement. During 2007 the Group did not recognise any gains or losses due to net investment hedge ineffectiveness (2006: £nil).
23. Cash and cash equivalents
2007£m
2006£m
Cash at bank, in transit and in hand 53 29Short-term deposits 1,077 611Cash and cash equivalents 1,130 640
Cash and cash equivalents includes £40 million (2006: £38 million) held by the Group’s insurance subsidiary undertakings that is not readily available to be used for other purposes within the Group.
Cash and cash equivalents by counterparty credit rating
Carrying value
£m AAA £m
AA £m
A£m
Unrated£m
2007 1,130 246 783 95 62006 640 198 284 158 –

103
Directors’ R
eport – Business R
eviewD
irectors’ Report – G
overnanceFinancial S
tatements
Shareholder Inform
ationCentrica plc Annual Report and Accounts 2007
24. Trade and other payables
2007 2006
Current£m
Non-current£m
Current£m
Non-current£m
Financial liabilities: Trade payables 925 – 982 –Other payables 756 14 731 26Accruals
Commodity costs 736 – 598 –Transportation, distribution and metering costs 104 – 105 –Operating and other accruals 572 – 547 –
1,412 – 1,250 –3,093 14 2,963 26
Non-financial liabilities: Other payables and accruals 131 2 143 21Deferred income 147 4 185 8
3,371 20 3,291 55
Maturity analysis of financial liabilities within trade and other payables2007
£m 2006
£m
Less than 90 days 2,908 2,82990-182 days 24 23183-365 days 161 111
3,093 2,963Greater than 365 days 14 26
3,107 2,989

104
Centrica plc Annual Report and Accounts 2007
Notes to the Financial Statements continued
25. Bank overdrafts, loans and other borrowings
2007 2006
Interest rate%
Principal m
Current£m
Non-current£m
Total £m
Current£m
Non-current£m
Total£m
Recourse borrowings Bank overdrafts and loans 70 277 347 56 108 164Bonds (by maturity date)
25 July 2008 3.500 €75 57 – 57 – – –8 September 2008 Floating €100 74 – 74 – 68 689 March 2009 4.129 £250 – 253 253 – 252 2522 November 2012 6.103 £400 – 400 400 – 396 39627 February 2013 1.045 ¥3,000 – 13 13 – 14 1424 October 2016 5.706 £300 – 300 300 – 298 2984 September 2026 Floating £150 – 153 153 – 153 153
131 1,119 1,250 – 1,181 1,181
Commercial paper – – – 100 – 100Obligations under finance leases(including power station tolling arrangements) (iii) 20 397 417 25 783 808
221 1,793 2,014 181 2,072 2,253
Non-recourse borrowings Bonds (by maturity date) (i)
28 January 2013 4.700 C$275 – – – – 120 12028 January 2015 5.245 C$225 – – – – 98 98
– – – – 218 218Units of The Consumers’ Waterheater Income Fund (ii) – – – – 265 265
221 1,793 2,014 181 2,555 2,736
(i) This debt is issued by The Consumers’ Waterheater Income Fund (the Fund). The Group has deconsolidated the Fund with effect from 1 December 2007 as explainedin notes 3 and 35.
(ii) Prior to the deconsolidation of the Fund with effect from 1 December 2007 units of the Fund were treated as debt in the Group Financial Statements.
(iii) Future finance lease commitments
Minimum lease payments
2007£m
Capital element of lease
payments 2007
£m
Minimum lease payments
2006£m
Capital elementof lease
payments2006
£m
Amounts payable: Within one year 43 20 51 25Between one and five years 179 98 248 153After five years 376 299 767 630
598 417 1,066 808Less future finance charges (181) (258)Present value of lease obligations 417 808
In addition to the minimum lease payments, tolling charges are payable, calculated based on effective operating hours of the station. During the year £22 million (2006: £18 million) of tolling charges were paid in respect of the Spalding tolling contract. There are no restrictions under the finance leases in either the current or prior year.

105
Directors’ R
eport – Business R
eviewD
irectors’ Report – G
overnanceFinancial S
tatements
Shareholder Inform
ationCentrica plc Annual Report and Accounts 2007
25. Bank overdrafts, loans and other borrowings continued
Maturity profile of the Group’s borrowings including interest and principal: Recourse borrowings:
2007£m
2006£m
Within one year (i) 322 280Between one and five years 1,198 825After five years 1,215 1,981
2,735 3,086Non-recourse borrowings: Within one year – 11Between one and five years – 65After five years – 500
2,735 3,662Interest payments (721) (926)
2,014 2,736
(i) Recourse borrowings include amounts repayable on demand of £30 million (2006: £48 million). At 31 December 2007, the Group had undrawn committed bankborrowing facilities of £1,300 million (2006: £1,300 million) which mature in 2010.
Currency composition of the Group’s borrowings: 2007 2006
Recourse borrowings:
Before impact of foreign currency
derivatives£m
Impact of foreign
currency derivatives
£m
After impact of foreign
currency derivatives
£m
Before impact of foreign currency
derivatives£m
Impact of foreign currency
derivatives£m
After impact offoreign currency
derivatives£m
Pounds sterling 1,731 182 1,913 1,955 103 2,058US dollars 56 (56) – 162 (62) 100Euros 131 (57) 74 68 – 68Canadian dollars 27 – 27 27 – 27Japanese yen 42 (42) – 41 (41) –New Zealand dollars 27 (27) – – – –
2,014 – 2,014 2,253 – 2,253Non-recourse borrowings: Canadian dollars – – – 483 – 483
2,014 – 2,014 2,736 – 2,736
Earlier of contractual re-pricing and maturity: 2007
Average effective
interest rate%
Total£m
Within one year £m
One to five years£m
More thanfive years
£m
Bank overdrafts and loans 5.8 347 232 21 94Bonds 5.3 1,250 284 651 315Obligations under finance leases 5.8 417 20 98 299
2,014 536 770 708Impact of interest rate derivatives – 627 (464) (163)
2,014 1,163 306 545
2006
Average effective interest rate
% Total
£mWithin one year
£mOne to five years
£m
More thanfive years
£m
Bank overdrafts and loans 4.4 164 61 38 65Bonds 5.4 1,181 220 252 709Commercial paper 5.5 100 100 – –Obligations under finance leases 5.2 808 392 90 326Non-recourse Canadian dollar bonds 4.9 218 – – 218Units of The Consumers’ Waterheater Income Fund N/A 265 – – 265
2,736 773 380 1,583Impact of interest rate derivatives – 424 (223) (201)
2,736 1,197 157 1,382
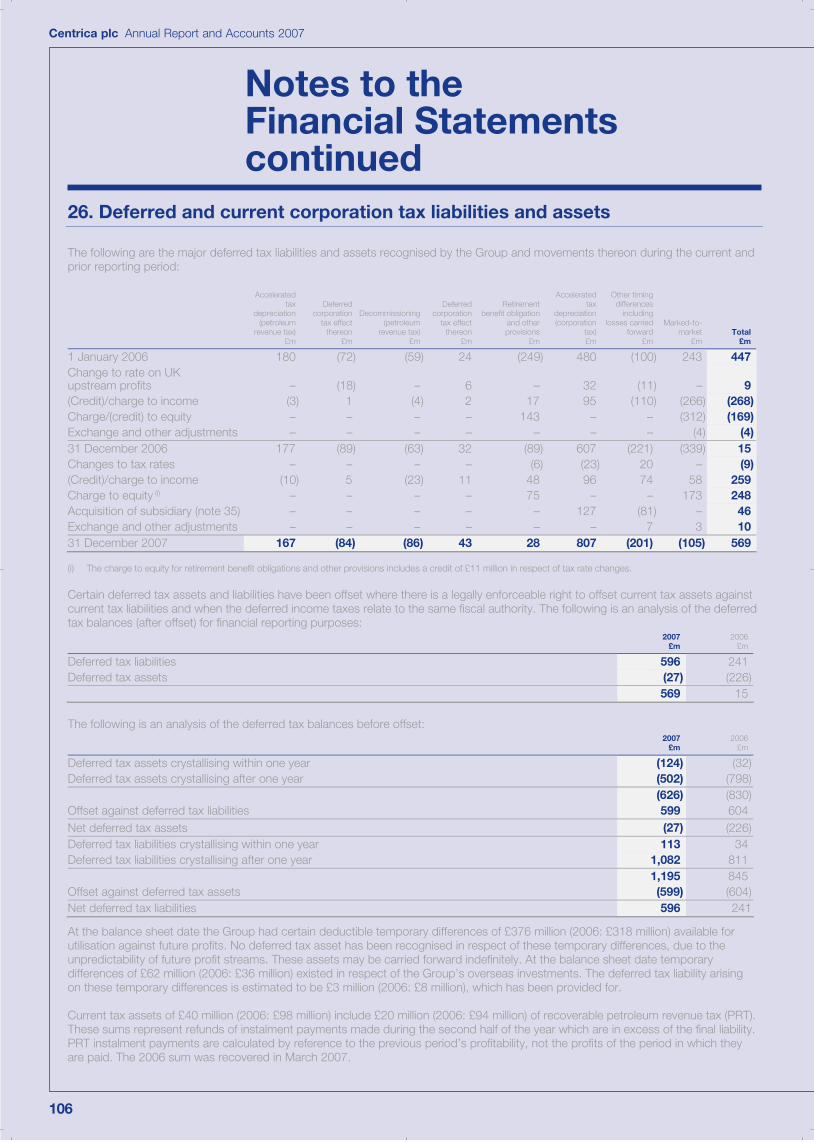
106
Centrica plc Annual Report and Accounts 2007
Notes to the Financial Statements continued
26. Deferred and current corporation tax liabilities and assets
The following are the major deferred tax liabilities and assets recognised by the Group and movements thereon during the current and prior reporting period:
Accelerated tax
depreciation (petroleum
revenue tax) £m
Deferred corporation
tax effect thereon
£m
Decommissioning (petroleum
revenue tax)£m
Deferred corporation
tax effect thereon
£m
Retirementbenefit obligation
and otherprovisions
£m
Accelerated tax
depreciation (corporation
tax) £m
Other timing differences
including losses carried
forward £m
Marked-to-market
£mTotal
£m
1 January 2006 180 (72) (59) 24 (249) 480 (100) 243 447Change to rate on UK upstream profits – (18) – 6 – 32 (11) – 9(Credit)/charge to income (3) 1 (4) 2 17 95 (110) (266) (268)Charge/(credit) to equity – – – – 143 – – (312) (169)Exchange and other adjustments – – – – – – – (4) (4)31 December 2006 177 (89) (63) 32 (89) 607 (221) (339) 15Changes to tax rates – – – – (6) (23) 20 – (9)(Credit)/charge to income (10) 5 (23) 11 48 96 74 58 259Charge to equity (i) – – – – 75 – – 173 248Acquisition of subsidiary (note 35) – – – – – 127 (81) – 46Exchange and other adjustments – – – – – – 7 3 1031 December 2007 167 (84) (86) 43 28 807 (201) (105) 569
(i) The charge to equity for retirement benefit obligations and other provisions includes a credit of £11 million in respect of tax rate changes.
Certain deferred tax assets and liabilities have been offset where there is a legally enforceable right to offset current tax assets against current tax liabilities and when the deferred income taxes relate to the same fiscal authority. The following is an analysis of the deferred tax balances (after offset) for financial reporting purposes:
2007£m
2006£m
Deferred tax liabilities 596 241Deferred tax assets (27) (226)
569 15
The following is an analysis of the deferred tax balances before offset: 2007
£m 2006
£m
Deferred tax assets crystallising within one year (124) (32)Deferred tax assets crystallising after one year (502) (798)
(626) (830)Offset against deferred tax liabilities 599 604Net deferred tax assets (27) (226)Deferred tax liabilities crystallising within one year 113 34Deferred tax liabilities crystallising after one year 1,082 811
1,195 845Offset against deferred tax assets (599) (604)Net deferred tax liabilities 596 241
At the balance sheet date the Group had certain deductible temporary differences of £376 million (2006: £318 million) available for utilisation against future profits. No deferred tax asset has been recognised in respect of these temporary differences, due to the unpredictability of future profit streams. These assets may be carried forward indefinitely. At the balance sheet date temporary differences of £62 million (2006: £36 million) existed in respect of the Group’s overseas investments. The deferred tax liability arising on these temporary differences is estimated to be £3 million (2006: £8 million), which has been provided for.
Current tax assets of £40 million (2006: £98 million) include £20 million (2006: £94 million) of recoverable petroleum revenue tax (PRT). These sums represent refunds of instalment payments made during the second half of the year which are in excess of the final liability. PRT instalment payments are calculated by reference to the previous period’s profitability, not the profits of the period in which they are paid. The 2006 sum was recovered in March 2007.

107
Directors’ R
eport – Business R
eviewD
irectors’ Report – G
overnanceFinancial S
tatements
Shareholder Inform
ationCentrica plc Annual Report and Accounts 2007
27. Provisions for other liabilities and charges
Current provisionsfor other liabilities and charges
1 January2007
£m
Acquisitionsand
disposals £m
Charged inthe year
£m
Unused and reversed in
the year£m
Revisions and additions
£m
Transferredfrom non-
current £m
Utilised£m
31 December2007
£m
Restructuring costs (i) 102 – 2 (3) – 19 (83) 37Decommissioning costs (iii) – – – – – 5 (2) 3Sales contract loss provision (ii) 16 – – – – – (14) 2Renegotiations provision (iv) – – – – – 84 – 84Other (v) 12 – 4 (3) – 1 – 14
130 – 6 (6) – 109 (99) 140
Non-current provisionsfor other liabilities and charges
1 January2007
£m
Acquisitionsand
disposals£m
Charged inthe year
£m
Unused and reversed in
the year£m
Revisions and additions
£m
Transferred to current
£m
Exchange adjustments
£m
31 December2007
£m
Restructuring costs (i) 46 – 5 – – (19) – 32Decommissioning costs (iii) 395 14 13 – 92 (5) 2 511Renegotiation provisions (iv) 85 – 6 – – (84) – 7Other (v) 25 2 7 (2) – (1) – 31
551 16 31 (2) 92 (109) 2 581
2007 2006
Financial and non-financial liabilities within provisions for other liabilities and charges
Current£m
Non-current£m
Current£m
Non-current£m
Financial liabilities: Restructuring costs (i) 35 31 102 42Renegotiation provisions (iv) 84 7 – 85Other (v) 7 5 12 18
126 43 114 145Non-financial liabilities:
Restructuring costs (i) 2 1 – 4Sales contract loss provision (ii) 2 – 16 –Decommissioning costs (iii) 3 511 – 395Other (v) 7 26 – 7
14 538 16 406140 581 130 551
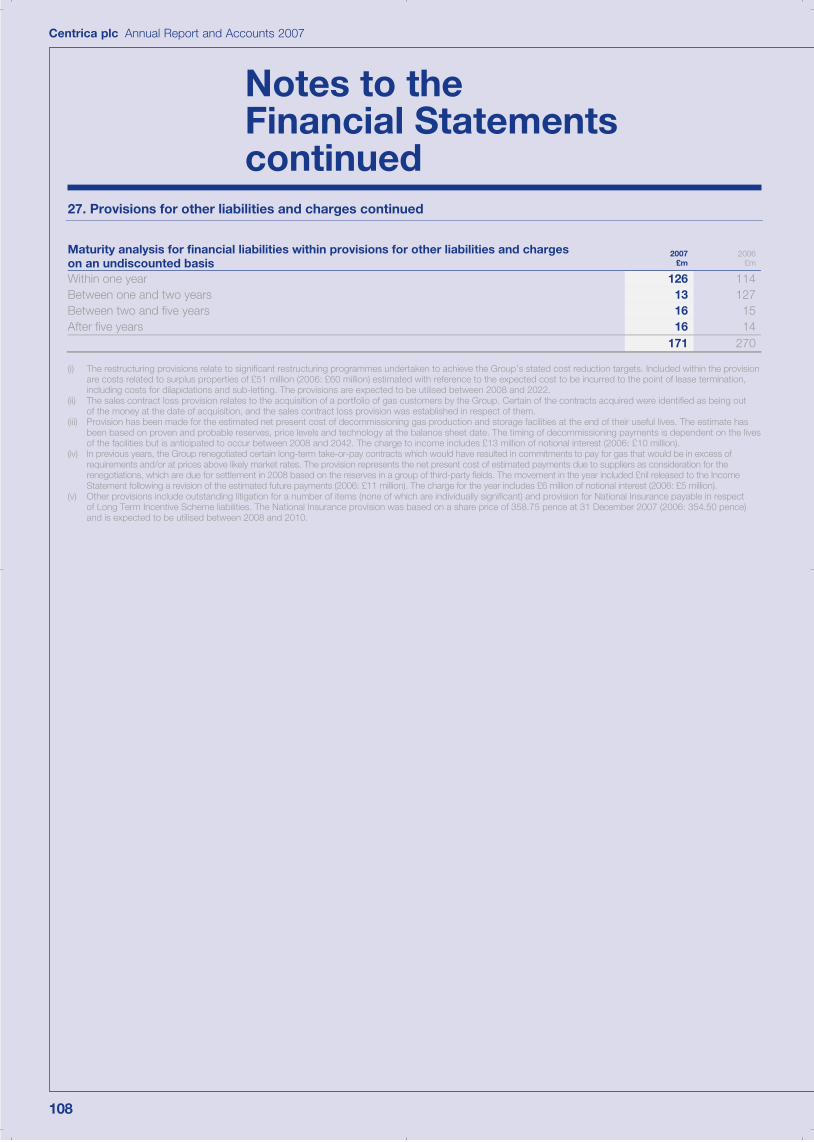
108
Centrica plc Annual Report and Accounts 2007
Notes to the Financial Statements continued
27. Provisions for other liabilities and charges continued
Maturity analysis for financial liabilities within provisions for other liabilities and charges on an undiscounted basis
2007£m
2006£m
Within one year 126 114Between one and two years 13 127Between two and five years 16 15After five years 16 14
171 270
(i) The restructuring provisions relate to significant restructuring programmes undertaken to achieve the Group’s stated cost reduction targets. Included within the provision are costs related to surplus properties of £51 million (2006: £60 million) estimated with reference to the expected cost to be incurred to the point of lease termination,including costs for dilapidations and sub-letting. The provisions are expected to be utilised between 2008 and 2022.
(ii) The sales contract loss provision relates to the acquisition of a portfolio of gas customers by the Group. Certain of the contracts acquired were identified as being out of the money at the date of acquisition, and the sales contract loss provision was established in respect of them.
(iii) Provision has been made for the estimated net present cost of decommissioning gas production and storage facilities at the end of their useful lives. The estimate has been based on proven and probable reserves, price levels and technology at the balance sheet date. The timing of decommissioning payments is dependent on the lives of the facilities but is anticipated to occur between 2008 and 2042. The charge to income includes £13 million of notional interest (2006: £10 million).
(iv) In previous years, the Group renegotiated certain long-term take-or-pay contracts which would have resulted in commitments to pay for gas that would be in excess of requirements and/or at prices above likely market rates. The provision represents the net present cost of estimated payments due to suppliers as consideration for therenegotiations, which are due for settlement in 2008 based on the reserves in a group of third-party fields. The movement in the year included £nil released to the IncomeStatement following a revision of the estimated future payments (2006: £11 million). The charge for the year includes £6 million of notional interest (2006: £5 million).
(v) Other provisions include outstanding litigation for a number of items (none of which are individually significant) and provision for National Insurance payable in respectof Long Term Incentive Scheme liabilities. The National Insurance provision was based on a share price of 358.75 pence at 31 December 2007 (2006: 354.50 pence) and is expected to be utilised between 2008 and 2010.

109
Directors’ R
eport – Business R
eviewD
irectors’ Report – G
overnanceFinancial S
tatements
Shareholder Inform
ationCentrica plc Annual Report and Accounts 2007
28. Fair value of financial instruments
The fair value of a financial instrument is the amount at which the financial instrument could be exchanged in an arm’s length transaction between knowledgeable and willing parties under no compulsion to act. The Group has documented internal policies for determining fair value, including methodologies used to establish valuation adjustments required for credit risk.
The fair values of the Group’s financial instruments together with the carrying amounts included in the Balance Sheet are analysed as follows:
2007 2006
Financial assets Carrying value
£m Fair value
£m Carrying value
£mFair value
£m
Loans and receivables: Trade and other receivables, net of provisions
Residential customers 1,633 1,633 1,974 1,974Business customers 730 730 636 636Treasury, trading and energy procurement counterparties 875 875 690 690
Cash and cash equivalents 1,130 1,130 640 6404,368 4,368 3,940 3,940
Financial assets measured at fair value through profit and loss:Derivative financial instruments – held for proprietary energy trading 44 44 225 225Derivative financial instruments – held for trading under IAS 39 810 810 522 522Energy contracts designated at fair value through profit and loss 9 9 3 3Derivative financial instruments in hedge accounting relationships 123 123 27 27
986 986 777 777Available-for-sale financial assets: Debt 79 79 75 75
Equity 10 10 11 1189 89 86 86
2007 2006
Financial liabilities Carrying value
£m Fair value
£m Carrying value
£mFair value
£m
Financial liabilities measured at amortised cost: Trade and other payables (3,107) (3,107) (2,989) (2,989)Bank overdrafts, loans and other borrowings
Bank overdrafts and loans (347) (338) (164) (162)Bonds (1,250) (1,246) (1,181) (1,176)Commercial paper – – (100) (100)Obligations under finance leases (including power station tolling arrangements) (417) (417) (808) (814)Non-recourse Canadian dollar bonds – – (218) (227)Non-recourse units of The Consumers’ Waterheater Income Fund – – (265) (265)
Provisions (169) (169) (259) (259)(5,290) (5,277) (5,984) (5,992)
Financial liabilities at fair value through profit and loss: Derivative financial instruments – held for proprietary energy trading (52) (52) (199) (199)Derivative financial instruments – held for trading under IAS 39 (1,185) (1,185) (1,151) (1,151)Energy contracts designated at fair value through profit and loss (86) (86) (57) (57)Derivative financial instruments in hedge accounting relationships (92) (92) (550) (550)
(1,415) (1,415) (1,957) (1,957)
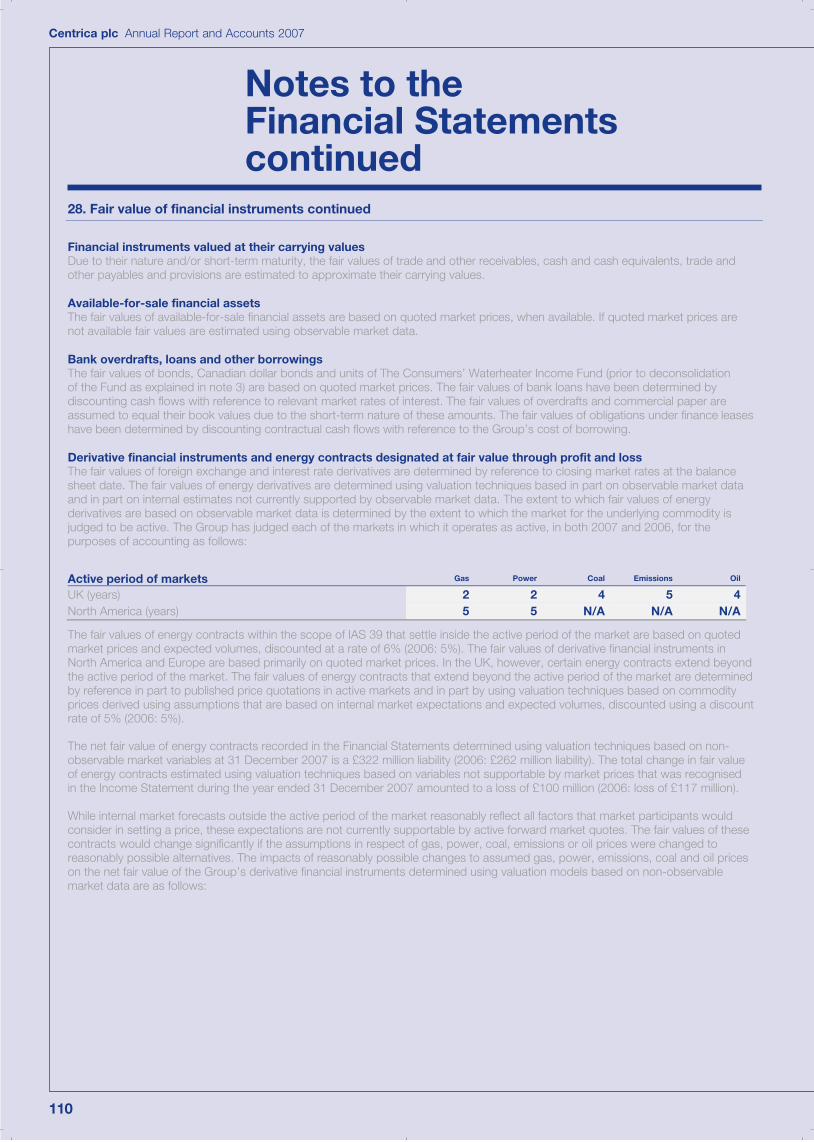
110
Centrica plc Annual Report and Accounts 2007
Notes to the Financial Statements continued
28. Fair value of financial instruments continued
Financial instruments valued at their carrying valuesDue to their nature and/or short-term maturity, the fair values of trade and other receivables, cash and cash equivalents, trade and other payables and provisions are estimated to approximate their carrying values.
Available-for-sale financial assetsThe fair values of available-for-sale financial assets are based on quoted market prices, when available. If quoted market prices are not available fair values are estimated using observable market data.
Bank overdrafts, loans and other borrowings The fair values of bonds, Canadian dollar bonds and units of The Consumers’ Waterheater Income Fund (prior to deconsolidationof the Fund as explained in note 3) are based on quoted market prices. The fair values of bank loans have been determined by discounting cash flows with reference to relevant market rates of interest. The fair values of overdrafts and commercial paper are assumed to equal their book values due to the short-term nature of these amounts. The fair values of obligations under finance leases have been determined by discounting contractual cash flows with reference to the Group’s cost of borrowing.
Derivative financial instruments and energy contracts designated at fair value through profit and loss The fair values of foreign exchange and interest rate derivatives are determined by reference to closing market rates at the balancesheet date. The fair values of energy derivatives are determined using valuation techniques based in part on observable market data and in part on internal estimates not currently supported by observable market data. The extent to which fair values of energy derivatives are based on observable market data is determined by the extent to which the market for the underlying commodity isjudged to be active. The Group has judged each of the markets in which it operates as active, in both 2007 and 2006, for the purposes of accounting as follows:
Active period of markets Gas Power Coal Emissions Oil
UK (years) 2 2 4 5 4North America (years) 5 5 N/A N/A N/A
The fair values of energy contracts within the scope of IAS 39 that settle inside the active period of the market are based on quoted market prices and expected volumes, discounted at a rate of 6% (2006: 5%). The fair values of derivative financial instruments in North America and Europe are based primarily on quoted market prices. In the UK, however, certain energy contracts extend beyond the active period of the market. The fair values of energy contracts that extend beyond the active period of the market are determined by reference in part to published price quotations in active markets and in part by using valuation techniques based on commodity prices derived using assumptions that are based on internal market expectations and expected volumes, discounted using a discountrate of 5% (2006: 5%).
The net fair value of energy contracts recorded in the Financial Statements determined using valuation techniques based on non-observable market variables at 31 December 2007 is a £322 million liability (2006: £262 million liability). The total change in fair valueof energy contracts estimated using valuation techniques based on variables not supportable by market prices that was recognised in the Income Statement during the year ended 31 December 2007 amounted to a loss of £100 million (2006: loss of £117 million).
While internal market forecasts outside the active period of the market reasonably reflect all factors that market participants would consider in setting a price, these expectations are not currently supportable by active forward market quotes. The fair values of these contracts would change significantly if the assumptions in respect of gas, power, coal, emissions or oil prices were changed toreasonably possible alternatives. The impacts of reasonably possible changes to assumed gas, power, emissions, coal and oil prices on the net fair value of the Group’s derivative financial instruments determined using valuation models based on non-observablemarket data are as follows:

111
Directors’ R
eport – Business R
eviewD
irectors’ Report – G
overnanceFinancial S
tatements
Shareholder Inform
ationCentrica plc Annual Report and Accounts 2007
28. Fair value of financial instruments continued
2007 2006
Energy price
Reasonablypossible increase
in variable
Reasonablypossible
decreasein variable
Reasonably possible increase
in variable
Reasonably possible
decrease in variable
UK gas (p/therm) +12 -12 +6 -6UK power (£/MWh) +11 -11 +10 -10UK coal (US$/tonne) +15 -15 +10 -10UK emissions (€/tonne) +6 -6 +5 -5UK oil (US$/bbl) +14 -14 +7 -7
Increase/(decrease) in fair value 2007
£m
2006
£m
UK energy prices – increase 85 89UK energy prices – decrease (100) (86)
The impacts disclosed above result from changing the assumptions used for fair valuing energy contracts in relation to gas, power, emissions, coal and oil prices to reasonably possible alternative assumptions at the balance sheet date. The fair value impacts only concern those contracts entered into which are within the scope of IAS 39 and are marked-to-market based on valuation models using assumptions that are not currently observable in an active market. The sensitivity analysis provided is hypothetical only and should be used with caution as the impacts provided are not necessarily indicative of the actual impacts that would be experienced because the Group’s actual exposure to market rates is constantly changing as the Group’s portfolio of energy contracts changes. Changes in fair values based on a variation in a market variable cannot be extrapolated because the relationship between the change in market variable and the change in fair value may not be linear.
Where the fair value at initial recognition for such contracts differs from the transaction price a day-one gain or loss will arise. Such gains and losses are deferred and amortised to the Income Statement based on volumes purchased or delivered over the contractual period until such time as observable market data becomes available (see note 2 for further detail). The amount that has yet to be recognised in the Income Statement relating to the difference between the fair value at initial recognition (the transaction price) and the amount that would have arisen had valuation techniques used for subsequent measurement been applied at initial recognition,less subsequent releases, is as follows:
Net deferred (gains)/losses2007
£m 2006
£m
At 1 January (62) 13Net losses deferred on new transactions (103) (9)Recognised in the Income Statement during the period:
Amortisation 3 –Unobservable inputs becoming observable (4) (66)
At 31 December (166) (62)

112
Centrica plc Annual Report and Accounts 2007
Notes to the Financial Statements continued
29. Called up share capital
2007£m
2006£m
Authorised share capital of the Company 4,455,000,000 ordinary shares of 614/81p each (2006: 4,455,000,000 ordinary shares of 614/81p each) 275 275100,000 cumulative redeemable preference shares of £1 each – –Allotted and fully paid share capital of the Company 3,679,980,311 ordinary shares of 614/81p each (2006: 3,662,721,068 ordinary shares of 614/81p each) 227 226
The movement in allotted and fully paid share capital of the Company for the year was as follows: 2007
Number 2006
Number
1 January 3,662,721,068 3,623,982,266Shares repurchased (i) – (8,950,000)Shares issued under employee share schemes (ii) 17,259,243 47,688,80231 December 3,679,980,311 3,662,721,068
The closing price of a Centrica ordinary share on 31 December 2007 was 358.75 pence (2006: 354.50 pence).
(i) The share repurchase programme is currently suspended. During 2006 the Company purchased, and subsequently cancelled, 8.95 million ordinary shares at pricesranging from 248.43 pence per share to 254.98 pence per share, with an average of 250.30 pence per share. The total cost of the purchases including expenses was £23 million which has been charged against distributable reserves, of which £0.6 million related to the nominal value and has been recognised in the capitalredemption reserve.
(ii) Ordinary shares were also allotted and issued to satisfy the exercise of share options and the matching element of the Share Incentive Plan as follows:
2007 2006
Number 17,259,243 47,688,802Nominal value (£m) 1.1 2.9Consideration (£m) (net of issue costs £nil (2006: £nil)) 22 56
(iii) The Centrica Employees Share Trust (Trust) was established to acquire ordinary shares in the Company by subscription or purchase, with funds provided by way of interest-free loans or by capital contribution from the Company, to satisfy rights to shares on the vesting of allocations made under the Company’s long-term incentivearrangements as explained in note 33.
2007 2006
Shares held in Trust
Number of shares
million Cost
£m Market value
£m
Numberof shares
million Cost
£mMarket value
£m
1 January – – – – – –Shares purchased 0.5 2 2 – – –Shares subscribed 4.7 18 18 7.6 22 22Shares released under Long Term Incentive Scheme (4.7) (18) (18) (7.6) (22) (22)31 December 0.5 2 2 – – –

113
Directors’ R
eport – Business R
eviewD
irectors’ Report – G
overnanceFinancial S
tatements
Shareholder Inform
ationCentrica plc Annual Report and Accounts 2007
30. Reserves
Attributable to equity holders of the Company
Share capital
£m
Sharepremium
£m
Mergerreserve
£m
Capital redemption
reserve£m
Otherreserves
£mTotal
£m
Minority interest
£m
Totalequity
£m
1 January 2007 226 657 467 16 219 1,585 57 1,642Exchange differences on translation of foreign operations – – – – 15 15 – 15Exchange differences transferred to Income Statement – – – – (4) (4) – (4)Actuarial gains on definedbenefit pension schemes – – – – 284 284 – 284Gains on revaluation of available-for-sale assets – – – – 1 1 – 1Cash flow hedges:
Net fair value gains – – – – 169 169 – 169Transfers to Income Statement – – – – 382 382 – 382
Tax on items taken directly to/from equity – – – – (248) (248) – (248) 226 657 467 16 818 2,184 57 2,241Profit for the year – – – – 1,505 1,505 2 1,507Employee share schemes:
Purchase of treasury shares – – – – (2) (2) – (2)Share issue 1 28 – – – 29 – 29Exercise of awards – – – – (7) (7) – (7)Value of services provided – – – – 31 31 – 31
Dividends – – – – (417) (417) – (417)31 December 2007 227 685 467 16 1,928 3,323 59 3,382
Other reserves
Revaluationreserve
£m
Foreign currency
translationreserve
£m
Cash flowhedging reserve
£m
Profit and lossreserve
£m
Totalother
reserves£m
1 January 2007 10 (26) (326) 561 219Exchange differences on translation of foreign operations – 16 (1) – 15Exchange differences transferred to Income Statement – (4) – – (4)Actuarial gains on defined benefit pension schemes – – – 284 284Gains on revaluation of available-for-sale assets – – – 1 1Cash flow hedges:
Net fair value gains – – 169 – 169Transfers to Income Statement – – 382 – 382
Tax on items taken directly to/from equity – – (173) (75) (248)10 (14) 51 771 818
Profit for the year – – – 1,505 1,505Employee share schemes:
Purchase of treasury shares – – – (2) (2)Exercise of awards – – – (7) (7)Value of services provided – – – 31 31
Dividends – – – (417) (417)31 December 2007 10 (14) 51 1,881 1,928

114
Centrica plc Annual Report and Accounts 2007
Notes to the Financial Statements continued
30. Reserves continued
Attributable to equity holders of the Company
Share capital
£m
Sharepremium
£m
Mergerreserve
£m
Capital redemption
reserve£m
Otherreserves
£mTotal
£m
Minority interest
£m
Totalequity
£m
1 January 2006 224 595 467 15 1,085 2,386 56 2,442Exchange differences on translation of foreign operations – – – – (23) (23) – (23)Actuarial gains on definedbenefit pension schemes – – – – 475 475 – 475Cash flow hedges:
Net fair value losses – – – – (645) (645) – (645)Transfers to Income Statement – – – – (294) (294) – (294)
Tax on items taken directly to/from equity – – – – 169 169 – 169 224 595 467 15 767 2,068 56 2,124Loss for the year – – – – (155) (155) 1 (154)Employee share schemes:
Share issue 3 62 – – – 65 – 65Exercise of awards – – – – (9) (9) – (9)Value of services provided – – – – 23 23 – 23
Repurchase of shares (1) – – 1 (23) (23) – (23)Dividends – – – – (384) (384) – (384)31 December 2006 226 657 467 16 219 1,585 57 1,642
Other reserves
Revaluationreserve
£m
Foreign currency
translationreserve
£m
Cash flowhedging reserve
£m
Profit and lossreserve
£m
Totalother
reserves£m
1 January 2006 10 (3) 301 777 1,085Exchange differences on translation of foreign operations – (23) – – (23)Actuarial gains on defined benefit pension schemes – – – 475 475Cash flow hedges:
Net fair value losses – – (645) – (645)Transfers to Income Statement – – (294) – (294)
Tax on items taken directly to/from equity – – 312 (143) 16910 (26) (326) 1,109 767
Loss for the year – – – (155) (155)Employee share schemes:
Exercise of awards – – – (9) (9)Value of services provided – – – 23 23
Repurchase of shares – – – (23) (23)Dividends – – – (384) (384)31 December 2006 10 (26) (326) 561 219
Merger reserve On 17 February 1997 BG plc (formerly British Gas plc) demerged certain businesses (grouped together under GB Gas Holdings Limited (GBGH)) to Centrica plc. Prior to demerger, the companies comprising the Centrica businesses were transferred to GBGH, a subsidiary undertaking of BG plc. Upon demerger the share capital of GBGH was transferred to Centrica plc and was recorded atthe nominal value of shares issued to BG plc shareholders. In accordance with sections 131 and 133 of the Companies Act 1985, no premium was recorded on the shares issued. On consolidation, the difference between the nominal value of the Company’s shares issued and the amount of share capital and share premium of GBGH at the date of demerger was credited to a merger reserve.

115
Directors’ R
eport – Business R
eviewD
irectors’ Report – G
overnanceFinancial S
tatements
Shareholder Inform
ationCentrica plc Annual Report and Accounts 2007
30. Reserves continued
Capital redemption reserve In accordance with section 170 (1) of the Companies Act 1985, the Company has transferred to the capital redemption reserve an amount equal to the nominal value of shares repurchased and subsequently cancelled. The repurchase of shares includes transactioncosts charged directly to the profit and loss reserve of £nil (2006: £nil).
Revaluation reserve During 2005 the revaluation of the Group’s existing interest in Humber Power Limited to fair value, following the acquisition by the Group of the remaining 40% stake in the company, was recorded as a revaluation reserve adjustment.
Foreign currency translation and net investment hedging reserve The foreign currency translation and net investment hedging reserve comprises exchange translation differences on foreign currencynet investments, offset by exchange translation differences on borrowings and derivatives classified as net investment hedges under the requirements of IAS 39. Exchange gains of £48 million (2006: £105 million loss) on net investments in overseas undertakings havebeen offset in reserves against exchange losses of £32 million (2006: £82 million gain) on foreign currency borrowings and other instruments used for hedging purposes.
Cash flow hedging reserve The cash flow hedging reserve comprises fair value movements on instruments designated as cash flow hedges under the requirements of IAS 39. Note 22 provides further detail on cash flow hedging.
Analysis of transfers from cash flow hedging reserve to Income Statement by line item 2007
£m 2006
£m
Gross profit (391) 231Net interest expense 9 63
(382) 294
The maturity analysis of amounts included in the cash flow hedging reserve, which includes fair value gains and losses in relation to commodity, interest rate and currency hedges, is as follows:
2007£m
2006£m
Within one year 17 (266)Between one and five years 34 (58)After five years – (2)
51 (326)
The maturity profile reflects the timing of expected transfers from the cash flow hedging reserve to the Income Statement as and when the hedged item affects the Income Statement which is, for the most part, on delivery of physical volumes for energy contracts and the accrual of interest for debt contracts.
Profit and loss reserve Treasury shares
£m
Share-based payments
reserve £m
Other£m
Profit and loss reserve
£m
1 January 2007 – 38 523 561Actuarial gains on defined benefit pension schemes – – 284 284Gains on revaluation of available-for-sale investments – – 1 1Tax on items taken directly to/from equity – – (75) (75)
– 38 733 771Profit for the year – – 1,505 1,505Employee share schemes:
Purchase of treasury shares (2) – – (2)Exercise of awards – (18) 11 (7)Value of services provided – 31 – 31
Dividends – – (417) (417)31 December 2007 (2) 51 1,832 1,881
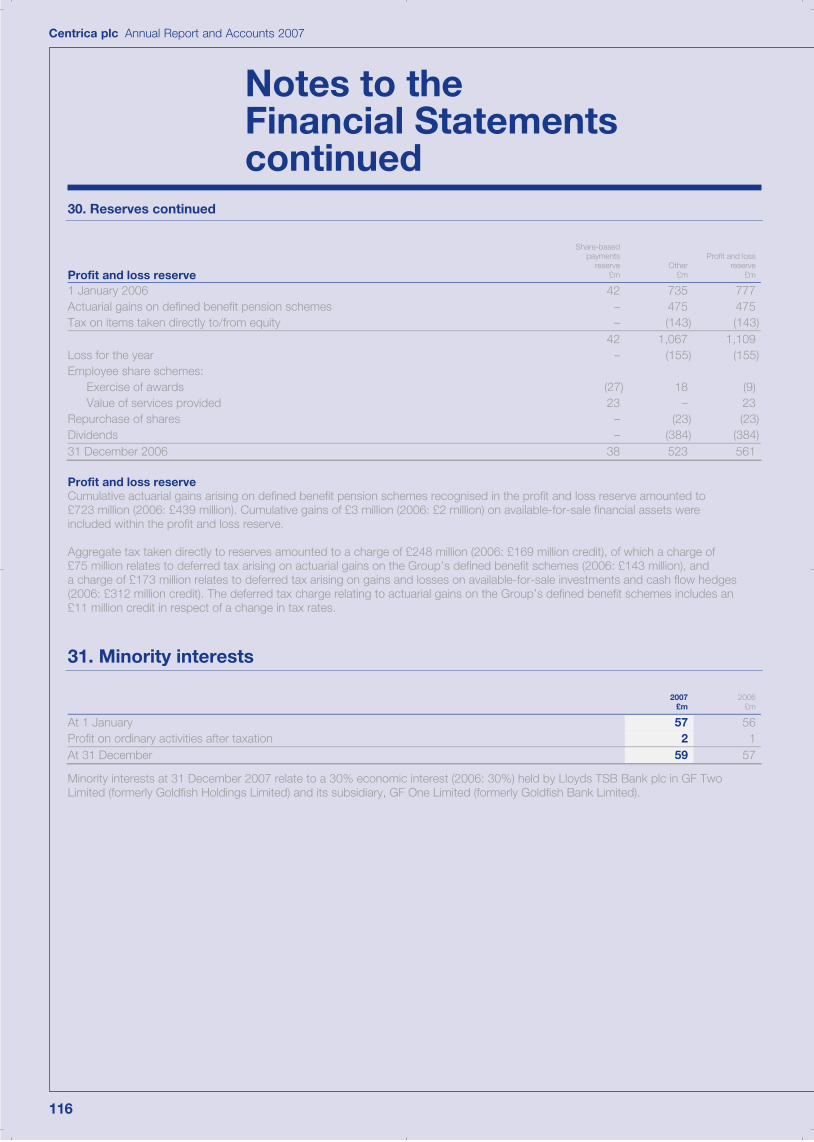
116
Centrica plc Annual Report and Accounts 2007
Notes to the Financial Statements continued
30. Reserves continued
Profit and loss reserve
Share-based payments
reserve £m
Other£m
Profit and lossreserve
£m
1 January 2006 42 735 777Actuarial gains on defined benefit pension schemes – 475 475Tax on items taken directly to/from equity – (143) (143)
42 1,067 1,109Loss for the year – (155) (155)Employee share schemes:
Exercise of awards (27) 18 (9)Value of services provided 23 – 23
Repurchase of shares – (23) (23)Dividends – (384) (384)31 December 2006 38 523 561
Profit and loss reserve Cumulative actuarial gains arising on defined benefit pension schemes recognised in the profit and loss reserve amounted to £723 million (2006: £439 million). Cumulative gains of £3 million (2006: £2 million) on available-for-sale financial assets were included within the profit and loss reserve.
Aggregate tax taken directly to reserves amounted to a charge of £248 million (2006: £169 million credit), of which a charge of£75 million relates to deferred tax arising on actuarial gains on the Group’s defined benefit schemes (2006: £143 million), anda charge of £173 million relates to deferred tax arising on gains and losses on available-for-sale investments and cash flow hedges (2006: £312 million credit). The deferred tax charge relating to actuarial gains on the Group’s defined benefit schemes includes an £11 million credit in respect of a change in tax rates.
31. Minority interests
2007£m
2006£m
At 1 January 57 56Profit on ordinary activities after taxation 2 1At 31 December 59 57
Minority interests at 31 December 2007 relate to a 30% economic interest (2006: 30%) held by Lloyds TSB Bank plc in GF Two Limited (formerly Goldfish Holdings Limited) and its subsidiary, GF One Limited (formerly Goldfish Bank Limited).
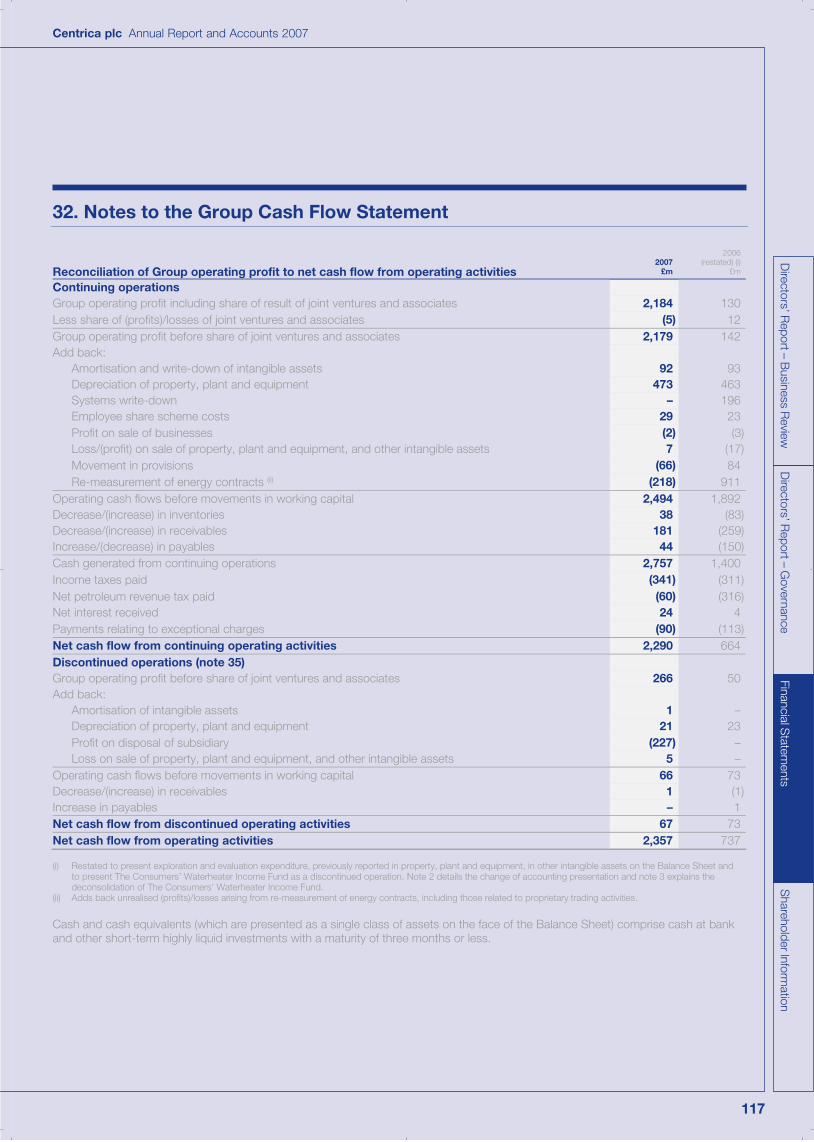
117
Directors’ R
eport – Business R
eviewD
irectors’ Report – G
overnanceFinancial S
tatements
Shareholder Inform
ationCentrica plc Annual Report and Accounts 2007
32. Notes to the Group Cash Flow Statement
Reconciliation of Group operating profit to net cash flow from operating activities 2007
£m
2006 (restated) (i)
£m
Continuing operations Group operating profit including share of result of joint ventures and associates 2,184 130Less share of (profits)/losses of joint ventures and associates (5) 12Group operating profit before share of joint ventures and associates 2,179 142Add back:
Amortisation and write-down of intangible assets 92 93Depreciation of property, plant and equipment 473 463Systems write-down – 196Employee share scheme costs 29 23Profit on sale of businesses (2) (3)Loss/(profit) on sale of property, plant and equipment, and other intangible assets 7 (17)Movement in provisions (66) 84Re-measurement of energy contracts (ii) (218) 911
Operating cash flows before movements in working capital 2,494 1,892Decrease/(increase) in inventories 38 (83)Decrease/(increase) in receivables 181 (259)Increase/(decrease) in payables 44 (150)Cash generated from continuing operations 2,757 1,400Income taxes paid (341) (311)Net petroleum revenue tax paid (60) (316)Net interest received 24 4Payments relating to exceptional charges (90) (113)Net cash flow from continuing operating activities 2,290 664Discontinued operations (note 35) Group operating profit before share of joint ventures and associates 266 50Add back:
Amortisation of intangible assets 1 –Depreciation of property, plant and equipment 21 23Profit on disposal of subsidiary (227) –Loss on sale of property, plant and equipment, and other intangible assets 5 –
Operating cash flows before movements in working capital 66 73Decrease/(increase) in receivables 1 (1)Increase in payables – 1Net cash flow from discontinued operating activities 67 73Net cash flow from operating activities 2,357 737
(i) Restated to present exploration and evaluation expenditure, previously reported in property, plant and equipment, in other intangible assets on the Balance Sheet andto present The Consumers’ Waterheater Income Fund as a discontinued operation. Note 2 details the change of accounting presentation and note 3 explains the deconsolidation of The Consumers’ Waterheater Income Fund.
(ii) Adds back unrealised (profits)/losses arising from re-measurement of energy contracts, including those related to proprietary trading activities.
Cash and cash equivalents (which are presented as a single class of assets on the face of the Balance Sheet) comprise cash at bankand other short-term highly liquid investments with a maturity of three months or less.

118
Centrica plc Annual Report and Accounts 2007
Notes to the Financial Statements continued
33. Share-based payments
Employee share schemes are designed to encourage participants to align their objectives with those of shareholders. Centrica operates eight employee share schemes – the Deferred and Matching Share Scheme (DMSS) beginning in 2007, the Executive Share Option Scheme (ESOS), the Long Term Incentive Scheme (LTIS), Sharesave, the Share Award Scheme (SAS), the Restricted Share Scheme (RSS) beginning in 2007, the Share Incentive Plan (SIP) and the Employee Share Purchase Plan (ESPP). These are describedin the Directors’ Report – Corporate Responsibility Review on page 32 and in the Remuneration Report on pages 42 to 45. There were no other share-based payment transactions during the period.
DMSS Awards under the DMSS are generally reserved for employees within the senior executive group. The scheme operates over a four-year vesting period. Under normal conditions the grant date of the scheme is the first day of each bonus year. This is followed by a vesting period of four years, being the bonus year plus a three-year performance period. In 2006, the first year of the scheme,shareholders’ approval was obtained at the AGM on 19 May 2006 and as such the grant date reflects the date of this approval. The fair value of the award reflects the market value of the shares at the grant date. The scheme comprises three separable elements:
(a) Deferred shares The scheme requires participants to defer 20% of their annual bonus into the scheme. The shares are held in trust over the three-year performance period, during which time they cannot be withdrawn. An employee who leaves prior to the vesting date will forfeit their right to the shares. All shares held in trust will be eligible to receive dividends. The number of shares deferred is estimated from the participant’s maximum bonus and the likelihood of bonus payout in the bonus year. Subsequent revisions are made based on the actual bonus paid in the year.
(b) Investment sharesThe scheme allows participants to elect to invest an additional amount of their annual bonus into the scheme up to a maximum of 50% of their total potential bonus for the year. This 50% limit includes the amount automatically deferred each year. The number of shares invested is estimated based on the maximum bonus in year one. The shares may be funded directly from the employee or through a release of the employee’s LTIS shares. Subsequent to the bonus year, the shares are held in trust over the three-year performance period and vest unconditionally at election, thus the shares carry no additional IFRS 2 expense. Participants can unconditionally withdraw the invested shares at any point throughout the vesting period. The shares are eligible to receive dividends.
(c) Matching sharesDeferred and investment shares will be matched with conditional matching shares, which will be released upon the achievement, over a three-year performance period, of three-year cumulative Group economic profit performance targets. Group economic profit is calculated by taking Group operating profit before exceptional items and certain re-measurements after tax and subtracting a charge for capital employed based on the weighted average cost of capital. The number of matching shares that will vest will be determined on a straight-line basis from a zero match for no growth in economic profit up to a two-times match for growth of 25% or above. Thenumber of matching shares, subject to the performance conditions, is grossed up to reflect the impact of tax and National Insurance. The number of matching shares released following the satisfaction of the performance condition will be increased to reflect thedividends that would have been paid during the three-year performance period. The likelihood of achieving the performance conditions is taken into account in calculating the number of awards expected to vest. Estimates are made in year one and revised in subsequent years. An employee that leaves prior to the vesting date will forfeit their right to the shares.
The fair values and the related assumptions used in the calculations are as follows:
Grant date 1 January
2007 19 May
2006
Share price at grant date £3.55 £2.65Exercise price £nil £nilNumber of investment shares (i) 492,090 489,642Number of deferred shares originally granted (i) 434,768 432,605Number of matching shares originally granted (i) 2,654,925 2,641,716Vesting period 4 yrs 3.6 yrsContractual life 4 yrs 3.6 yrsExpected dividend yield n/a n/aExpected forfeitures 25% 25%Expected performance lapses 0% 0%Fair value per share allocated £3.55 £2.65
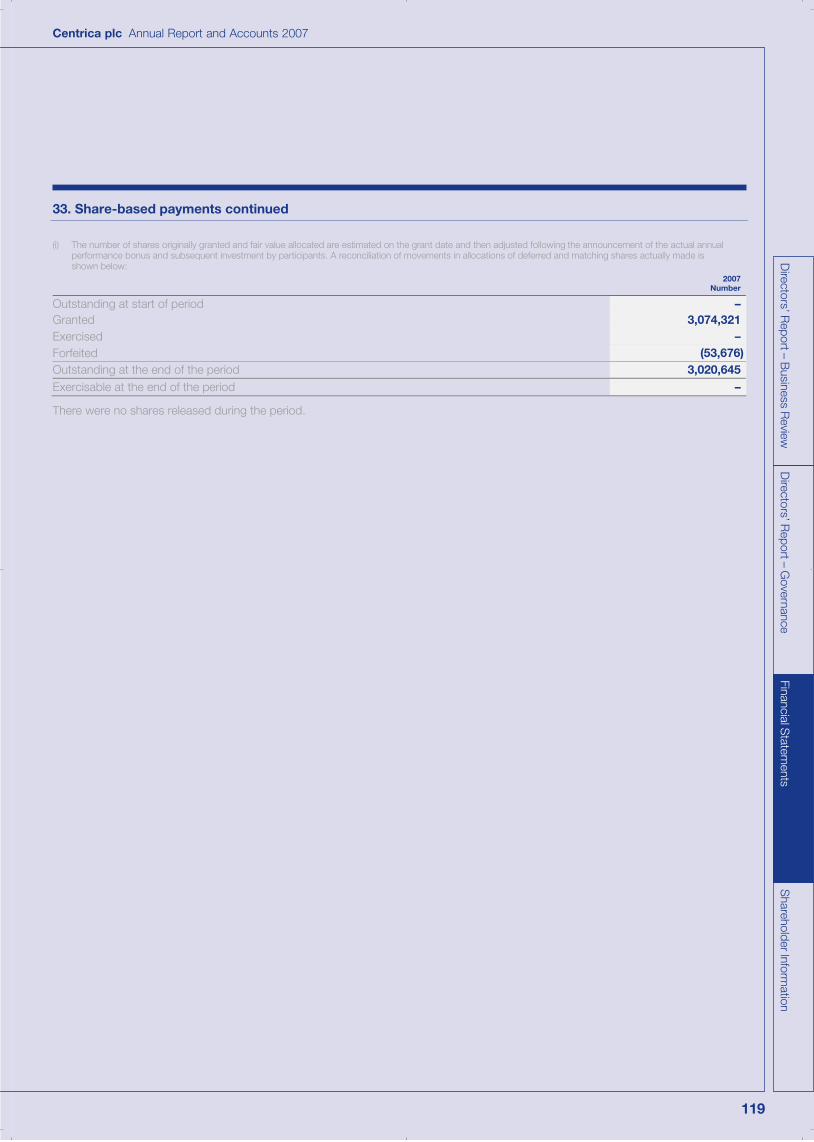
119
Directors’ R
eport – Business R
eviewD
irectors’ Report – G
overnanceFinancial S
tatements
Shareholder Inform
ationCentrica plc Annual Report and Accounts 2007
33. Share-based payments continued
(i) The number of shares originally granted and fair value allocated are estimated on the grant date and then adjusted following the announcement of the actual annualperformance bonus and subsequent investment by participants. A reconciliation of movements in allocations of deferred and matching shares actually made isshown below:
2007Number
Outstanding at start of period –Granted 3,074,321Exercised –Forfeited (53,676)Outstanding at the end of the period 3,020,645Exercisable at the end of the period –
There were no shares released during the period.

120
Centrica plc Annual Report and Accounts 2007
Notes to the Financial Statements continued
33. Share-based payments continued
ESOS Under the ESOS the Board may grant options over shares in Centrica plc to employees of the Group. Options are granted with a fixed exercise price equal to the market price of the shares at the legal date of grant which approximates, or is the same as, the grant date for accounting purposes. The contractual life of an option is ten years. Awards under the ESOS are generally reserved for employees within the senior executive group. The most recent award was made in 2006. There are no further awards planned at this time. Options granted under the ESOS will become exercisable on the third anniversary of the date of grant, subject to the growth in earnings per share over that period exceeding RPI growth by more than 18 percentage points. The number of options becoming exercisable is reduced on a sliding scale if EPS growth exceeds RPI growth by between nine and 18 percentage points. Options granted up to March 2004 also permit retesting of EPS growth annually for a further two years. Exercise of options is subject to continued employment within the Group. Options were valued using the Black-Scholes option pricing model. No performance conditions were included in the fair value calculations. Early exercise has been taken into account by estimating the expected life of the options. The fair values and the related assumptions used in the calculations are as follows:
Grant date 27 April
2006 23 September
2005 1 April2005
1 September2004
18 March 2004
1 September2003
24 March2003
Share price at grant date £2.99 £2.46 £2.28 £2.46 £2.28 £1.80 £1.47Exercise price £2.85 £2.51 £2.29 £2.45 £2.24 £1.78 £1.47Number of options originally granted 6,220,098 291,235 8,339,818 195,795 8,815,399 635,599 13,319,276Vesting period 3 yrs 3 yrs 3 yrs 3 yrs 3 yrs 3 yrs 3 yrsExpected volatility (i) 24% 30% 30% 27% 27% 35% 35%Contractual option life 10 yrs 10 yrs 10 yrs 10 yrs 10 yrs 10 yrs 10 yrsExpected life 5 yrs 5 yrs 5 yrs 5 yrs 5 yrs 5 yrs 5 yrsRisk-free rate 4.70% 4.80% 4.70% 5.00% 5.01% 4.45% 4.44%Expected dividend yield 4.10% 4.37% 4.37% 4.82% 4.82% 3.09% 3.09%Expected forfeitures 25% 25% 25% 25% 25% 25% 25%Fair value per option £0.59 £0.50 £0.49 £0.47 £0.45 £0.51 £0.41
(i) The expected volatility is based on historical volatility over the last three years, except in the case of options granted in 2003, where historical volatility over the precedingthree years was 43%. This was felt to be unrepresentative because it included a significant period of exceptionally high volatility in 1999-2000. In this case the volatilitywas reassessed ignoring this period. The expected life is the average expected period to exercise. The risk-free rate of return is the yield on zero-coupon UK government bonds of a term consistent with the expected option life. A reconciliation of option movements is as follows:
2007 2006
Number
Weighted average exercise
price £ Number
Weighted average exercise
price£
Outstanding at start of period 24,088,668 2.33 34,542,481 2.05Granted – – 6,220,098 2.85Exercised (2,564,114) 2.21 (13,063,314) 1.86Forfeited (1,983,529) 2.47 (3,610,597) 2.31Outstanding at the end of the period 19,541,025 2.33 24,088,668 2.33Exercisable at the end of the period 8,794,230 2.03 6,454,131 1.94
For options outstanding at the end of the period, the range of exercise prices and average remaining life was as follows:
2007 2006
Range of exerciseprices
Weighted average exercise price
Number of shares
Average remaining contractual life
YearsRange of exercise
prices Weighted average
exercise price Number
of shares
Average remaining contractual life
Years
£1.40 – £1.49 £1.47 2,656,985 5.3 £1.40 – £1.49 £1.47 2,799,139 6.3£2.20 – £2.29 £2.27 10,204,013 6.4 £2.20 – £2.29 £2.27 13,690,124 7.4£2.40 – £2.49 £2.40 1,294,990 3.6 £2.40 – £2.49 £2.40 1,515,850 4.7£2.50 – £2.59 £2.51 221,639 7.8 £2.50 – £2.59 £2.51 291,235 8.8£2.80 – £2.89 £2.85 5,163,398 8.3 £2.80 – £2.89 £2.85 5,792,320 9.3
£2.33 19,541,025 6.5 £2.33 24,088,668 7.6
For options exercised during the period the weighted average share price was £3.86 (2006: £2.92).

121
Directors’ R
eport – Business R
eviewD
irectors’ Report – G
overnanceFinancial S
tatements
Shareholder Inform
ationCentrica plc Annual Report and Accounts 2007
33. Share-based payments continued
LTIS Under the LTIS, allocations of shares in Centrica plc are made to employees of the Group. Awards under the LTIS are generally reserved for employees at senior management level. For awards made up to 2005, the number of shares to be released to participants is calculated subject to the Company’s total shareholder return (TSR) during the three years following the grant date, compared with the TSR of other shares in the FTSE 100 Index over the same period. The number of shares released is reduced on a sliding scale ifCentrica’s TSR is ranked between 50th and 25th. Shares are released to participants immediately following the end of the period in which TSR performance is assessed, but release of shares is subject to continued employment within the Group at the date of release.Allocations were valued using the Black-Scholes option pricing model. Performance conditions were included in the fair value calculations, through the use of a Monte Carlo simulation model. For awards made from 2006, the vesting of only half of each award is made on the basis of TSR performance. For this half of the award, the calculation of TSR performance as compared with the TSR of other FTSE 100 Index shares is consistent with awards made to the end of 2005, except that allocations are valued using a MonteCarlo simulation model. The number of shares released is increased on a sliding scale between 25% and 100% if Centrica’s TSR isranked between 50th and 20th. The vesting of the remaining half of awards made since 2006 is dependent on earnings per share (EPS) growth. This is considered a non-market condition under IFRS 2 and dividends attach to the awards, requiring the shares to be fair valued at market value on the date of grant. The likelihood of achieving the performance conditions is taken into account in calculating the number of awards expected to vest. For shares that vest on awards made from 2006 (for both TSR and EPS portions) the cash payment is increased to reflect the dividends that would have been paid on them during the performance period. The fair values and the related assumptions used in the calculations are as follows:
Grant date 14 September
2007 4 April
2007 4 September
2006 19 May
2006 2 May2006
23 September2005
1 April 2005
1 September2004
1 April2004
Share price at grant date £3.77 £3.91 £3.03 £2.65 £3.01 £2.46 £2.28 £2.46 £2.30Exercise price £nil £nil £nil £nil £nil £nil £nil £nil £nilNumber of shares originally granted 228,423 6,239,643 654,396 1,456,064 6,153,355 456,421 8,408,130 310,460 9,765,341Vesting period 3 yrs 3 yrs 3 yrs 2.9 yrs 2.9 yrs 3 yrs 3 yrs 3 yrs 3 yrsExpected volatility (i) 21% 21% 22% 22% 21% 30% 30% 27% 27%Contractual life 3 yrs 3 yrs 3 yrs 2.9 yrs 2.9 yrs 3 yrs 3 yrs 3 yrs 3 yrsExpected life 3 yrs 3 yrs 3 yrs 2.9 yrs 2.9 yrs 3 yrs 3 yrs 3 yrs 3 yrsRisk-free rate 5.40% 5.40% 4.80% 4.80% 4.70% 4.80% 4.68% 5.00% 5.04%Expected dividend yield n/a n/a n/a n/a n/a 4.37% 4.37% 4.82% 4.82%Expected forfeitures 20% 20% 20% 20% 20% 20% 20% 20% 20%Average volatility of FTSE 100 30% 30% 30% 30% 30% 30% 30% 30% 30%Average cross-correlation of FTSE 100 (ii) (ii) (ii) (ii) (ii) (ii) (ii) 30% 30%Fair value per share allocated– TSR awards £2.26 £2.26 £1.66 £1.38 £1.80 £1.20 £1.03 £1.25 £1.17Fair value per share allocated– EPS awards £3.77 £3.91 £3.03 £2.65 £3.01 n/a n/a n/a n/a
(i) The expected volatility is based on historical volatility over the last three years, except in the case of options granted in 2003, where historical volatility over the precedingthree years was 43%. This was felt to be unrepresentative because it included a significant period of exceptionally high volatility in 1999-2000. In this case the volatilitywas reassessed ignoring this period. The expected life is the contract life. The risk-free rate of return is the yield on zero-coupon UK government bonds of a termconsistent with the expected option life. A reconciliation of movements in allocations is as follows:
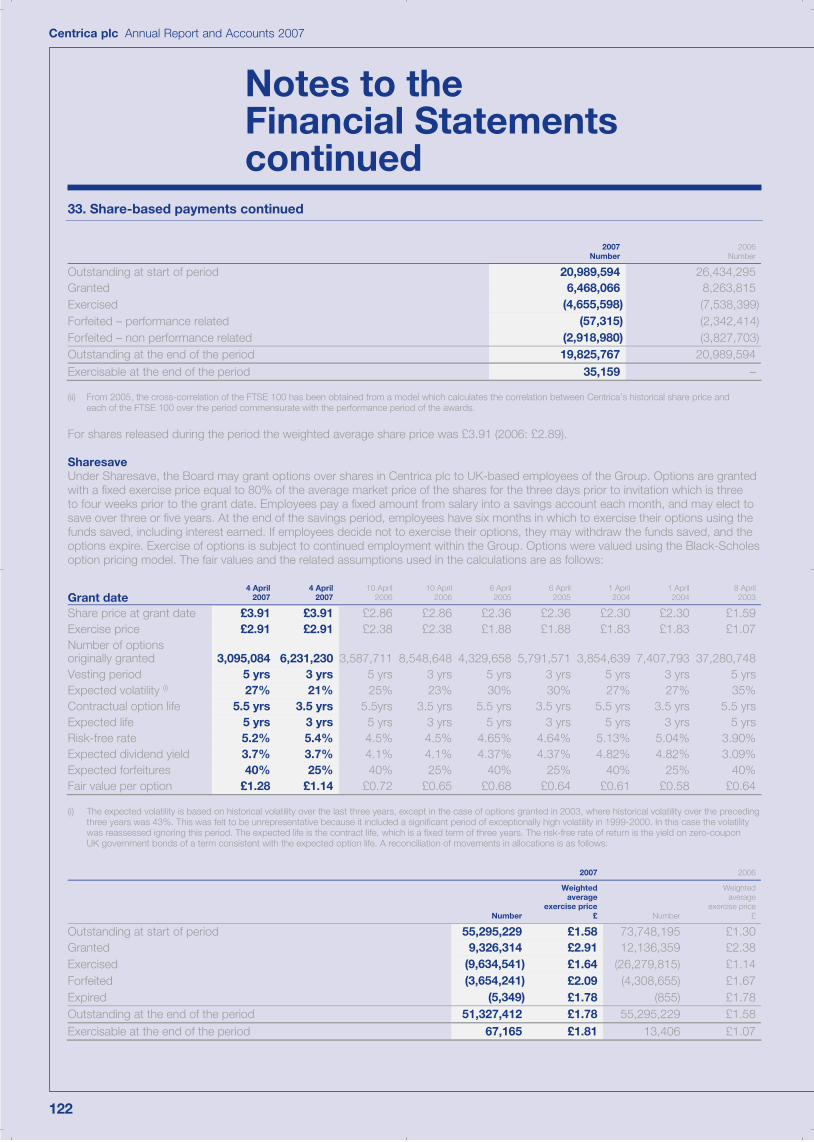
122
Centrica plc Annual Report and Accounts 2007
Notes to the Financial Statements continued
33. Share-based payments continued
2007 Number
2006Number
Outstanding at start of period 20,989,594 26,434,295Granted 6,468,066 8,263,815Exercised (4,655,598) (7,538,399)Forfeited – performance related (57,315) (2,342,414)Forfeited – non performance related (2,918,980) (3,827,703)Outstanding at the end of the period 19,825,767 20,989,594Exercisable at the end of the period 35,159 –
(ii) From 2005, the cross-correlation of the FTSE 100 has been obtained from a model which calculates the correlation between Centrica’s historical share price and each of the FTSE 100 over the period commensurate with the performance period of the awards.
For shares released during the period the weighted average share price was £3.91 (2006: £2.89).
Sharesave Under Sharesave, the Board may grant options over shares in Centrica plc to UK-based employees of the Group. Options are granted with a fixed exercise price equal to 80% of the average market price of the shares for the three days prior to invitation which is threeto four weeks prior to the grant date. Employees pay a fixed amount from salary into a savings account each month, and may elect to save over three or five years. At the end of the savings period, employees have six months in which to exercise their options using the funds saved, including interest earned. If employees decide not to exercise their options, they may withdraw the funds saved, and the options expire. Exercise of options is subject to continued employment within the Group. Options were valued using the Black-Scholes option pricing model. The fair values and the related assumptions used in the calculations are as follows:
Grant date 4 April
2007 4 April
2007 10 April
2006 10 April
2006 6 April2005
6 April 2005
1 April 2004
1 April2004
8 April2003
Share price at grant date £3.91 £3.91 £2.86 £2.86 £2.36 £2.36 £2.30 £2.30 £1.59Exercise price £2.91 £2.91 £2.38 £2.38 £1.88 £1.88 £1.83 £1.83 £1.07Number of options originally granted 3,095,084 6,231,230 3,587,711 8,548,648 4,329,658 5,791,571 3,854,639 7,407,793 37,280,748Vesting period 5 yrs 3 yrs 5 yrs 3 yrs 5 yrs 3 yrs 5 yrs 3 yrs 5 yrsExpected volatility (i) 27% 21% 25% 23% 30% 30% 27% 27% 35%Contractual option life 5.5 yrs 3.5 yrs 5.5yrs 3.5 yrs 5.5 yrs 3.5 yrs 5.5 yrs 3.5 yrs 5.5 yrsExpected life 5 yrs 3 yrs 5 yrs 3 yrs 5 yrs 3 yrs 5 yrs 3 yrs 5 yrsRisk-free rate 5.2% 5.4% 4.5% 4.5% 4.65% 4.64% 5.13% 5.04% 3.90%Expected dividend yield 3.7% 3.7% 4.1% 4.1% 4.37% 4.37% 4.82% 4.82% 3.09%Expected forfeitures 40% 25% 40% 25% 40% 25% 40% 25% 40%Fair value per option £1.28 £1.14 £0.72 £0.65 £0.68 £0.64 £0.61 £0.58 £0.64
(i) The expected volatility is based on historical volatility over the last three years, except in the case of options granted in 2003, where historical volatility over the precedingthree years was 43%. This was felt to be unrepresentative because it included a significant period of exceptionally high volatility in 1999-2000. In this case the volatilitywas reassessed ignoring this period. The expected life is the contract life, which is a fixed term of three years. The risk-free rate of return is the yield on zero-coupon UK government bonds of a term consistent with the expected option life. A reconciliation of movements in allocations is as follows:
2007 2006
Number
Weighted average
exercise price £ Number
Weighted average
exercise price£
Outstanding at start of period 55,295,229 £1.58 73,748,195 £1.30Granted 9,326,314 £2.91 12,136,359 £2.38Exercised (9,634,541) £1.64 (26,279,815) £1.14Forfeited (3,654,241) £2.09 (4,308,655) £1.67Expired (5,349) £1.78 (855) £1.78Outstanding at the end of the period 51,327,412 £1.78 55,295,229 £1.58Exercisable at the end of the period 67,165 £1.81 13,406 £1.07

123
Directors’ R
eport – Business R
eviewD
irectors’ Report – G
overnanceFinancial S
tatements
Shareholder Inform
ationCentrica plc Annual Report and Accounts 2007
33. Share-based payments continued
For options outstanding at the end of the period, the range of exercise prices and the average remaining life was as follows:
2007 2006
Range ofexercise prices
Weighted average exercise price
Number of shares
Average remaining contractual life
YearsRange of
exercise prices Weighted average
exercise price Number
of shares
Average remaining contractual life
Years
£1.00 – £1.09 £1.07 23,365,748 0.9 £1.00 – £1.09 £1.07 26,461,884 1.9£1.70 – £1.79 £1.78 24,775 0.0 £1.70 – £1.79 £1.78 2,493,279 0.9£1.80 – £1.89 £1.87 9,483,726 1.8 £1.80 – £1.89 £1.86 15,027,623 2.3£1.90 – £1.99 £1.91 706 0.0 £1.90 – £1.99 £1.91 3,886 0.0£2.30 – £2.39 £2.38 9,801,701 2.5 £2.30 – £2.39 £2.38 11,308,557 3.5£2.90 – £2.99 £2.91 8,650,756 3.6 £2.90 – £2.99 – – –
£1.78 51,327,412 1.9 £1.58 55,295,229 2.3
For options exercised during the period the weighted average share price at the date of exercise was £3.77 (2006: £2.80).
SAS Under the SAS, allocations of shares in Centrica plc are made to selected employees of the Group. Awards under the SAS are generally reserved for certain selected employees at middle management levels, based on recommendation by the Chief Executive and the Group Director, Human Resources. There is no contractual eligibility for SAS and each year’s award is made independently from previous awards. Allocations are subject to no performance conditions and vest unconditionally subject to continued employment with the Group in two stages – half of the award vesting after two years, the other half vesting after three years. On vesting, additional shares or a cash payment are made to reflect dividends that would have been paid on the allocations during the retention period. The fair value is therefore considered to be the market value at date of grant. The fair values and related assumptions used to calculate the cost to the Group are as follows:
Grant date 4 April
2007 4 April
2007 3 April2006
3 April2006
Share price at grant date £3.91 £3.91 £2.84 £2.84Exercise price £nil £nil £nil £nilNumber of options originally granted 585,022 584,781 780,367 780,143Vesting period 3 yrs 2 yrs 3 yrs 2 yrsContractual option life 3 yrs 2 yrs 3 yrs 2 yrsExpected forfeitures 25% 15% 25% 15%Fair value per option £3.91 £3.91 £2.84 £2.84
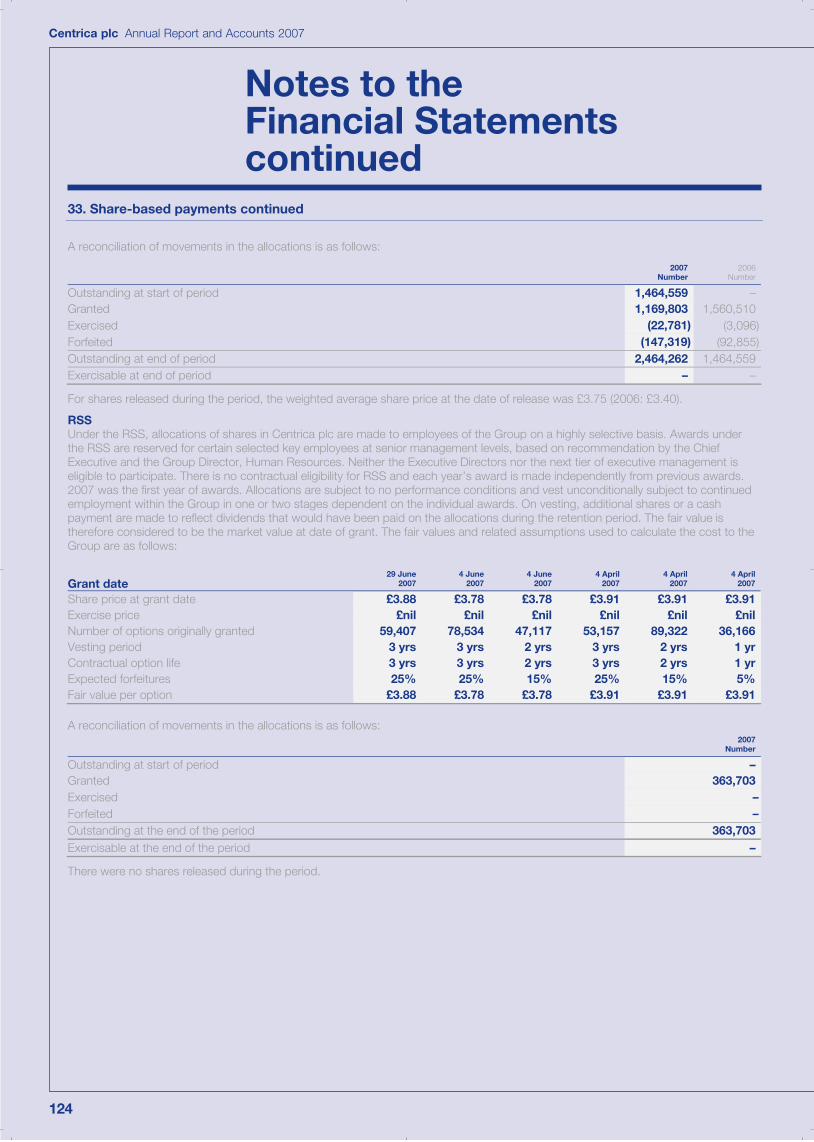
124
Centrica plc Annual Report and Accounts 2007
Notes to the Financial Statements continued
33. Share-based payments continued
A reconciliation of movements in the allocations is as follows:
2007 Number
2006Number
Outstanding at start of period 1,464,559 –Granted 1,169,803 1,560,510Exercised (22,781) (3,096)Forfeited (147,319) (92,855)Outstanding at end of period 2,464,262 1,464,559Exercisable at end of period – –
For shares released during the period, the weighted average share price at the date of release was £3.75 (2006: £3.40).
RSS Under the RSS, allocations of shares in Centrica plc are made to employees of the Group on a highly selective basis. Awards under the RSS are reserved for certain selected key employees at senior management levels, based on recommendation by the ChiefExecutive and the Group Director, Human Resources. Neither the Executive Directors nor the next tier of executive management iseligible to participate. There is no contractual eligibility for RSS and each year’s award is made independently from previous awards. 2007 was the first year of awards. Allocations are subject to no performance conditions and vest unconditionally subject to continued employment within the Group in one or two stages dependent on the individual awards. On vesting, additional shares or a cash payment are made to reflect dividends that would have been paid on the allocations during the retention period. The fair value is therefore considered to be the market value at date of grant. The fair values and related assumptions used to calculate the cost to the Group are as follows:
Grant date 29 June
2007 4 June
2007 4 June
2007 4 April
2007 4 April
2007 4 April
2007
Share price at grant date £3.88 £3.78 £3.78 £3.91 £3.91 £3.91Exercise price £nil £nil £nil £nil £nil £nilNumber of options originally granted 59,407 78,534 47,117 53,157 89,322 36,166Vesting period 3 yrs 3 yrs 2 yrs 3 yrs 2 yrs 1 yrContractual option life 3 yrs 3 yrs 2 yrs 3 yrs 2 yrs 1 yrExpected forfeitures 25% 25% 15% 25% 15% 5%Fair value per option £3.88 £3.78 £3.78 £3.91 £3.91 £3.91
A reconciliation of movements in the allocations is as follows: 2007
Number
Outstanding at start of period –Granted 363,703Exercised –Forfeited –Outstanding at the end of the period 363,703Exercisable at the end of the period –
There were no shares released during the period.

125
Directors’ R
eport – Business R
eviewD
irectors’ Report – G
overnanceFinancial S
tatements
Shareholder Inform
ationCentrica plc Annual Report and Accounts 2007
33. Share-based payments continued
SIP Under SIP, employees in the UK may purchase ‘partnership shares’ through monthly salary deductions. The Company then grants one‘matching share’ for every two purchased, up to a maximum of 20 matching shares per employee per month. Both partnership sharesand matching shares are held in a trust initially. Partnership shares may be withdrawn at any time, but matching shares are forfeited if the related partnership shares are withdrawn within three years from the original purchase date. Matching shares vest unconditionally for employees after being held for three years in the trust. Vesting of matching shares is also subject to continued employment within the Group. Matching shares are valued at the market price at the grant date. The average fair value of these awards during the year was £3.72 (2006: £2.97). A reconciliation of matching shares held in trust is as follows:
2007Number
2006Number
Unvested at start of period 2,500,916 2,067,233Granted 633,348 771,767Shares sold and transferred out of the plan (292,005) (199,711)Forfeited (122,955) (138,373)Unvested at end of period 2,719,304 2,500,916
ESPP Under the ESPP, employees in North America purchase ‘partnership shares’ through salary deductions. The Company then grants one‘matching share’ for every two shares purchased. Partnership shares may be withdrawn at any time, but the entitlement to matchingshares is forfeited if the related partnership shares are withdrawn within two years from the original purchase date. Matching shares vest unconditionally for employees after being held for two years. Vesting of matching shares is also subject to continued employmentwithin the Group. Matching shares are valued at the market price at the grant date. The average fair value of these awards during the year was £3.69 (2006: £2.97). A reconciliation of matching shares granted is shown below:
2007 Number
2006Number
Unvested at start of period 369,163 208,329Granted 200,398 230,916Vested (167,687) (29,353)Forfeited (36,096) (40,729)Unvested at end of period 365,778 369,163

126
Centrica plc Annual Report and Accounts 2007
Notes to the Financial Statements continued
34. Pensions
Substantially all of the Group’s UK employees at 31 December 2007 were members of one of the three main schemes: the Centrica Pension Scheme, the Centrica Engineers’ Pension Scheme and the Centrica Management Pension Scheme (together the approved pension schemes). The Centrica Pension Scheme (final salary section) and the Centrica Management Pension Scheme (a final salaryscheme) were closed to new members from 1 April 2003. The Centrica Pension Scheme has an open career average salary section. The Centrica Engineers’ Pension Scheme (final salary section) was closed to new members from 1 April 2006, and a career averagesalary section was added to the scheme at that date. These schemes are defined benefit schemes and are tax-approved fundedarrangements. They are subject to independent valuations at least every three years, on the basis of which the qualified actuary certifies the rate of employer contributions which, together with the specified contributions payable by the employees and proceeds from the schemes’ assets, are expected to be sufficient to fund the benefits payable under the schemes.
The Centrica Unapproved Pension Scheme is an unfunded arrangement which provides benefits to certain employees whose benefits under the main schemes would otherwise be limited by the earnings cap. The Group also has a commitment to provide certain pension and post-retirement benefits to employees of Direct Energy Marketing Limited (Canada).
The latest full actuarial valuations were carried out at the following dates: the approved pension schemes at 31 March 2006, the Unapproved Pension Scheme at 6 April 2005 and the Direct Energy Marketing Limited pension plan at 14 June 2005. These have been updated to 31 December 2007 for the purposes of meeting the requirements of IAS 19. Investments have been valued, for thispurpose, at market value.
Major assumptions used for the actuarial valuation
31 December2007
%
31 December2006
%
Rate of increase in employee earnings 4.40 4.00Rate of increase in pensions in payment and deferred pensions 3.40 3.00Discount rate 5.80 5.00Inflation assumption 3.40 3.00
The assumptions relating to longevity underlying the pension liabilities at the balance sheet date have been based on a combinationof standard actuarial mortality tables, scheme experience and other relevant data, and include a medium cohort allowance for future improvements in longevity, as published by the Institute of Actuaries. The assumptions are equivalent to future longevity for members in normal health approximately as follows:
2007 2006
Life expectancy at age 65 for a member: Male
YearsFemale
YearsMale
Years Female
Years
Currently aged 65 20.2 21.8 20.2 21.7Currently aged 45 21.4 22.9 21.3 22.9
At 31 March 2006, the date of the most recent actuarial review, the schemes had approximately 31,900 members and beneficiaries (20,850 male and 11,050 female).
The other demographic assumptions have been set having regard to the latest trends in scheme experience and other relevant data. The assumptions are reviewed and updated as necessary as part of the periodic actuarial valuation of the pension schemes.
2007 2006
Impact of changing material assumptions
Increase/decrease inassumption
Indicative effecton scheme
liabilities %
Increase/decreasein assumption
Indicativeeffect onscheme
liabilities%
Rate of increase in employee earnings 0.25% +/-2 0.25% +/-2Rate of increase in pensions in payment and deferred pensions 0.25% +/-4 0.25% +/-4Discount rate 0.25% -/+6 0.25% -/+6Inflation assumption 0.25% +/-6 0.25% +/-6Longevity assumption 1 year +/-2 1 year +/-2

127
Directors’ R
eport – Business R
eviewD
irectors’ Report – G
overnanceFinancial S
tatements
Shareholder Inform
ationCentrica plc Annual Report and Accounts 2007
34. Pensions continued
The expected rate of return and market value of the assets and the present value of the liabilities in the schemes at 31 December were:
Expected rateof return
per annum2007
%
Valuation 2007
£m
Expected rateof return
per annum2006
%
Valuation2006
£m
UK equities 8.1 1,549 7.8 1,486Non-UK equities 8.1 931 7.8 857Fixed-interest bonds 5.8 412 5.3 312Index-linked bonds 4.5 351 4.3 213Property 6.8 50 6.2 68Cash and other assets 5.4 34 5.0 52Total fair value of plan assets 7.4 3,327 7.2 2,988Present value of defined benefit obligation (3,230) (3,284)Net asset/(liability) recognised in the Balance Sheet 97 (296)Associated deferred tax (liability)/asset recognised in the Balance Sheet (28) 89Net pension asset/(liability) 69 (207)Net asset/(liability) recognised in the Balance Sheet comprises:
Surpluses 152 –Deficits (55) (296)
97 (296)
The overall expected rate of return on assets is a weighted average based on the actual plan assets held and the respective expected returns on separate asset classes. The returns on separate asset classes were derived as follows: the expected rate of return on equities is based on the expected median return over a ten-year period, as calculated by the independent company actuary. The median return over a longer period than ten years was not expected to be materially dissimilar. The expected rate of return on bonds was measured directly from actual market yields for UK gilts and corporate bond stocks. The rate above takes into account the actual mixture of UK gilts, UK corporate bonds and overseas bonds held at the balance sheet date. The expected rate of return on property takes into account both capital growth and allowance for expenses, rental growth and depreciation. The expected rate of return oncash is comparable to current bank interest rates.
Included within the schemes’ liabilities above are £31 million (2006: £27 million) relating to unfunded pension arrangements. Included within non-current available-for-sale financial assets are £30 million (2006: £29 million) of investments, held by the Law Debenture Trust on behalf of the Company, as security in respect of the Centrica Unapproved Pension Scheme.
Analysis of the amount charged to operating profit 2007
£m 2006
£m
Current service cost 127 143Plan amendment (i) – (20)Loss on curtailment – 18Net charge to operating profit 127 141
(i) The Schemes’ rules were amended from 1 April 2006 to allow employees to commute a larger amount of their pension to a cash lump sum on retirement, in line withchanges to the Finance Act. Accordingly, the assumptions made in calculating the Group’s defined benefit pension liability were revised, and a gain of £20 million wasrecognised in Group operating profit before exceptional items and certain re-measurements. Future revisions to the assumptions will be reflected within the Statementof Recognised Income and Expense.
Analysis of the amount credited to notional interest 2007
£m 2006
£m
Expected return on pension scheme assets 221 194Interest on pension scheme liabilities (166) (168)Net credit to notional interest income 55 26

128
Centrica plc Annual Report and Accounts 2007
Notes to the Financial Statements continued
34. Pensions continued
Analysis of the actuarial gain/(loss) recognised in the Statement of Recognised Income and Expense
2007£m
2006£m
Actual return less expected return on pension scheme assets (38) 95Experience gains and losses arising on the scheme liabilities (16) 145Changes in assumptions underlying the present value of the schemes’ liabilities 338 235Actuarial gain to be recognised in the Statement of Recognised Income andExpense before adjustment for tax 284 475Cumulative actuarial gains and losses recognised in reserves at 1 January 439 (36)Cumulative actuarial gains and losses recognised in reserves at 31 December 723 439
Five year history of surplus/(deficit) 2007
£m 2006
£m2005
£m2004
£m2003
£m
Plan assets 3,327 2,988 2,570 2,041 2,353Defined benefit obligation (3,230) (3,284) (3,390) (2,760) (3,491)Surplus/(deficit) 97 (296) (820) (719) (1,138)
Five year history of experience gains and losses 2007 2006 2005 2004 2003
Difference between the expected and actual return on scheme assets: Amount (£m) (38) 95 307 64 202Percentage of scheme assets 1.1% 3.2% 11.9% 3.1% 8.6%Experience gains and losses on scheme liabilities: Amount (£m) (16) 145 21 134 (64)Percentage of the present value of scheme liabilities 0.5% 4.4% 0.6% 4.9% 1.8%Total actuarial gain/(loss) recognised in the Statement of Recognised Income and Expense: Amount (£m) 284 475 (126) 90 (281)Percentage of the present value of scheme liabilities 8.8% 14.5% 3.7% 3.3% 8.0%
Movement in the defined benefit obligation during the year 2007
£m 2006
£m
1 January 3,284 3,390Movements in the year: Current service cost 127 143 Plan amendment – (20)
Loss on curtailment 36 18Interest on scheme liabilities 166 168Plan participants’ contributions 25 25Benefits paid from schemes (87) (60)Benefits paid by company (1) –
Actuarial (gain)/loss (322) (380) Acquisitions 2 –31 December 3,230 3,284

129
Directors’ R
eport – Business R
eviewD
irectors’ Report – G
overnanceFinancial S
tatements
Shareholder Inform
ationCentrica plc Annual Report and Accounts 2007
34. Pensions continued
Movement in plan assets during the year2007
£m 2006
£m
1 January 2,988 2,570Movements in the year:
Expected return on scheme assets 221 194 Actuarial (loss)/gain (38) 95 Employer contributions 218 164
Plan participants’ contributions 25 25Benefits paid from schemes (87) (60)
31 December 3,327 2,988
Agreed future employer contribution rates (pensionable salary and % of pensionable salary) for the three main defined benefit schemes
2007£m
2007%
Centrica Pension Scheme – Final salary section 149 22.4Centrica Pension Scheme – CRIS section 90 10.9Centrica Engineers’ Pension Scheme – Final salary section 174 23.0Centrica Engineers’ Pension Scheme – CERIS section 32 12.5Centrica Management Pension Scheme 71 22.6

130
Centrica plc Annual Report and Accounts 2007
Notes to the Financial Statements continued
35. Acquisitions and disposals
(i) AcquisitionsDuring the year, the Group acquired 100% of the issued share capital of Newfield UK Holdings Limited from Newfield International Holdings Inc for cash consideration of £250 million (£242 million base consideration, plus adjustments for working capital and indebtedness arising between the effective date and the completion date). Other smaller acquisitions are described in section (b).
The purchase method of accounting was adopted in all cases. The analysis of assets and liabilities acquired, and the fair value of these acquisitions, are as shown below. All intangible fixed assets were recognised at their respective fair values.
The residual excess over the net assets acquired on each acquisition is recognised as goodwill in the Financial Statements.
The fair values stated are provisional because the Directors have not yet reached a final determination on all aspects of the fair value exercise.
(a) Newfield UK Holdings Limited
IFRS carrying valuespre-acquisition
£m
Fairvalue
£m
Other intangible assets – 12Property, plant and equipment 97 244Inventory 2 2Trade and other receivables 4 4Cash and cash equivalents 3 3Trade and other payables (8) (8)Provisions for other liabilities and charges (14) (16)Deferred tax liabilities – (46)Net assets acquired 84 195Goodwill arising 55Cash consideration 250
The Group acquired 100% of the issued share capital of Newfield UK Holdings Limited on 5 October 2007 for cash considerationof £250 million. Newfield UK Holdings Limited is an exploration and production group with activities focused in the UK SouthernGas Basin. The acquired business contributed a profit after tax of £7 million to the Group for the period from 5 October 2007 to 31 December 2007. The book values of assets and liabilities have been adjusted to align with the fair values of assets and liabilities acquired. The adjustments to recognise other intangible assets and property, plant and equipment at fair value mainly relate to the acquired exploration assets and producing gas field assets. Goodwill has principally arisen in relation to the recognition of deferred tax on these fair value adjustments.
(b) Other acquisitionsOn 8 February 2007, the Group’s subsidiary The Consumers’ Waterheater Income Fund acquired the water heater rental business of Toronto Hydro Energy Services Inc. for cash consideration of £18 million. The fair value of net assets acquired comprised £10 million for water heater fixed assets and £8 million for intangible assets representing acquired contractual customer relationships. In addition, the Fund acquired approximately 3,400 water heaters from Festival Hydro Inc. for cash consideration of £0.7 million on 1 November 2007. Net assets acquired, including intangible assets, were recorded at their determined fair values of £0.7 million. No goodwill was recorded on these acquisitions. The Group has deconsolidated The Consumers’ Waterheater Income Fund with effect from 1 December 2007 as explained in note 3. These acquired businesses are included in the assets and liabilities of the Fund asdeconsolidated with effect from 1 December 2007, with associated cash flows included within discontinued activities.
The Group acquired the home appliance service assets of Mabe Canada Inc. on 22 January 2007 (consideration £3 million, goodwill£2.5 million) and the home appliance service/repair business of Factory Appliance (consideration £0.5 million, goodwill £0.4 million) on 7 May 2007. On 14 September 2007 the residential new construction, service and replacement business CA Woods was acquired by the Group (consideration £0.8 million, goodwill £0.5 million).

131
Directors’ R
eport – Business R
eviewD
irectors’ Report – G
overnanceFinancial S
tatements
Shareholder Inform
ationCentrica plc Annual Report and Accounts 2007
35. Acquisitions and disposals continued
The pro forma consolidated results of the Group, as if the 2007 acquisitions had been made at the beginning of the period, include revenues from continuing operations of £16,382 million and a profit after tax of £1,506 million. The pro forma results have been calculated using the Group’s accounting policies. In preparing the pro forma results, revenue and costs have been included as if thebusinesses were acquired on 1 January 2007 and inter-company transactions had been eliminated. This information is not necessarily indicative of the results of the combined Group that would have occurred had the purchases actually been made at the beginning of the period presented, or indicative of the future results of the combined Group.
During 2007, the Group paid £11 million of contingent and deferred consideration, £10 million representing the final contingentpayment relating to the acquisition of CPL/WTU in 2002 and £1 million representing a deferred payment relating to the acquisitionof Wainstones Power Limited in 2004.
(ii) Disposals(a) Discontinued operation – The Consumers’ Waterheater Income Fund As explained in note 3, the Group has deconsolidated The Consumers’ Waterheater Income Fund (the Fund) with effect from 1 December 2007. The Group previously consolidated the Fund in accordance with SIC-12, Consolidation – Special Purpose Entities. An analysis of assets and liabilities disposed of and the pre-tax profit arising on disposal is presented below:
£m
Attributable goodwill 124Other intangible assets – customer relationships and other 9Property, plant and equipment – water heaters 221Trade and other receivables – current 4Cash and cash equivalents 15Trade and other payables – current (8)Bank overdrafts and loans (15)Issued bonds (248)Borrowings – units of The Consumers’ Waterheater Income Fund (325)Exchange differences on translation of foreign operations (4)Net liabilities disposed of (227)Gain on disposal of discontinued operation 227Proceeds on disposal –
Attributable goodwill represents the portion of goodwill within the Canada home services cash-generating unit which is allocated to the operations of the Fund on its deconsolidation. Goodwill arose on the Enbridge Services acquisition in 2002. The water heater assets acquired as part of this acquisition were transferred to the Fund on its creation in 2002. Goodwill has been attributed to the Fund on its deconsolidation on the basis of the relative fair value of both the Fund and the remaining operations contained within the Canada home services cash-generating unit.
At the date of deconsolidation the Group held a nil% interest in the Fund. Accordingly, £nil proceeds arise on deconsolidating the Fund from the Group accounts. The units in the Fund have historically been accounted for as a financial liability of the Group as opposed to a minority interest in equity due to the redemption rights which attach to them. This liability has only ever represented a liability of the Fund and has therefore been previously presented as non-recourse borrowings. On deconsolidating the Fund, a gain of £227 million arises principally as a result of extinguishing this liability, net of attributable goodwill. Given its materiality and non-recurring nature this gain is presented as exceptional within the Income Statement.

132
Centrica plc Annual Report and Accounts 2007
Notes to the Financial Statements continued
35. Acquisitions and disposals continued
The Fund’s activities represent a separate major line of business for the Direct Energy segment and contributed materially to Group borrowings. In order to provide a clear and consistent presentation of the impact of deconsolidating the Fund, the results in the current year and prior year have been presented as a discontinued operation distinct from continuing operations within the Group IncomeStatement. The effect of the discontinued operation on the Direct Energy segment results is presented in note 6. An analysis of the results of The Consumers’ Waterheater Income Fund presented as a discontinued operation within the Group Income Statement is as follows:
2007 2006
Results for the period to 1 December
before exceptional
items and certainre-measurements
£m
Exceptionalitems and certainre-measurements
£m
Results forthe period to1 December
£m
Results forthe year before
exceptional items and certain re-measurements
£m
Exceptionalitems and certain re-measurements
£m
Results forthe year
£m
Revenue 42 – 42 47 – 47Cost of sales (i) 27 – 27 25 – 25Gross profit 69 – 69 72 – 72Operating costs (30) – (30) (22) – (22)Operating profit 39 – 39 50 – 50Net interest expense (38) (19) (57) (42) 37 (5)Profit/(loss) before taxation 1 (19) (18) 8 37 45Tax credit – – – 6 – 6Profit/(loss) after taxation from discontinued operation 1 (19) (18) 14 37 51Gain on disposal of discontinued operation – 227 227 – – –Taxation on gain on disposal of discontinued operation – – – – – –Discontinued operations 1 208 209 14 37 51
(i) Included in discontinued operations is elimination of the cost of sales incurred on sales of water heaters from Direct Energy to the Fund resulting in a credit to the costof sales reported above.
In previous years, the Group has been subject to capital gains tax on the sell-down of its equity in the Fund. At the date of deconsolidation the Group held a nil equity interest in the Fund and £nil proceeds arose on deconsolidating the Fund from the Group accounts. Accordingly, £nil tax arises on the gain on deconsolidation.
Centrica continues to service the majority of the Fund’s assets and continues to procure water heater assets for the Fund. The revenues received from the Fund for undertaking these activities is included as part of the continuing operations of the Direct Energy segment as shown in note 37.
(b) Discontinued operation – OneTel In 2006, the finalisation of the OneTel disposal resulted in a charge to the Income Statement of £8 million net of a £3 million tax credit.
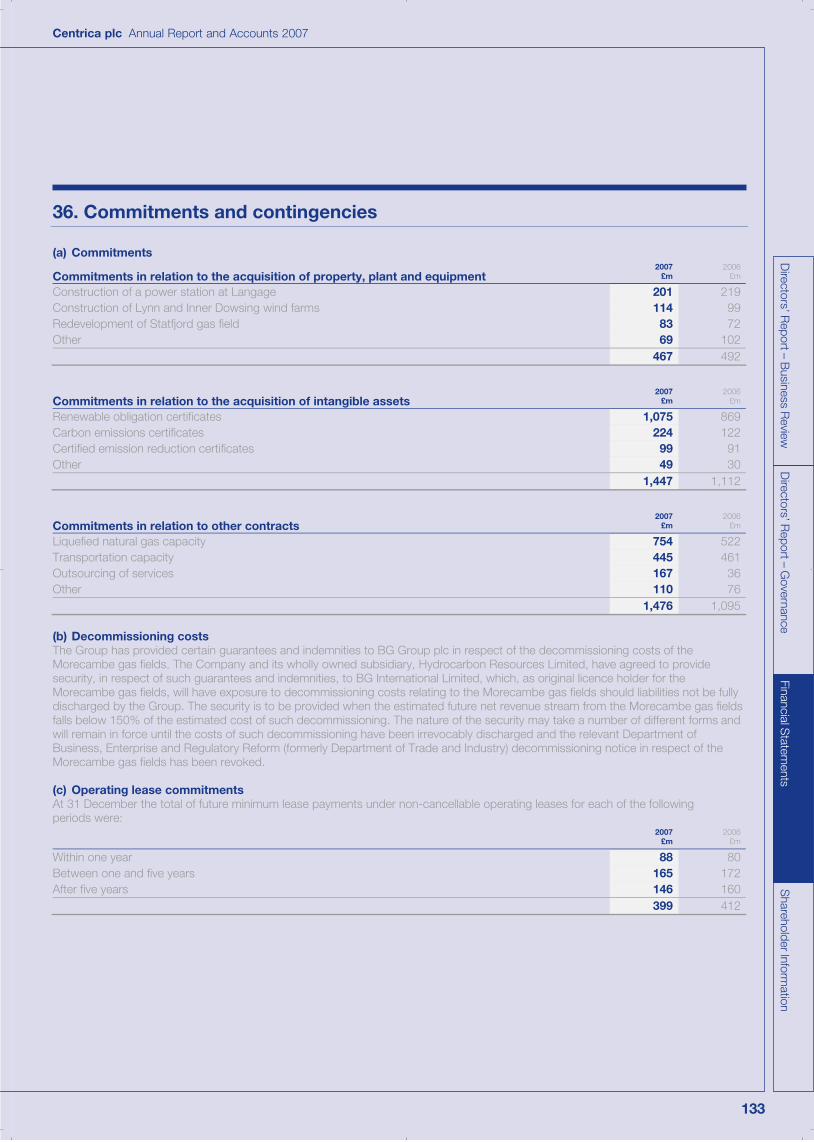
133
Directors’ R
eport – Business R
eviewD
irectors’ Report – G
overnanceFinancial S
tatements
Shareholder Inform
ationCentrica plc Annual Report and Accounts 2007
36. Commitments and contingencies
(a) Commitments
Commitments in relation to the acquisition of property, plant and equipment 2007
£m 2006
£m
Construction of a power station at Langage 201 219Construction of Lynn and Inner Dowsing wind farms 114 99Redevelopment of Statfjord gas field 83 72Other 69 102
467 492
Commitments in relation to the acquisition of intangible assets2007
£m 2006
£m
Renewable obligation certificates 1,075 869Carbon emissions certificates 224 122Certified emission reduction certificates 99 91Other 49 30
1,447 1,112
Commitments in relation to other contracts 2007
£m 2006
£m
Liquefied natural gas capacity 754 522Transportation capacity 445 461Outsourcing of services 167 36Other 110 76
1,476 1,095
(b) Decommissioning costs The Group has provided certain guarantees and indemnities to BG Group plc in respect of the decommissioning costs of the Morecambe gas fields. The Company and its wholly owned subsidiary, Hydrocarbon Resources Limited, have agreed to provide security, in respect of such guarantees and indemnities, to BG International Limited, which, as original licence holder for theMorecambe gas fields, will have exposure to decommissioning costs relating to the Morecambe gas fields should liabilities not be fully discharged by the Group. The security is to be provided when the estimated future net revenue stream from the Morecambe gas fields falls below 150% of the estimated cost of such decommissioning. The nature of the security may take a number of different forms and will remain in force until the costs of such decommissioning have been irrevocably discharged and the relevant Department of Business, Enterprise and Regulatory Reform (formerly Department of Trade and Industry) decommissioning notice in respect of theMorecambe gas fields has been revoked.
(c) Operating lease commitments At 31 December the total of future minimum lease payments under non-cancellable operating leases for each of the following periods were:
2007£m
2006£m
Within one year 88 80Between one and five years 165 172After five years 146 160
399 412

134
Centrica plc Annual Report and Accounts 2007
Notes to the Financial Statements continued
36. Commitments and contingencies continued
2007£m
2006£m
The total of future minimum sub-lease payments expected to be received under non-cancellable operating sub-leases at 31 December 8 17Lease and sub-lease payments recognised as an expense in the year were as follows: Minimum lease payments 60 67
Contingent rents – renewables (i) 48 30
(i) The Group has entered into long-term arrangements with renewable providers to purchase physical power, renewable obligation certificates and levy exemption certificates from renewable sources. Payments made under these contracts are contingent upon actual production and therefore the commitment to a minimum leasepayment included above is £nil (2006: £nil). Payments made for physical power are charged to the Income Statement as incurred and disclosed as contingent rents.
(d) Contingent liabilities There are no contingent liabilities.
(e) Guarantees and indemnities In connection with the Group’s energy trading, transportation and upstream activities, certain Group companies have entered into contracts under which they may be required to prepay or provide credit support or other collateral in the event of a significant deterioration in creditworthiness. The extent of credit support is contingent upon the balance owing to the third party at the point of deterioration.
(f) Commodity purchase contracts The Group procures gas and electricity through a mixture of production from owned gas fields and power stations and procurementcontracts. Procurement contracts include short-term forward market purchases of gas and electricity at fixed and floating prices. They also include gas contracts indexed to market prices and long-term gas contracts with non-gas indexation.
Commodity purchase commitments are estimated, on an undiscounted basis, as follows: 2007
£m 2006
£m
Within one year 8,400 7,800Between one and five years 18,100 16,100After five years 9,100 10,400
35,600 34,300
The total volume of gas to be taken under certain long-term structured contracts depends on a number of factors, including the actualreserves of gas that are eventually determined to be extractable on an economic basis. The resulting monetary commitment is based on the minimum quantities of gas that the Group is contracted to pay at estimated future prices.
The estimated commitment to make payments under gas procurement contracts differs in scope and in basis from the maturity analysis of energy derivatives disclosed in note 21. Only certain procurement and sales contracts are within the scope of IAS 39 and included in note 21. In addition, the volumes used in calculating principal values are estimated using valuation techniques. Contractual commitments which are subject to fulfilment of conditions precedent are excluded.
37. Related party transactions
During the year the Group entered into the following transactions with related parties who are not members of the Group:
2007 2006
Saleof goods and
services£m
Purchaseof goods
and services£m
Other transactions
£m
Sale of goods and
services£m
Purchaseof goods
and services£m
Othertransactions
£m
Barrow Offshore Wind Limited – 14 2 – 8 1Braes of Doune Wind Farm (Scotland) Limited – 10 – – – –The Consumers’ Waterheater Income Fund 72 – 2 65 – 2
72 24 4 65 8 3

135
Directors’ R
eport – Business R
eviewD
irectors’ Report – G
overnanceFinancial S
tatements
Shareholder Inform
ationCentrica plc Annual Report and Accounts 2007
37. Related party transactions continued
Balances outstanding with related parties at 31 December were as follows:
2007 2006
Amounts owed from related
parties£m
Amounts owed to related
parties£m
Provision forbad or doubtfuldebt relating toamounts owed
from relatedparties
£m
Amounts owedfrom related
parties£m
Amounts owedto related
parties£m
Provision forbad or doubtfuldebt relating toamounts owed
from relatedparties
£m
Barrow Offshore Wind Limited 26 4 – 23 3 –Braes of Doune Wind Farm (Scotland) Limited – 4 – – – –The Consumers’ Waterheater Income Fund 3 – – 3 – –
29 8 – 26 3 –
Barrow Offshore Wind Limited and Braes of Doune Wind Farm (Scotland) Limited are both joint ventures of the Group.
The Consumers’ Waterheater Income Fund was deconsolidated with effect from 1 December 2007. The deconsolidation is explainedin note 3. The transactions disclosed in the tables above reflect all transactions entered into with the Fund for the full year.
Remuneration of key management personnel 2007
£m 2006
£m
Short-term benefits 8 8Post-employment benefits 3 5Share-based payments 5 3
16 16
Key management personnel comprise members of the Board and Executive Committee, a total of 15 individuals at 31 December 2007 (2006: 13). Key management personnel and their families purchase gas, electricity and home services products from the Group fordomestic purposes on an arm’s length basis.
38. Fixed-fee service contracts
Fixed-fee service contracts are entered into with home services customers in the UK and North America (HomeCare: 100, 200, 300,400, HomeCare Flexi: 100, 200, 300, 400, Gas Appliance Care, Gas Appliance Check, Plumbing and Drains Care, Plumbing and Drains Care Flexi, Kitchen Appliance Care, Home Electrical Care and Home Electrical Care Flexi in the UK, and Heating Protection, Cooling Protection and Plumbing and Drains Protection in North America). These contracts continue until cancelled by either party to the contract. These plans incorporate both an annual service element and a maintenance element.
Fixed-fee service contracts protect purchasers of these contracts against the risk of breakdown of electrical, plumbing, heating, cooling and household appliances, resulting in the transfer of an element of risk from contract holders to Centrica. Benefits provided to customers vary in accordance with terms and conditions of the contracts entered into, however, generally include repair and/or replacement of the items affected.
The risk and level of service required within the maintenance element of the contracts is dependent upon the occurrence of uncertain future events, in particular the number of call-outs, the cost per call-out and the nature of the fault. Accordingly, the timing and amountof future cash outflows related to the contracts is uncertain.
The key terms and conditions that affect future cash flows are as follows: � provision of labour and parts for repairs, dependent on the agreement and associated level of service; � one safety and maintenance inspection in every year of the agreement (for HomeCare: 100, 200, 300, 400 (excluding electrical
fixtures), HomeCare Flexi: 100, 200, 300, 400 (excluding electrical fixtures), Gas Appliance Care and Gas Appliance Check in the UK, and Heating Protection Plus and Cooling Protection Plus in North America);
� one safety and maintenance inspection in every continuous two-year period of the agreement (for HomeCare 400 (electrical fixtures only), HomeCare Flexi: 400 (electrical fixtures only), Home Electrical Care, Home Electrical Care Flexi, Kitchen Appliance Care, Plumbing and Drains Care and Plumbing and Drains Care Flexi);
� no limit to the number of call-outs to carry out work included within the selected agreement; and � caps on certain maintenance and repair costs within fixed-fee contracts.

136
Centrica plc Annual Report and Accounts 2007
Notes to the Financial Statements continued
38. Fixed-fee service contracts continued
Revenue from fixed-fee service contracts is recognised on a straight-line basis over the life of the contract, reflecting the benefits receivable by the customer which span the life of the contract as a result of emergency maintenance potentially being required at any point within the contract term.
Cost of sales relates directly to the engineer workforce employed by Centrica within home services, the cost of which is accounted for over a 12-month period with adjustments made to reflect the seasonality of workload over a given year.
The costs of claims under the fixed-fee service contracts will be the costs of the engineer workforce employed by Centrica within home services. These costs are accounted for over a 12-month period with adjustments made to reflect the seasonality of workload over a given year. No further claims costs are accrued.
Weather conditions and the seasonality of maintenance can affect the number of call-outs, the cost per call-out and the nature of the fault. Centrica’s obligations under the terms of its home services fixed-fee service contracts are based on the following types of uncertain future events taking place within the contract period: � boiler, radiator, controls, hot water cylinder and pipe work breakdown; � gas fire, water heater, wall heater and gas cooker breakdown; � hot and cold water pipe, overflow, cold tank, toilet siphon and radiator valve breakdown; � washing machine, tumble drier, dishwasher, fridge, freezer, cooker, oven, hob and microwave oven breakdown; � fixed electrical wiring system, fuse box, light switch, wall socket, circuit breaker and transformer breakdown; � ventor motor, circuit board, direct drive motor and flame sensor breakdown; and � evaporator and condenser fan motor breakdown.
Centrica actively manages the risk exposure of these uncertain events by undertaking the following risk mitigation activities: � an initial service visit is performed for central heating care. If, at the initial visit, faults that cannot be rectified are identified, the fixed-
fee service contract will be cancelled and no further cover provided; � an annual or bi-annual safety and maintenance inspection is performed to ensure all issues are identified prior to them developing
into significant maintenance or breakdown issues; and � caps on certain maintenance and repair work are incorporated into fixed-fee service contracts to limit liability in areas considered
to be higher risk in terms of prevalence and cost to repair.
The Group considers the adequacy of estimated future cash flows under the contracts to meet expected future costs under the contracts. Any deficiency is charged immediately to the Income Statement.
Service requests are sensitive to the reliability of appliances as well as the impact of weather conditions. Each incremental 1% increase in service requests would impact profit and equity by approximately £7 million (2006: £7 million). The contracts are not exposed to any interest rate risk or significant credit risk and do not contain any embedded derivatives.
2007£m
2006£m
Total revenue 885 785Expenses relating to fixed-fee service contracts 727 683
Deferred income 34 37
The claims notified during the year were £269 million (2006: £258 million) and were exactly matched by expenses related to fixed-fee service contracts. All claims are settled immediately and in full.

137
Directors’ R
eport – Business R
eviewD
irectors’ Report – G
overnanceFinancial S
tatements
Shareholder Inform
ationCentrica plc Annual Report and Accounts 2007
39. Events after the balance sheet date
The Directors propose a final dividend of 9.65 pence per share (totalling £355 million) for the year ended 31 December 2007. Thedividend will be submitted for formal approval at the Annual General Meeting to be held on 12 May 2008. These Financial Statements do not reflect this dividend payable, which will be accounted for in shareholders’ equity as an appropriation of retained earnings in the year ending 31 December 2008.
On 14 January 2008 the Group acquired 88.4% of the outstanding common shares of publicly traded oil and gas company Rockyview Energy Inc. (Rockyview) for cash consideration of C$68 million (£34 million) and the remaining 11.6% of the outstanding common shares of Rockyview by 19 February 2008 in a series of transactions for additional cash consideration of C$9 million (£5 million). The fair values of assets and liabilities acquired and stated below are provisional because the Directors have not yet reached a final determination on all aspects of the fair value exercise.
IFRS carrying valuespre-acquisition
£m
Fairvalue
£m
Other intangible assets 7 10Property, plant and equipment 64 54Trade and other receivables 6 6Trade and other payables (24) (24)Provisions for other liabilities and charges (2) (6)Deferred tax liabilities (4) (1)Net assets acquired 47 39Cash consideration 39
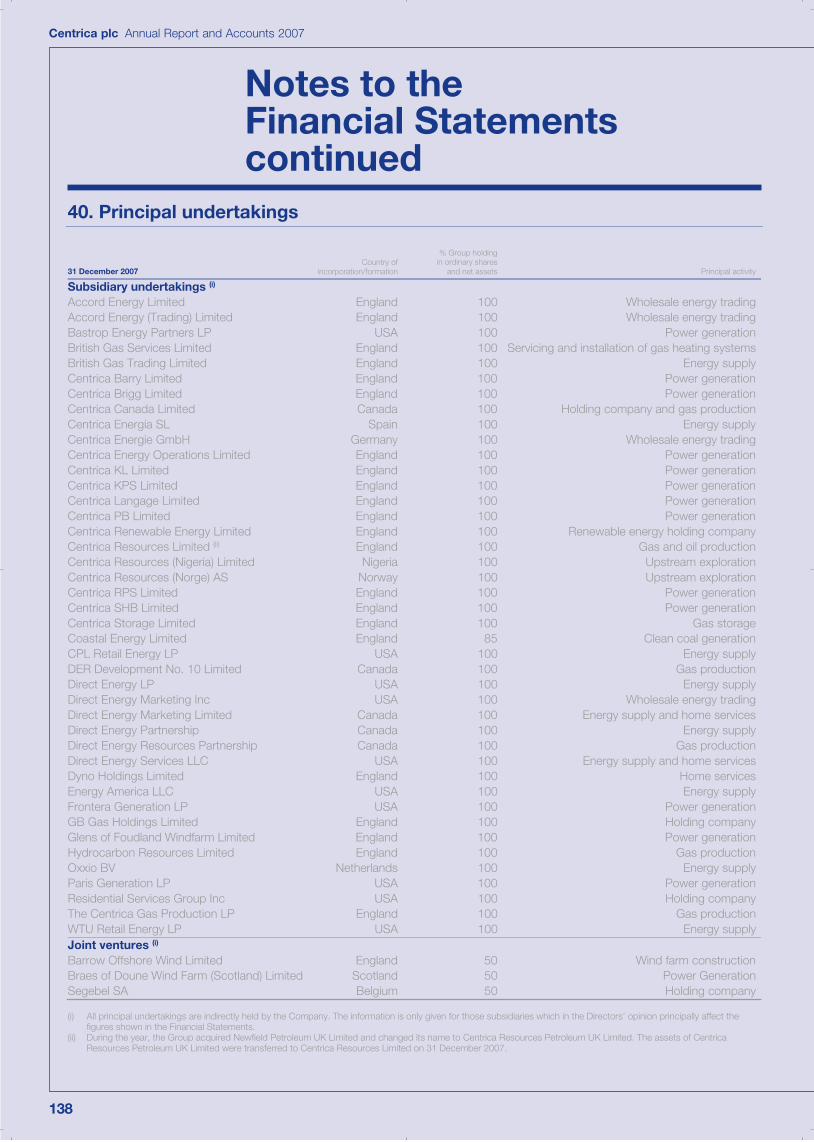
138
Centrica plc Annual Report and Accounts 2007
Notes to the Financial Statements continued
40. Principal undertakings
31 December 2007Country of
incorporation/formation
% Group holdingin ordinary shares
and net assets Principal activity
Subsidiary undertakings (i)
Accord Energy Limited England 100 Wholesale energy tradingAccord Energy (Trading) Limited England 100 Wholesale energy tradingBastrop Energy Partners LP USA 100 Power generationBritish Gas Services Limited England 100 Servicing and installation of gas heating systemsBritish Gas Trading Limited England 100 Energy supplyCentrica Barry Limited England 100 Power generationCentrica Brigg Limited England 100 Power generationCentrica Canada Limited Canada 100 Holding company and gas productionCentrica Energía SL Spain 100 Energy supplyCentrica Energie GmbH Germany 100 Wholesale energy tradingCentrica Energy Operations Limited England 100 Power generationCentrica KL Limited England 100 Power generationCentrica KPS Limited England 100 Power generationCentrica Langage Limited England 100 Power generationCentrica PB Limited England 100 Power generationCentrica Renewable Energy Limited England 100 Renewable energy holding companyCentrica Resources Limited (ii) England 100 Gas and oil productionCentrica Resources (Nigeria) Limited Nigeria 100 Upstream explorationCentrica Resources (Norge) AS Norway 100 Upstream explorationCentrica RPS Limited England 100 Power generationCentrica SHB Limited England 100 Power generationCentrica Storage Limited England 100 Gas storageCoastal Energy Limited England 85 Clean coal generationCPL Retail Energy LP USA 100 Energy supplyDER Development No. 10 Limited Canada 100 Gas productionDirect Energy LP USA 100 Energy supplyDirect Energy Marketing Inc USA 100 Wholesale energy tradingDirect Energy Marketing Limited Canada 100 Energy supply and home servicesDirect Energy Partnership Canada 100 Energy supplyDirect Energy Resources Partnership Canada 100 Gas productionDirect Energy Services LLC USA 100 Energy supply and home servicesDyno Holdings Limited England 100 Home servicesEnergy America LLC USA 100 Energy supplyFrontera Generation LP USA 100 Power generationGB Gas Holdings Limited England 100 Holding companyGlens of Foudland Windfarm Limited England 100 Power generationHydrocarbon Resources Limited England 100 Gas productionOxxio BV Netherlands 100 Energy supplyParis Generation LP USA 100 Power generationResidential Services Group Inc USA 100 Holding companyThe Centrica Gas Production LP England 100 Gas productionWTU Retail Energy LP USA 100 Energy supplyJoint ventures (i)
Barrow Offshore Wind Limited England 50 Wind farm constructionBraes of Doune Wind Farm (Scotland) Limited Scotland 50 Power GenerationSegebel SA Belgium 50 Holding company
(i) All principal undertakings are indirectly held by the Company. The information is only given for those subsidiaries which in the Directors’ opinion principally affect the figures shown in the Financial Statements.
(ii) During the year, the Group acquired Newfield Petroleum UK Limited and changed its name to Centrica Resources Petroleum UK Limited. The assets of CentricaResources Petroleum UK Limited were transferred to Centrica Resources Limited on 31 December 2007.
139
Directors’ R
eport – Business R
eviewD
irectors’ Report – G
overnanceFinancial S
tatements
Shareholder Inform
ationCentrica plc Annual Report and Accounts 2007
Independent Auditors’ Report to the Members of Centrica plc
Independent Auditors’ report to the members of Centrica plc We have audited the parent Company Financial Statementsof Centrica plc for the year ended 31 December 2007 which comprise the Balance Sheet and the related notes. These parentCompany Financial Statements have been prepared under the accounting policies set out therein. We have also audited the information in the Directors’ Remuneration Report that is described as having been audited.
We have reported separately on the Group Financial Statements of Centrica plc for the year ended 31 December 2007.
Respective responsibilities of Directors and Auditors The Directors’ responsibilities for preparing the Annual Report, the Directors’ Remuneration Report and the parent Company Financial Statements in accordance with applicable law and United Kingdom Accounting Standards (United Kingdom Generally Accepted Accounting Practice) are set out in the Statement of Directors’ Responsibilities.
Our responsibility is to audit the parent Company Financial Statements and the part of the Directors’ Remuneration Report to be audited in accordance with relevant legal and regulatory requirements and International Standards on Auditing (UK and Ireland). This report, including the opinion, has been prepared for and only for the Company’s members as a body in accordance with Section 235 of the Companies Act 1985 and for no other purpose. We do not, in giving this opinion, accept or assume responsibility for any other purpose or to any other person to whom this report is shown or into whose hands it may come save where expressly agreed by our prior consent in writing.
We report to you our opinion as to whether the parent Company Financial Statements give a true and fair view and whether the parent Company Financial Statements and the part of the Directors’ Remuneration Report to be audited have been properly prepared in accordance with the Companies Act 1985. We also report to you whether in our opinion the information given in the Directors’ Report (comprising the Directors’ Report – BusinessReview and the Directors’ Report – Governance) is consistent with the parent Company Financial Statements.
In addition, we report to you if, in our opinion, the Company has not kept proper accounting records, if we have not received allthe information and explanations we require for our audit, or ifinformation specified by law regarding Directors’ remunerationand other transactions is not disclosed.
We read other information contained in the Annual Report and consider whether it is consistent with the audited parentCompany Financial Statements. The other information comprises only the Chairman’s Statement, the Directors’ Report, the Gas and Liquids Reserves, Five Year Record and Shareholder Information. We consider the implications for our report if we become aware of any apparent misstatements or material inconsistencies with the parent Company Financial Statements. Our responsibilities do not extend to any other information.
Basis of audit opinion We conducted our audit in accordance with International Standards on Auditing (UK and Ireland) issued by the Auditing Practices Board. An audit includes examination, on a test basis, of evidence relevant to the amounts and disclosures in the parent Company Financial Statements and the part of the Directors’ Remuneration Report to be audited. It also includes an assessment of the significant estimates and judgements made by the Directors in the preparation of the parent Company Financial Statements, and of whether the accounting policies are appropriate to the Company’s circumstances, consistently applied and adequately disclosed.
We planned and performed our audit so as to obtain all the information and explanations which we considered necessary in order to provide us with sufficient evidence to give reasonable assurance that the parent Company Financial Statements and the part of the Directors’ Remuneration Report to be audited are free from material misstatement, whether caused by fraud or other irregularity or error. In forming our opinion we also evaluated the overall adequacy of the presentation of information in the parentCompany Financial Statements and the part of the Directors’ Remuneration Report to be audited.
Opinion In our opinion:� the parent Company Financial Statements give a true and fair
view, in accordance with United Kingdom Generally Accepted Accounting Practice, of the state of the Company’s affairs as at 31 December 2007;
� the parent Company Financial Statements and the part of the Directors’ Remuneration Report to be audited have been properly prepared in accordance with the Companies Act 1985; and
� the information given in the Directors’ Report is consistentwith the parent Company Financial Statements.
PricewaterhouseCoopers LLP Chartered Accountants and Registered Auditors London21 February 2008

140
Centrica plc Annual Report and Accounts 2007
Company Balance Sheet
31 December Notes 2007
£m 2006
£m
Fixed assetsTangible fixed assets iii 43 84Investments in subsidiary undertakings iv 2,080 2,057
2,123 2,141Current assetsDebtors (amounts falling due within one year) v 5,571 5,146Current asset investments vi 1,066 608Cash at bank and in hand 1 8
6,638 5,762Creditors (amounts falling due within one year)
Borrowings vii (167) (168)Other creditors viii (3,830) (2,710)
(3,997) (2,878)Net current assets 2,641 2,884Total assets less current liabilities 4,764 5,025Creditors (amounts falling due after more than one year)
Borrowings vii (1,378) (1,269)Provisions for liabilities and charges ix (13) (25)Net assets 3,373 3,731Capital and reserves – equity interests Called up share capital 29 227 226Share premium account x 685 657Capital redemption reserve x 16 16Other reserves x 2,445 2,832Shareholders’ funds xi 3,373 3,731
The Financial Statements on pages 140 to 146 were approved and authorised for issue by the Board of Directors on 21 February 2008and were signed on its behalf by:
Sam Laidlaw Nick LuffChief Executive Group Finance Director
The notes on pages 141 to 146 form part of these Financial Statements, along with notes 29 and 33 to the Group Financial Statements.

141
Directors’ R
eport – Business R
eviewD
irectors’ Report – G
overnanceFinancial S
tatements
Shareholder Inform
ationCentrica plc Annual Report and Accounts 2007
Notes to the Company Balance Sheet
i. Principal accounting policies of the Company
Accounting principlesThe Company Balance Sheet has been prepared in accordance with applicable UK accounting standards and under the historical costconvention and the Companies Act 1985.
Basis of preparation No profit and loss account is presented for the Company as permitted by Section 230(3) of the Companies Act 1985. The Company’sprofit after tax for the year ended 31 December 2007 was £5 million (2006: £1,939 million).
Employee share schemes The Group has a number of employee share schemes, detailed in the Directors’ Report – Corporate Responsibility Review on page 32, the Remuneration Report on pages 42 to 45 and in note 33, under which it makes equity-settled share-based payments to certain employees. Equity-settled share-based payments are measured at fair value at the date of grant (excluding the effect of non-market-based vesting conditions). The fair value determined at the grant date is expensed on a straight-line basis together with a corresponding increase in equity over the vesting period, based on the Group’s estimate of the number of awards that will vest and adjusted for the effect of non-market-based vesting conditions.
Fair value is measured using methods appropriate to each of the different schemes as follows:
LTIS: awards up to 2005 A Black-Scholes valuation augmented by a Monte Carlo simulation to predict the total shareholder return performance
LTIS: after 2005 EPS awards Market value on the date of grant LTIS: after 2005 TSR awards A Monte Carlo simulation to predict the total shareholder return performance Sharesave Black-Scholes ESOS Black-Scholes using an adjusted option life assumption to reflect the possibility
of early exercise SAS, SIP, DMSS and RSS Market value on the date of grant
Foreign currencies Transactions in foreign currencies are translated at the rate of exchange ruling at the date of the transaction. Monetary assets and liabilities denominated in foreign currencies are translated into pounds sterling at closing rates of exchange. Exchange differences on monetary assets and liabilities are taken to the profit and loss account.
Tangible fixed assetsTangible fixed assets are included in the Balance Sheet at cost, less accumulated depreciation and any provisions for impairment. Tangible fixed assets are depreciated on a straight-line basis at rates sufficient to write off the cost, less estimated residual values, of individual assets over their estimated useful lives at periods ranging from three to 20 years.
Leases Rentals under operating leases are charged to the profit and loss account on a straight-line basis.
Investments Fixed asset investments are held in the Balance Sheet at cost, less any provision for impairment as necessary. Current asset investments are stated at the lower of cost and net realisable value.
Pensions and other post-retirement benefits The Company’s employees participate in a number of the Group’s defined benefit pension schemes as described in note 34 to the Group Financial Statements. The Company is unable to identify its share of the underlying assets and liabilities in the schemes on a consistent and reasonable basis and therefore accounts for the schemes as if they were defined contribution schemes. The charge to the profit and loss account is equal to the contributions payable to the schemes in the accounting period. Details of the defined benefit schemes of the Group (accounted for in accordance with the Group’s accounting policies detailed in note 2 to the Group Financial Statements) can be found in note 34 to the Group Financial Statements.
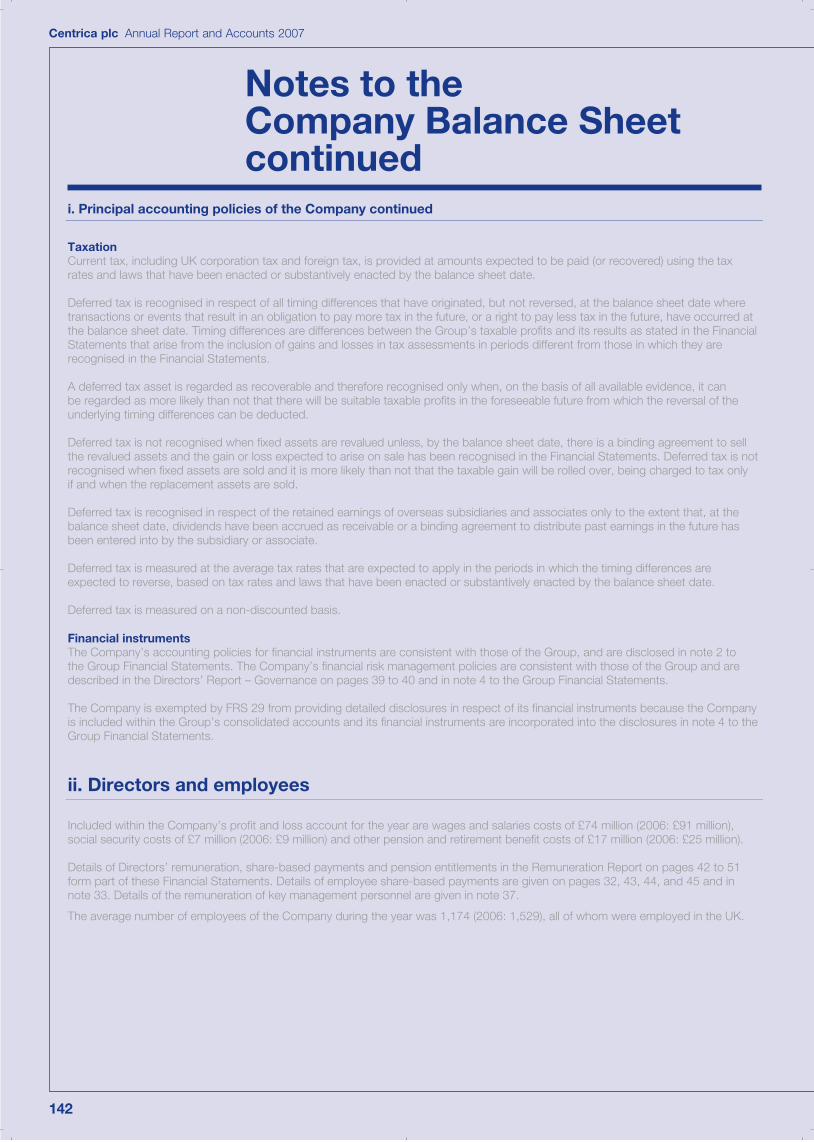
142
Centrica plc Annual Report and Accounts 2007
Notes to the Company Balance Sheet continued
i. Principal accounting policies of the Company continued
TaxationCurrent tax, including UK corporation tax and foreign tax, is provided at amounts expected to be paid (or recovered) using the tax rates and laws that have been enacted or substantively enacted by the balance sheet date.
Deferred tax is recognised in respect of all timing differences that have originated, but not reversed, at the balance sheet date where transactions or events that result in an obligation to pay more tax in the future, or a right to pay less tax in the future, have occurred at the balance sheet date. Timing differences are differences between the Group’s taxable profits and its results as stated in the Financial Statements that arise from the inclusion of gains and losses in tax assessments in periods different from those in which they are recognised in the Financial Statements.
A deferred tax asset is regarded as recoverable and therefore recognised only when, on the basis of all available evidence, it can be regarded as more likely than not that there will be suitable taxable profits in the foreseeable future from which the reversal of the underlying timing differences can be deducted.
Deferred tax is not recognised when fixed assets are revalued unless, by the balance sheet date, there is a binding agreement to sell the revalued assets and the gain or loss expected to arise on sale has been recognised in the Financial Statements. Deferred tax is not recognised when fixed assets are sold and it is more likely than not that the taxable gain will be rolled over, being charged to tax only if and when the replacement assets are sold.
Deferred tax is recognised in respect of the retained earnings of overseas subsidiaries and associates only to the extent that, at the balance sheet date, dividends have been accrued as receivable or a binding agreement to distribute past earnings in the future has been entered into by the subsidiary or associate.
Deferred tax is measured at the average tax rates that are expected to apply in the periods in which the timing differences areexpected to reverse, based on tax rates and laws that have been enacted or substantively enacted by the balance sheet date.
Deferred tax is measured on a non-discounted basis.
Financial instruments The Company’s accounting policies for financial instruments are consistent with those of the Group, and are disclosed in note 2 to the Group Financial Statements. The Company’s financial risk management policies are consistent with those of the Group and aredescribed in the Directors’ Report – Governance on pages 39 to 40 and in note 4 to the Group Financial Statements.
The Company is exempted by FRS 29 from providing detailed disclosures in respect of its financial instruments because the Companyis included within the Group’s consolidated accounts and its financial instruments are incorporated into the disclosures in note 4 to the Group Financial Statements.
ii. Directors and employees
Included within the Company’s profit and loss account for the year are wages and salaries costs of £74 million (2006: £91 million), social security costs of £7 million (2006: £9 million) and other pension and retirement benefit costs of £17 million (2006: £25 million).
Details of Directors’ remuneration, share-based payments and pension entitlements in the Remuneration Report on pages 42 to 51form part of these Financial Statements. Details of employee share-based payments are given on pages 32, 43, 44, and 45 and innote 33. Details of the remuneration of key management personnel are given in note 37.
The average number of employees of the Company during the year was 1,174 (2006: 1,529), all of whom were employed in the UK.

143
Directors’ R
eport – Business R
eviewD
irectors’ Report – G
overnanceFinancial S
tatements
Shareholder Inform
ationCentrica plc Annual Report and Accounts 2007
iii. Tangible fixed assets
Plant, equipment
and vehicles£m
Cost 1 January 2007 148Additions 13Disposals (82)31 December 2007 79Depreciation and amortisation 1 January 2007 64Charge for the year 13Disposals (41)31 December 2007 36Net book value 31 December 2007 4331 December 2006 84
iv. Investments in subsidiary undertakings
Investments insubsidiaries’
shares£m
Cost 1 January 2007 2,057Additions and disposals (i) 2331 December 2007 2,080
(i) Additions and disposals represent the net change in shares to be issued under employee share schemes in Group undertakings.
v. Debtors
Amounts falling due within one year 2007
£m 2006
£m
Amounts owed by Group undertakings 5,545 5,058Derivative financial instruments (i) 11 70Other debtors 4 7Prepayments and other accrued income 11 11
5,571 5,146
(i) Derivative financial instruments comprise foreign currency derivatives held for trading of £9 million (2006: £28 million), interest rate derivatives held for trading of£2 million (2006: £31 million) and foreign currency derivatives held for hedging of £nil (2006: £11 million). The fair value of these derivatives is equivalentto the carrying value.
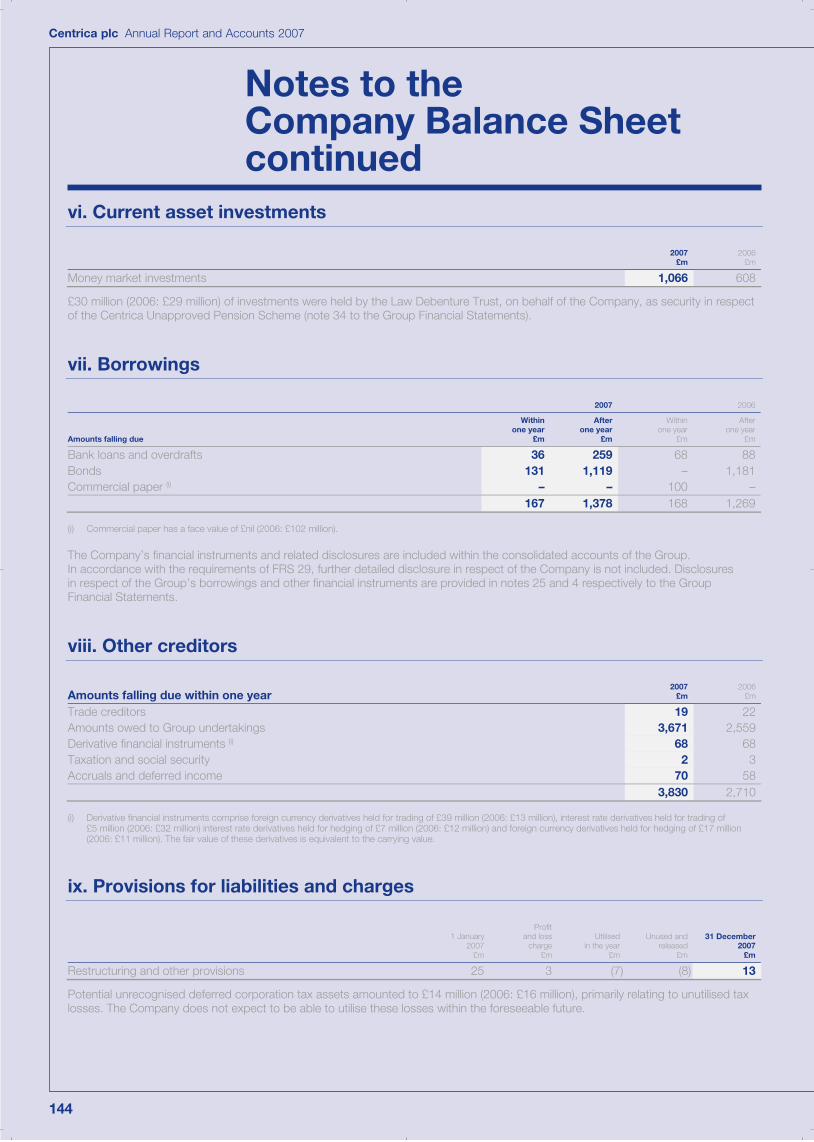
144
Centrica plc Annual Report and Accounts 2007
Notes to the Company Balance Sheet continued
vi. Current asset investments
2007£m
2006£m
Money market investments 1,066 608
£30 million (2006: £29 million) of investments were held by the Law Debenture Trust, on behalf of the Company, as security in respect of the Centrica Unapproved Pension Scheme (note 34 to the Group Financial Statements).
vii. Borrowings
2007 2006
Amounts falling due
Withinone year
£m
After one year
£m
Withinone year
£m
Afterone year
£m
Bank loans and overdrafts 36 259 68 88Bonds 131 1,119 – 1,181Commercial paper (i) – – 100 –
167 1,378 168 1,269
(i) Commercial paper has a face value of £nil (2006: £102 million).
The Company’s financial instruments and related disclosures are included within the consolidated accounts of the Group. In accordance with the requirements of FRS 29, further detailed disclosure in respect of the Company is not included. Disclosures in respect of the Group’s borrowings and other financial instruments are provided in notes 25 and 4 respectively to the Group Financial Statements.
viii. Other creditors
Amounts falling due within one year 2007
£m 2006
£m
Trade creditors 19 22Amounts owed to Group undertakings 3,671 2,559Derivative financial instruments (i) 68 68Taxation and social security 2 3Accruals and deferred income 70 58
3,830 2,710
(i) Derivative financial instruments comprise foreign currency derivatives held for trading of £39 million (2006: £13 million), interest rate derivatives held for trading of £5 million (2006: £32 million) interest rate derivatives held for hedging of £7 million (2006: £12 million) and foreign currency derivatives held for hedging of £17 million(2006: £11 million). The fair value of these derivatives is equivalent to the carrying value.
ix. Provisions for liabilities and charges
1 January2007
£m
Profitand loss
charge£m
Utilisedin the year
£m
Unused andreleased
£m
31 December 2007
£m
Restructuring and other provisions 25 3 (7) (8) 13
Potential unrecognised deferred corporation tax assets amounted to £14 million (2006: £16 million), primarily relating to unutilised tax losses. The Company does not expect to be able to utilise these losses within the foreseeable future.

145
Directors’ R
eport – Business R
eviewD
irectors’ Report – G
overnanceFinancial S
tatements
Shareholder Inform
ationCentrica plc Annual Report and Accounts 2007
ix. Provisions for liabilities and charges continued
Restructuring and other provisions principally represent estimated liabilities for contractual settlements, liabilities for redundancy costs associated with the restructuring announced in 2005 and 2006 and National Insurance in respect of employee share scheme liabilities. The National Insurance provision was based on a share price of 358.75 pence at 31 December 2007 (31 December 2006: 354.50 pence). The majority of the amounts are expected to be utilised between 2008 and 2010.
x. Reserves
Sharepremiumaccount
£m
Capitalredemption
reserve£m
Cash flowhedging reserve
£m
Profitand lossaccount
£mTotal
£m
1 January 2007 657 16 1 2,831 3,505Profit for the year (i) – – – 5 5Gains on revaluation of cash flow hedges – – 3 – 3Dividends – – – (417) (417)Employee share schemes:
Purchase of treasury shares – – – (2) (2)Value of services provided – – – 31 31Exercise of awards – – – (7) (7)
Share issue 28 – – – 2831 December 2007 685 16 4 2,441 3,146
(i) As permitted by Section 230(3) of the Companies Act 1985, no profit and loss account is presented. The Company’s profit for the year was £5 million (2006: £1,939 million) before dividends paid of £417 million (2006: £384 million). The Company’s profit includes dividends received from subsidiary undertakings of £nil (2006: £1,967 million).
The profit and loss account can be further analysed as follows:
Treasuryshares
£m
Share-based payments
reserve £m
Other£m
Profit and loss account
£m
1 January 2007 – 38 2,793 2,831Profit for the year (i) – – 5 5Dividends – – (417) (417)Employee share schemes:
Purchase of treasury shares (2) – – (2)Value of services provided – 31 – 31Exercise of awards – (18) 11 (7)
31 December 2007 (2) 51 2,392 2,441
(i) Includes a £1 million loss on re-measurement of interest rate derivatives and bonds designated as the hedged item (2006: £2 million gain) and a £2 million loss on re-measurement of foreign currency derivatives (2006: £17 million gain). Further details of the Company’s interest rate and foreign currency derivatives are included within the financial instrument disclosures in notes 4, 21 and 22 to the Group Financial Statements.
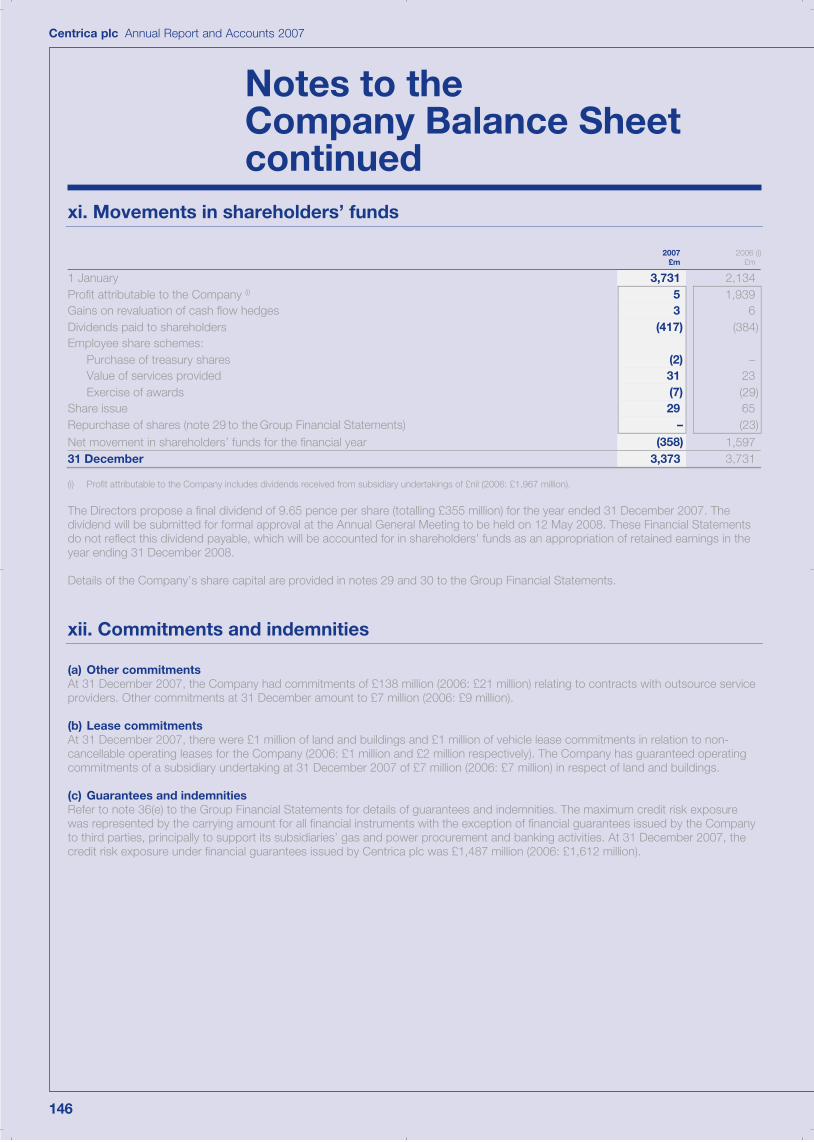
146
Centrica plc Annual Report and Accounts 2007
Notes to the Company Balance Sheet continued
xi. Movements in shareholders’ funds
2007£m
2006 (i)£m
1 January 3,731 2,134Profit attributable to the Company (i) 5 1,939Gains on revaluation of cash flow hedges 3 6Dividends paid to shareholders (417) (384)Employee share schemes:
Purchase of treasury shares (2) –Value of services provided 31 23Exercise of awards (7) (29)
Share issue 29 65Repurchase of shares (note 29 to the Group Financial Statements) – (23)Net movement in shareholders’ funds for the financial year (358) 1,59731 December 3,373 3,731
(i) Profit attributable to the Company includes dividends received from subsidiary undertakings of £nil (2006: £1,967 million).
The Directors propose a final dividend of 9.65 pence per share (totalling £355 million) for the year ended 31 December 2007. Thedividend will be submitted for formal approval at the Annual General Meeting to be held on 12 May 2008. These Financial Statements do not reflect this dividend payable, which will be accounted for in shareholders’ funds as an appropriation of retained earnings in the year ending 31 December 2008.
Details of the Company’s share capital are provided in notes 29 and 30 to the Group Financial Statements.
xii. Commitments and indemnities
(a) Other commitments At 31 December 2007, the Company had commitments of £138 million (2006: £21 million) relating to contracts with outsource service providers. Other commitments at 31 December amount to £7 million (2006: £9 million).
(b) Lease commitments At 31 December 2007, there were £1 million of land and buildings and £1 million of vehicle lease commitments in relation to non-cancellable operating leases for the Company (2006: £1 million and £2 million respectively). The Company has guaranteed operatingcommitments of a subsidiary undertaking at 31 December 2007 of £7 million (2006: £7 million) in respect of land and buildings.
(c) Guarantees and indemnities Refer to note 36(e) to the Group Financial Statements for details of guarantees and indemnities. The maximum credit risk exposure was represented by the carrying amount for all financial instruments with the exception of financial guarantees issued by the Companyto third parties, principally to support its subsidiaries’ gas and power procurement and banking activities. At 31 December 2007, the credit risk exposure under financial guarantees issued by Centrica plc was £1,487 million (2006: £1,612 million).

147
Directors’ R
eport – Business R
eviewD
irectors’ Report – G
overnanceFinancial S
tatements
Shareholder Inform
ationCentrica plc Annual Report and Accounts 2007
Gas and Liquids Reserves (unaudited)
The Group’s estimates of reserves of gas and liquids are reviewed as part of the half year and full year reporting process and updated accordingly. A number of factors affect the volumes of gas and liquids reserves, including the available reservoir data, commodity prices and future costs. Due to the inherent uncertainties and the limited nature of reservoir data, estimates of reserves are subject to change as additional information becomes available.
The Group discloses proven and probable gas and liquids reserves, representing the central estimate of future hydrocarbon recovery. Reserves for Centrica operated fields are estimated by in-house technical teams composed of geoscientists and reservoir engineers. Reserves for non-operated fields are estimated by the operator, but are subject to internal review and challenge.
As part of the internal control process related to reserves estimation, an audit of the reserves, including the application of the reserves definitions, is undertaken by an independent technical auditor. Reserves are estimated in accordance with a formal policy and procedure standard.
The Group has estimated proven and probable gas and liquids reserves in the UK and North America.
The principal fields in the UK are South Morecambe, North Morecambe, Statfjord and the Rough field associated with Centrica Storage. The UK reserves estimates are consistent with the guidelines and definitions of the Society of Petroleum Engineers andWorld Petroleum Congress. An annual reserves audit has been carried out by ERC Energy Resource Consultants Ltd.
The principal fields in North America are Medicine Hat, Entice and Bashaw, located in the province of Alberta, Canada. The NorthAmerican reserves estimates have been evaluated in accordance with the Canadian Oil and Gas Evaluation Handbook (COGEH) reserves definitions and are consistent with the guidelines and definitions of the Society of Petroleum Engineers and the WorldPetroleum Congress. The North American reserves evaluation has been carried out by Sproule Associates Limited.
Estimated net proven and probable reserves of gas (billion cubic feet) UK North
America Total
1 January 2007 1,519 272 1,791Revisions of previous estimates (i) 71 79 150Purchases of reserves in place (ii) 61 – 61Production (218) (29) (247)31 December 2007 1,433 322 1,755
Estimated net proven and probable reserves of liquids (million barrels) UK North
America Total
1 January 2007 42 3 45Revisions of previous estimates (4) – (4)Purchases of reserves in place 1 – 1Production (6) – (6)31 December 2007 33 3 36
(i) Includes revised net reserves additions in the UK for Morecambe and Bains and reductions from Maria and the Brae Area fields and primarily additions to the MedicineHat field in North America.
(ii) Reflects the 85% equity acquisition in the Grove Field.
Liquids reserves include oil, condensate and natural gas liquids.

148
Centrica plc Annual Report and Accounts 2007
Five Year Record
Results As reported under UK GAAP Restated to IFRS*
Year ended 31 December 2003
£m2004
£m2005
£m2006
£m2007
£m
Group revenue from continuing operations 16,817 11,325 13,407 16,403 16,342Operating profit from continuing operations before goodwill amortisation, exceptional items, and certain re-measurementsincluding share of joint ventures and associates:
British Gas Residential 136 242 90 95 571British Gas Services 70 72 111 102 151British Gas Business 51 68 77 87 120Centrica Energy 561 773 903 686 663
Centrica Storage 40 69 154 228 240 Direct Energy 100 99 147 173 187 European Energy – 5 (9) 7 17 Other operations – 1 2 14 – 958 1,329 1,475 1,392 1,949Operating profit/(loss) from discontinued operations, net of tax:
The Consumers’ Waterheater Income Fund (i) 30 33 38 50 39OneTel (ii) 4 3 12 (11) –The AA (iii) 93 80 – – –Goldfish Bank (iv) (27) – – – –
Exceptional items and certain re-measurements (net of tax) (53) 833 340 (862) 383Goodwill amortisation (net of tax credit) (161) – – – –Profit/(loss) attributable to the Group 500 1,591 1,012 (155) 1,505
Pence Pence Pence Pence Pence
Earnings/(loss) per ordinary share 11.8 38.0 27.4 (4.3) 41.0Adjusted earnings/(loss) per ordinary share (v) 16.8 18.1 18.2 19.4 30.6
Assets and liabilities As reported under UK GAAP Restated to IFRS*
At 31 December 2003
£m2004
£m2005
£m2006
£m2007
£m
Intangible assets including goodwill 1,614 1,567 1,739 1,501 1,539Other non-current assets 2,827 3,791 4,490 4,171 4,518Net current assets/(liabilities) 241 155 666 (112) 381Long-term liabilities and provisions (1,945) (3,205) (4,453) (3,918) (3,056)Net assets 2,737 2,308 2,442 1,642 3,382Debt, net of cash and money market investments:
Net (debt)/cash (excluding Goldfish Bank and non-recourse debt) 163 (508) (1,060) (1,527) (795)The Consumers’ Waterheater Income Fund (non-recourse) debt (216) (217) (532) (483) –
(53) (725) (1,592) (2,010) (795)
* The 2004 comparatives have been restated on transition to IFRS.
On implementation in 2004 of UITF 38, values for 2003 were restated for the change in accounting policy. (i) Discontinued in 2007.(ii) Discontinued in 2005.(iii) Discontinued in 2004.(iv) Discontinued in 2003.(v) Adjusted earnings per share exclude goodwill amortisation and exceptional charges under UK GAAP, and certain re-measurements and exceptional items under IFRS.
Cash flows As reported under UK GAAP Restated to IFRS*
Year ended 31 December 2003
£m2004
£m2005
£m2006
£m2007
£m
Cash flow from operating activities before exceptional payments 992 1,294 1,192 850 2,447Exceptional payments – (25) (48) (113) (90)Net cash flow from investing activities – 497 (529) (720) (964)Disposals and acquisitions 292 – – – –Cash flow before financing 652 1,766 615 17 1,393

149
Directors’ R
eport – Business R
eviewD
irectors’ Report – G
overnanceFinancial S
tatements
149 Shareholder InformationIBC Index
Shareholder Inform
ation

Electronic communications and the Centrica websiteAt the 2007 Annual General Meeting (AGM), the Companypassed a resolution allowing the Centrica website to beused as the primary means of communication with itsshareholders. A shareholder consultation card was sent withthe proxy forms to shareholders in March 2007 enabling themto choose to either:3 receive shareholder documentation by website
communication by providing an email address; or3 continue to receive shareholder documentation in
hard copy by returning the personalised card attachedto the AGM proxy form.
If the completed card was not returned, shareholders weredeemed in accordance with the Companies Act 2006 to haveagreed to receive shareholder documentation via the Centricawebsite. These shareholders, and those who positivelyelected for website communication, were sent, immediatelyprior to the publication date, a written notification that the2007 shareholder documents are available to view on theCentrica website at www.centrica.com/reports2007.
The new electronic arrangements provide shareholderswith the opportunity to access information in a timely mannerand help Centrica to reduce both its costs and its impact onthe environment.
The Centrica website at www.centrica.com also providesnews and details of the Company’s activities with links toits business sites.
150
Shareholder Information
Centrica plc Annual Report and Accounts 2007
The investors’ section of the website contains up-to-dateinformation for shareholders including:3 comprehensive share price information;3 financial results;3 dividend payment dates and amounts; and3 access to shareholder documents such as the Annual Report
and Accounts, and Annual Review and Summary FinancialStatements.
Shareholders who register to receive shareholderdocumentation from Centrica electronically can:3 view the Annual Report and Accounts on the day it
is published;3 receive an email alert when shareholder documents
are available;3 cast their AGM vote electronically; and3 manage their shareholding quickly and securely online.
Visit www.centrica.com/shareholders for more informationand to register for electronic shareholder communication.
Centrica shareholder helplineCentrica’s shareholder register is maintained by Equiniti,which is responsible for making dividend payments andupdating the register.
If you have a query on the following:3 transfer of shares;3 change of name or address;3 lost share certificate;3 lost or out-of-date dividend cheques and payment of
dividends into a bank or building society account; or3 death of the registered holder of shares or any other
query relating to your Centrica shareholding, pleasecontact Equiniti:
Telephone: 0871 384 2985*Text phone: 0871 384 2255*
Write to: Equiniti, Aspect House, Spencer Road, Lancing,West Sussex BN99 6DA
Email: [email protected]
*Calls to these numbers are charged at 8 pence per minute from a BT landline.Other telephony providers’ costs may vary.
A range of frequently asked questions is also availableat www.centrica.com/shareholders.

151
Directors’ R
eport – Business R
eviewD
irectors’ Report – G
overnanceFinancial S
tatements
Shareholder Inform
ationCentrica plc Annual Report and Accounts 2007
The Centrica FlexiShare service
FlexiShare is a ‘corporate nominee’, sponsored by Centricaand administered by Equiniti Financial Services Limited. It isa convenient way to manage your Centrica shares without theneed for a share certificate. Your share account details will beheld on a separate register and you will receive an annualconfirmation statement.
By transferring your shares into FlexiShare you will benefit from:3 low-cost share dealing facilities provided by a panel of
independent share dealing providers;3 quicker settlement periods;3 no certificates to lose; and3 a dividend reinvestment plan – your cash dividend can be
used to buy more Centrica shares (for a small dealing charge)which are then credited to your FlexiShare account.
Participants will have the same rights to attend and vote at generalmeetings as all other shareholders. There is no charge for holdingyour shares in FlexiShare, nor for transferring in or out at any time.
For further details about FlexiShare, please call theCentrica shareholder helpline on 0871 384 2985* or visitwww.centrica.com/flexishare.
Direct dividend paymentsDividends can be paid automatically into your bank or buildingsociety account. This service has a number of benefits:3 there is no chance of the dividend cheque going missing
in the post;3 the dividend payment is received more quickly as the cash
is paid directly into the account on the payment date withoutthe need to pay in the cheque and wait for it to clear; and
3 a single consolidated tax voucher is issued at the end of eachtax year, in March, in time for your self-assessment tax return.
Direct dividend payment also helps Centrica improve its efficiencyby reducing postage and cheque clearance costs. To registerfor this service, please call the Centrica shareholder helplineon 0871 384 2985* to request a direct dividend payment form, ordownload it from our website at www.centrica.com/shareholders.
Overseas dividend payments A service has been established to provide shareholders in over30 countries with the opportunity to receive Centrica dividendsin their local currency. For a small fixed fee, shareholders can havetheir dividends automatically converted from sterling and paidinto their bank account, normally within five working days of thedividend payment date. For further details, please contact theCentrica overseas shareholder helpline on +44 121 415 7061.
Buying and selling shares in the UKIf you wish to buy or sell certificated Centrica shares, you willneed to use a stockbroker or high street bank which trades onthe London Stock Exchange. There are also many telephone andonline services available. If you are selling, you will need to presentyour share certificate at the time of sale. FlexiShare (details above)offers a year-round, low-cost dealing service to its participants.
Share price information As well as using the Centrica website to view details of the currentand historical Centrica share price, shareholders can find share priceslisted in most national newspapers. Ceefax and Teletext pagesalso display share prices that are updated regularly throughoutthe trading day. For a real-time buying or selling price, you shouldcontact a stockbroker.
American Depositary Receipts Centrica has a Level 1 American Depositary Receipt (ADR)programme. The ADRs, each of which is equivalent to tenordinary Centrica shares, trade under the symbol CPYYY.
For enquiries, please contact:ADR DepositaryThe Bank of New York MellonInvestor RelationsPO Box 11258, Church Street StationNew York NY 10286-1258email: [email protected] via www.stockbny.com
Telephone: 1 888 BNY ADRs in the US or 001 201 680 6825from outside the US.Or website address: www.adrbny.com
ShareGift ShareGift (registered charity 1052686) is an independent charitywhich provides a free service for shareholders wishing to disposecharitably of small parcels of shares, which would cost more tosell than they are worth. There are no capital gains tax implications(i.e. no gain or loss) on gifts of shares to charity and it is alsopossible to obtain income tax relief. Further information can beobtained at www.sharegift.org or from the Centrica shareholderhelpline on 0871 384 2985*.

152
Centrica plc Annual Report and Accounts 2007
Useful historical information DemergerThe shares of Centrica plc were traded on the London StockExchange for the first time on 17 February 1997, the date ofdemerger from British Gas plc. Shares were acquired in Centricaplc on the basis of one Centrica share for every British Gas shareheld at demerger. The split between the post-demerger Centricaand British Gas shares was in the proportion Centrica 27.053%and British Gas 72.947%.
Shares in Centrica plc acquired on demerger are treated ashaving a base cost for capital gains tax purposes (calculatedin accordance with taxation legislation) of 64.25 pence each.
Share capital consolidationsThe share capital of Centrica plc has been consolidated on twooccasions:3 on 10 May 1999, the ordinary share capital was consolidated
on the basis of nine new ordinary shares of 55⁄9 pence forevery ten ordinary shares of 5 pence held on 7 May 1999.The consolidation was linked to the payment of a specialdividend of 12 pence per share on 23 June 1999; and
3 on 25 October 2004, the ordinary share capital was consolidatedon the basis of nine new ordinary shares of 614⁄81 pence forevery ten ordinary shares of 55⁄9 pence held on 22 October2004. The consolidation was linked to the payment of a specialdividend of 25 pence per share on 17 November 2004.
Financial calendar
23 April 2008 Ex-dividend date for 2007 final dividend
25 April 2008 Record date for 2007 final dividend
12 May 2008 AGM, Queen Elizabeth II Conference Centre, London SW1
11 June 2008 Payment date for 2007 final dividend
31 July 2008 Announcement date for 2008 interim results
12 November 2008 Payment date for proposed 2008 interim dividend
Analysis of shareholders as at 31 December 2007
Distribution of shares by the type of shareholder Holdings Shares
Nominees and institutional investors 9,850 3,349,757,280
Individuals (certificated) 777,310 330,223,031
Total 787,160 3,679,980,311
Size of shareholding Number of holdings Shares
1–500 619,418 142,900,643501–1,000 102,928 72,082,1151,001–5,000 59,564 101,732,1775,001–10,000 3,124 21,297,29310,001– 50,000 1,065 19,826,15350,001–100,000 196 14,622,445100,001– 1,000,000 522 198,928,3761,000,001 and above 343 3,108,591,109
Total 787,160 3,679,980,311
As at 31 December 2007 there were 78,613 participants in the Centrica FlexiShare service, with an aggregate shareholdingof 92,235,615 shares, registered in the name of Lloyds TSB Registrars Corporate Nominee Limited.
Shareholder Informationcontinued
AccessibilityIf you would like this Annual Report in an alternative format, such as large print, Braille or audio, you can request these in the following ways:Telephone 0800 917 6564 Textphone 18001 0800 917 6564Please note that these numbers should be used to request copies of alternative formats only. For general shareholder enquiries, please use the shareholder helpline 0871 384 2985*.
*Calls to this number are charged at 8 pence per minute from a BT landline. Other providers’ telephony costs may vary.

Centrica plc Annual Report and Accounts 2007
Accounting policies 23, 58-68, 141-142 Acquisitions and disposals 41, 130-132 Auditors
re-appointment 41 remuneration 81reports to the shareholders of Centrica plc 52, 139
Balance SheetGroup 55Company 140-146
Bank overdrafts and loans 104-105 Board of Directors 6, 34-35 British Gas Business 2, 6, 12, 13, 17British Gas New Energy 2, 8, 12, 13, 30 British Gas Residential 2, 9, 16-17 British Gas Services 2, 6, 12, 17-18Business Principles 28 Carbon intensity 15, 29, 30 Cash and cash equivalents 65, 102Cash Flow Statement 57, 117Centrica Energy 3, 11, 18-19Centrica Storage 3, 20 Chairman’s Statement 5-6Charitable and political donations 29, 32Chief Executive’s Review 8-13 Climate change 13, 26, 29, 30 Commitments and contingencies 133-134 Committees 34-35, 38-39 Communities 29, 32Competition 25, 29
Europe 3, 8, 22, 26North America 12, 21, 26
Corporate Governance 36-41 Corporate Responsibility 28-32 Cost of sales 61 Costs of continuing operations 81 Creditor payment policy 41Customers
net promoter score 15numbers 9, 16, 17, 18, 21, 22 service 9, 10, 12, 13, 16-18, 21, 26, 31
Deferred corporation tax liabilities and assets 106Direct Energy 3, 12, 20-21 Directors
biographies 34-35 directors’ indemnities 37 emoluments 43, 47, 83 pensions 45, 51 re-election 37 remuneration policy 42-46responsibility statement 40 service contracts 45-46share interests 43-45, 48-50 training 37
Disclosure of information to auditors 40 Dividend 4, 5, 14, 23, 86, 151Dyno 2, 17-18Earnings 23Earnings per share 4, 14, 23, 87-88 Electricity generation 8, 11, 13, 15, 18-19, 21, 22, 29, 30 Electronic communications 1, 6, 28, 39, 150 Employees
average number during the year 32, 83 costs 83 policies 28, 32
Europe 3, 8, 12, 13, 22, 26, 29 Events after the Balance Sheet date 137
Exceptional items and certain re-measurements 24, 82Executive team 34-35Financial calendar 152 Financial instruments
derivative 98-101fair value 109-111hedge accounting 101-102
Financial Review 4, 23-24 Financial Statements 53-57 Fixed fee service contracts 135-136 Five-year record 148 Fuel poverty 31 Gas and liquids reserves 147 Gas exploration 5, 8, 11, 13, 18Gas production 3, 8, 11, 18-19, 26 Goodwill and other intangible assets 68, 88-92 Health and safety 26, 29, 31Income Statement 54 Interest 23, 84 Interests in joint ventures and associates 95-96 Internal control 39-40 International Financial Reporting Standards 4 Inventories 96Liquefied natural gas (LNG) 8, 11, 13, 19, 26Minority interests 116 Pensions 126-129 Principal undertakings 138 Property, plant and equipment 93-94 Provisions 107-108 Related party transactions 41, 134-135 Renewables 3, 8, 11, 18-19, 21, 26, 29, 30 Reserves 113-116, 145 Risk Management 25-27, 28, 39-40, 69-74 Segmental analysis 75-80 Shares
analysis of shareholders 152 called up share capital 112 material shareholdings 41 prices 24total shareholder return 14, 23, 45
Shareholder information 146, 150-152 Share schemes
all-employee 32, 118-125 Executive 43-45
Share based payments 118-125Statement of recognised income and expense 56 Taxation 23, 85-86, 142Trade payables 103 Trade receivables 96-98 Vision 1Vulnerable customers 29, 31
This report has been printed on Greencoat Plus Velvet, which is made from80% recycled post-consumer fibre, 10% Total Chlorine Free virgin fibre and10% Elemental Chlorine Free fibre. This paper has been independentlycertified according to the rules of the Forest Stewardship Council (FSC).
Designed and produced by 35 Communications LtdPhotography by Igor Emmerich, Charlie Fawell, David Hares and Zed NelsonPrinted by St Ives Westerham Press Ltd, ISO14001, FSC certified and CarbonNeutral®
Index
Directors’ R
eport – Business R
eviewD
irectors’ Report – G
overnanceFinancial S
tatements
Shareholder Inform
ation

Centrica plc Company registered in England and Wales no. 3033654Registered office: Millstream, Maidenhead Road, Windsor, Berkshire SL4 5GDwww.centrica.com