century ply 2010 21-7-10 006:century · pdf filesri brij bhushan agarwal director sri manindra...
TRANSCRIPT
Contents
Corporate Information 2
Notice of Annual General Meeting 3
Directors’ Report to the Shareholders 6
Report on Corporate Governance 14
Auditors’ Certificate on Corporate Governance 26
Management Discussion & Analysis Report 27
Auditors’ Report 33
Balance Sheet 36
Profit & Loss Account 37
Cash Flow Statement 38
Schedules A-M forming part of Balance Sheet 39
Schedules N-U forming part of Profit & Loss Account 46
Notes on Balance Sheet and Profit & Loss Account 48
Balance Sheet Abstract and Company’s Business Profile 65
Statement Pursuant to Section 212 of the Companies Act, 1956 66
Auditors’ Report on Consolidated Financial Statement 67
Consolidated Balance Sheet 68
Consolidated Profit & Loss Account 69
Consolidated Cash Flow Statement 70
Schedules A-N forming part of Consolidated Balance Sheet 71
Schedules O-V forming part of Consolidated Profit & Loss Account 78
Notes on Consolidated Balance Sheet and Profit & Loss Account 80
2
Corporate Information
BOARD OF DIRECTORS
Sri Satya Brata Ganguly ChairmanSri Hari Prasad Agarwal Vice ChairmanSri Sajjan Bhajanka Managing DirectorSri Sanjay Agarwal Jt. Managing DirectorSri Prem Kumar Bhajanka Jt. Managing DirectorSri Vishnu Khemani Jt. Managing DirectorSri Ajay Baldawa Executive DirectorSri Sajan Kumar Bansal DirectorSri Brij Bhushan Agarwal DirectorSri Manindra Nath Banerjee DirectorSri Mangi Lal Jain DirectorMs. Plistina Dkhar Director
CFO & COMPANY SECRETARY
Sri Arun Kumar Julasaria
AUDITORS
S. R. Batliboi & Co.
Chartered Accountants
22, Camac Street
Block ‘C’, 3rd Floor
Kolkata-700 016
BANKERS
State Bank of India
Commercial Branch
N. S. Road, Kolkata-700 001
UCO Bank
Flagship Corporate Centre
N. S. Road, Kolkata-700 001
Oriental Bank of Commerce
Park Street Branch
Park Street, Kolkata-700 016
Corporation Bank
Brabourne Road Branch
Brabourne Road, Kolkata - 700 001
REGISTRARS & SHARE TRANSFER AGENTS
Maheshwari Datamatics Pvt. Ltd.
6, Mangoe Lane, 2nd Floor
Kolkata-700 001
REGISTERED OFFICE
6, Lyons Range
Kolkata 700 001
� 033 39403950
WORKS
Plywood, Veneer and Laminate Units
Diamond Harbour Road
Kanchowki, Bishnupur
Dist. : 24 Parganas (S)
West Bengal
Rambha Road
Taraori
Haryana
Ferro Alloy & Power Units
EPIP Area, Byrnihat
Dist. Ri-Bhoi
Meghalaya
Container Freight Station
Block B & C, Sonai Khidderpore
Kolkata-700 088
Hide Road, Brace Bridge, Khidderpore
Kolkata-700 088
Mirza Palasbari Road
Kamrup
Assam
Chinnappolapuram
Gummidipoondi
Tamil Nadu
3
NOTICE OF ANNUAL GENERAL MEETING
NOTICE is hereby given that the Twenty-Ninth Annual General Meeting of the Members of Century
Plyboards (India) Limited will be held at Indian Chamber of Commerce Auditorium, 10th Floor, 4,India
Exchange Place, Kolkata- 700001 on Friday, 27th day of August, 2010 at 11.00 A.M., to transact the
following business:
ORDINARY BUSINESS
1. To receive, consider and adopt the audited Balance Sheet as at 31st March, 2010 and Profit and Loss
Account for the year ended on that date together with the Reports of Directors and Auditors thereon.
2. To confirm declaration and payment of Interim Dividend and to declare Final Dividend for the year ended
31st March, 2010.
3. To appoint a Director in place of Sri Satya Brata Ganguly, who retires by rotation and, being eligible,
offers himself for re-appointment.
4. To appoint a Director in place of Sri Vishnu Khemani, who retires by rotation and, being eligible, offers
himself for re-appointment.
5. To appoint a Director in place of Sri Sajan Kumar Bansal, who retires by rotation and, being eligible,
offers himself for re-appointment.
6. To appoint Auditors of the Company to hold office from the conclusion of this Meeting until the conclusion
of the next Annual General Meeting of the Company and to fix their remuneration, and for the purpose,
to pass the following Resolution as an Ordinary Resolution:
“RESOLVED that pursuant to provisions of Section 224 and other applicable provisions, if any, of the
Companies Act, 1956, M/s. S. R. Batliboi & Co., Chartered Accountants, Kolkata be and are hereby
re-appointed as the Statutory Auditors of the Company to hold such office from the conclusion of this
Annual General Meeting until conclusion of next Annual General Meeting of the Company, on such
remuneration as may be determined by the Board of Directors of the Company.”
7. To consider and, if thought fit, to pass with or without modification/s the following Resolution as an
Ordinary Resolution relating to appointment of Branch Auditors of the Company :
“RESOLVED that pursuant to the provisions of Section 228 and other applicable provisions, if any, of
the Companies Act, 1956, the Board of Directors of the Company be and are hereby authorised to appoint
Auditors in respect of its branch offices in consultation with Company’s Statutory Auditors, to hold office
from the conclusion of this Annual General Meeting until conclusion of next Annual General Meeting of
the Company and that the Board of Directors of the Company is hereby authorised to fix their remuneration
for the said period.”
By Order of the Board
For Century Plyboards (India) Ltd.
Arun Kumar Julasaria
Chief Financial Officer and Company Secretary
Registered Office
6, Lyons Range
Kolkata- 700 001
21st July, 2010
NOTES
1. A MEMBER ENTITLED TO ATTEND AND VOTE AT THE MEETING IS ENTITLED TO
APPOINT ONE OR MORE PROXIES TO ATTEND AND VOTE (ONLY ON POLL) INSTEAD
OF HIMSELF AND THE PROXY NEED NOT BE A MEMBER OF THE COMPANY. THE DULY
COMPLETED AND SIGNED PROXY FORM SHOULD REACH THE REGISTERED OFFICE
OF THE COMPANY, NOT LESS THAN FORTY EIGHT HOURS BEFORE THE SCHEDULED
TIME OF THE ANNUAL GENERAL MEETING.
2. Corporate Members are requested to send to the Company a duly certified copy of the Board Resolution,
pursuant to Section 187 of the Companies Act, 1956, authorising their representative to attend and vote
at the Annual General Meeting.
3. Members holding shares in physical form are requested to notify change in address, bank mandate and bank
particulars for printing on the dividend warrants, if any, under their signatures to Maheshwari Datamatics Pvt.
Ltd., 6 Mangoe Lane, Kolkata – 700 001, the Registrar and Share Transfer Agent, quoting Folio Nos. Members
holding shares in electronic form may update such details with their respective Depository Participants.
4. The Board of Directors at its meeting held on 21st October, 2009 declared Interim Dividend @ 75 paise
per equity share which was duly paid to the members as per record date announced.
5. The Dividend on preference shares shall be paid at coupon rate.
6. The Board of Directors at their meeting held on 28th May, 2010 has recommended payment of final dividend
@ 25 paise per equity share. The dividend so recommended by the Board, if approved by the members at the
ensuing Annual General Meeting, shall be paid within statutory time limit to those members (a) whose names
appear as beneficial owners at the end of the business hours on Friday, 20th August, 2010 in the list of beneficial
owners to be provided by NSDL and CDSL, in respect of shares held in electronic (demat) form and (b) whose
names appear in the Register of Members of the Company on Friday, 27th August, 2010, after giving effect
to valid transfer requests received on or before Friday, 20th August, 2010.
7. The share transfer books of the Company will remain closed from 21st August, 2010 to 27th August, 2010
(both days inclusive).
8. Members seeking any information regarding accounts should write to the Company at least seven days
before the date of the meeting so as to enable the management to keep the information ready.
9. All documents meant for inspection and referred in the accompanying Annual Report are open for
inspection at the Registered Office of the Company during office hours between 11.00 am to 1.00 pm on
all working days till the date of Annual General Meeting.
10. Members are required to bring their admission slip along-with copy of the Annual Report at the Annual
General Meeting.
11. Pursuant to Section 205A of the Companies Act, 1956, dividends, which remain unpaid or unclaimed for
a period of seven years from the date of transfer to the Unpaid Dividend Account are required to be
transferred to the Investor Education and Protection Fund of the Central Government. Section 205C of the
Act, declares that no claims shall lie against the Fund or Company in respect of individual amounts which
were unclaimed and unpaid for seven years as aforesaid and transferred to the Fund. Shareholders who
have not encashed/received dividend warrants relating to financial year ended on 31st March, 2003 or for
subsequent years may approach the Company for payment thereof.
12. Relevant information, pursuant to Clause 49 of the Listing Agreement, in respect of Directors who are retiring
by rotation and are eligible for re-appointment at the ensuing Annual General Meeting is given below:
4
Sri Satya Brata Ganguly
Sri Satya Brata Ganguly, 68 years, is a Graduate of Chemical Engineering, Fellow Member of Plastics
& Rubber (London), Fellow Member of Institute of Chemical Engineers and also a Fellow Member
of the Institute of Chemicals. He is having an experience of over 46 years in various industrial fields.
Presently, he is the Chairman of Peerless Funds Management Co. Ltd. He is also a Director of West
Bengal Industrial Development Corporation Ltd., The Calcutta Stock Exchange Association Ltd.,
Sundarban Infrastructure Development Corporation Ltd., Emami Ltd. and Paharpur Cooling Towers
Ltd. He is also actively associated with a number of educational, technical and research Institutes. Sri
Ganguly carries with him significant professional expertise and rich business experience. Sri Ganguly
is presently the Non Executive Independent Chairman of the Company and does not hold any share in
the Company.
Sri Vishnu Khemani
Sri Vishnu Khemani, 58 years, is a science graduate. He is having an experience of over 32 years in
plywood industry. Sri Khemani was a Director of erstwhile Sharon Veneers Pvt. Ltd. and Sharon Wood
Industries Pvt. Ltd. which amalgamated with the Company. He is also a Director of Sharon International
Services Pvt. Ltd. Sri Khemani is presently Joint Managing Director of the Company and holds 7704130
equity shares and 500000 preference shares in the Company.
Sri Sajan Kumar Bansal
Sri Sajan Kumar Bansal, 52 years, is a commerce graduate. He is having an experience of over 27
years in steel and engineering industry. He is Managing Director of Skipper Ltd. and also Director of
Bansal TMT Steels Ltd., Ventex Trade Pvt. Ltd., Cement Manufacturing Co. Ltd., Skipper Tele-Link
Ltd., Suviksit Investment Ltd. and Star Cement Meghalaya Ltd. He is holding 4924980 equity shares
in the Company.
13 The Company, at present has 23 marketing branches and five manufacturing locations spread all over the
country. Further manufacturing locations/ branches may have to be established from time to time. In view
of such a large network of locations it is recommended to authorise the Board of Directors to appoint
Branch Auditors in consultation with Statutory Auditors of the Company.
By order of the Board
For Century Plyboards (India) Ltd.
Arun Kumar Julasaria
Chief Financial Officer and Company Secretary
Registered Office
6, Lyons Range
Kolkata- 700 001
21st July, 2010
5
6
Dear Shareholders,
Your Directors have great pleasure in presenting the 29th Annual Report together with the audited Balance
Sheet as at 31st March, 2010 and Profit & Loss Account for the year ended on that date.
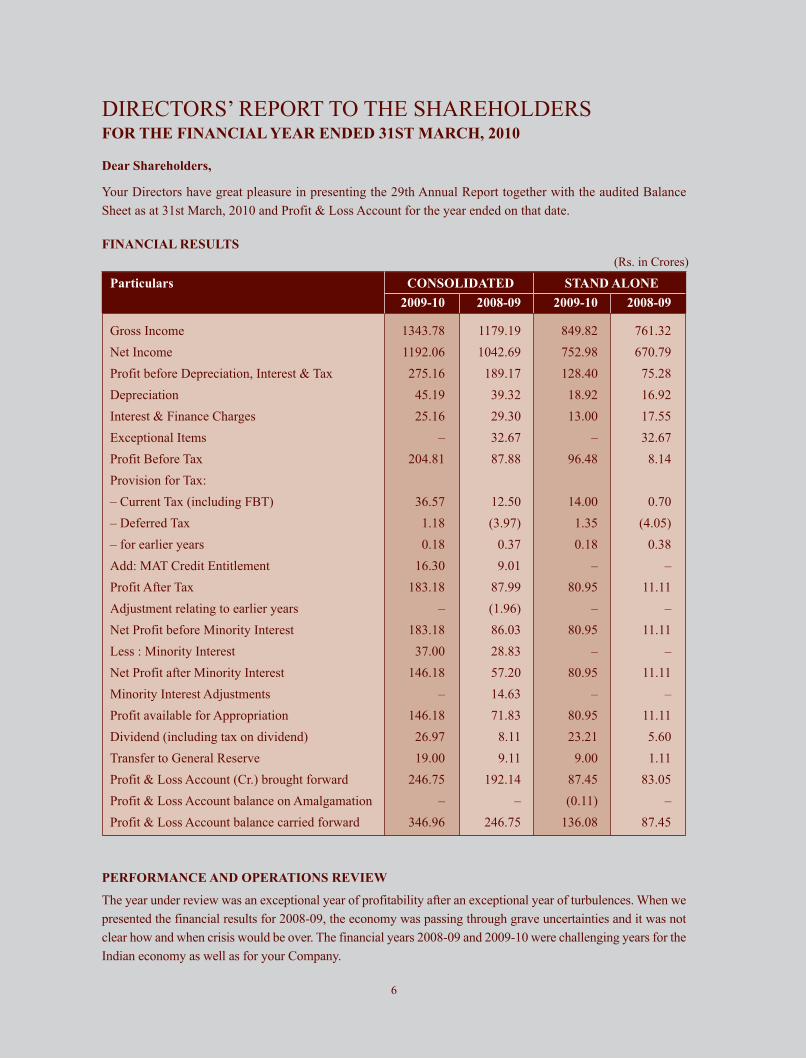
FINANCIAL RESULTS
DIRECTORS’ REPORT TO THE SHAREHOLDERSFOR THE FINANCIAL YEAR ENDED 31ST MARCH, 2010
PERFORMANCE AND OPERATIONS REVIEW
The year under review was an exceptional year of profitability after an exceptional year of turbulences. When we
presented the financial results for 2008-09, the economy was passing through grave uncertainties and it was not
clear how and when crisis would be over. The financial years 2008-09 and 2009-10 were challenging years for the
Indian economy as well as for your Company.
(Rs. in Crores)
Particulars CONSOLIDATED STAND ALONE
2009-10 2008-09 2009-10 2008-09
Gross Income 1343.78 1179.19 849.82 761.32
Net Income 1192.06 1042.69 752.98 670.79
Profit before Depreciation, Interest & Tax 275.16 189.17 128.40 75.28
Depreciation 45.19 39.32 18.92 16.92
Interest & Finance Charges 25.16 29.30 13.00 17.55
Exceptional Items – 32.67 – 32.67
Profit Before Tax 204.81 87.88 96.48 8.14
Provision for Tax:
– Current Tax (including FBT) 36.57 12.50 14.00 0.70
– Deferred Tax 1.18 (3.97) 1.35 (4.05)
– for earlier years 0.18 0.37 0.18 0.38
Add: MAT Credit Entitlement 16.30 9.01 – –
Profit After Tax 183.18 87.99 80.95 11.11
Adjustment relating to earlier years – (1.96) – –
Net Profit before Minority Interest 183.18 86.03 80.95 11.11
Less : Minority Interest 37.00 28.83 – –
Net Profit after Minority Interest 146.18 57.20 80.95 11.11
Minority Interest Adjustments – 14.63 – –
Profit available for Appropriation 146.18 71.83 80.95 11.11
Dividend (including tax on dividend) 26.97 8.11 23.21 5.60
Transfer to General Reserve 19.00 9.11 9.00 1.11
Profit & Loss Account (Cr.) brought forward 246.75 192.14 87.45 83.05
Profit & Loss Account balance on Amalgamation – – (0.11) –
Profit & Loss Account balance carried forward 346.96 246.75 136.08 87.45
7
While it is true that India could not remain immune to global meltdown and the impact of global financial crisis
on India was stronger than expected, it is also fact that it was first to recover. India was among the first few
countries in the world to implement a broad-based counter-cyclic policy package to respond to the negative fall
out of the global slowdown. Indian banking system was flooded with funds at reasonable interest rates, which
proved to be key driver to growth of infrastructure, real estate and related productive sectors.
If we look at India’s turnaround indicators during year under review, we find that Cement sector has grown, Steel
sector has shown recovery, the job losses were lowest, interest rates were considerably lowered, availability
and liquidity of money was comfortable, rupee strengthened against dollar, stock markets turned around and
overall growth rate was satisfactory. Government continued its focus on simulating demand by ensuring flow
of credit to trade, industry, investment in infrastructure, housing and real estate. India again continued to remain
a preferred investment destination.
Despite all odds we are proud to state that our economy as well as your Company have weathered the worst crisis
and have come out even stronger.
Profitability of the Company’s Plywood, Laminate, Logistic and Cement divisions improved substantially.
Company’s newly setup CFS division started to contribute within the very first year of its operation. However,
due to lack of demand and subdued prices, the Company’s ferro alloy division could book only reasonable
profits. The Company could book substantial gains on account of foreign exchange difference because of
weakening of US Dollar against rupee coupled with Company’s conscious foreign exchange risk policy.
During the year, your Company achieved Gross Income of Rs. 849.82 crores against Rs. 761.32 crores during
the previous year reflecting a growth of over 11%. The net profit increased significantly from Rs. 11.11 crores
to Rs. 80.95 crores reflecting a growth of over 628%. Your Company continued its dominance in plywood,
veneer & allied products and further increased its market share.
On consolidated basis also, your Company’s operations grew significantly. During the year under review,
your Company achieved Gross Income of Rs. 1343.78 crores against Rs. 1179.19 crores during the previous
year, reflecting a growth of over 13 %. The Net Profit after minority interest increased from Rs. 57.20 crores
to Rs. 146.18 crores, reflecting a growth of over 155%.
DIVIDEND
In view of the improved performance of the Company during the financial year 2009-10, the Board of Directors
declared and paid an Interim Dividend @ 75 paise per equity share. The Board of Directors has further
recommended Final Dividend @ 25 paise per equity share. Dividend on 9% preference shares shall be paid as
per coupon rate. All dividend amounts are exclusive of tax on dividend.
INTERNAL CONTROL SYSTEMS
Your Company's internal control systems are commensurate with its size and nature of business. Your Company
places great emphasis on the maintenance of effective internal controls, both from the point of view of
compliance with statutory requirements as well as supporting the smooth and efficient running of the business
process that have an impact on financial reporting, Your Company has implemented SAP for integrated
accounting and information system, which ensure better system driven controls. Responsibility for ensuring
correct and timely performance of the controls has been assigned to specific individuals at all locations.
SUBSIDIARIES & ASSOCIATES
As a purposeful strategy, your Company carries a part of its business operations through several subsidiaries which
are formed either directly or as step-down subsidiaries or in certain cases by acquisition of majority stake in existing
companies. As on 31st March, 2010, Cement Manufacturing Co. Ltd (CMCL), Auro Sundram Ply & Door Pvt. Ltd.
(ASPDPL), Meghalaya Power Ltd. (MPL), Megha Technical & Engineers Pvt. Ltd (MTEPL) and Star Cement
Meghalaya Ltd. (SCML) continued to remain subsidiaries of the Company. During the Financial Year 2009-10, your
Company acquired controlling interest in Aegis Business Ltd. (ABL) and as such ABL became a subsidiary of your
Company with effect from 6th July, 2009. ABL acquired controlling interest in Aegis Overseas Ltd. (AOL) and as
such AOL also became an ultimate subsidiary of your Company with effect from 15th July, 2009. Company’s wholly
owned subsidiary Cent Ply Pvt. Ltd. amalgamated with the Company with effect from appointed date 1st April, 2009.
CMCL along with its subsidiary MTEPL operates integrated Cement plant at Meghalaya with aggregate annual
installed capacity of 1 Million Tonne. CMCL along with SCML is setting up a 1.75 Million Tonne per annum
capacity clinker unit at Meghalaya and 3.20 Million Tonne per annum cement grinding units at Assam and
Bihar. After giving effect to all these expansions, the Company’s consolidated cement manufacturing capacity
will go up to 4.20 Million Tonne per annum.
ASPDPL is operating a plywood unit at Raipur Industrial Area, Uttarkhand. This unit is manufacturing plywood
and allied products from eco-friendly agro-forestry timber and is entitled to various incentives including excise
duty and income tax exemption.
MPL is setting up a 51 MW power generation capacity near Company’s existing and proposed clinker unit at
Meghalaya. Most of the power generated will be used for upcoming cement and clinker units. Out of such 51 MW,
8 MW capacity is already complete.
ABL and AOL are engaged in import and trading of mineral and other commodities. They are exploring feasibility
of acquiring mines in Thailand and Middle-east countries to develop this business. Although contribution to
revenue during the current financial year was not substantial, their business module holds great potential.
CONSOLIDATED FINANCIAL STATEMENTS
As per Section 212 of the Companies Act, 1956, the Company is required to attach the Directors’ Report,
Auditors’ Report, Balance Sheet and Profit and Loss Account of its subsidiary companies to its Annual Report.
The Ministry of Corporate Affairs, Government of India, vide its order no. 47/311/2010-CL-III dated 21st
April, 2010, has granted exemption to your Company for not attaching the above documents of subsidiaries
with Annual Report of the Company for the financial year 2009-10. Accordingly, this Annual Report does not
contain the reports and other statements of the subsidiary companies. The Company will make available the
annual audited accounts and related detailed information of the subsidiary companies upon request by any
member of the Company or that of its subsidiaries. These documents will also be available for inspection
during business hours at the registered office of the Company and also at the registered offices of the
subsidiary companies.
Financial information of the subsidiary companies, as required by the said approval of Ministry of Corporate
Affairs, Government of India, is annexed to this report. A statement of Holding Company’s interest in
subsidiaries is also furnished separately.
As required by Accounting Standard – 21 and Listing Agreement with Stock Exchanges, the audited consolidated
financial statements of the Company and its subsidiaries are enclosed.
FUTURE OUTLOOK
The Finance Minister in his recent budget speech stated that the challenge before the nation is to quickly revert
to high GDP growth path of 9% and then to cross double digit growth barrier. Provision of quality and efficient
infrastructure is essential to achieve this growth and utilize full potential of the emerging Indian economy.
Economic and population growth place additional pressure on existing infrastructure facilities and unless they
are developed further to cope with growth, they become constraint to development. To sustain 9% growth, the
Government of India has estimated that an investment over USD 492 billion is required in 11th Five Year Plan.
In the recent finance budget a sum of Rs. 1,73,552 crores has been provided for infrastructure development,
8
which account for over 46% of total plan allocation. With the Government’s continued focus on infrastructure
development, it seems very probable that the country’s economic survival will be driven by infrastructure
growth, which in turn will accelerate real estate activities.
The Indian real estate sector plays a significant role in the country’s economy. The real estate sector is
second only to agriculture in terms of employment generation and contributes considerably towards GDP.
Almost 5% of the country’s GDP is contributed by the housing sector, which is expected to rise to 6%.
According to the tenth five year plan, there is a shortage of 22.4 million dwelling units. Thus, over the next
10 to15 years 80 to 90 million dwelling units will have to be constructed. According to a study, the real estate
market in India is expected to grow rapidly due to improvement in affordability, better job security and
availability of housing finance.
Since Cement, Plywood, laminate and steel related products are essential part of construction right from initial
brick and mortar stage to final stage of furnishing, the demand for these products is directly related to the growth
of infrastructure and real estate sector. With continued government focus on infrastructure and real estate sector
the demand for Company’s products is expected to remain buoyant. With strong and preferred “Centuryply”
brand under its fold, the Company is expected to perform better in current fiscal.
FUTURE PLANS OF EXPANSION
Considering buoyant demand for the products and marketing strength of “Centuryply” brand, the Company has
plans for capacity expansions through organic and inorganic routes.
The Company is also increasing its focus on logistic service sector. The Company is already operating a jetty
at Falta, South 24 Parganas, West Bengal with Ministry of Commerce, Government of India. The Company
has also developed approx 100000 sq.m. area as Container Freight Stations (CFS) near Kolkata Port. Out of
this approx 20000 sq.m area was fully operational during current financial year and balance 80000 sq.m area
is also ready to commence operations. The Company is exploring further possibilities in logistic service sector.
The subsidiaries of the Company are also having ambitious growth plans. CMCL along-with its subsidiaries is
expanding its cement manufacturing capacity from 1 million MT to 4.20 million MT per annum, with adequate
captive power capacity.
DIRECTORS
Sri Banwari Lal Agarwal, Founder and Chairman Emeritus of the Company suddenly expired on 27th May,
2010. He served the Company for more than 25 years and was the key force behind success of the Company.
The Board places on record its respect and homage to departed soul.
In accordance with Articles of Association of the Company, Sri Satya Brata Ganguly, Sri Vishnu Khemani and
Sri Sajan Kumar Bansal retire by rotation, and being eligible, offer themselves for re-appointment. In view of
their considerable experience, your Directors recommend their re-appointment.
DIRECTORS’ RESPONSIBILITY STATEMENT
Pursuant to the requirement of Section 217(2AA) of the Companies Act, 1956, with respect to Directors’
Responsibility Statement, the Directors hereby confirm that :-
(i) in the preparation of the annual accounts for the year ended March 31, 2010, the applicable Accounting
Standards have been followed and proper explanations were provided for material departures, if any.
(ii) the Directors had selected such accounting policies and applied them consistently and made judgments and
estimates that are reasonable and prudent so as to give a true and fair view of the state of affairs of the
Company as at the end of the financial year and of the profit of the Company for that period.
9
(iii) the Directors had taken proper and sufficient care for the maintenance of adequate accounting records in
accordance with the provisions of the Companies Act, 1956 for safeguarding the assets of the Company
and for preventing and detecting fraud and other irregularities;
(iv) the Directors had prepared the annual accounts for the financial year ended March 31, 2010, on a going
concern basis
CORPORATE GOVERNANCE
Your Company has been practicing the principle of good Corporate Governance over the years and it is a
continuous and ongoing process. A detailed report on Corporate Governance practices followed by your Company,
in terms of Clause 49 of the Listing agreement with Stock Exchanges is provided separately in this Annual Report.
A certificate from the auditors of the Company confirming compliance of conditions of Corporate Governance
as stipulated under Clause 49 of the Listing Agreement is contained elsewhere in the Annual Report. This
Certificate will be forwarded to the Stock Exchanges along with the Annual Report of the Company.
MANAGEMENT DISCUSSION AND ANALYSIS REPORT
The Management Discussion and Analysis, forming part of this report, as required under Clause 49 of the Listing
Agreement with the Stock Exchanges is attached separately to this Annual Report.
CEO/CFO CERTIFICATION
As required by Clause 49 of the Listing Agreement, the CEO/CFO certification has been submitted to the Board
and a copy thereof is contained elsewhere in this Annual Report.
AUDITORS & AUDITORS’ REPORT
M/s. S. R. Batliboi & Co, Chartered Accountants, Statutory Auditors of the Company, retire at the conclusion
of the ensuing Annual General Meeting of the Company. They have offered themselves for reappointment as
Statutory Auditors and have confirmed that their appointment, if made, will be within the limits prescribed
under Section 224(1B) of the Companies Act, 1956. Your Directors recommend their appointment for the
ensuing year.
Auditors in their audit report read with note no 18 on Schedule –‘V’ have observed that exchange fluctuation
gain of Rs. 1895.79 lacs (Net) (Previous year loss of Rs. 2724.86 lacs) towards creditors/debtors pertaining
to specific segments has been included as unallocable income/expenses as the amount of such exchange
gain/loss for different segments is not ascertainable. The gain/loss arising on account of foreign exchange
difference is not operational in nature, as cost of material purchased or supplied is calculated on the basis of
prevailing foreign exchange rates. Any subsequent difference which may be gain or loss is on account of
carrying foreign exchange risk and as such does not relate to product costing and consequently operational
profit. Such difference is purely financial in nature and its impact on different business segments is
unascertainable and as such considered un-allocable. The Company has been constantly following the policy
of treating the same as unallocable income/expenditure. Accordingly in the year 2009-10 also, for the reasons
mentioned above and to maintain consistency in accounting policies followed, the gain arising out of foreign
exchange has been considered as unallocable income. However, as pointed out by auditors, such treatment
has no impact on the Company’s profit for the year ended 31st March, 2010. Other observations made in the
Auditors’ Report are self explanatory and as such do not call for any further explanation under Section 217
(3) of the Companies Act, 1956.
CORPORATE SOCIAL RESPONSIBILITY
Corporate Social Responsibility continues to assume an important role in the activities of the Company. It
encompasses much more than social outreach programs and is an integral part of the way the Company conducts
its business. The Company contributes a part of its income to social, charitable and cultural organisations. It
10
reaches out with the objective of improving the quality of life of the economically deprived people in the places
where the Company has a presence.
HUMAN RESOURCE DEVLOPMENT & INDUSTRIAL RELATIONS
Your Company firmly believes in all round human resource development and cordial industrial relations.
Identifying and rewarding human talent at all levels has helped the Company to achieve all round development
both in terms of quality and economy. The Company maintains absolute harmony with its work force and has
not faced any labour trouble since inception.
PARTICULARS AS PER SECTION 217 OF THE COMPANIES ACT, 1956.
Particulars of Employees
The information required under Section 217(2A) of the Companies Act, 1956 read with the Companies
(Particulars of Employees) Rules, 1975, in respect of the employees employed throughout the financial year and
drawing Rs. 24 lacs or more is annexed separately. There was no employee who was employed for part of the
financial year, requiring such disclosure.
Information as to conservation of energy
The Company has always been conscious of the need of conservation of energy. Adequate energy conservation steps
are being taken in all plants and offices of the Company. The additional information on Conservation of energy for
Company’s ferro-alloy unit is set out in a separate statement, attached to this report and forms a part of it.
Information as to technology absorption
There is no specific area in which Research & Development (R & D) is carried out by the Company but the
Company constantly carries out research for improvement of its products. During the year under review there has
been no specific and material capital/recurring expenditures on R & D. The Company is a member of Indian
Plywood Industries Research and Training Institute (IPIRTI) and has contributed Rs.15,000/- to it. The
technologies used by the Company are indigenous. Constant efforts are made towards absorption, adaptation and
innovation of technologies used, for improvement/development of products of the Company.
Foreign Exchange earnings and outgo
Foreign Exchange Earning : Rs. 24.11 Crores
Foreign Exchange Outgo : Rs. 220.39 Crores
PUBLIC DEPOSITS
The Company has not invited or accepted deposits from the public covered under Section 58A of the Companies
Act, 1956.
APPRECIATION
Your Directors wish to express their grateful appreciation for the valuable support and cooperation received
from lenders, business associates, banks, financial institutions, shareholders, various Statutory Authorities and
society at large. Your Directors also place on record, their appreciation for the contribution and hard work of
employees of the Company and that of its subsidiaries at all levels.
For and on behalf of the Board of Directors
Sajjan Bhajanka Hari Prasad Agarwal
Managing Director Executive Director
Kolkata, 28th May, 2010
11
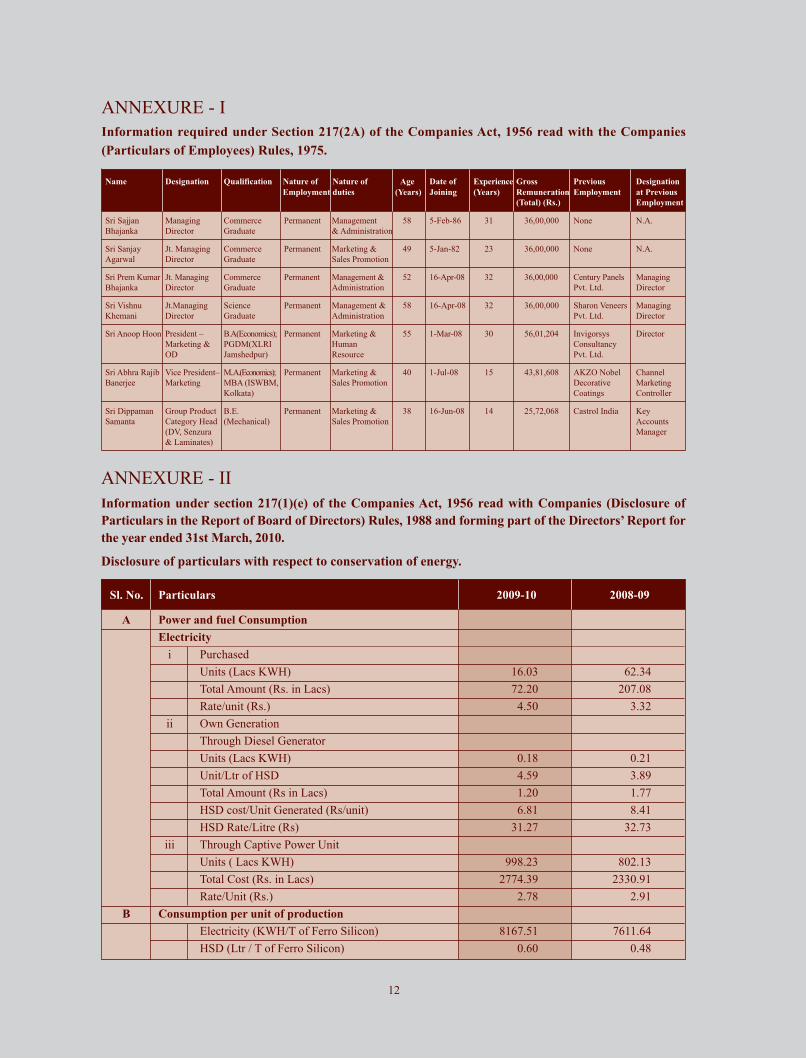
Information under section 217(1)(e) of the Companies Act, 1956 read with Companies (Disclosure of
Particulars in the Report of Board of Directors) Rules, 1988 and forming part of the Directors’ Report for
the year ended 31st March, 2010.
Disclosure of particulars with respect to conservation of energy.
ANNEXURE - II
Sl. No. Particulars 2009-10 2008-09
A Power and fuel Consumption
Electricity
i Purchased
Units (Lacs KWH) 16.03 62.34
Total Amount (Rs. in Lacs) 72.20 207.08
Rate/unit (Rs.) 4.50 3.32
ii Own Generation
Through Diesel Generator
Units (Lacs KWH) 0.18 0.21
Unit/Ltr of HSD 4.59 3.89
Total Amount (Rs in Lacs) 1.20 1.77
HSD cost/Unit Generated (Rs/unit) 6.81 8.41
HSD Rate/Litre (Rs) 31.27 32.73
iii Through Captive Power Unit
Units ( Lacs KWH) 998.23 802.13
Total Cost (Rs. in Lacs) 2774.39 2330.91
Rate/Unit (Rs.) 2.78 2.91
B Consumption per unit of production
Electricity (KWH/T of Ferro Silicon) 8167.51 7611.64
HSD (Ltr / T of Ferro Silicon) 0.60 0.48
ANNEXURE - I
12
Information required under Section 217(2A) of the Companies Act, 1956 read with the Companies
(Particulars of Employees) Rules, 1975.
Name Designation Qualification Nature of Nature of Age Date of Experience Gross Previous Designation
Employment duties (Years) Joining (Years) Remuneration Employment at Previous
(Total) (Rs.) Employment
Sri Sajjan Managing Commerce Permanent Management 58 5-Feb-86 31 36,00,000 None N.A.
Bhajanka Director Graduate & Administration
Sri Sanjay Jt. Managing Commerce Permanent Marketing & 49 5-Jan-82 23 36,00,000 None N.A.
Agarwal Director Graduate Sales Promotion
Sri Prem Kumar Jt. Managing Commerce Permanent Management & 52 16-Apr-08 32 36,00,000 Century Panels Managing
Bhajanka Director Graduate Administration Pvt. Ltd. Director
Sri Vishnu Jt.Managing Science Permanent Management & 58 16-Apr-08 32 36,00,000 Sharon Veneers Managing
Khemani Director Graduate Administration Pvt. Ltd. Director
Sri Anoop Hoon President – B.A(Economics); Permanent Marketing & 55 1-Mar-08 30 56,01,204 Invigorsys Director
Marketing & PGDM(XLRI Human Consultancy
OD Jamshedpur) Resource Pvt. Ltd.
Sri Abhra Rajib Vice President– M..A.(Economics); Permanent Marketing & 40 1-Jul-08 15 43,81,608 AKZO Nobel Channel
Banerjee Marketing MBA (ISWBM, Sales Promotion Decorative Marketing
Kolkata) Coatings Controller
Sri Dippaman Group Product B.E. Permanent Marketing & 38 16-Jun-08 14 25,72,068 Castrol India Key
Samanta Category Head (Mechanical) Sales Promotion Accounts
(DV, Senzura Manager
& Laminates)
CERTIFICATE BY CHIEF EXECUTIVE OFFICER
AND CHIEF FINANCIAL OFFICER
To
The Board of Directors
Century Plyboards (India) Ltd.
6 Lyons Range
Kolkata – 700 001
1. We hereby certify for the financial year ending 31st March, 2010 on the basis of review of the financial
statements and the cash flow statement and to the best of our knowledge and belief that:-
a) These statements do not contain any materially untrue statement or omit any material fact or contain
statements that might be misleading.
b) These statements together present a true and fair view of the Company's affairs and are in compliance
with existing accounting standards, applicable laws and regulations.
2. There are to the best of our knowledge and belief, no transactions entered into by the Company during the
year 2009-10, which are fraudulent, illegal or violative of the Company's code of conduct.
3. We accept responsibility for establishing and maintaining internal controls for financial repoting. We have
evaluated the effectiveness of the internal control systems of the Company pertaining to financial reporting
and we have disclosed to the auditors and the Audit Committee those deficiencies, of which we are aware,
in the design and operation of the internal control systems and that we have taken the required steps to
rectify those deficiencies.
We further certify that:
a) There have been no significant changes in internal control over financial reporting during the year.
b) There have been no significant changes in accounting policies during the year.
c) There have been no instances of significant fraud of which we have become aware and the involvement
therein, of management or an employee having a significant role in the Company's internal control system.
Sajjan Bhajanka Arun Kumar Julasaria
Managing Director & CEO Chief Financial Officer and Company Secretary
Kolkata, 28th May, 2010
13
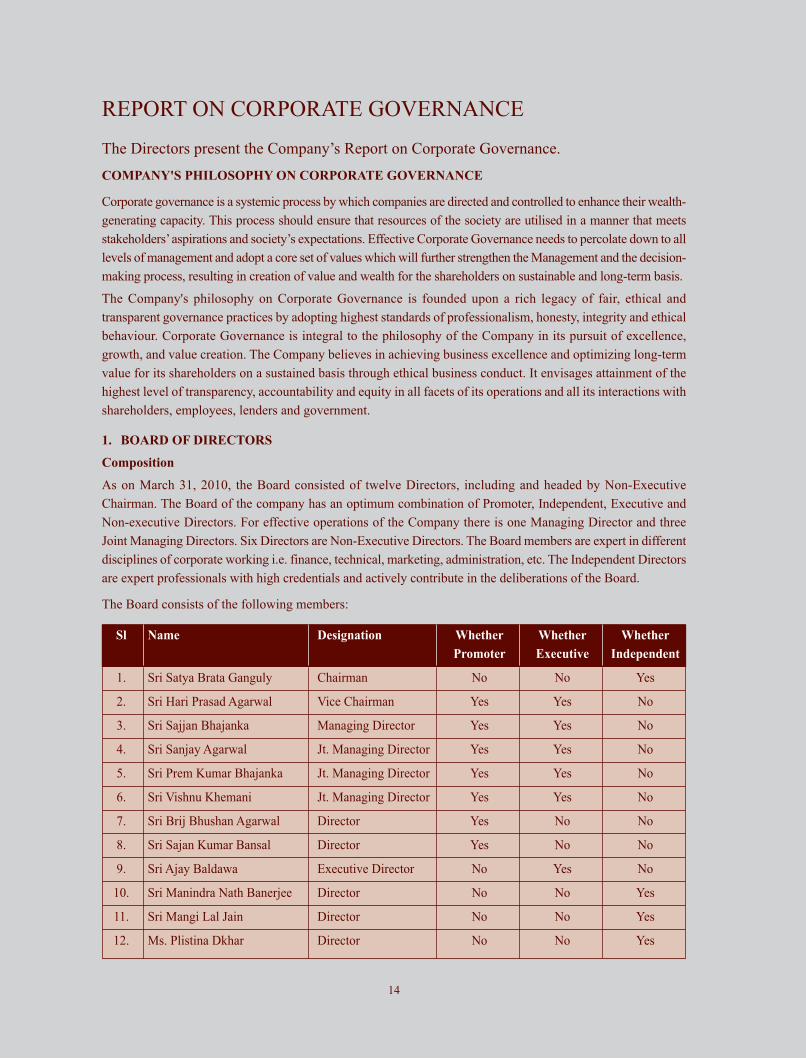
Sl Name Designation Whether Whether Whether
Promoter Executive Independent
1. Sri Satya Brata Ganguly Chairman No No Yes
2. Sri Hari Prasad Agarwal Vice Chairman Yes Yes No
3. Sri Sajjan Bhajanka Managing Director Yes Yes No
4. Sri Sanjay Agarwal Jt. Managing Director Yes Yes No
5. Sri Prem Kumar Bhajanka Jt. Managing Director Yes Yes No
6. Sri Vishnu Khemani Jt. Managing Director Yes Yes No
7. Sri Brij Bhushan Agarwal Director Yes No No
8. Sri Sajan Kumar Bansal Director Yes No No
9. Sri Ajay Baldawa Executive Director No Yes No
10. Sri Manindra Nath Banerjee Director No No Yes
11. Sri Mangi Lal Jain Director No No Yes
12. Ms. Plistina Dkhar Director No No Yes
REPORT ON CORPORATE GOVERNANCE
The Directors present the Company’s Report on Corporate Governance.
COMPANY'S PHILOSOPHY ON CORPORATE GOVERNANCE
Corporate governance is a systemic process by which companies are directed and controlled to enhance their wealth-
generating capacity. This process should ensure that resources of the society are utilised in a manner that meets
stakeholders’ aspirations and society’s expectations. Effective Corporate Governance needs to percolate down to all
levels of management and adopt a core set of values which will further strengthen the Management and the decision-
making process, resulting in creation of value and wealth for the shareholders on sustainable and long-term basis.
The Company's philosophy on Corporate Governance is founded upon a rich legacy of fair, ethical and
transparent governance practices by adopting highest standards of professionalism, honesty, integrity and ethical
behaviour. Corporate Governance is integral to the philosophy of the Company in its pursuit of excellence,
growth, and value creation. The Company believes in achieving business excellence and optimizing long-term
value for its shareholders on a sustained basis through ethical business conduct. It envisages attainment of the
highest level of transparency, accountability and equity in all facets of its operations and all its interactions with
shareholders, employees, lenders and government.
1. BOARD OF DIRECTORS
Composition
As on March 31, 2010, the Board consisted of twelve Directors, including and headed by Non-Executive
Chairman. The Board of the company has an optimum combination of Promoter, Independent, Executive and
Non-executive Directors. For effective operations of the Company there is one Managing Director and three
Joint Managing Directors. Six Directors are Non-Executive Directors. The Board members are expert in different
disciplines of corporate working i.e. finance, technical, marketing, administration, etc. The Independent Directors
are expert professionals with high credentials and actively contribute in the deliberations of the Board.
The Board consists of the following members:
14
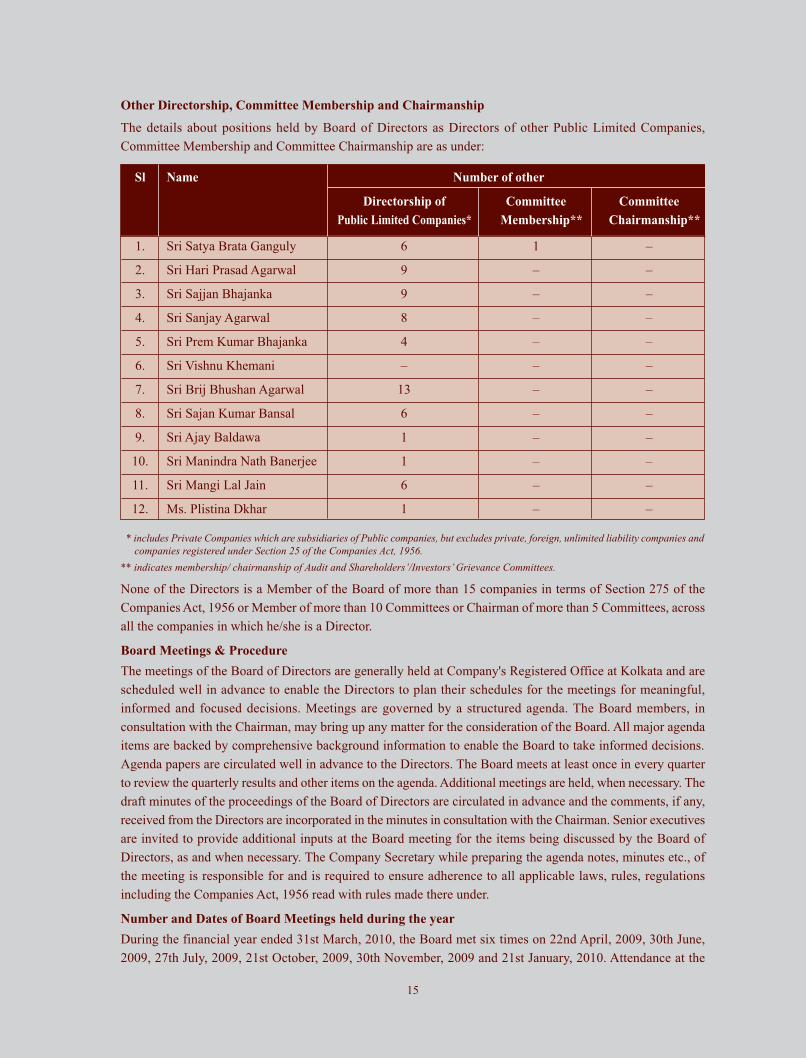
Sl Name Number of other
Directorship of Committee Committee
Public Limited Companies* Membership** Chairmanship**
1. Sri Satya Brata Ganguly 6 1 –
2. Sri Hari Prasad Agarwal 9 – –
3. Sri Sajjan Bhajanka 9 – –
4. Sri Sanjay Agarwal 8 – –
5. Sri Prem Kumar Bhajanka 4 – –
6. Sri Vishnu Khemani – – –
7. Sri Brij Bhushan Agarwal 13 – –
8. Sri Sajan Kumar Bansal 6 – –
9. Sri Ajay Baldawa 1 – –
10. Sri Manindra Nath Banerjee 1 – –
11. Sri Mangi Lal Jain 6 – –
12. Ms. Plistina Dkhar 1 – –
Other Directorship, Committee Membership and Chairmanship
The details about positions held by Board of Directors as Directors of other Public Limited Companies,
Committee Membership and Committee Chairmanship are as under:
* includes Private Companies which are subsidiaries of Public companies, but excludes private, foreign, unlimited liability companies andcompanies registered under Section 25 of the Companies Act, 1956.
** indicates membership/ chairmanship of Audit and Shareholders’/Investors’ Grievance Committees.
None of the Directors is a Member of the Board of more than 15 companies in terms of Section 275 of the
Companies Act, 1956 or Member of more than 10 Committees or Chairman of more than 5 Committees, across
all the companies in which he/she is a Director.
Board Meetings & Procedure
The meetings of the Board of Directors are generally held at Company's Registered Office at Kolkata and are
scheduled well in advance to enable the Directors to plan their schedules for the meetings for meaningful,
informed and focused decisions. Meetings are governed by a structured agenda. The Board members, in
consultation with the Chairman, may bring up any matter for the consideration of the Board. All major agenda
items are backed by comprehensive background information to enable the Board to take informed decisions.
Agenda papers are circulated well in advance to the Directors. The Board meets at least once in every quarter
to review the quarterly results and other items on the agenda. Additional meetings are held, when necessary. The
draft minutes of the proceedings of the Board of Directors are circulated in advance and the comments, if any,
received from the Directors are incorporated in the minutes in consultation with the Chairman. Senior executives
are invited to provide additional inputs at the Board meeting for the items being discussed by the Board of
Directors, as and when necessary. The Company Secretary while preparing the agenda notes, minutes etc., of
the meeting is responsible for and is required to ensure adherence to all applicable laws, rules, regulations
including the Companies Act, 1956 read with rules made there under.
Number and Dates of Board Meetings held during the year
During the financial year ended 31st March, 2010, the Board met six times on 22nd April, 2009, 30th June,
2009, 27th July, 2009, 21st October, 2009, 30th November, 2009 and 21st January, 2010. Attendance at the
15
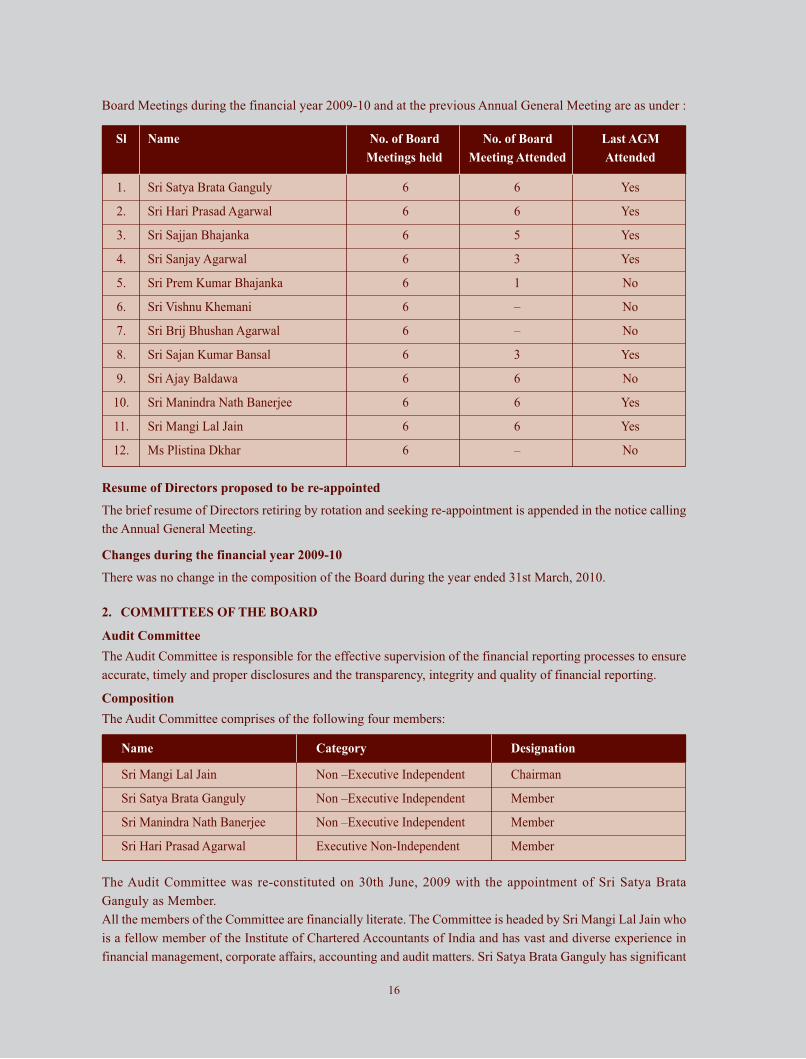
Board Meetings during the financial year 2009-10 and at the previous Annual General Meeting are as under :
Sl Name No. of Board No. of Board Last AGM
Meetings held Meeting Attended Attended
1. Sri Satya Brata Ganguly 6 6 Yes
2. Sri Hari Prasad Agarwal 6 6 Yes
3. Sri Sajjan Bhajanka 6 5 Yes
4. Sri Sanjay Agarwal 6 3 Yes
5. Sri Prem Kumar Bhajanka 6 1 No
6. Sri Vishnu Khemani 6 – No
7. Sri Brij Bhushan Agarwal 6 – No
8. Sri Sajan Kumar Bansal 6 3 Yes
9. Sri Ajay Baldawa 6 6 No
10. Sri Manindra Nath Banerjee 6 6 Yes
11. Sri Mangi Lal Jain 6 6 Yes
12. Ms Plistina Dkhar 6 – No
Resume of Directors proposed to be re-appointed
The brief resume of Directors retiring by rotation and seeking re-appointment is appended in the notice calling
the Annual General Meeting.
Changes during the financial year 2009-10
There was no change in the composition of the Board during the year ended 31st March, 2010.
2. COMMITTEES OF THE BOARD
Audit Committee
The Audit Committee is responsible for the effective supervision of the financial reporting processes to ensure
accurate, timely and proper disclosures and the transparency, integrity and quality of financial reporting.
Composition
The Audit Committee comprises of the following four members:
Name Category Designation
Sri Mangi Lal Jain Non –Executive Independent Chairman
Sri Satya Brata Ganguly Non –Executive Independent Member
Sri Manindra Nath Banerjee Non –Executive Independent Member
Sri Hari Prasad Agarwal Executive Non-Independent Member
The Audit Committee was re-constituted on 30th June, 2009 with the appointment of Sri Satya Brata
Ganguly as Member.
All the members of the Committee are financially literate. The Committee is headed by Sri Mangi Lal Jain who
is a fellow member of the Institute of Chartered Accountants of India and has vast and diverse experience in
financial management, corporate affairs, accounting and audit matters. Sri Satya Brata Ganguly has significant
16
professional expertise and rich business experience of over 46 years. Sri Manindra Nath Banerjee is a retired
IAS Officer with over 43 years of experience. Sri Hari Prasad Agarwal is Commerce Graduate with over 37 years
of experience in finance and accounts. The Composition of the Audit Committee meets the requirements of
Section 292A of the Companies Act, 1956 read with Clause 49 of the Listing Agreement.
The Company Secretary acts as Secretary to the Committee.
Meetings and Attendance
During the financial year ended 31st March, 2010, the Audit Committee met five times on 20th April, 2009, 30th
June, 2009, 27th July 2009, 21st October, 2009 and 21st January 2010 and was duly attended by all the members
of the Committee. Sri Satya Brata Ganguly, being appointed with effect from 30th June, 2009, was not present
in the first two meetings.
The meetings of the Audit Committee were also occasionally attended by the President Finance, Manager-Accounts
and representatives of the Statutory Auditors, as invitees for the relevant meetings.
Terms of reference
Terms of reference of the Audit Committee includes the following:
a) To oversee the Company's financial reporting process and the disclosure of its financial information to
ensure that the financial statement is correct, sufficient and credible
b) Recommending appointment, re-appointment and if required removal/replacement of statutory, branch &
internal auditors and recommend their remuneration.
c) Reviewing, with the management, the quarterly financial statements before submission to the Board
for approval.
d) Reviewing with the management, the annual audited financial statements before submission to the board
for approval, with particular reference to Directors’ Responsibility Statement, Change in Accounting
Policies, Major Accounting entries, Audit findings, Audit Qualifications, Related Party Transactions and
Compliance with listing agreements of stock exchanges.
e) Discussion with statutory auditors before the audit commences, about the nature and scope of audit as
well as post-audit discussions to ascertain areas of concern.
f) Reviewing, with the management, performance of statutory and internal auditors, adequacy of internal
control system.
g) Reviewing the adequacy of internal audit function and discussion with internal auditors regarding any
significant finding and follow up.
h) To investigate into any matter in relation to items specified in Section 292A of the Companies Act, 1956
or as may be referred to it by the Board and for this purpose to seek any relevant information contained
in the records of the Company and also seek external professional advice, if necessary.
i) To make recommendations to the Board on any matter relating to the financial management of the Company,
including the Audit report.
j) To approve appointment of Chief Financial Officer of the company.
Remuneration Committee
The Remuneration Committee determines on behalf of the Board and shareholders as per agreed term of
reference, the Company's policy on specific remuneration packages for Executive Directors.
Remuneration policy
The remuneration paid to the Directors of the Company is approved by the Board of Directors on the
recommendations of the Remuneration Committee. The Company's remuneration strategy is market-driven and
aims at attracting and retaining high caliber talent. The strategy is in consonance with the existing industry
practice and is directed towards rewarding performance, based on review of achievements, on a periodical basis.
17
Composition
The Remuneration Committee comprises of the following three members:
Name Category Designation
Sri Mangi Lal Jain Non –Executive Independent Chairman
Sri Satya Brata Ganguly Non –Executive Independent Member
Sri Manindra Nath Banerjee Non –Executive Independent Member
The Remuneration Committee was re-constituted on 30th June, 2009 with the appointment of Sri Satya Brata
Ganguly as Member.
The Company Secretary acts as Secretary to the Committee.
Meetings and Attendance
During the year, the Remuneration Committee met only once on 31st July, 2008 and was duly attended by all
the members of the Committee.
Details of remuneration paid to Directors
Executive Directors:
Sl. Name of the Director Designation Remuneration Rs.
1. Sri Sajjan Bhajanka Managing Director 36,00,000
2. Sri Sanjay Agarwal Jt. Managing Director 36,00,000
3. Sri Prem Kumar Bhajanka Jt. Managing Director 36,00,000
4. Sri Vishnu Khemani Jt. Managing Director 36,00,000
5. Sri Hari Prasad Agarwal Executive Director 18,00,000
6. Sri Ajay Baldawa Executive Director 18,00,000
* The remuneration shown above is total consolidated salary paid during 2009-10.
Non-Executive Directors
During the year, the Company paid sitting fee of Rs. 7,500/- to Non-Executive Directors for attending each
meeting of the Board of the Company. Details of sitting fee paid to Non-Executive Directors during the year
2009-10 together with their shareholdings in the Company are given below:
Sl. Name of the Non-Executive Director Designation Sitting Fee (Rs.) No. of shares held
1. Sri Satya Brata Ganguly Chairman 45,000 Nil
2. Sri Manindra Nath Banerjee Director 45,000 Nil
3. Sri Mangi Lal Jain Director 45,000 3,000
Besides sitting fees, the Non-Executive Chairman, Sri Satya Brata Ganguly has been paid remuneration of
Rs. 12,00,000/- for which necessary approvals have been obtained from the Ministry of Corporate Affairs in
terms of section 309(4) of the Companies Act, 1956. Sri Ganguly carries with him significant professional
expertise and rich business experience.
18

The salient terms of appointment and payment of remuneration to Managing, Joint Managing and
Executive Directors :
Share Transfer cum Investor Grievance Committee
The Committee, oversees and reviews all matters connected with transfer of securities and also interalia approves
issue of duplicate, split of Share Certificates, etc. It also ensures speedy redressal of Shareholders/Investors
complaints, grievances and queries. It also reviews performance of the Registrar and Transfer Agent and
recommends measures for overall improvement in the quality of investor services.
19
Period of Appointment Sri Sajjan Bhajanka Upto 31st March, 2011
Sri Sanjay Agarwal Upto 30th June, 2011
Sri Ajay Baldawa Upto 30th June, 2011
Sri Hari Prasad Agarwal Upto 31st May, 2012
Sri Prem Kumar Bhajanka Upto 31st July, 2013
Sri Vishnu Khemani Upto 31st July, 2013
Salary Scale (Maximum) Sri Sajjan Bhajanka Rs. 36,00,000/-
Sri Sanjay Agarwal Rs. 36,00,000/-
Sri Ajay Baldawa Rs. 18,00,000/-
Sri Hari Prasad Agarwal Rs. 18,00,000/-
Sri Prem Kumar Bhajanka Rs. 36,00,000/-
Sri Vishnu Khemani Rs. 36,00,000/-
Perquisites and Allowances Sri Sajjan Bhajanka Rs. 12,00,000/-
(Maximum) (excluding Sri Sanjay Agarwal Rs. 12,00,000/-
Company’s contribution to Sri Ajay Baldawa Rs. 12,00,000/-
provident, superannuation Sri Hari Prasad Agarwal Rs. 12,00,000/-
& gratuity funds and leave Sri Prem Kumar Bhajanka Rs. 12,00,000/-
encashment) Sri Vishnu Khemani Rs. 12,00,000/-
Minimum Remuneration in
case of inadequacy of profit To be determined in terms of Schedule XIII of the Companies Act, 1956
during any financial year.
Service Contracts The appointment of the Executive Directors is governed by resolutions passed
by the Board and the Shareholders of the Company, which cover the terms and
conditions of such appointment read with the service rules of the Company
Severance fees payable by There is no separate provision for payment of severance fee under the resolutions
the Company for termination governing the appointment of Executive Directors.
of employment.
Notice Period on either side Three Calendar Months from either side
Stock Options The Company has not issued any Stock Options

Composition
The Share Transfer cum Investor Grievance Committee comprises of the following two members:
Name Category Designation
Sri Manindra Nath Banerjee Non – Executive Independent Chairman
Sri Hari Prasad Agarwal Executive Non – Independent Member
The Company Secretary acts as Secretary to the Committee.
Meetings and Attendance
During the year the Share Transfer cum Investor Grievance Committee met twenty-four times on 16th April, 2009,
30th April, 2009, 15th May, 2009, 30th May, 2009, 15th June, 2009, 30th June, 2009, 15th July, 2009, 31st July, 2009,
14th August, 2009, 22nd August, 2009, 15th September,2009, 30th September,2009, 15th October, 2009, 31st
October, 2009, 16th November, 2009, 30th November, 2009, 15th December, 2009, 31st December, 2009, 15th
January, 2010, 30th January, 2010, 15th February, 2010, 27th February, 2010, 15th March, 2010 and 30th March,
2010. Both members attended all the meetings.
Status of pending Complaints
Sri Arun Kumar Julasaria, Company Secretary is Compliance Officer of the Company for attending to
Complaints/Grievances of the members. During the year under review, 4 complaints were received from
investors and were replied/resolved to their satisfaction. There were no complaints pending at the beginning and
at the close of the financial year.
3. GENERAL BODY MEETINGS
Particulars of last three Annual General Meetings
AGM Year ended Venue Date Time
26th 31.03.2007 Merchants’ Chamber of Commerce 16.07.2007 11-00 AM
15B, Hemant Basu Sarani, Kolkata-700 001
27th 31.03.2008 Gyan Manch, 11, Pretoria Street, Kolkata-700 071 27.08.2008 11-00 AM
28th 31.03.2009 Gyan Manch, 11, Pretoria Street, Kolkata-700 071 28.08.2009 11-00 AM
Following Special Resolutions were passed in last three Annual General Meetings
At 26th AGM, the following Special Resolutions were passed:
i. Alteration of Articles of Association of the Company with respect to maximum number of Directors that may
be appointed on the Board of the Company.
ii. Empowering Board to issue securities including equity shares upto Rupees four hundred crores
iii. Change of name of the Company
At 27th AGM, no Special Resolution was passed.
At 28th AGM, the following Special Resolutions were passed:
i. Remuneration to Sri Sajjan Bhajanka, Sri Sanjay Agarwal, Sri Prem Kumar Bhajanka and Sri Brij Bhushan
Agarwal from a subsidiary company
ii. Payment of Minimum Remuneration to Sri Sajjan Bhajanka, Sri Sanjay Agarwal, Sri Ajay Baldawa, Sri
Hari Prasad Agarwal, Sri Prem Kumar Bhajanka, Sri Vishnu Khemani and Sri Satya Brata Ganguly in terms
of Part-II, Section-II(B) of Schedule- XIII of the Companies Act, 1956.
During the financial year 2009-10, no Special Resolution was passed through Postal Ballot.
20

4. DISCLOSURES
� There are no materially significant related party transactions i.e. transactions material in nature, with its
Promoters, the Directors or the Management, their subsidiaries or relatives etc. having potential conflict
with the interests of the Company at large. Other related party transactions have been reported in Notes
to Accounts. The Register of Contracts containing transactions, in which the Directors are interested, is
placed before the Board regularly.
� There has been no instance of non-compliance by the Company on any matter related to capital markets
during the last three financial years and hence no penalties or strictures have been imposed on the Company
by the Stock Exchanges or Securities and Exchange Board of India or any other statutory authority.
� The Company has a defined Risk Management framework and the Board is kept informed about the risk
assessment and minimization procedures. The risk policy provides for identification of risk, its
assessment and procedures to minimize risk. The risk policy is periodically reviewed to ensure that the
executive management controls the risk as per decided policy. The risk management issues are discussed
in Management Discussion and Analysis.
� The Company had complied with all mandatory requirements and some non-mandatory requirements
of Corporate Governance as required by the Listing Agreement.
� The Directors of the Company are not related inter se.
5. CODE OF CONDUCT
The Board of Directors has adopted a Code of Business Conduct and Ethics for all Board Members and senior
management personnel and the same has been posted on the Company’s website-www.centuryply.com. All
the Board members and senior management personnel have affirmed compliance with the Code for the
year ended 31st March, 2010. A declaration to this effect signed by the CEO of the Company is given
hereunder:
I hereby confirm that:
The Company has obtained from all the members of the Board and Senior Management, affirmationsthat they have complied with the Code of Conduct for Directors and Senior Management Executivesin respect of financial year 2009-10.
Sajjan BhajankaManaging Director & CEO
Kolkata, 28th May, 2010
6. CEO/CFO CERTIFICATION
Sri Sajjan Bhajanka, Managing Director and CEO and Sri Arun Kumar Julasaria, CFO and Company
Secretary of the Company have submitted CEO/CFO certificate, which is separately annexed to this report.
7. MEANS OF COMMUNICATION
Quarterly, half-yearly and annual financial results of the Company are communicated to the Stock Exchanges
immediately after they are considered by the Board and are published in prominent English and Bengali
newspapers usually in The Economic Times, Times of India and Ek Din. The financial results are also posted
on the website of the Company –www.centuryply.com.
8. MANAGEMENT DISCUSSION AND ANALYSIS REPORT
This information is set out in a separate section included in this Annual Report.
21

9. GENERAL SHAREHOLDER INFORMATION
Annual General Meeting:
Listing on Stock Exchanges
The Company’s shares are presently listed on the following two Stock Exchanges.
a) The National Stock Exchange of India Ltd.(NSE)
Exchange Plaza, Bandra – Kurla Complex, Bandra (E)
Mumbai – 400 051
Stock Symbol – CENTURYPLY
b) Bombay Stock Exchange Ltd. (BSE)
P J Towers, Dalal Street, Fort
Mumbai – 400 001
Stock Code – 532548
The Equity shares of the company have been voluntarily delisted from The Delhi Stock Exchange
Association Ltd. with effect from 7th September, 2009.
The Company has paid listing fees to NSE and BSE for the year 2009-10 & 2010-11.
ISIN : INE348B01021
Market Price Data :
Monthly high and low quotations as well as the volume of shares traded at Bombay Stock Exchange and
National Stock Exchange, where the shares are regularly traded, for the financial year 2009-10 are as follows:
Month Bombay Stock Exchange (BSE) National Stock Exchange (NSE)
High Low Volume High Low VolumeRs. Rs. No. of Shares Rs. Rs. No. of Shares
2009
April 32.50 28.15 71853 33.80 27.15 333224
May 48.40 30.05 126867 46.90 28.50 205012
June 47.90 34.05 268975 50.00 35.10 681355
July 45.50 35.50 479104 45.00 35.70 815627
August 47.55 35.10 685772 47.35 34.50 982008
September 52.00 42.20 1439380 52.00 42.20 2285601
October 48.90 40.30 423374 49.60 40.10 1250803
November 43.20 39.00 125541 43.50 38.00 319334
December 48.75 41.00 888489 48.80 40.75 1768508
2010
January 50.85 42.25 712629 50.60 42.05 1173616
February 47.95 43.90 323108 48.90 36.00 667082
March 59.40 43.85 4694257 59.40 43.90 9014524
22
Date 27th August, 2010 (Friday)
Time 11.00 A.M
Venue Indian Chamber of Commerce Auditorium
10th Floor, 4, India Exchange Place, Kolkata -700001
Financial Year 2009-10
Book Closure Date 21st August, 2010 to 27th August, 2010 (Both days inclusive)
Dividend Payment Date Within statutory period from the date of passing of resolution at the Annual General Meeting.
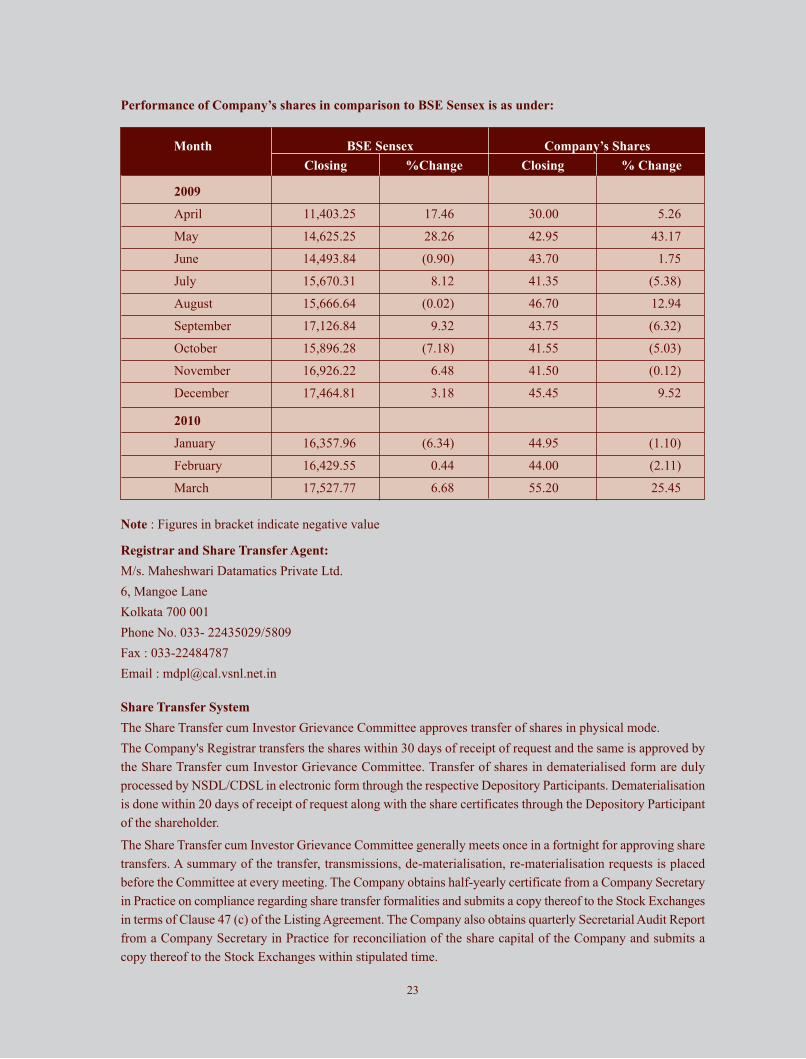
Performance of Company’s shares in comparison to BSE Sensex is as under:
Month BSE Sensex Company’s Shares
Closing %Change Closing % Change
2009
April 11,403.25 17.46 30.00 5.26
May 14,625.25 28.26 42.95 43.17
June 14,493.84 (0.90) 43.70 1.75
July 15,670.31 8.12 41.35 (5.38)
August 15,666.64 (0.02) 46.70 12.94
September 17,126.84 9.32 43.75 (6.32)
October 15,896.28 (7.18) 41.55 (5.03)
November 16,926.22 6.48 41.50 (0.12)
December 17,464.81 3.18 45.45 9.52
2010
January 16,357.96 (6.34) 44.95 (1.10)
February 16,429.55 0.44 44.00 (2.11)
March 17,527.77 6.68 55.20 25.45
Note : Figures in bracket indicate negative value
Registrar and Share Transfer Agent:
M/s. Maheshwari Datamatics Private Ltd.
6, Mangoe Lane
Kolkata 700 001
Phone No. 033- 22435029/5809
Fax : 033-22484787
Email : [email protected]
Share Transfer System
The Share Transfer cum Investor Grievance Committee approves transfer of shares in physical mode.
The Company's Registrar transfers the shares within 30 days of receipt of request and the same is approved by
the Share Transfer cum Investor Grievance Committee. Transfer of shares in dematerialised form are duly
processed by NSDL/CDSL in electronic form through the respective Depository Participants. Dematerialisation
is done within 20 days of receipt of request along with the share certificates through the Depository Participant
of the shareholder.
The Share Transfer cum Investor Grievance Committee generally meets once in a fortnight for approving share
transfers. A summary of the transfer, transmissions, de-materialisation, re-materialisation requests is placed
before the Committee at every meeting. The Company obtains half-yearly certificate from a Company Secretary
in Practice on compliance regarding share transfer formalities and submits a copy thereof to the Stock Exchanges
in terms of Clause 47 (c) of the Listing Agreement. The Company also obtains quarterly Secretarial Audit Report
from a Company Secretary in Practice for reconciliation of the share capital of the Company and submits a
copy thereof to the Stock Exchanges within stipulated time.
23
Dematerialisation of shares and liquidity
The Company's shares have been mandated for compulsory trading in demat form. Valid demat requests received
by the Company's Registrar are confirmed within the statutory period.
The International Securities Identification Number (ISIN) allotted to the Company’s Equity Shares of face
value Re.1/- is INE348B01021. In case a member wants his shares to be dematerialized, he may send the
shares along with the request through his Depository Participant (DP) to the Company’s Registrars, M/s.
Maheshwari Datamatics Private Limited.
Distribution of shareholding
As on 31st March, 2010
Category No. of Shareholders No. of Shares
Total % Total %
1 – 500 3372 62.65 394371 0.18
501 – 1000 353 6.56 309334 0.14
1001 – 2000 453 8.42 713507 0.32
2001 – 3000 508 9.44 1315737 0.59
3001 – 4000 53 0.98 192665 0.09
4001 – 5000 157 2.92 739464 0.33
5001 – 10000 219 4.07 1660720 0.75
10001 – and above 267 4.96 216847192 97.60
TOTAL 5382 100.00 222172990 100.00
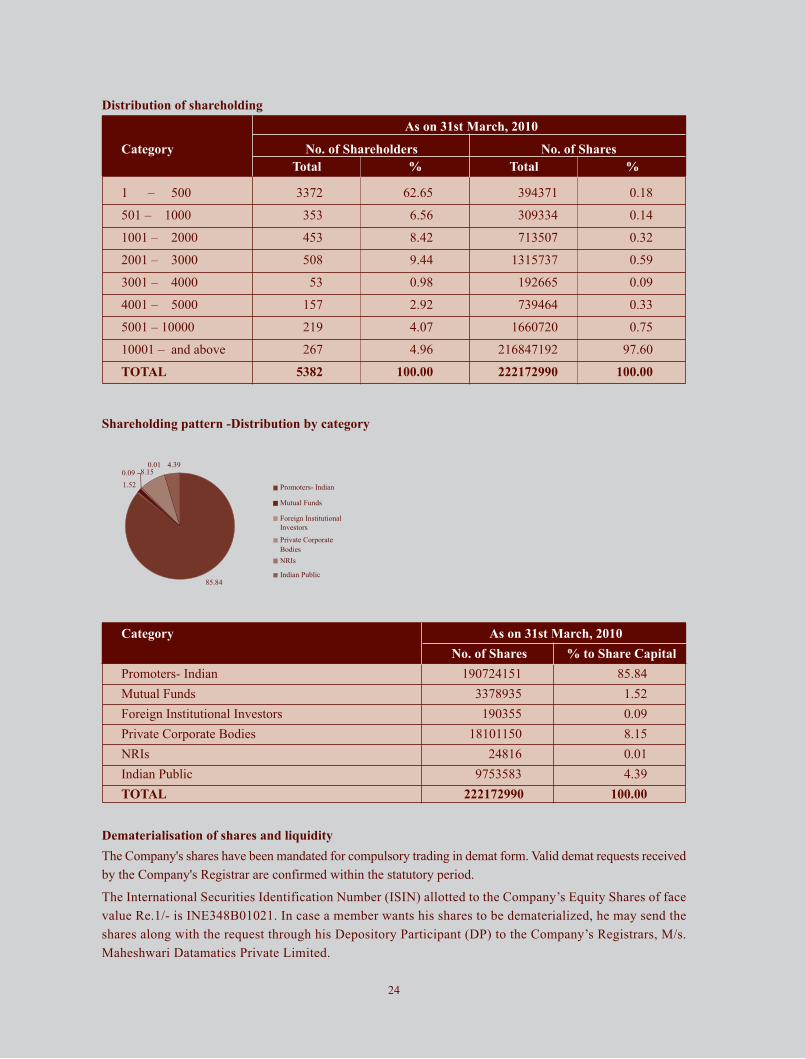
Shareholding pattern -Distribution by category
85.84
1.52
8.150.01 4.39
0.09
Promoters- Indian
Mutual Funds
Foreign InstitutionalInvestors
Private CorporateBodiesNRIs
Indian Public
Category As on 31st March, 2010
No. of Shares % to Share Capital
Promoters- Indian 190724151 85.84
Mutual Funds 3378935 1.52
Foreign Institutional Investors 190355 0.09
Private Corporate Bodies 18101150 8.15
NRIs 24816 0.01
Indian Public 9753583 4.39
TOTAL 222172990 100.00
24
The Company's Registrars promptly intimate the Concerned Depositing Participant in the event of any deficiency
and the shareholder is also kept abreast. Pending demat requests in the records of the Depositories, if any, are
continually reviewed and appropriate action initiated.
As on 31st March, 2010, 217813194 Equity Shares, which form 98.04% of the Share Capital of the Company,
stood dematerialised.
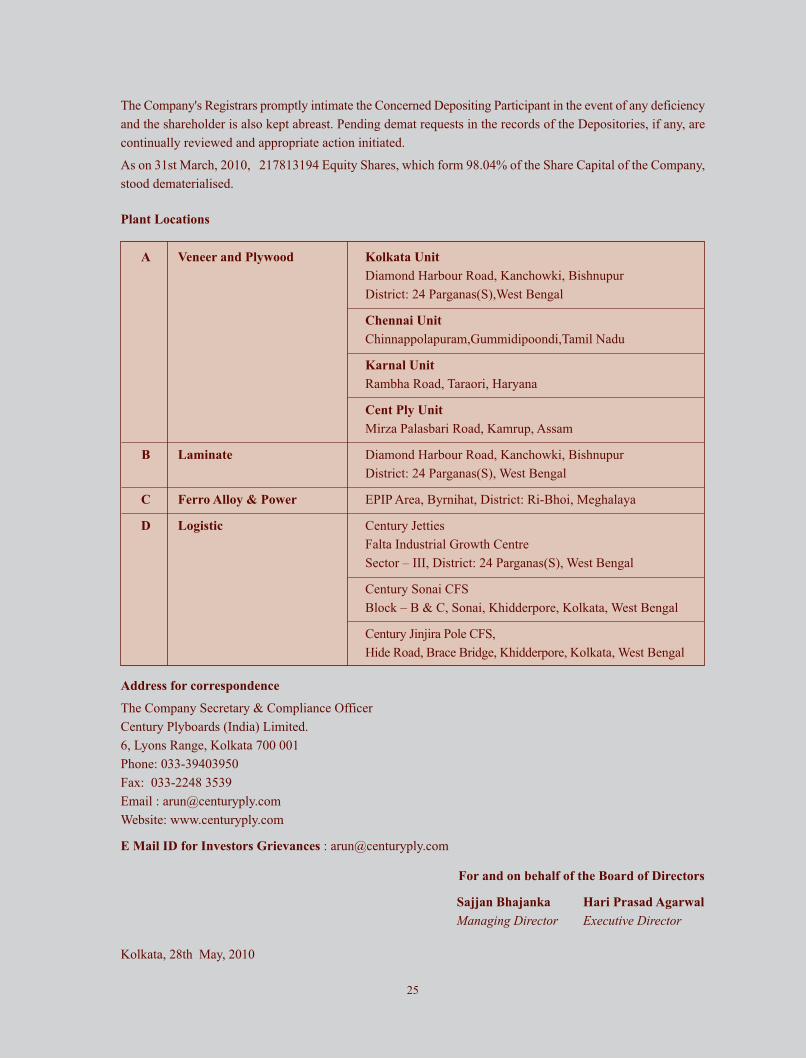
Plant Locations
Address for correspondence
The Company Secretary & Compliance Officer
Century Plyboards (India) Limited.
6, Lyons Range, Kolkata 700 001
Phone: 033-39403950
Fax: 033-2248 3539
Email : [email protected]
Website: www.centuryply.com
E Mail ID for Investors Grievances : [email protected]
For and on behalf of the Board of Directors
Sajjan Bhajanka Hari Prasad Agarwal
Managing Director Executive Director
Kolkata, 28th May, 2010
25
A Veneer and Plywood Kolkata Unit
Diamond Harbour Road, Kanchowki, Bishnupur
District: 24 Parganas(S),West Bengal
Chennai Unit
Chinnappolapuram,Gummidipoondi,Tamil Nadu
Karnal Unit
Rambha Road, Taraori, Haryana
Cent Ply Unit
Mirza Palasbari Road, Kamrup, Assam
B Laminate Diamond Harbour Road, Kanchowki, Bishnupur
District: 24 Parganas(S), West Bengal
C Ferro Alloy & Power EPIP Area, Byrnihat, District: Ri-Bhoi, Meghalaya
D Logistic Century Jetties
Falta Industrial Growth Centre
Sector – III, District: 24 Parganas(S), West Bengal
Century Sonai CFS
Block – B & C, Sonai, Khidderpore, Kolkata, West Bengal
Century Jinjira Pole CFS,
Hide Road, Brace Bridge, Khidderpore, Kolkata, West Bengal
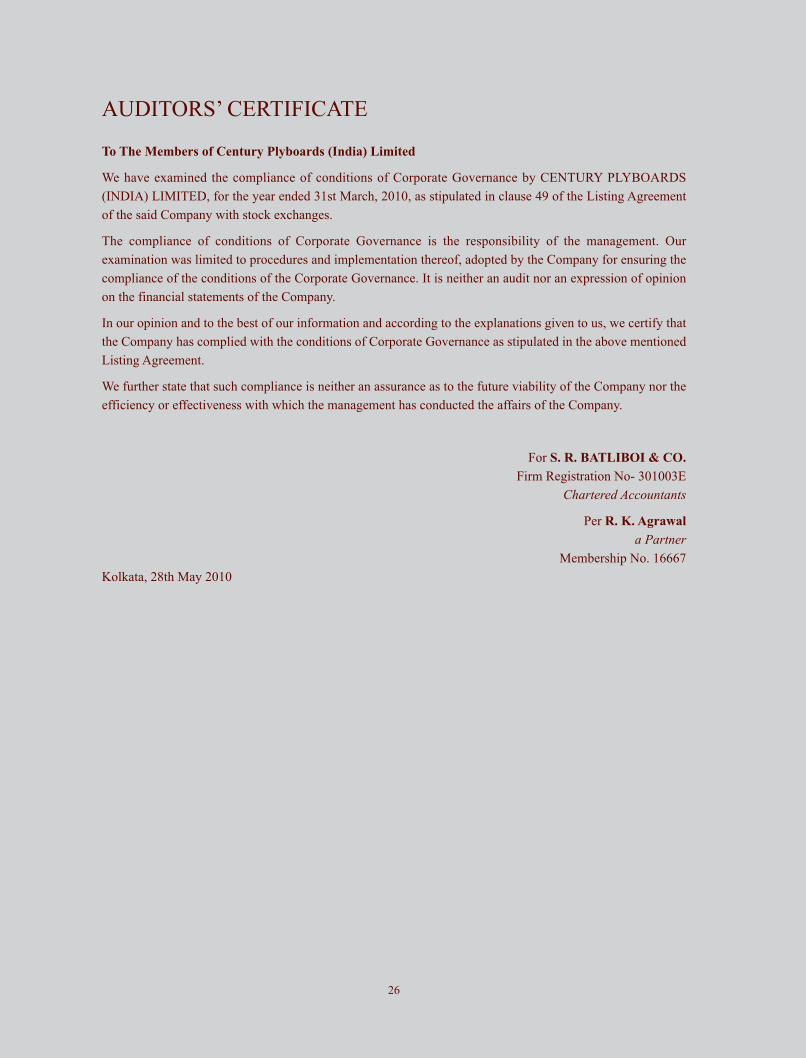
AUDITORS’ CERTIFICATE
To The Members of Century Plyboards (India) Limited
We have examined the compliance of conditions of Corporate Governance by CENTURY PLYBOARDS
(INDIA) LIMITED, for the year ended 31st March, 2010, as stipulated in clause 49 of the Listing Agreement
of the said Company with stock exchanges.
The compliance of conditions of Corporate Governance is the responsibility of the management. Our
examination was limited to procedures and implementation thereof, adopted by the Company for ensuring the
compliance of the conditions of the Corporate Governance. It is neither an audit nor an expression of opinion
on the financial statements of the Company.
In our opinion and to the best of our information and according to the explanations given to us, we certify that
the Company has complied with the conditions of Corporate Governance as stipulated in the above mentioned
Listing Agreement.
We further state that such compliance is neither an assurance as to the future viability of the Company nor the
efficiency or effectiveness with which the management has conducted the affairs of the Company.
For S. R. BATLIBOI & CO.
Firm Registration No- 301003E
Chartered Accountants
Per R. K. Agrawal
a PartnerMembership No. 16667
Kolkata, 28th May 2010
26
MANAGEMENT DISCUSSION AND ANALYSIS REPORTINDUSTRY STRUCTURE AND DEVELOPMENT
The projected growth of Company’s products (Plywood, Laminates, Cement and Ferro Alloys) is based on the
push-and-pull effects of supply and demand determinants like the economic trends in India, growth of
infrastructure and housing.
Home is an invention on which no one has yet improved. Of all aspirations known to humankind, owning a home
is most basic. It is the basic infrastructure required for development of a country and its citizens. Housing is a
highly sensitive investment area throughout the world. Investment in this sector is often recognised as a
barometer to measure the health of an economy at any point of time. The extreme sensitivity of the housing sector
on the overall economic growth is not difficult to explain. The sector, by the nature, is widely linked with a very
large number of manufacturing segments. There are about 250 industries, large and small, which depend on what
happens in the housing and construction business. This includes large ones that make cement and steel, medium
ones that make plywood, paint, tiles, electrical and the small ones that make nuts and bolts. These linkage
effects not only stimulate production and investments in the linked segments of manufacturing, they also push
up the aggregate additional income generated in the process. In short, growth in housing stimulates production
and overall growth in the economy.
In developed countries like United States 72.5% of citizens own their homes. While 69% live in their own
houses in the UK. If we aspire to become a developed nation by the year 2020, we must ensure a decent home
for each family of our country. According to the tenth five year plan, there is a shortage of 22.4 million dwelling
units and over the next 10 to15 years 80 to 90 million housing dwelling units will have to be constructed.
According to Confederation of Real Estate Developers Association of India (CREDAI) India’s total housing
requirement can be estimated at 200-225 million housing units, out of which we have just 170 million. We will
have to create additional 30 million to meet gap. Further next 15-20 years will create an additional demand for
70 million houses. So, by year 2020 we are to gear up to build 100 million additional houses. A daunting target,
but achievable. It is achievable because almost all Indians have capacity to buy a reasonable home. All Indians,
not owning their own home are already paying rent on their accommodation. Even if they are living in slums,
they are paying rent to their slumlords. The EMI of housing loan today is either equal or not substantially more
than the rent one has to pay for rented house. The rent one pays is an expense that once paid is lost, whereas the
EMI is payment for creation of an asset, value of which will multiply with passage of time. Anyone who lives
in a rented apartment will be unable to afford rent after 20 years as the rent will keep on increasing year to year.
Anyone who acquire house on EMI will have a home of his own by parting with almost same money, but with
multifold asset value. Availability of easy home loans at reasonable interest rates has propelled growth of
housing. Although economic slow down of 2008-09 has adversely affected housing but that can be considered
temporary. In long run housing sector growth is bound to propel.
Provision of quality and efficient infrastructure is essential to achieve growth and utilize full potential of the
emerging Indian economy. Economic and population growth place additional pressure on existing infrastructure
facilities and unless they are developed further to cope growth, they become constraint to development. In the
recent finance budget a sum of Rs. 1,73,552 crores has been provided for infrastructure development, which
account for over 46% of total plan allocation. With the Government’s continued focus on infrastructure
development, it seems very probable that the county’s economic survival will be driven by infrastructure growth.
OPPORTUNITIES AND THREATS
Plywood and Laminate Segment
In view of potential growth of housing and infrastructure, the overall demand for Plywood and Laminates is
expected to remain buoyant. The Indian Plywood and panel market is estimated around Rs. 10000 crores, with
expected growth of 20% year on year basis. The market is highly fragmented, with unorganised sector
27
controlling major market share. The organised segment is highly concentrated, with only few players
constituting around 25% of the market. The unorganised segment has advantages in terms of excise waivers
and other benefits due to their SSI status. In the year 2007-08 the excise duty on plywood related products
was reduced by half to 8% and is now pegged at 10% in the recent budget. Narrowing excise differences and
the eligibility to claim MODVAT benefits on inputs have put the organised sector not only at par compared
to the unorganised sector, but also in an advantageous position due to volume, quality and the brand. Now
the growth of organised sector is estimated to be 30% compared to the overall market growth of 20%.
Organised sector growth will partly come from conversion of some of unorganised sector players as organised
sector players.
Cheap imported products particularly Chinese products may eat away organised sector market and hence slow
down company’s growth. Emergence of new organised players will increase competition in organised sector.
The Company is India’s leading plywood manufacturing company with a very strong brand image. “CENTURY
PLY” – the brand name under which the Company markets its products is known for quality. The company
manufactures entire range of products, catering to different cost segments. Over the years the company had
invested heavily on brand building and maintained customer faith by providing guarantee on its products. The
company could ward off competition from other players and imported products due to these reasons and expect
to sustain its growth levels and continue to command market dominance. The Company, with its 5 units spread
over different geographical locations of the country is ready to meet present and future demand of the products
across the country with a huge logistical advantage. The company is prepared to meet increased demand through
organic expansions at its existing units and will also be open to inorganic growth through mergers and
acquisitions. Future expansions will be synchronised with the demand.
Laminate is used to provide aesthetic look to plywood. Its market scenario goes along-with plywood market
scenario. Like plywood, company is aspiring to achieve utmost customer confidence for its laminates and as such
is focusing more on quality then quantity.
Ferro Alloy
In view of potential growth of housing and infrastructure, the overall demand for Ferro alloy which is one of
the ingredients of steel is expected to remain buoyant. The Indian steel capacity which at present is 73 million
tonnes per annum is expected to grow to 293 million tonnes per annum by the year 2020.
Ferro Alloy market is dependent on steel market and witnesses short cycles of boom and bust, which can happen
more than once in one financial year. During boom period demand is at peak and industry makes handsome
profit. When demand dampens the price of product comes down and it become unviable to keep production on.
The company’s ferro alloy unit is situated in Meghalaya, where there is abundant availability of raw material and
the unit is entitled to various fiscal incentives as per north east policy of Central and State Governments. The only
problem which can disrupt production is availability of power, as production process of ferro alloy is highly power
intensive and supply of power in Meghalaya is not comfortable. In order to combat this problem, the company
has installed a captive power plant to ensure un-interrupted production. When the demand of ferro alloy dampens,
the company stops ferro alloy production and start to sell power generated out of its captive power unit. This
helps company to recover its overheads and ensure overall yearly performance of the ferro alloy division.
Cement
In view of potential growth of housing and infrastructure, the overall demand for Cement, which is basic to any
construction project, is expected to remain tilted towards demand.
The company’s major subsidiary Cement Manufacturing Company Limited (CMCL), along with its subsidiaries,
has the cement and clinker units situated at Lumshnong in Meghalaya. CMCL sells its cement under the brand
28
name ‘STAR CEMENT’. STAR CEMENT is today the leading and the highest selling cement brand in the
North Eastern part of the country. This unit has the advantage of its own captive lime stone mines and is situated
at a close proximity of large reserves of coal at a distance of only 25 kms. CMCL’s lime stone mines has reserves
of 300 Million Tonnes, enough to meet all its’ raw material requirements ( based on expanded capacity) for the
next 70 years. The unit is also entitled to various fiscal incentives as per the North East policy of the Central
Government and the State Government. The unit uses state of the art dry process rotary kiln technology and
manufactures high grade Ordinary Portland Cement (OPC), Pozzoland Portland Cement (PPC) and other
specialty grades required for infrastructure projects.
Cement is a highly localised/regionalised industry due to its unique characteristic of being a bulky but low
value product. Proximity to either source of raw material (limestone) or end market is imperative to keep
cost of end product (cement) competitive. Overall cement market of north east is estimated to be a 5 MTPA
against which the total cement production in north east is 3 MTPA, with the deficit being met from outside
north east. This demand supply mismatch and high logistic cost of bringing cement from outside north east
has resulted in north east being a high price-end market. Based on the developments envisaged to take place
in the North Eastern region the cement demand in the region is expected to grow at a CAGR of 12-15% per
annum. A big spurt in demand is also expected after two years when many of the Hydel Power Plants will
be launched in the North East, particularly in Arunachal Pradesh. At present CMCL cement unit is the
biggest cement unit of north east and has twin advantage of proximity to raw material and close proximity
to the highest price-end market. On comparison of peers it is found that CMCL EBIDTA margin is the
highest in the industry.
The present combined capacity of CMCL and its subsidiaries is now 1 MTPA of Cement. CMCL is also adding
further 1.75 MTPA Clinker capacity, through its wholly owned subsidiary Star Cement Meghalaya Limited.
The clinker so produced will be taken to CMCL’s proposed two grinding units at Guwahati (Assam) and
Kahalgaon (Bihar), where 3.20 MTPA OPC and Slag Cement will be produced. After effecting these
expansions, CMCL’s cement production capacity will go up from present 1 MTPA to 4.20 MTPA. The projects
are under implementation and are expected to commence production by September 2011. Meghalaya Power
Limited is setting up a 51 MW Power plant, which will be a captive power plant to its existing as well as
planned clinker unit of SCML. Both grinding units at Guwahati and Kahalgaon will also have captive power
plants of adequate capacity.
Cement is considered to be a cyclical industry. Addition of new capacities particularly in north east may tilt
industry more towards supply situation. Cement is highly capital intensive and fairly long gestation industry.
The expansion plans may make the company very high leveraged to face any demand set back.
With strong brand image and early mover advantages, the company does not expect to face any problem in near
and fairly distant future.
Logistic
The ports and international cargo handling facility are important part of physical infrastructure of a country. Ports
and cargo handling facilities play a crucial role in facilitating India’s international trade. India with a coastline
of 7,517 km. is added with 12 major ports and 60 non-major ports, which handle traffic. Average turnaround
time of Indian ports is 3.5 days compared to 10 hours in Hong Kong. This high turnaround time undermines the
competitiveness of Indian Ports. Congestion at ports is primarily due to the slow evacuation of cargo rather
than a lack of handling facility. More than half of the world’s traded goods are containerised and this is expected
to increase further. In order to decongest ports it is imperative that dwelling time of containers at ports is
decreased by developing Container Freight Stations, where containers can be moved after maximum decided
dwelling time. In order to decongest congested Kolkata Port, the Kolkata Port Trust is encouraging development
of Container Freight Stations.
29
The Company ventured into logistic business in the year 2001 when it entered into a partnership with the
Ministry of Commerce, Government of India, to turn-around a loss making and virtually non operational jetty
(minor port) at the Falta Export Processing Zone near Kolkata. Within one year of this arrangement the jetty was
turned fully operational and profitable. This jetty now handles both captive requirements of the company and
also extends it’s services to others. This jetty can now handle 1.50 lac tones of cargo every year.
Based on its experience of successful operation of jetty and encouraged by the Kolkata Port Trust (KPT) the
company ventured into the Container Freight Stations (CFS) business. Through a competitive bid, it has acquired
around 1 lac square meter land near Kolkata Port Trust to develop it’s CFS business. In view of the heavy
congestion at the Kolkata Port and the emerging opportunity in this sector the company has already established
a full fledged logistic division to develop this business segment. The company’s first private sector state of the
art CFS (consisting of approx 20,000 sq meter area) has already started operation in November 2008.
Development of another 80,000 sq meter area is already complete and about to commence operation. This
division will be able to handle 150000 20 feet containers annually.
The logistic business of the company is related to infrastructure and service sector. The business may face problem
only on slow down of economy and substantial reduction in import cargo. Entry of new players may expose the
company to competition. In view of prevailing congestion at Kolkata Port Trust and expected increase in traffic with
availability of limited CFS facility the company does not expect to face any problem in near and fairly distant future.
Others
Other segments consist mainly of trading in chemicals and minerals, where business call is taken on the basis
of profitability.
Segment-wise or product-wise performance
Plywood
The turnover of Plywood segment was up from Rs. 494.45 crores in 2008-09 to Rs. 592.25 crores in 2009-10
showing growth of over 19 %. The profit of this segment increased from Rs. 3.70 crores to Rs. 36.25 crores
showing growth of over 879%. This is mainly due to improved global markets and overall economy, especially
in the real estate sector.
Laminates
Laminate division also performed quite well. The company’s focus remained to grab premium market share.
The ‘CENTURYLAMINATES’ the brand under which company’s laminates are being sold is today a symbol
of quality and is attaining consumer preference. During current financial year this segment earned profit of
Rs. 10.11 crores.
Ferro Alloys & Power
Due to lack of demand and subdued prices, the Profit of this segment was reduced from Rs. 20.74 crores to
Rs. 1.59 crores.
Cement
The cement capacities run by company’s subsidiaries also posted impressive performance. The turnover
increased from Rs. 442.20 crores to Rs. 506.12 crores showing growth of over 14%. Segment profit increased
from Rs. 126.35 crores to Rs. 133.84 crores showing growth of over 5%.
Logistics
Logistics division also performed quite well. During current financial year this segment earned profit of
Rs. 7.80 crores.
30

Others
Other segments mainly chemicals also performed well during 2009-10.
Outlook
Your Company’s and its subsidiaries’ products are Plywood, Laminates, Cement and Ferro Alloys demand for
which is linked to infrastructure and real estate sector. In view of improved economic situation and the
Government’s thrust towards infrastructure and real estate activities, your company is hopeful to achieve better
results and attain growth. With modern plants, latest technologies, and precious brands the products of your
company are positioned to fully exploit emerging opportunities.
Risks and Concerns
Your Company has a comprehensive risk management policy. The risk policy provides for identification of risk,
its assessment and procedures to minimize risk. The risk policy is periodically reviewed by the Audit Committee
to ensure that the executive management controls the risk as per decided policy.
Some of the key risks affecting your Company are illustrated below:
Foreign Exchange Risk
Your Company’s imports exceed exports. At any given time your company has substantial foreign exchange
liability. Adverse fluctuations as happened in financial year 2008-09 may expose company to substantial
foreign exchange risk. The company has policy of reviewing foreign exchange risk on regular basis and decide
about hedging as per situation prevailing and predicted. In adverse times company defer its forex liabilities by
availing buyers’ credits overseas, thereby avoiding immediate exchange losses and availing credits at very
low interest rates.
Interest Rate Risk
Your Company is exposed to interest rate fluctuations on its borrowings. Your Company uses a judicious mix
of fixed, floating, domestic and overseas debts within the permissible parameters. Your company has been able
to negotiate the debts at most competitive rates due to its reputation, compliance record, high ratings and
satisfactory performance.
Manpower retention Risk
Your Company has a wide marketing network spread across the country. Your company deals in consumer
goods through large dealers’ network and has to maintain large marketing and administrative team. Your
company can not be an exception to man power attrition. Your Company has devised a stimulative HR policy
and performance based incentive system to address this.
Government Policy Change Risk
Changes in Government Policies especially with respect to Custom Duty and Excise Duty may affect the
operations of your Company. However, in recent past, the Government’s Policies have remained favourable to
the industry and company’s product segments.
Internal control system and their adequacy
The Company has adequate and effective internal control system, which are continuously reviewed for their
effectiveness. The systems are periodically reviewed and corrective measures are taken to further strengthen
them. The Company has double Certifications ISO –9001 (Quality Systems) and ISO 14001 (Environment
Management Systems) from Det Norske Veritas (DNV). The Company has implemented SAP (ERP Solution)
for integrated and online information system, across all locations.
31
Discussion on financial performance with respect to operational performance
During the financial year the total income of your company increased from Rs. 761.32 crores to Rs. 849.82 crores
reflecting growth of over 11%. Profit before Tax increased from Rs. 8.14 crores last year to Rs. 96.48 crores this
year reflecting growth of over 1085%. The increase in income reflects company’s operational efficiency and
increasing market share of its products.
Material developments in Human Resources/Industrial Relation front, including number of people employed.
The Company strictly adheres to ISO 9001:2000 mandated training. All employees receive on going learning
opportunities through customized programs that are designed in-house. Company encourages its employees to
attend outside seminars. The employees are encouraged to offer constructive suggestions for improvement in
their respective areas which are thoroughly discussed in departmental meetings. Employees are covered by
incentive system encouraging them to perform to their best.
The company maintains absolute harmony with its work force. Since inception there has not been even a single
instance of strike or lock-out at any of the company’s manufacturing establishments.
The total manpower strength of the Company as on 31st March, 2010 was 3845.
Cautionary Statement
The statements in the “Management Discussion and Analysis Report” section describing the Company’s
objectives, projections, estimates, expectations and predictions may be “forward looking statements”. All
statements that address expectation or projections about the future, including but not limited to statements about
the company’s strategy for growth, product development, market position, expenditures and financial results are
based on certain assumptions and expectations of future events. The company can not guarantee that these
assumptions and expectations are accurate or will be realized. The company’s actual results, performance or
achievement may thus differ materially from those projected in such forward looking statements. The company
assumes no responsibility to publicly amend, modify or revise any forward looking statement on the basis of
any subsequent developments, information or event.
For and on behalf of the Board of Directors
Sajjan Bhajanka Hari Prasad Agarwal
Managing Director Executive Director
Kolkata, 28th May, 2010
32

AUDITORS' REPORT
TO THE MEMBERS OF CENTURY PLYBOARDS (INDIA) LIMITED
1. We have audited the attached Balance Sheet of CENTURY PLYBOARDS (INDIA) LIMITED as at
31st March, 2010 and also the Profit & Loss Account and Cash Flow Statement for the year ended on that
date, annexed thereto. These financial statements are the responsibility of the Company’s management.
Our responsibility is to express an opinion on these financial statements based on our audit.
2. We conducted our audit in accordance with the auditing standards generally accepted in India. Those
standards require that we plan and perform the audit to obtain reasonable assurance about whether the
financial statements are free of material misstatement. An audit includes examining, on a test basis, evidence
supporting the amounts and disclosures in the financial statements. An audit also includes assessing the
accounting principles used and significant estimates made by the management, as well as evaluating the
overall financial statement presentation. We believe that our audit provides a reasonable basis for our opinion.
3. As required by the Companies (Auditor’s Report) Order, 2003 (as amended) issued by the Central
Government of India in terms of sub-section (4A) of Section 227 of the Companies Act, 1956, we enclose
in the Annexure a statement on the matters specified in paragraphs 4 and 5 of the said Order.
4. Attention is drawn to Note No. 18 on Schedule – V regarding exchange fluctuation gain of Rs. 1,895.79 lacs(net) (previous year loss of Rs. 2,724.86 lacs) towards creditors / debtors pertaining to specific segmentswhich has been included as unallocable expenses/income.In the previous year our report was similiarly modified for the above:
5. Further to our comments in the Annexure referred to above :–
(i) We have obtained all the information and explanations, which, to the best of our knowledge and belief,
were necessary for the purpose of our audit;
(ii) In our opinion, proper books of account as required by law have been kept by the Company so far as
appears from our examination of those books and proper returns adequate for the purposes of our audit
have been received from sales branches not visited by us. The Branch Auditor’s Report(s) in respect of
Plywood units at Chennai, Karnal & Guwahati and Ferro Alloy unit at Meghalaya have been forwarded
to us and have been appropriately dealt with;
(iii) The Balance Sheet, Profit & Loss Account and Cash Flow statement dealt with by this report are in
agreement with the books of account and with the audited returns from the branches as submitted to us;
(iv) In our opinion, the Balance Sheet, Profit & Loss Account and Cash Flow Statement comply with the
Accounting Standards referred to in sub-section (3C) of section 211 of the Companies Act, 1956 exceptfor the matter referred to in para 4 above;
(v) On the basis of written representations received from the Directors as on 31st March, 2010 and taken on
record by the Board of Directors, we report that none of the directors is disqualified as on 31st March, 2010
from being appointed as Director in terms of Clause (g) of sub-section (1) of section 274 of the Companies Act, 1956.
(vi) In our opinion and to the best of our information and according to the explanations given to us, the said
statements of account, subject to para 4 above, which has no impact on the Company’s profit for the
year, give the information required by the Companies Act, 1956 in the manner so required and give a
true and fair view in conformity with the accounting principles generally accepted in India :–
(i) in the case of Balance Sheet, of the state of affairs of the Company as at 31st March, 2010.
(ii) in the case of Profit & Loss Account, of the profit of the Company for the year ended on that date; and
(iii) in the case of Cash Flow statement, of the cash flows for the year ended on that date.
For S. R. BATLIBOI & CO.
Firm Registration No- 301003E
Chartered Accountants
Per R. K. Agrawal
a PartnerMembership No. 16667
Kolkata, 28th May 2010
33
ANNEXURE TO THE AUDITORS' REPORT
[REFERRED TO IN OUR REPORT OF EVEN DATE TO THE MEMBERS OF CENTURY PLYBOARDS
(INDIA) LIMITED AS AT AND FOR THE YEAR ENDED 31ST MARCH, 2010]
i. (a) The Company has maintained proper records showing full particulars, including quantitative detailsand situation of fixed assets.
(b) All fixed assets have not been physically verified by the management during the year but there is aregular programme of verification of all fixed assets over a period of 3 years, which, in our opinion, isreasonable having regard to the size of the Company and the nature of its assets. As informed, no materialdiscrepancies were noticed on such verification.
(c) There was no substantial disposal of fixed assets during the year.
ii. (a) The management has conducted physical verification of inventory at reasonable intervals during the year
(b) The procedures of physical verification of inventory followed by the management are reasonable andadequate in relation to the size of the Company and the nature of its business.
(c) The Company is maintaining proper records of inventory and no material discrepancies were noticedon such physical verification.
iii. (a) The Company has granted loan to a Company covered in the register maintained under section 301 ofthe Companies Act, 1956. The maximum amount involved during the year was Rs. 1,300 lacs and theyear – end balance of loans granted to such party was Rs. Nil.
(b) In our opinion and according to the information and explanations given to us, the rate of interest andother terms and conditions for such loan are not prima facie prejudicial to the interest of the Company.
(c) There were no stipulation for repayments in respect of above loan but the same was stated to be repayableon demand. However, the above loan was fully received back during the year. The payment of interestwith respect to the above loan had been regular.
(d) The Company has taken loans from six companies covered in the register maintained under section 301 ofthe Companies Act, 1956. The maximum outstanding amount of such loans during the year was Rs. 5,637.71lacs and the year-end balance due to such parties was Rs. 1,778.80 lacs.
(e) In our opinion and according to the information and explanations given to us, the rate of interest andother terms and conditions for such loans are not prima facie prejudicial to the interest of the Company.
(f) There are no stipulations for repayment of the above loans but the same are repayable on demand. Asinformed, the lenders have not demanded repayment of any such loan during the year and thus, therehas been no default on the part of the Company. Further, interest on the above loans, as informed, wasregularly paid by the Company.
iv. In our opinion and according to the information and explanations given to us, there is an adequate internal controlsystem commensurate with the size of the Company and the nature of its business, for the purchase of inventoryand fixed assets and for the sale of goods and services. During the course of our audit, no major weakness has beennoticed in the internal control system in respect of these areas. During the course of our audit, we have not observedany continuing failure to correct major weakness in internal control system of the Company.
v. (a) According to the information and explanations provided by the management, we are of the opinion thatthe particulars of contracts or arrangements referred to in section 301 of the Companies Act, 1956 thatneed to be entered into the register maintained under the above section, have been so entered
(b) In our opinion and according to the information and explanations given to us, the transactions made inpursuance of such contracts or arrangements exceeding the value of Rupees five lakhs entered into duringthe financial year, are at prices which are reasonable having regard to the prevailing market prices at therelevant time.
vi. The Company has not accepted any deposit from the public.
vii. In our opinion, the Company has an internal audit system commensurate with the size and nature of its business.
viii .We have broadly reviewed the books of accounts maintained by the Company pursuant to the rules madeby the Central Government for the maintenance of cost records under section 209(1)(d) of the CompaniesAct, 1956 in respect of Power Generation and are of the opinion that prima facie, the prescribed accountsand records have been made and maintained.
ix. (a) The Company has generally been regular in depositing undisputed statutory dues including provident fund,
investor education and protection fund, employees’ state insurance, income-tax, sales-tax, wealth-tax,
service tax, custom duty, excise duty, cess and other statutory dues with appropriate authorities thoughthere had been slight delays in certain cases.
34
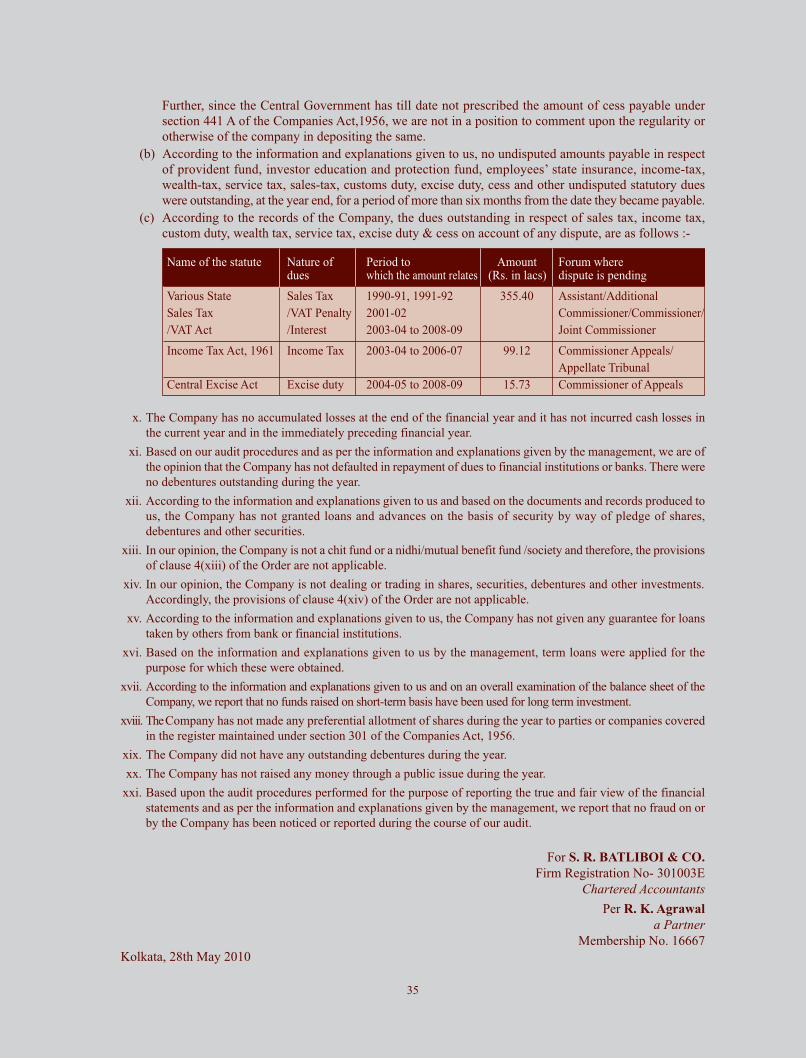
Further, since the Central Government has till date not prescribed the amount of cess payable under
section 441 A of the Companies Act,1956, we are not in a position to comment upon the regularity or
otherwise of the company in depositing the same.
(b) According to the information and explanations given to us, no undisputed amounts payable in respect
of provident fund, investor education and protection fund, employees’ state insurance, income-tax,
wealth-tax, service tax, sales-tax, customs duty, excise duty, cess and other undisputed statutory dues
were outstanding, at the year end, for a period of more than six months from the date they became payable.
(c) According to the records of the Company, the dues outstanding in respect of sales tax, income tax,
custom duty, wealth tax, service tax, excise duty & cess on account of any dispute, are as follows :-
x. The Company has no accumulated losses at the end of the financial year and it has not incurred cash losses in
the current year and in the immediately preceding financial year.
xi. Based on our audit procedures and as per the information and explanations given by the management, we are of
the opinion that the Company has not defaulted in repayment of dues to financial institutions or banks. There were
no debentures outstanding during the year.
xii. According to the information and explanations given to us and based on the documents and records produced to
us, the Company has not granted loans and advances on the basis of security by way of pledge of shares,
debentures and other securities.
xiii. In our opinion, the Company is not a chit fund or a nidhi/mutual benefit fund /society and therefore, the provisions
of clause 4(xiii) of the Order are not applicable.
xiv. In our opinion, the Company is not dealing or trading in shares, securities, debentures and other investments.
Accordingly, the provisions of clause 4(xiv) of the Order are not applicable.
xv. According to the information and explanations given to us, the Company has not given any guarantee for loans
taken by others from bank or financial institutions.
xvi. Based on the information and explanations given to us by the management, term loans were applied for the
purpose for which these were obtained.
xvii. According to the information and explanations given to us and on an overall examination of the balance sheet of the
Company, we report that no funds raised on short-term basis have been used for long term investment.
xviii. The Company has not made any preferential allotment of shares during the year to parties or companies covered
in the register maintained under section 301 of the Companies Act, 1956.
xix. The Company did not have any outstanding debentures during the year.
xx. The Company has not raised any money through a public issue during the year.
xxi. Based upon the audit procedures performed for the purpose of reporting the true and fair view of the financial
statements and as per the information and explanations given by the management, we report that no fraud on or
by the Company has been noticed or reported during the course of our audit.
For S. R. BATLIBOI & CO.
Firm Registration No- 301003E
Chartered AccountantsPer R. K. Agrawal
a PartnerMembership No. 16667
Kolkata, 28th May 2010
Name of the statute Nature of Period to Amount Forum wheredues which the amount relates (Rs. in lacs) dispute is pending
Various State Sales Tax 1990-91, 1991-92 355.40 Assistant/Additional
Sales Tax /VAT Penalty 2001-02 Commissioner/Commissioner/
/VAT Act /Interest 2003-04 to 2008-09 Joint Commissioner
Income Tax Act, 1961 Income Tax 2003-04 to 2006-07 99.12 Commissioner Appeals/
Appellate Tribunal
Central Excise Act Excise duty 2004-05 to 2008-09 15.73 Commissioner of Appeals
35
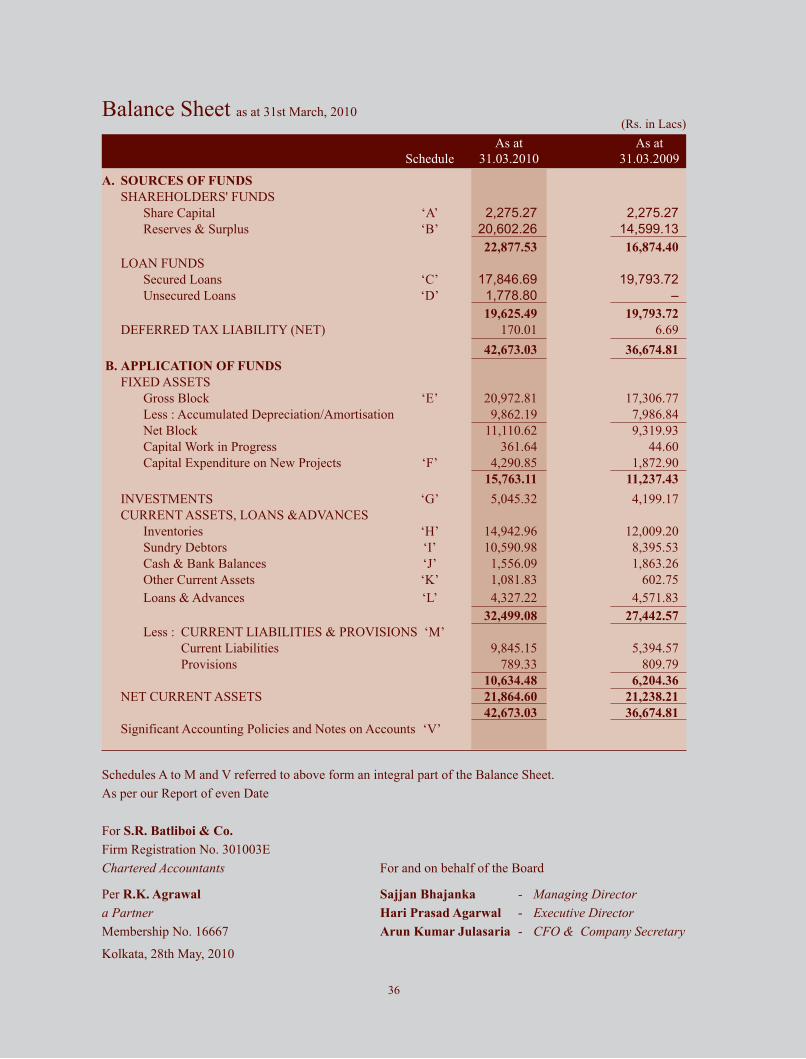
Balance Sheet as at 31st March, 2010(Rs. in Lacs)
As at As at
Schedule 31.03.2010 31.03.2009
A. SOURCES OF FUNDS
SHAREHOLDERS' FUNDS
Share Capital ‘A’ 2,275.27 2,275.27
Reserves & Surplus ‘B’ 20,602.26 14,599.13
22,877.53 16,874.40
LOAN FUNDS
Secured Loans ‘C’ 17,846.69 19,793.72
Unsecured Loans ‘D’ 1,778.80 –
19,625.49 19,793.72
DEFERRED TAX LIABILITY (NET) 170.01 6.69
42,673.03 36,674.81
B. APPLICATION OF FUNDS
FIXED ASSETS
Gross Block ‘E’ 20,972.81 17,306.77
Less : Accumulated Depreciation/Amortisation 9,862.19 7,986.84
Net Block 11,110.62 9,319.93
Capital Work in Progress 361.64 44.60
Capital Expenditure on New Projects ‘F’ 4,290.85 1,872.90
15,763.11 11,237.43
INVESTMENTS ‘G’ 5,045.32 4,199.17
CURRENT ASSETS, LOANS &ADVANCES
Inventories ‘H’ 14,942.96 12,009.20
Sundry Debtors ‘I’ 10,590.98 8,395.53
Cash & Bank Balances ‘J’ 1,556.09 1,863.26
Other Current Assets ‘K’ 1,081.83 602.75
Loans & Advances ‘L’ 4,327.22 4,571.83
32,499.08 27,442.57
Less : CURRENT LIABILITIES & PROVISIONS ‘M’
Current Liabilities 9,845.15 5,394.57
Provisions 789.33 809.79
10,634.48 6,204.36
NET CURRENT ASSETS 21,864.60 21,238.21
42,673.03 36,674.81
Significant Accounting Policies and Notes on Accounts ‘V’
Schedules A to M and V referred to above form an integral part of the Balance Sheet.
As per our Report of even Date
For S.R. Batliboi & Co.
Firm Registration No. 301003E
Chartered Accountants For and on behalf of the Board
Per R.K. Agrawal Sajjan Bhajanka - Managing Directora Partner Hari Prasad Agarwal - Executive DirectorMembership No. 16667 Arun Kumar Julasaria - CFO & Company Secretary
Kolkata, 28th May, 2010
36
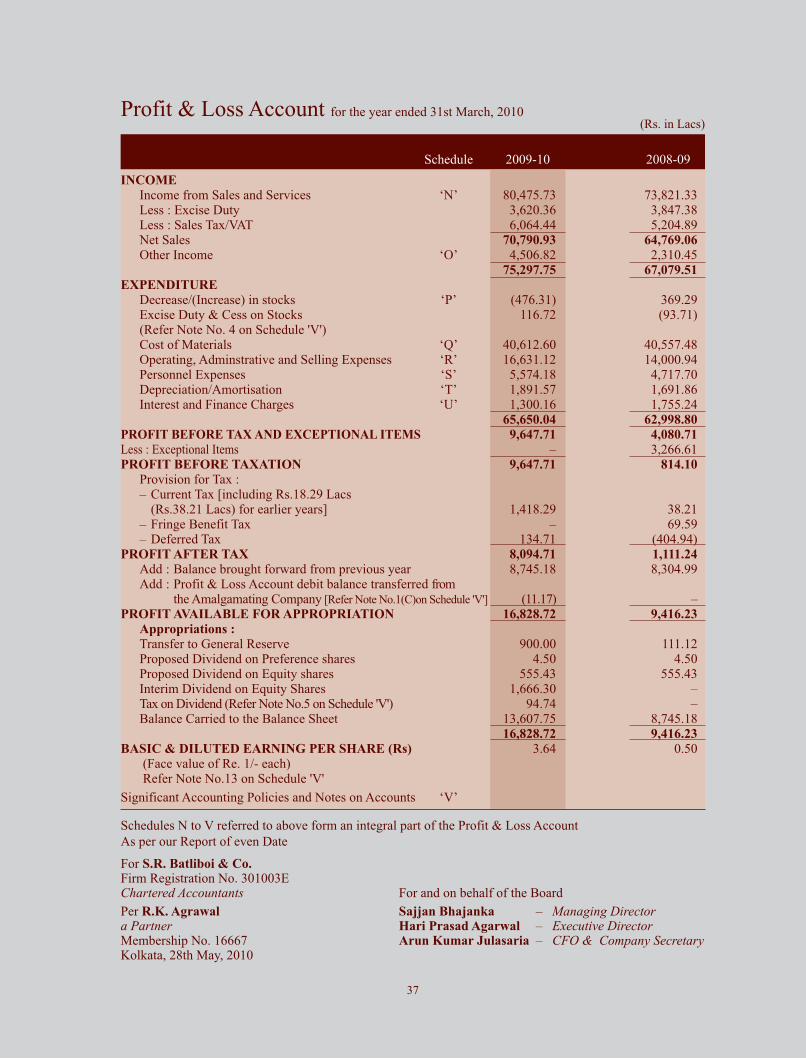
(Rs. in Lacs)
Schedules N to V referred to above form an integral part of the Profit & Loss Account
As per our Report of even Date
For S.R. Batliboi & Co.Firm Registration No. 301003EChartered Accountants For and on behalf of the Board
Per R.K. Agrawal Sajjan Bhajanka – Managing Directora Partner Hari Prasad Agarwal – Executive DirectorMembership No. 16667 Arun Kumar Julasaria – CFO & Company SecretaryKolkata, 28th May, 2010
Profit & Loss Account for the year ended 31st March, 2010
37
Schedule 2009-10 2008-09
INCOME
Income from Sales and Services ‘N’ 80,475.73 73,821.33Less : Excise Duty 3,620.36 3,847.38Less : Sales Tax/VAT 6,064.44 5,204.89Net Sales 70,790.93 64,769.06
Other Income ‘O’ 4,506.82 2,310.4575,297.75 67,079.51
EXPENDITURE
Decrease/(Increase) in stocks ‘P’ (476.31) 369.29Excise Duty & Cess on Stocks 116.72 (93.71)(Refer Note No. 4 on Schedule 'V')Cost of Materials ‘Q’ 40,612.60 40,557.48Operating, Adminstrative and Selling Expenses ‘R’ 16,631.12 14,000.94Personnel Expenses ‘S’ 5,574.18 4,717.70Depreciation/Amortisation ‘T’ 1,891.57 1,691.86Interest and Finance Charges ‘U’ 1,300.16 1,755.24
65,650.04 62,998.80
PROFIT BEFORE TAX AND EXCEPTIONAL ITEMS 9,647.71 4,080.71
Less : Exceptional Items – 3,266.61PROFIT BEFORE TAXATION 9,647.71 814.10
Provision for Tax :– Current Tax [including Rs.18.29 Lacs
(Rs.38.21 Lacs) for earlier years] 1,418.29 38.21– Fringe Benefit Tax – 69.59– Deferred Tax 134.71 (404.94)
PROFIT AFTER TAX 8,094.71 1,111.24
Add : Balance brought forward from previous year 8,745.18 8,304.99Add : Profit & Loss Account debit balance transferred from
the Amalgamating Company [Refer Note No.1(C)on Schedule 'V'] (11.17) –PROFIT AVAILABLE FOR APPROPRIATION 16,828.72 9,416.23
Appropriations :
Transfer to General Reserve 900.00 111.12Proposed Dividend on Preference shares 4.50 4.50Proposed Dividend on Equity shares 555.43 555.43Interim Dividend on Equity Shares 1,666.30 –Tax on Dividend (Refer Note No.5 on Schedule 'V') 94.74 –Balance Carried to the Balance Sheet 13,607.75 8,745.18
16,828.72 9,416.23
BASIC & DILUTED EARNING PER SHARE (Rs) 3.64 0.50(Face value of Re. 1/- each) Refer Note No.13 on Schedule 'V'
Significant Accounting Policies and Notes on Accounts ‘V’
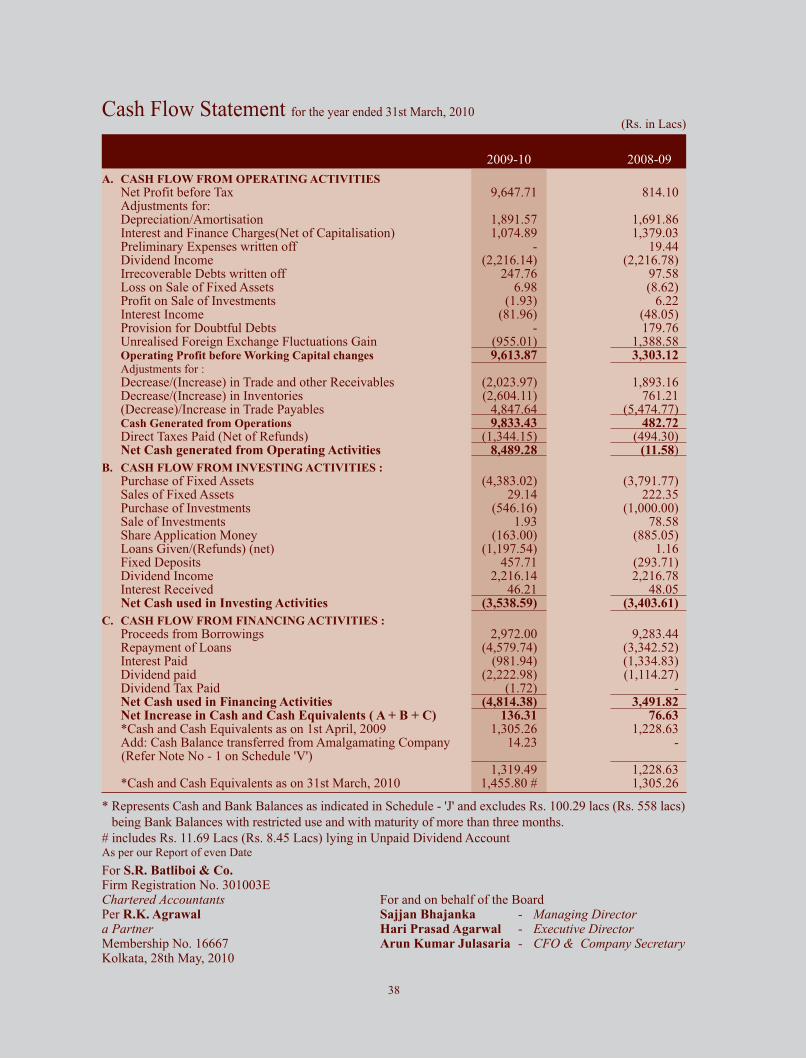
* Represents Cash and Bank Balances as indicated in Schedule - 'J' and excludes Rs. 100.29 lacs (Rs. 558 lacs)
being Bank Balances with restricted use and with maturity of more than three months.
# includes Rs. 11.69 Lacs (Rs. 8.45 Lacs) lying in Unpaid Dividend AccountAs per our Report of even Date
For S.R. Batliboi & Co.Firm Registration No. 301003EChartered Accountants For and on behalf of the BoardPer R.K. Agrawal Sajjan Bhajanka - Managing Directora Partner Hari Prasad Agarwal - Executive DirectorMembership No. 16667 Arun Kumar Julasaria - CFO & Company SecretaryKolkata, 28th May, 2010
(Rs. in Lacs)Cash Flow Statement for the year ended 31st March, 2010
38
2009-10 2008-09
A. CASH FLOW FROM OPERATING ACTIVITIES
Net Profit before Tax 9,647.71 814.10Adjustments for:Depreciation/Amortisation 1,891.57 1,691.86Interest and Finance Charges(Net of Capitalisation) 1,074.89 1,379.03Preliminary Expenses written off - 19.44Dividend Income (2,216.14) (2,216.78)Irrecoverable Debts written off 247.76 97.58Loss on Sale of Fixed Assets 6.98 (8.62)Profit on Sale of Investments (1.93) 6.22 Interest Income (81.96) (48.05)Provision for Doubtful Debts - 179.76Unrealised Foreign Exchange Fluctuations Gain (955.01) 1,388.58Operating Profit before Working Capital changes 9,613.87 3,303.12Adjustments for :Decrease/(Increase) in Trade and other Receivables (2,023.97) 1,893.16Decrease/(Increase) in Inventories (2,604.11) 761.21(Decrease)/Increase in Trade Payables 4,847.64 (5,474.77)Cash Generated from Operations 9,833.43 482.72Direct Taxes Paid (Net of Refunds) (1,344.15) (494.30)Net Cash generated from Operating Activities 8,489.28 (11.58)
B. CASH FLOW FROM INVESTING ACTIVITIES :
Purchase of Fixed Assets (4,383.02) (3,791.77)Sales of Fixed Assets 29.14 222.35Purchase of Investments (546.16) (1,000.00)Sale of Investments 1.93 78.58Share Application Money (163.00) (885.05)Loans Given/(Refunds) (net) (1,197.54) 1.16Fixed Deposits 457.71 (293.71)Dividend Income 2,216.14 2,216.78 Interest Received 46.21 48.05Net Cash used in Investing Activities (3,538.59) (3,403.61)
C. CASH FLOW FROM FINANCING ACTIVITIES :
Proceeds from Borrowings 2,972.00 9,283.44Repayment of Loans (4,579.74) (3,342.52)Interest Paid (981.94) (1,334.83)Dividend paid (2,222.98) (1,114.27)Dividend Tax Paid (1.72) -Net Cash used in Financing Activities (4,814.38) 3,491.82Net Increase in Cash and Cash Equivalents ( A + B + C) 136.31 76.63*Cash and Cash Equivalents as on 1st April, 2009 1,305.26 1,228.63Add: Cash Balance transferred from Amalgamating Company 14.23 -(Refer Note No - 1 on Schedule 'V')
1,319.49 1,228.63 *Cash and Cash Equivalents as on 31st March, 2010 1,455.80 # 1,305.26
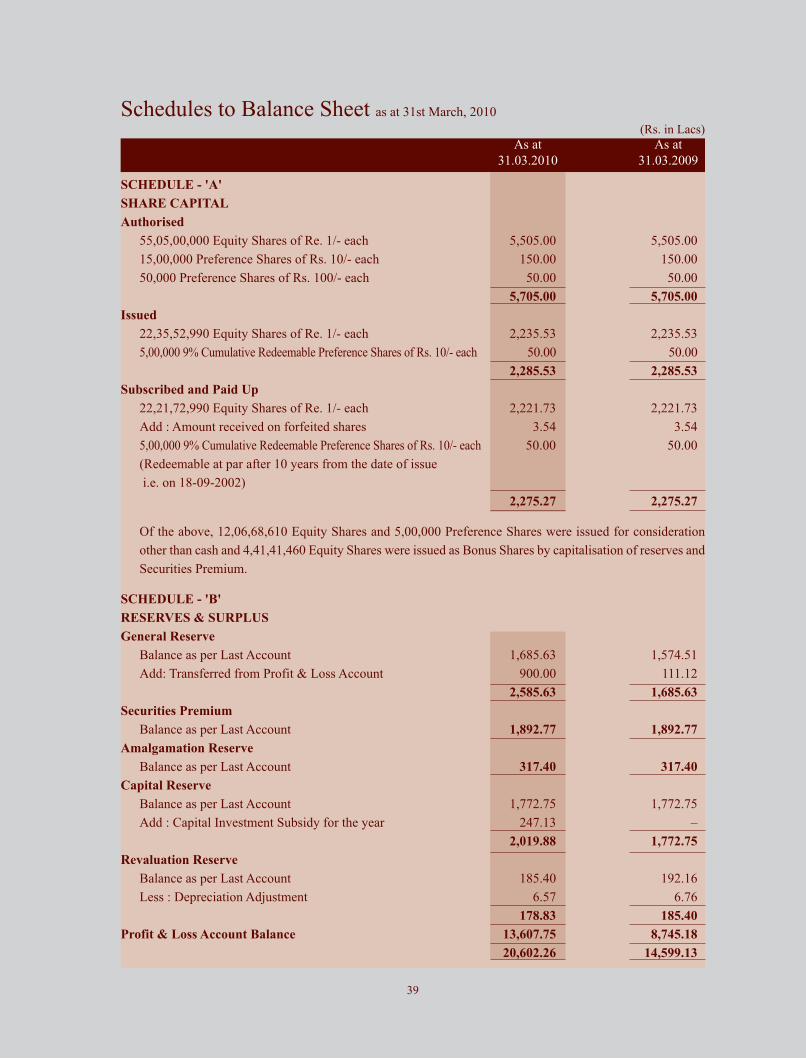
Schedules to Balance Sheet as at 31st March, 2010
(Rs. in Lacs)
39
As at As at
31.03.2010 31.03.2009
SCHEDULE - 'A'
SHARE CAPITAL
Authorised
55,05,00,000 Equity Shares of Re. 1/- each 5,505.00 5,505.00
15,00,000 Preference Shares of Rs. 10/- each 150.00 150.00
50,000 Preference Shares of Rs. 100/- each 50.00 50.00
5,705.00 5,705.00
Issued
22,35,52,990 Equity Shares of Re. 1/- each 2,235.53 2,235.53
5,00,000 9% Cumulative Redeemable Preference Shares of Rs. 10/- each 50.00 50.00
2,285.53 2,285.53
Subscribed and Paid Up
22,21,72,990 Equity Shares of Re. 1/- each 2,221.73 2,221.73
Add : Amount received on forfeited shares 3.54 3.54
5,00,000 9% Cumulative Redeemable Preference Shares of Rs. 10/- each 50.00 50.00
(Redeemable at par after 10 years from the date of issue
i.e. on 18-09-2002)
2,275.27 2,275.27
Of the above, 12,06,68,610 Equity Shares and 5,00,000 Preference Shares were issued for consideration
other than cash and 4,41,41,460 Equity Shares were issued as Bonus Shares by capitalisation of reserves and
Securities Premium.
SCHEDULE - 'B'
RESERVES & SURPLUS
General Reserve
Balance as per Last Account 1,685.63 1,574.51
Add: Transferred from Profit & Loss Account 900.00 111.12
2,585.63 1,685.63
Securities Premium
Balance as per Last Account 1,892.77 1,892.77
Amalgamation Reserve
Balance as per Last Account 317.40 317.40
Capital Reserve
Balance as per Last Account 1,772.75 1,772.75
Add : Capital Investment Subsidy for the year 247.13 –
2,019.88 1,772.75
Revaluation Reserve
Balance as per Last Account 185.40 192.16
Less : Depreciation Adjustment 6.57 6.76
178.83 185.40
Profit & Loss Account Balance 13,607.75 8,745.18
20,602.26 14,599.13
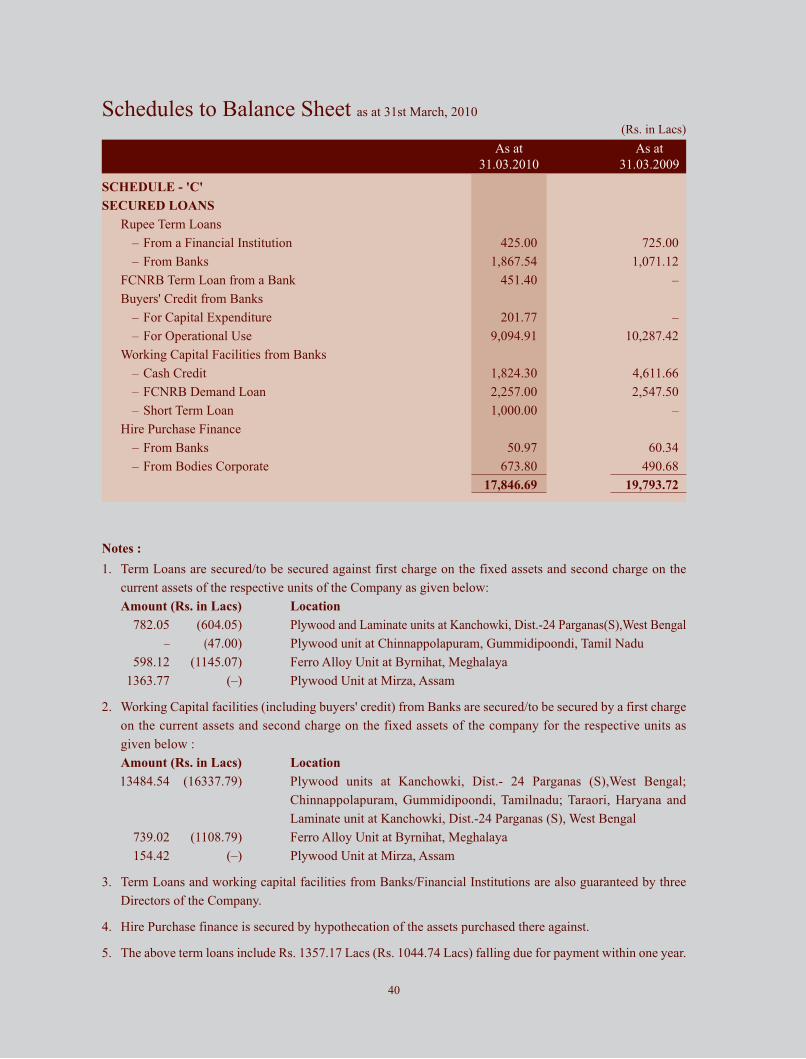
Schedules to Balance Sheet as at 31st March, 2010
(Rs. in Lacs)
As at As at
31.03.2010 31.03.2009
Notes :
1. Term Loans are secured/to be secured against first charge on the fixed assets and second charge on the
current assets of the respective units of the Company as given below:
Amount (Rs. in Lacs) Location
782.05 (604.05) Plywood and Laminate units at Kanchowki, Dist.-24 Parganas(S),West Bengal
– (47.00) Plywood unit at Chinnappolapuram, Gummidipoondi, Tamil Nadu
598.12 (1145.07) Ferro Alloy Unit at Byrnihat, Meghalaya
1363.77 (–) Plywood Unit at Mirza, Assam
2. Working Capital facilities (including buyers' credit) from Banks are secured/to be secured by a first charge
on the current assets and second charge on the fixed assets of the company for the respective units as
given below :
Amount (Rs. in Lacs) Location
13484.54 (16337.79) Plywood units at Kanchowki, Dist.- 24 Parganas (S),West Bengal;
Chinnappolapuram, Gummidipoondi, Tamilnadu; Taraori, Haryana and
Laminate unit at Kanchowki, Dist.-24 Parganas (S), West Bengal
739.02 (1108.79) Ferro Alloy Unit at Byrnihat, Meghalaya
154.42 (–) Plywood Unit at Mirza, Assam
3. Term Loans and working capital facilities from Banks/Financial Institutions are also guaranteed by three
Directors of the Company.
4. Hire Purchase finance is secured by hypothecation of the assets purchased there against.
5. The above term loans include Rs. 1357.17 Lacs (Rs. 1044.74 Lacs) falling due for payment within one year.
40
SCHEDULE - 'C'
SECURED LOANS
Rupee Term Loans
– From a Financial Institution 425.00 725.00
– From Banks 1,867.54 1,071.12
FCNRB Term Loan from a Bank 451.40 –
Buyers' Credit from Banks
– For Capital Expenditure 201.77 –
– For Operational Use 9,094.91 10,287.42
Working Capital Facilities from Banks
– Cash Credit 1,824.30 4,611.66
– FCNRB Demand Loan 2,257.00 2,547.50
– Short Term Loan 1,000.00 –
Hire Purchase Finance
– From Banks 50.97 60.34
– From Bodies Corporate 673.80 490.68
17,846.69 19,793.72
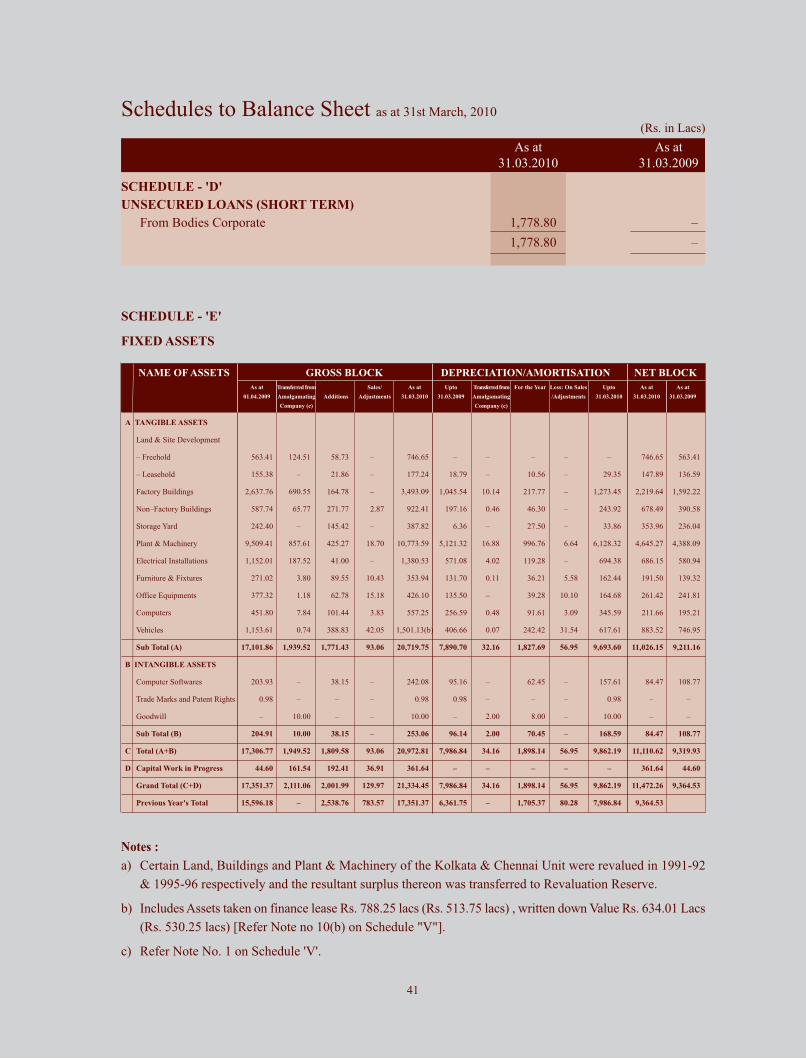
Schedules to Balance Sheet as at 31st March, 2010
(Rs. in Lacs)
Notes :
a) Certain Land, Buildings and Plant & Machinery of the Kolkata & Chennai Unit were revalued in 1991-92
& 1995-96 respectively and the resultant surplus thereon was transferred to Revaluation Reserve.
b) Includes Assets taken on finance lease Rs. 788.25 lacs (Rs. 513.75 lacs) , written down Value Rs. 634.01 Lacs
(Rs. 530.25 lacs) [Refer Note no 10(b) on Schedule "V"].
c) Refer Note No. 1 on Schedule 'V'.
NAME OF ASSETS GROSS BLOCK DEPRECIATION/AMORTISATION NET BLOCK
As at Transferred from Sales/ As at Upto Transferred from For the Year Less: On Sales Upto As at As at
01.04.2009 Amalgamating Additions Adjustments 31.03.2010 31.03.2009 Amalgamating /Adjustments 31.03.2010 31.03.2010 31.03.2009
Company (c) Company (c)
A TANGIBLE ASSETS
Land & Site Development
– Freehold 563.41 124.51 58.73 – 746.65 – – – – – 746.65 563.41
– Leasehold 155.38 – 21.86 – 177.24 18.79 – 10.56 – 29.35 147.89 136.59
Factory Buildings 2,637.76 690.55 164.78 – 3,493.09 1,045.54 10.14 217.77 – 1,273.45 2,219.64 1,592.22
Non–Factory Buildings 587.74 65.77 271.77 2.87 922.41 197.16 0.46 46.30 – 243.92 678.49 390.58
Storage Yard 242.40 – 145.42 – 387.82 6.36 – 27.50 – 33.86 353.96 236.04
Plant & Machinery 9,509.41 857.61 425.27 18.70 10,773.59 5,121.32 16.88 996.76 6.64 6,128.32 4,645.27 4,388.09
Electrical Installations 1,152.01 187.52 41.00 – 1,380.53 571.08 4.02 119.28 – 694.38 686.15 580.94
Furniture & Fixtures 271.02 3.80 89.55 10.43 353.94 131.70 0.11 36.21 5.58 162.44 191.50 139.32
Office Equipments 377.32 1.18 62.78 15.18 426.10 135.50 – 39.28 10.10 164.68 261.42 241.81
Computers 451.80 7.84 101.44 3.83 557.25 256.59 0.48 91.61 3.09 345.59 211.66 195.21
Vehicles 1,153.61 0.74 388.83 42.05 1,501.13(b) 406.66 0.07 242.42 31.54 617.61 883.52 746.95
Sub Total (A) 17,101.86 1,939.52 1,771.43 93.06 20,719.75 7,890.70 32.16 1,827.69 56.95 9,693.60 11,026.15 9,211.16
B INTANGIBLE ASSETS
Computer Softwares 203.93 – 38.15 – 242.08 95.16 – 62.45 – 157.61 84.47 108.77
Trade Marks and Patent Rights 0.98 – – – 0.98 0.98 – – – 0.98 – –
Goodwill – 10.00 – – 10.00 – 2.00 8.00 – 10.00 – –
Sub Total (B) 204.91 10.00 38.15 – 253.06 96.14 2.00 70.45 – 168.59 84.47 108.77
C Total (A+B) 17,306.77 1,949.52 1,809.58 93.06 20,972.81 7,986.84 34.16 1,898.14 56.95 9,862.19 11,110.62 9,319.93
D Capital Work in Progress 44.60 161.54 192.41 36.91 361.64 – – – – – 361.64 44.60
Grand Total (C+D) 17,351.37 2,111.06 2,001.99 129.97 21,334.45 7,986.84 34.16 1,898.14 56.95 9,862.19 11,472.26 9,364.53
Previous Year's Total 15,596.18 – 2,538.76 783.57 17,351.37 6,361.75 – 1,705.37 80.28 7,986.84 9,364.53
41
As at As at
31.03.2010 31.03.2009
SCHEDULE - 'D'
UNSECURED LOANS (SHORT TERM)
From Bodies Corporate 1,778.80 –
1,778.80 –
SCHEDULE - 'E'
FIXED ASSETS
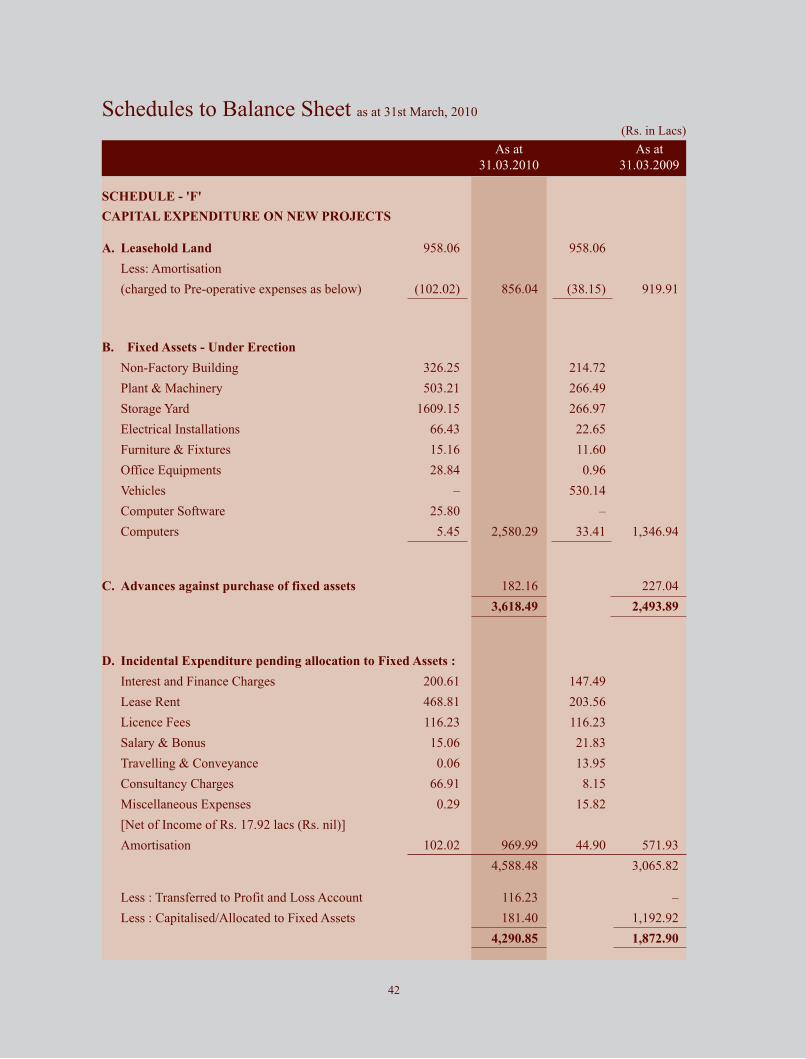
Schedules to Balance Sheet as at 31st March, 2010
(Rs. in Lacs)
42
As at As at
31.03.2010 31.03.2009
SCHEDULE - 'F'
CAPITAL EXPENDITURE ON NEW PROJECTS
A. Leasehold Land 958.06 958.06
Less: Amortisation
(charged to Pre-operative expenses as below) (102.02) 856.04 (38.15) 919.91
B. Fixed Assets - Under Erection
Non-Factory Building 326.25 214.72
Plant & Machinery 503.21 266.49
Storage Yard 1609.15 266.97
Electrical Installations 66.43 22.65
Furniture & Fixtures 15.16 11.60
Office Equipments 28.84 0.96
Vehicles – 530.14
Computer Software 25.80 –
Computers 5.45 2,580.29 33.41 1,346.94
C. Advances against purchase of fixed assets 182.16 227.04
3,618.49 2,493.89
D. Incidental Expenditure pending allocation to Fixed Assets :
Interest and Finance Charges 200.61 147.49
Lease Rent 468.81 203.56
Licence Fees 116.23 116.23
Salary & Bonus 15.06 21.83
Travelling & Conveyance 0.06 13.95
Consultancy Charges 66.91 8.15
Miscellaneous Expenses 0.29 15.82
[Net of Income of Rs. 17.92 lacs (Rs. nil)]
Amortisation 102.02 969.99 44.90 571.93
4,588.48 3,065.82
Less : Transferred to Profit and Loss Account 116.23 –
Less : Capitalised/Allocated to Fixed Assets 181.40 1,192.92
4,290.85 1,872.90
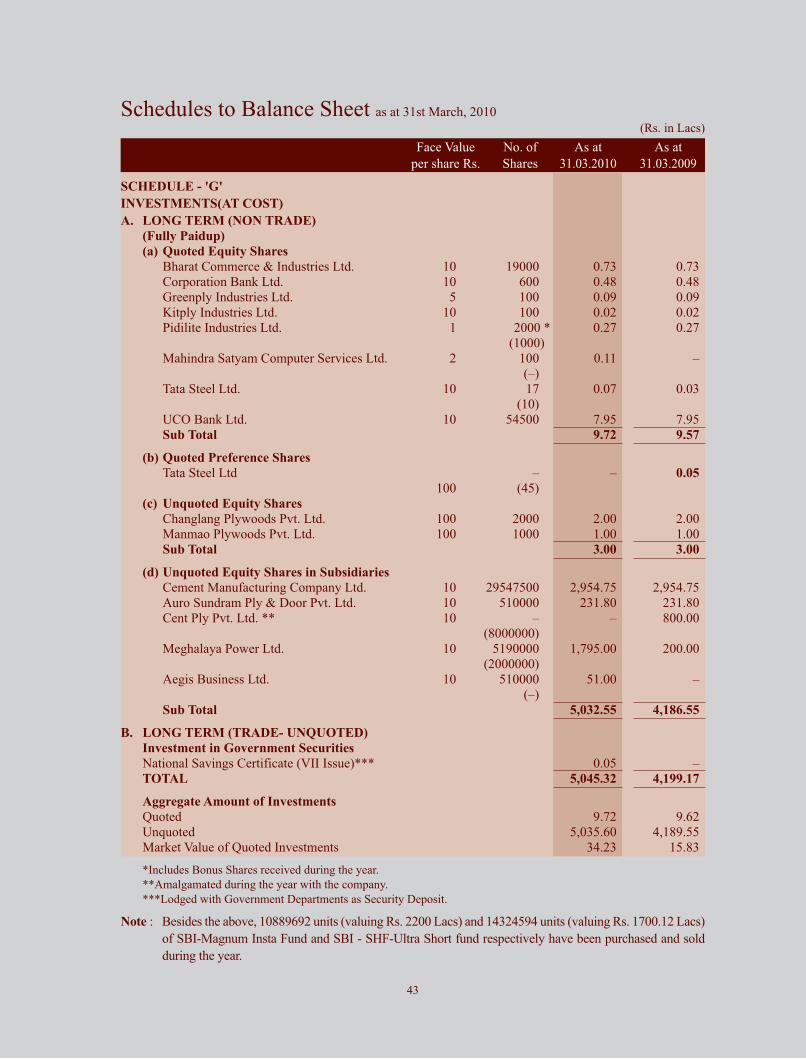
Schedules to Balance Sheet as at 31st March, 2010
(Rs. in Lacs)
Face Value No. of As at As at
per share Rs. Shares 31.03.2010 31.03.2009
SCHEDULE - 'G'
INVESTMENTS(AT COST)
A. LONG TERM (NON TRADE)
(Fully Paidup)
(a) Quoted Equity Shares
Bharat Commerce & Industries Ltd. 10 19000 0.73 0.73
Corporation Bank Ltd. 10 600 0.48 0.48
Greenply Industries Ltd. 5 100 0.09 0.09
Kitply Industries Ltd. 10 100 0.02 0.02
Pidilite Industries Ltd. 1 2000 * 0.27 0.27
(1000)
Mahindra Satyam Computer Services Ltd. 2 100 0.11 –
(–)
Tata Steel Ltd. 10 17 0.07 0.03
(10)
UCO Bank Ltd. 10 54500 7.95 7.95
Sub Total 9.72 9.57
(b) Quoted Preference Shares
Tata Steel Ltd – – 0.05
100 (45)
(c) Unquoted Equity Shares
Changlang Plywoods Pvt. Ltd. 100 2000 2.00 2.00
Manmao Plywoods Pvt. Ltd. 100 1000 1.00 1.00
Sub Total 3.00 3.00
(d) Unquoted Equity Shares in Subsidiaries
Cement Manufacturing Company Ltd. 10 29547500 2,954.75 2,954.75
Auro Sundram Ply & Door Pvt. Ltd. 10 510000 231.80 231.80
Cent Ply Pvt. Ltd. ** 10 – – 800.00
(8000000)
Meghalaya Power Ltd. 10 5190000 1,795.00 200.00
(2000000)
Aegis Business Ltd. 10 510000 51.00 –
(–)
Sub Total 5,032.55 4,186.55
B. LONG TERM (TRADE- UNQUOTED)
Investment in Government Securities
National Savings Certificate (VII Issue)*** 0.05 –
TOTAL 5,045.32 4,199.17
Aggregate Amount of Investments
Quoted 9.72 9.62
Unquoted 5,035.60 4,189.55
Market Value of Quoted Investments 34.23 15.83
*Includes Bonus Shares received during the year.
**Amalgamated during the year with the company.
***Lodged with Government Departments as Security Deposit.
Note : Besides the above, 10889692 units (valuing Rs. 2200 Lacs) and 14324594 units (valuing Rs. 1700.12 Lacs)
of SBI-Magnum Insta Fund and SBI - SHF-Ultra Short fund respectively have been purchased and sold
during the year.
43
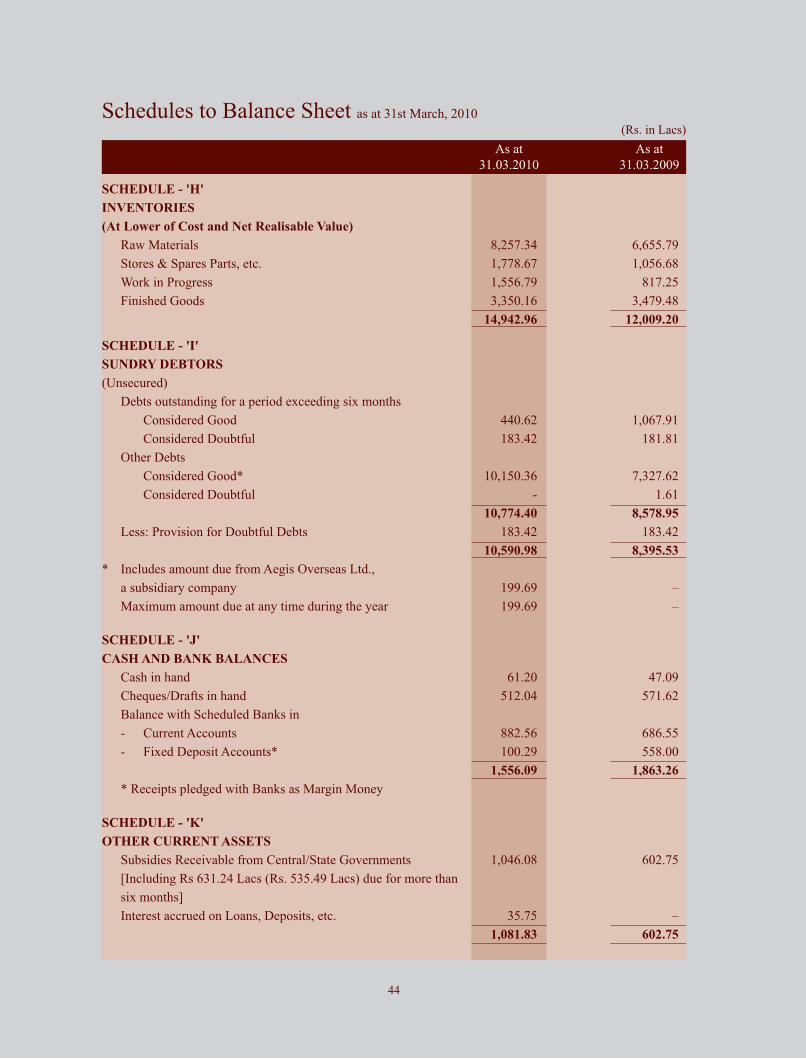
Schedules to Balance Sheet as at 31st March, 2010
(Rs. in Lacs)
As at As at
31.03.2010 31.03.2009
SCHEDULE - 'H'
INVENTORIES
(At Lower of Cost and Net Realisable Value)
Raw Materials 8,257.34 6,655.79
Stores & Spares Parts, etc. 1,778.67 1,056.68
Work in Progress 1,556.79 817.25
Finished Goods 3,350.16 3,479.48
14,942.96 12,009.20
SCHEDULE - 'I'
SUNDRY DEBTORS
(Unsecured)
Debts outstanding for a period exceeding six months
Considered Good 440.62 1,067.91
Considered Doubtful 183.42 181.81
Other Debts
Considered Good* 10,150.36 7,327.62
Considered Doubtful - 1.61
10,774.40 8,578.95
Less: Provision for Doubtful Debts 183.42 183.42
10,590.98 8,395.53
* Includes amount due from Aegis Overseas Ltd.,
a subsidiary company 199.69 –
Maximum amount due at any time during the year 199.69 –
SCHEDULE - 'J'
CASH AND BANK BALANCES
Cash in hand 61.20 47.09
Cheques/Drafts in hand 512.04 571.62
Balance with Scheduled Banks in
- Current Accounts 882.56 686.55
- Fixed Deposit Accounts* 100.29 558.00
1,556.09 1,863.26
* Receipts pledged with Banks as Margin Money
SCHEDULE - 'K'
OTHER CURRENT ASSETS
Subsidies Receivable from Central/State Governments 1,046.08 602.75
[Including Rs 631.24 Lacs (Rs. 535.49 Lacs) due for more than
six months]
Interest accrued on Loans, Deposits, etc. 35.75 –
1,081.83 602.75
44
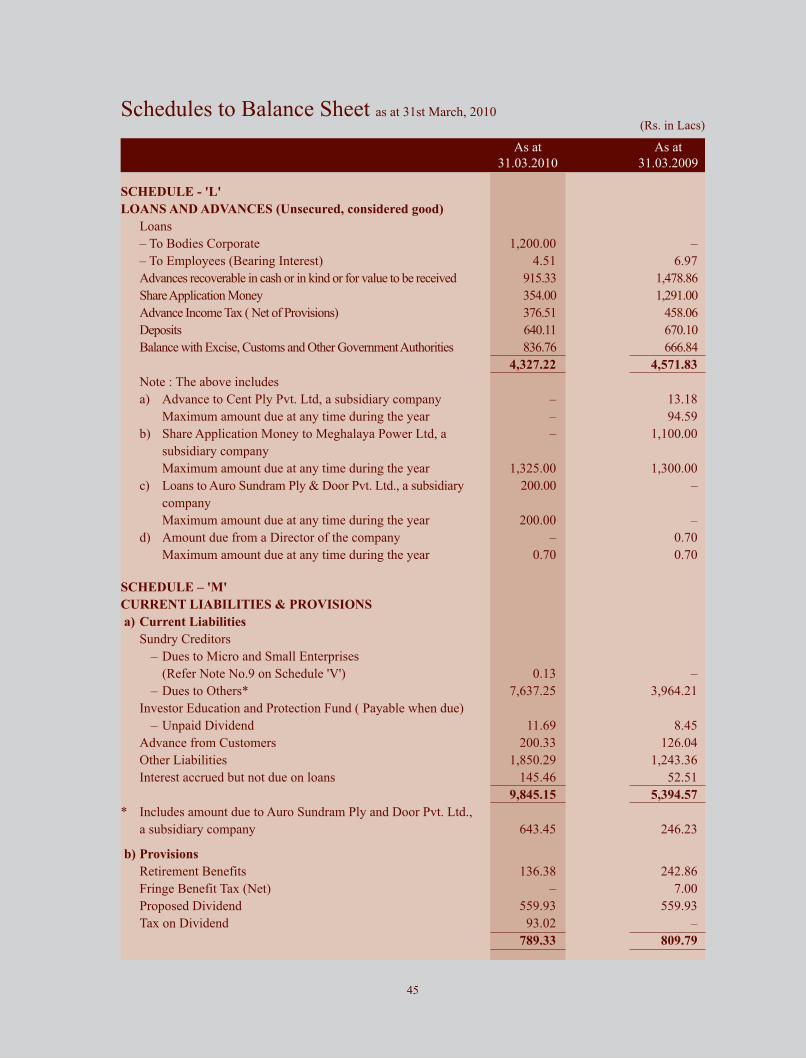
Schedules to Balance Sheet as at 31st March, 2010(Rs. in Lacs)
As at As at
31.03.2010 31.03.2009
SCHEDULE - 'L'
LOANS AND ADVANCES (Unsecured, considered good)
Loans
– To Bodies Corporate 1,200.00 –
– To Employees (Bearing Interest) 4.51 6.97
Advances recoverable in cash or in kind or for value to be received 915.33 1,478.86
Share Application Money 354.00 1,291.00
Advance Income Tax ( Net of Provisions) 376.51 458.06
Deposits 640.11 670.10
Balance with Excise, Customs and Other Government Authorities 836.76 666.84
4,327.22 4,571.83
Note : The above includes
a) Advance to Cent Ply Pvt. Ltd, a subsidiary company – 13.18
Maximum amount due at any time during the year – 94.59
b) Share Application Money to Meghalaya Power Ltd, a – 1,100.00
subsidiary company
Maximum amount due at any time during the year 1,325.00 1,300.00
c) Loans to Auro Sundram Ply & Door Pvt. Ltd., a subsidiary 200.00 –
company
Maximum amount due at any time during the year 200.00 –
d) Amount due from a Director of the company – 0.70
Maximum amount due at any time during the year 0.70 0.70
SCHEDULE – 'M'
CURRENT LIABILITIES & PROVISIONS
a) Current Liabilities
Sundry Creditors
– Dues to Micro and Small Enterprises
(Refer Note No.9 on Schedule 'V') 0.13 –
– Dues to Others* 7,637.25 3,964.21
Investor Education and Protection Fund ( Payable when due)
– Unpaid Dividend 11.69 8.45
Advance from Customers 200.33 126.04
Other Liabilities 1,850.29 1,243.36
Interest accrued but not due on loans 145.46 52.51
9,845.15 5,394.57
* Includes amount due to Auro Sundram Ply and Door Pvt. Ltd.,
a subsidiary company 643.45 246.23
b) Provisions
Retirement Benefits 136.38 242.86
Fringe Benefit Tax (Net) – 7.00
Proposed Dividend 559.93 559.93
Tax on Dividend 93.02 –
789.33 809.79
45
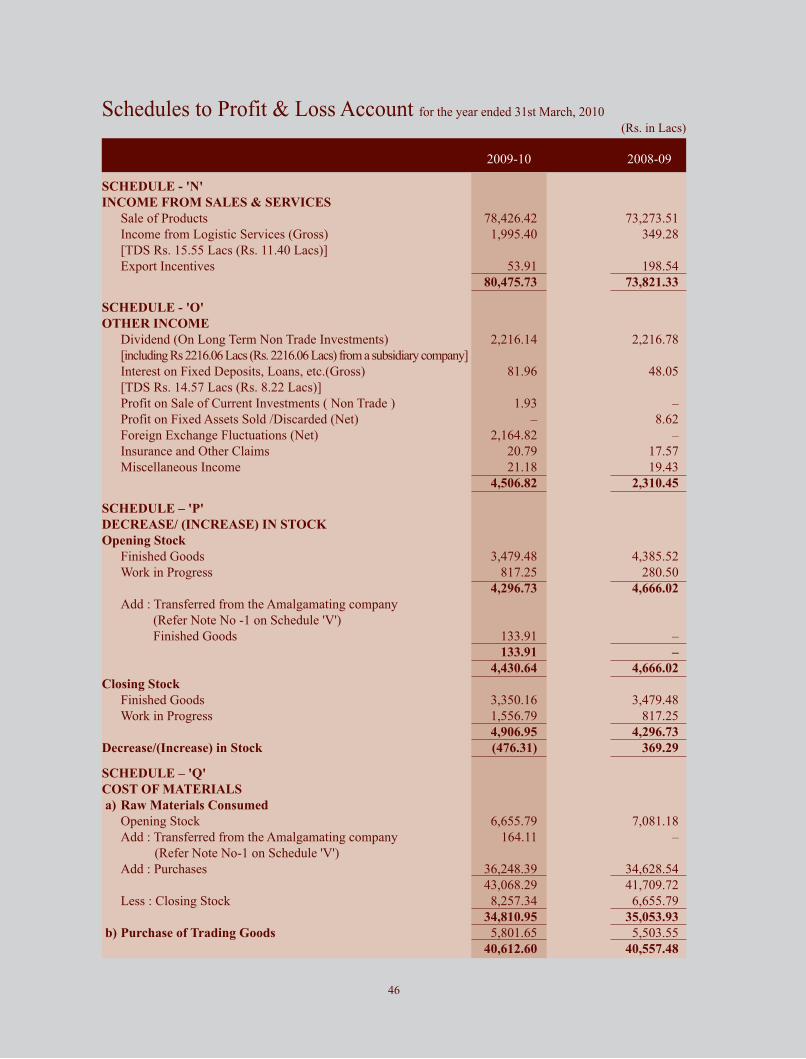
Schedules to Profit & Loss Account for the year ended 31st March, 2010
(Rs. in Lacs)
2009-10 2008-09
SCHEDULE - 'N'
INCOME FROM SALES & SERVICES
Sale of Products 78,426.42 73,273.51
Income from Logistic Services (Gross) 1,995.40 349.28
[TDS Rs. 15.55 Lacs (Rs. 11.40 Lacs)]
Export Incentives 53.91 198.54
80,475.73 73,821.33
SCHEDULE - 'O'
OTHER INCOME
Dividend (On Long Term Non Trade Investments) 2,216.14 2,216.78
[including Rs 2216.06 Lacs (Rs. 2216.06 Lacs) from a subsidiary company]
Interest on Fixed Deposits, Loans, etc.(Gross) 81.96 48.05
[TDS Rs. 14.57 Lacs (Rs. 8.22 Lacs)]
Profit on Sale of Current Investments ( Non Trade ) 1.93 –
Profit on Fixed Assets Sold /Discarded (Net) – 8.62
Foreign Exchange Fluctuations (Net) 2,164.82 –
Insurance and Other Claims 20.79 17.57
Miscellaneous Income 21.18 19.43
4,506.82 2,310.45
SCHEDULE – 'P'
DECREASE/ (INCREASE) IN STOCK
Opening Stock
Finished Goods 3,479.48 4,385.52
Work in Progress 817.25 280.50
4,296.73 4,666.02
Add : Transferred from the Amalgamating company
(Refer Note No -1 on Schedule 'V')
Finished Goods 133.91 –
133.91 –
4,430.64 4,666.02
Closing Stock
Finished Goods 3,350.16 3,479.48
Work in Progress 1,556.79 817.25
4,906.95 4,296.73
Decrease/(Increase) in Stock (476.31) 369.29
SCHEDULE – 'Q'
COST OF MATERIALS
a) Raw Materials Consumed
Opening Stock 6,655.79 7,081.18
Add : Transferred from the Amalgamating company 164.11 –
(Refer Note No-1 on Schedule 'V')
Add : Purchases 36,248.39 34,628.54
43,068.29 41,709.72
Less : Closing Stock 8,257.34 6,655.79
34,810.95 35,053.93
b) Purchase of Trading Goods 5,801.65 5,503.55
40,612.60 40,557.48
46
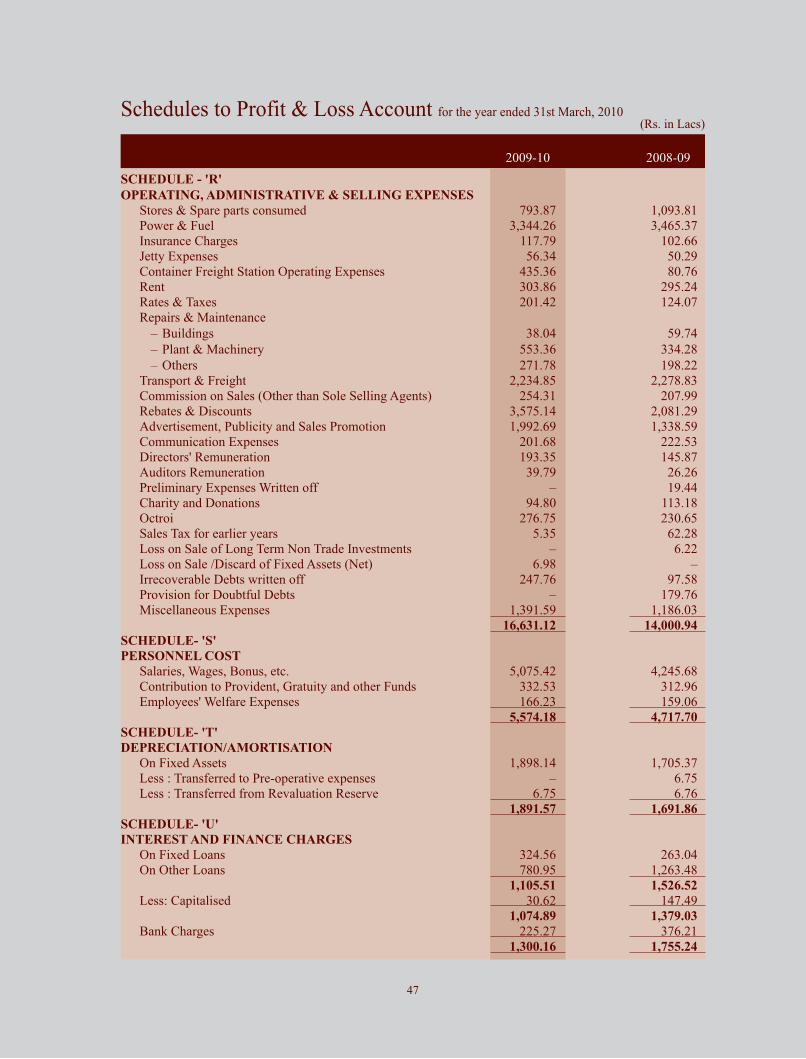
Schedules to Profit & Loss Account for the year ended 31st March, 2010(Rs. in Lacs)
2009-10 2008-09
SCHEDULE - 'R'
OPERATING, ADMINISTRATIVE & SELLING EXPENSES
Stores & Spare parts consumed 793.87 1,093.81
Power & Fuel 3,344.26 3,465.37
Insurance Charges 117.79 102.66
Jetty Expenses 56.34 50.29
Container Freight Station Operating Expenses 435.36 80.76
Rent 303.86 295.24
Rates & Taxes 201.42 124.07
Repairs & Maintenance
– Buildings 38.04 59.74
– Plant & Machinery 553.36 334.28
– Others 271.78 198.22
Transport & Freight 2,234.85 2,278.83
Commission on Sales (Other than Sole Selling Agents) 254.31 207.99
Rebates & Discounts 3,575.14 2,081.29
Advertisement, Publicity and Sales Promotion 1,992.69 1,338.59
Communication Expenses 201.68 222.53
Directors' Remuneration 193.35 145.87
Auditors Remuneration 39.79 26.26
Preliminary Expenses Written off – 19.44
Charity and Donations 94.80 113.18
Octroi 276.75 230.65
Sales Tax for earlier years 5.35 62.28
Loss on Sale of Long Term Non Trade Investments – 6.22
Loss on Sale /Discard of Fixed Assets (Net) 6.98 –
Irrecoverable Debts written off 247.76 97.58
Provision for Doubtful Debts – 179.76
Miscellaneous Expenses 1,391.59 1,186.03
16,631.12 14,000.94
SCHEDULE- 'S'
PERSONNEL COST
Salaries, Wages, Bonus, etc. 5,075.42 4,245.68
Contribution to Provident, Gratuity and other Funds 332.53 312.96
Employees' Welfare Expenses 166.23 159.06
5,574.18 4,717.70
SCHEDULE- 'T'
DEPRECIATION/AMORTISATION
On Fixed Assets 1,898.14 1,705.37
Less : Transferred to Pre-operative expenses – 6.75
Less : Transferred from Revaluation Reserve 6.75 6.76
1,891.57 1,691.86
SCHEDULE- 'U'
INTEREST AND FINANCE CHARGES
On Fixed Loans 324.56 263.04
On Other Loans 780.95 1,263.48
1,105.51 1,526.52
Less: Capitalised 30.62 147.49
1,074.89 1,379.03
Bank Charges 225.27 376.21
1,300.16 1,755.24
47
SCHEDULE - 'V'
SIGNIFICANT ACCOUNTING POLICIES AND NOTES ON ACCOUNTS
(Annexed to and forming part of the Balance Sheet and Profit & Loss Account as at and for the year
ended 31st March, 2010)
A. SIGNIFICANT ACCOUNTING POLICIES
i) Basis of Preparation
The financial statements have been prepared to comply in all material respects with the Accounting Standards
notified by the Companies (Accounting Standards) Rules, 2006 (as amended) and the relevant provisions
of the Companies Act, 1956. The financial statements have been prepared under the historical cost convention
on an accrual basis except in respect of insurance and other claims, which on the grounds of prudence or
uncertainty in realization, are accounted for as and when accepted/received. The accounting policies applied
by the Company are consistent with those used in the previous year.
ii) Use of Estimates
The preparation of financial statements in conformity with generally accepted accounting principles
requires management to make estimates and assumptions that affect the reported amounts of assets and
liabilities and disclosure of contingent liabilities at the date of financial statements and the results of
operations during the reporting year end. Although these estimates are based upon management best
knowledge of current events and actions, actual results could differ from these estimates.
iii) Revenue Recognition
a) Revenue from sale of goods and services rendered is recognised upon passage of title which
generally coincides with delivery of materials and rendering of services to the customers.
b) Dividend Income is recognised when the shareholders' right to receive the payment is established
by the balance sheet date. However, dividend from subsidiaries is recognised even if the same is
declared after the Balance Sheet date but pertains to the period on or before the date of Balance
Sheet as per the requirement of Schedule VI of the Companies Act, 1956.
c) Interest income is recognised on a time proportion basis taking into account the amount outstanding
and rate applicable.
iv) Fixed Assets
Fixed Assets are stated at cost or revalued amount, as the case may be, less accumulated depreciation/
amortisation and impairment, if any. Cost comprises the purchase price inclusive of duties (net of
cenvat/VAT), taxes, incidental expenses and erection/commissioning expenses etc. up to the date, the
asset is ready for its intended use. In case of revaluation of fixed assets, the original cost as written-up
by the valuer, is considered in the accounts and the differential amount is transferred to revaluation
reserve.
Machinery spares which can be used only in connection with an item of fixed assets and whose use as
per technical assessment is expected to be irregular, are capitalised and depreciated over the residual life
of the respective assets.
v) Impairment of Assets
The carrying amounts of assets are reviewed at each balance sheet date to determine if there is any
indication of impairment based on external/internal factors. An impairment loss is recognised wherever
the carrying amount of an asset exceeds its recoverable amount which represents the greater of the net
selling price and ‘Value in use’ of the assets. The estimated future cash flows considered for determining
the value in use, are discounted to their present value at the weighted average cost of capital.
Schedules forming part of the Account
48
vi) Depreciation/Amortisation
a) The classification of plant and machinery into continuous and non-continuous process is done as per
technical certification and depreciation thereon is provided accordingly.
b) Depreciation on fixed assets is provided under Written down Value method at the rates prescribed
in Schedule XIV of the Companies Act, 1956 or at rates determined based on useful lives of the
respective assets, as estimated by the Management, whichever is higher.
c) Depreciation on revalued assets is provided at the rates specified under section 205 (2)(b) of the
Companies Act, 1956. However, in case of fixed assets whose life is determined by the valuer to be
less than their useful life under section 205, depreciation is provided at higher rate, to ensure the
write off of these assets over their useful life.
d) Depreciation on fixed assets added/disposed of during the year is provided on pro-rata basis with
reference to the date of addition/disposal.
e) Leasehold properties are depreciated over the primary period of lease or their respective useful lives,
whichever is shorter.
f) Intangible assets are amortised on a written down value method over a period of 5 years.
g) In case of impairment, depreciation is provided on the revised carrying amount of the assets over
its remaining useful life.
vii) Foreign Currency Transactions
a) Initial Recognition
Foreign currency transactions are recorded in the reporting currency, by applying to the foreign
currency amount, the exchange rate between the reporting currency and the foreign currency at the
date of the transaction.
b) Conversion
Foreign currency monetary items are reported using the closing rate. Non-monetary items which are
carried in terms of historical cost denominated in a foreign currency are reported using the exchange
rate at the date of the transaction, and non-monetary items which are carried at fair value or other
similar valuation denominated in a foreign currency are reported using the exchange rates that
existed when the values were determined.
c) Exchange Differences
Exchange differences arising on the settlement/conversion of monetary items are recognised as
income or expense in the year in which they arise.
d) Forward Exchange Contracts not entered for trading or speculation purpose
The premium or discount arising at the inception of forward exchange contracts is amortised as
expense or income over the life of the respective contracts. Exchange differences on such contracts
are recognised in the statement of profit and loss in the period in which the exchange rates change.
Any profit or loss arising on cancellation or renewal of forward exchange contracts is recognised
as income or expense for the year.
viii) Investments
Investments that are readily realisable and intended to be held for not more than a year are classified as
Current investments. All other investments are classified as long-term investments. Current investments
are carried at lower of cost and market value on individual investment basis. Long Term Investments
are considered at cost, unless there is an "other than temporary" decline in value, in which case adequate
provision is made for the diminution in the value of Investments.
Schedules forming part of the Account
49
ix) Inventories
Raw Materials, stores and spares are valued at lower of cost and net realizable value. However, these
items are considered to be realizable at cost if the finished products, in which they will be used, are
expected to be sold at or above cost.
Work in progress and finished goods are valued at lower of cost and net realisable value. Cost includes
direct materials & labour and a part of manufacturing overheads based on normal operating capacity.
Cost of finished goods includes excise duty.
Cost of Inventories is computed on weighted average basis.
Net realizable value is the estimated selling price in the ordinary course of business, less estimated costs
of completion and estimated costs necessary to make the sale.
x) Government Grants and subsidies
Government Grants and subsidies are recognised when there is a reasonable assurance that the same will
be received. Revenue grants/subsidies are recognised in the Profit & Loss Account. Capital grants
relating to specific fixed assets are reduced from the gross value of the respective fixed assets. Other
capital grants are credited to capital reserve.
xi) Research costs and Development costs
Research costs are expensed as incurred. Development expenditure incurred on an individual project is
carried forward when its future recoverability can reasonably be regarded as assured. Any expenditure
carried forward is amortised over the period of expected future sales from the related project, not
exceeding ten years.
The carrying value of development costs is reviewed for impairment annually when the asset is not yet in use,
and otherwise when events or changes in circumstances indicates that the carrying value may not be recoverable.
xii) Retirement and other employee benefits
a) Retirement benefit in the form of Provident Fund is a defined contribution scheme and is charged
to the Profit and Loss Account of the year when the contributions to the respective funds are due.
The Company has no obligations other than the contribution payable to the respective funds.
b) Gratuity liability, being a defined benefit obligation, is provided for on the basis of an actuarial
valuation on projected unit credit method made at the end of each financial year.
c) Short term compensated absences are provided for based on estimates. Long term compensated
absences are provided for based on actuarial valuation which is done as per projected unit credit
method at the end of each financial year.
d) Actuarial gains/losses are immediately taken to profit and loss account and are not deferred.
xiii) Earning per Share
Basic Earning per Share is calculated by dividing the net profit or loss for the year attributable to equity
shareholders by the weighted number of equity shares outstanding during the year.
For the purpose of calculating diluted earning per share, net profit or loss for the year attributable to
equity shareholders and the weighted average number of shares outstanding during the year are adjusted
for the effect of all dilutive potential equity shares.
xiv) Excise Duty and Custom Duty
Excise duty on finished goods stock lying at the factories is accounted for at the point of manufacture
of goods and accordingly, is considered for valuation of finished goods stock lying in the factories as
on the balance sheet date. Similarly, customs duty on imported material in transit/lying in bonded
warehouse is accounted for at the time of import/ bonding of materials.
Schedules forming part of the Account
50
xv) Borrowing Costs
Borrowing costs relating to acquisition/construction of qualifying assets are capitalised until the time
all substantial activities necessary to prepare the qualifying assets for their intended use are complete.
A qualifying asset is one that necessarily takes substantial period of time to get ready for its intended
use. All other borrowing costs are charged to revenue.
xvi) Taxation
Tax expenses comprises of current and deferred tax. Current income tax is measured at the amount
expected to be paid to the tax authorities in accordance with the Indian Income Tax Act, 1961. Deferred
income taxes reflect the impact of current year timing differences between taxable income for the year
and reversal of timing differences of earlier years.
The deferred tax for timing differences between the book and tax profits for the year is accounted for using
the tax rates and laws that have been substantially enacted as of the Balance Sheet date. Deferred tax assets
and deferred tax liabilities are offset, if a legally enforceable right exists to set off current tax assets against
current tax liabilities and the deferred tax assets and deferred tax liabilities relate to the taxes on income
levied by same governing taxation laws. Deferred tax assets are recognised only to the extent that there is
reasonable certainty that sufficient future taxable income will be available against which such deferred tax
assets can be realised. If the company has carry forward unabsorbed depreciation and tax losses, deferred
tax assets are recognised only to the extent there is virtual certainty supported by convincing evidence
that sufficient taxable income will be available against which such deferred tax asset can be realised.
The carrying amounts of deferred tax assets are reviewed at each balance sheet date. The company
writes-down the carrying amount ofdeferred tax assets to the extent that it is no longer reasonably certain or
virtually certain, as the case may be, that sufficient future taxable income will be available against which
deferred tax asset can be realised. Any such write-down is reversed to the extent that it becomes reasonably
certain or virtually certain, as the case may be, that sufficient future taxable income will be available.
Minimum Alternative Tax (MAT) credit is recognised as an asset only when and to the extent there is
convincing evidence that the company will pay normal income tax during the specified period. The
company reviews the carrying amount of MAT at each Balance Sheet date and writes down MAT credit
entitlement to the extent there is no longer convincing evidence to the effect that the company will pay
normal income-tax during specified period.
xvii) Segment Reporting
a) Identification of segments:
The company has identified that its business segments are the primary segments. The Company’s
business are organised and managed separately according to the nature of products/services, with
each segment representing a strategic business unit that offers different product/services and serves
different markets. The analysis of geographical segments is based on the areas in which the
customers of the company are located.
b) Inter-segment Transfers
The company generally accounts for inter-segment sales and transfers at current market prices.
c) Allocation of Common Costs
Common allocable costs are allocated to each segment on case to case basis applying the ratio,
appropriate to each relevant case. Revenue and expenses, which relate to the enterprise as a whole and
are not allocable to segment on a reasonable basis, have been included under the head “Unallocated”.
Schedules forming part of the Account
51
The accounting policies adopted for segment reporting are in line with those of the Company’s
accounting policies.
xviii) Fixed Assets acquired under Lease
a) Finance Lease
Assets acquired under lease agreements which effectively transfer to the company substantially all
the risk and benefits incidental to ownership of the leased items, are capitalised at the lower of the
fair value and present value of minimum lease payment at the inception of the lease term and
disclosed as leased assets. Lease payments are apportioned between the finance charges and the
reduction of the lease liability so as to achieve a constant rate of interest on the remaining balance
of their liability. Finance charges are charged directly to the expenses account.
b) Operating Lease
Leases where the lessor effectively retains substantially all the risks and benefits of the ownership
of the leased assets are classified as operating leases. Operating lease payments are recognised as
an expense in the profit and loss account.
xix) Cash and Cash equivalents
Cash and cash equivalents in the cash flow statement comprise of cash at bank and in hand and short-
term investments with an original maturity of three months or less.
xx) Provision
A provision is recognised when an enterprise has a present obligation as a result of past event and it is
probable that an outflow of resources will be required to settle the obligation, in respect of which a
reliable estimate can be made.
Provisions made in terms of Accounting Standard 29 are not discounted to its present value and are
determined based on best estimates required to settle the obligation at the balance sheet date. These are
reviewed at each balance sheet date and adjusted to reflect the current management estimates.
xxi) Contingencies
Liabilities which are material and whose future outcome cannot be ascertained with reasonable certainty
are treated as contingent and disclosed by way of notes to the accounts.
B. NOTES ON ACCOUNTS
1. a) Pursuant to the Scheme of Amalgamation (“the scheme”) as approved by the Hon'ble High Court
at Guwahati, by an order dated 17th May, 2010, under section 394 of the Companies Act, 1956,
Cent Ply Private Limited (“CPPL”), a wholly owned subsidiary of the Company, has been
amalgamated with the Company with effect from 1st April, 2009.
b) The Amalgamating Company (CPPL) is engaged in manufacturing of plywood and allied products
at its factory at Mirza, Palasbari, Assam.
c) The amalgamation has been accounted for under the “pooling of interests” method as prescribed
by Accounting Standard (AS-14), “Accounting for Amalgamations”. Pursuant to the Scheme, all
the assets, liabilities and reserves of CPPL as at 1st April, 2009 have been transferred at their
book values as given below. Though, the Scheme has become effective after the balance sheet
date, it is operative from the appointed date i.e. 1st April, 2009 and accordingly, it has been
given effect to in these accounts.
Schedules forming part of the Account
52
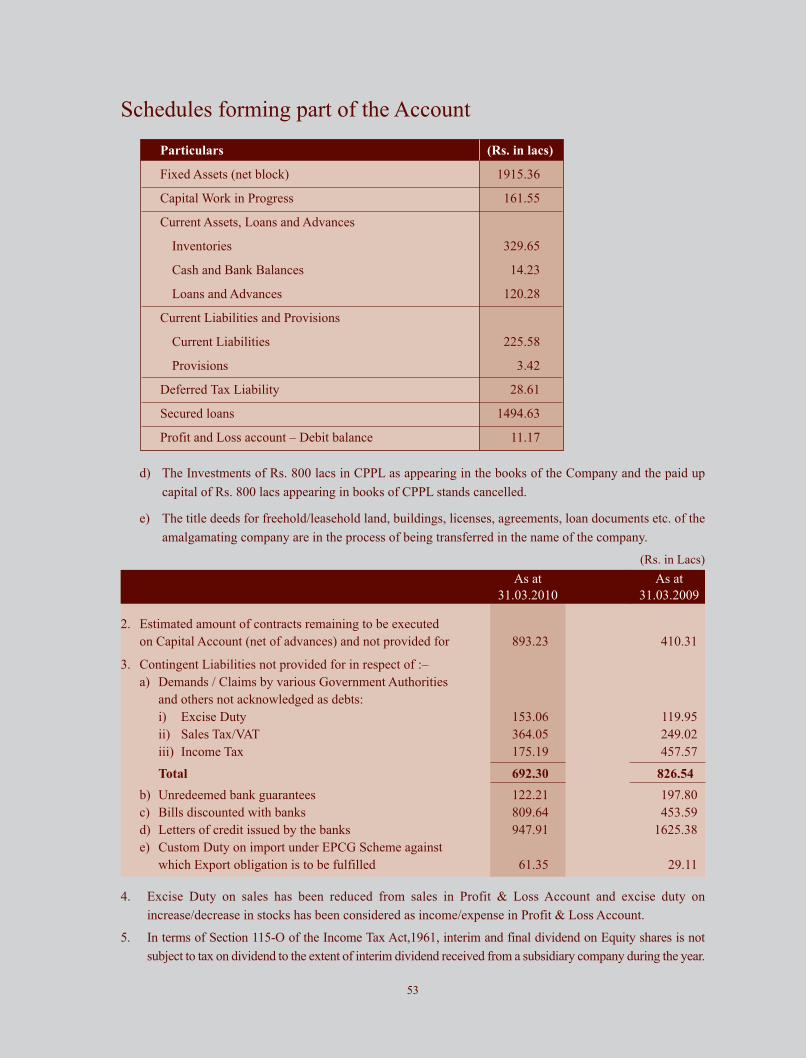
d) The Investments of Rs. 800 lacs in CPPL as appearing in the books of the Company and the paid up
capital of Rs. 800 lacs appearing in books of CPPL stands cancelled.
e) The title deeds for freehold/leasehold land, buildings, licenses, agreements, loan documents etc. of the
amalgamating company are in the process of being transferred in the name of the company.
(Rs. in Lacs)
As at As at
31.03.2010 31.03.2009
2. Estimated amount of contracts remaining to be executed
on Capital Account (net of advances) and not provided for 893.23 410.31
3. Contingent Liabilities not provided for in respect of :–
a) Demands / Claims by various Government Authorities
and others not acknowledged as debts:
i) Excise Duty 153.06 119.95
ii) Sales Tax/VAT 364.05 249.02
iii) Income Tax 175.19 457.57
Total 692.30 826.54
b) Unredeemed bank guarantees 122.21 197.80
c) Bills discounted with banks 809.64 453.59
d) Letters of credit issued by the banks 947.91 1625.38
e) Custom Duty on import under EPCG Scheme against
which Export obligation is to be fulfilled 61.35 29.11
4. Excise Duty on sales has been reduced from sales in Profit & Loss Account and excise duty on
increase/decrease in stocks has been considered as income/expense in Profit & Loss Account.
5. In terms of Section 115-O of the Income Tax Act,1961, interim and final dividend on Equity shares is not
subject to tax on dividend to the extent of interim dividend received from a subsidiary company during the year.
Particulars (Rs. in lacs)
Fixed Assets (net block) 1915.36
Capital Work in Progress 161.55
Current Assets, Loans and Advances
Inventories 329.65
Cash and Bank Balances 14.23
Loans and Advances 120.28
Current Liabilities and Provisions
Current Liabilities 225.58
Provisions 3.42
Deferred Tax Liability 28.61
Secured loans 1494.63
Profit and Loss account – Debit balance 11.17
Schedules forming part of the Account
53
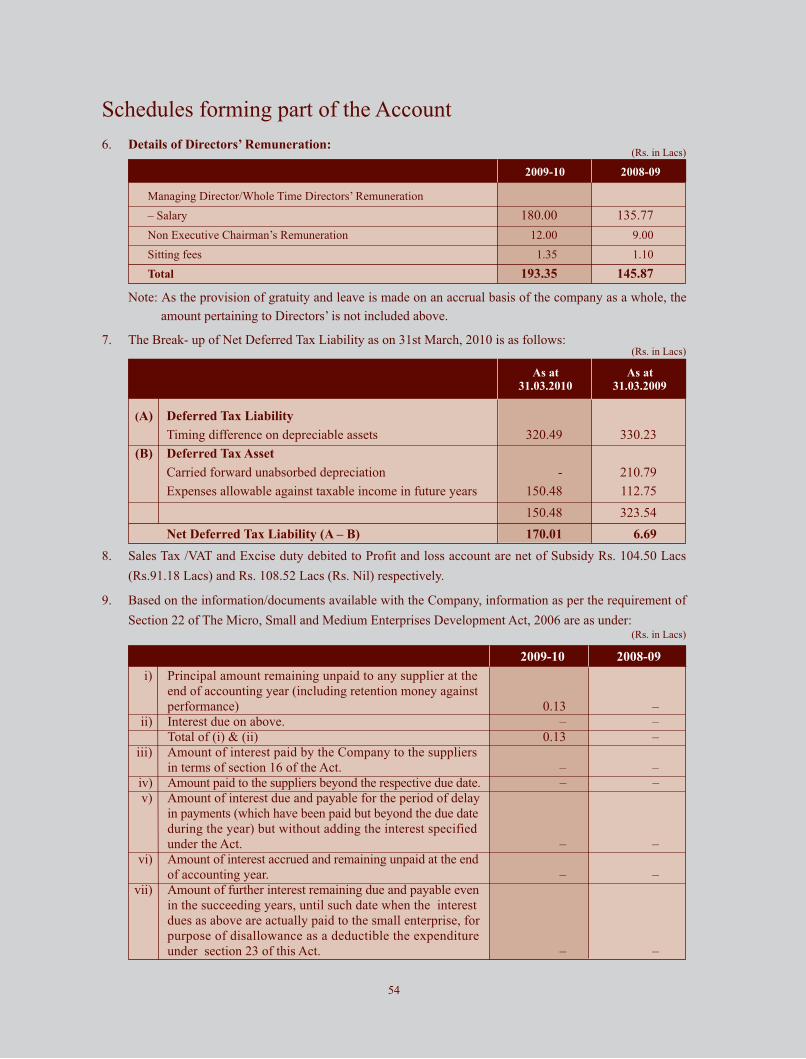
6. Details of Directors’ Remuneration:
2009-10 2008-09
Managing Director/Whole Time Directors’ Remuneration
– Salary 180.00 135.77
Non Executive Chairman’s Remuneration 12.00 9.00
Sitting fees 1.35 1.10
Total 193.35 145.87
(Rs. in Lacs)
Note: As the provision of gratuity and leave is made on an accrual basis of the company as a whole, the
amount pertaining to Directors’ is not included above.
7. The Break- up of Net Deferred Tax Liability as on 31st March, 2010 is as follows:
As at As at31.03.2010 31.03.2009
(A) Deferred Tax Liability
Timing difference on depreciable assets 320.49 330.23
(B) Deferred Tax Asset
Carried forward unabsorbed depreciation - 210.79
Expenses allowable against taxable income in future years 150.48 112.75
150.48 323.54
Net Deferred Tax Liability (A – B) 170.01 6.69
(Rs. in Lacs)
8. Sales Tax /VAT and Excise duty debited to Profit and loss account are net of Subsidy Rs. 104.50 Lacs
(Rs.91.18 Lacs) and Rs. 108.52 Lacs (Rs. Nil) respectively.
9. Based on the information/documents available with the Company, information as per the requirement of
Section 22 of The Micro, Small and Medium Enterprises Development Act, 2006 are as under:
2009-10 2008-09
i) Principal amount remaining unpaid to any supplier at the
end of accounting year (including retention money against
performance) 0.13 –
ii) Interest due on above. – –
Total of (i) & (ii) 0.13 –
iii) Amount of interest paid by the Company to the suppliers
in terms of section 16 of the Act. – –
iv) Amount paid to the suppliers beyond the respective due date. – –
v) Amount of interest due and payable for the period of delay
in payments (which have been paid but beyond the due date
during the year) but without adding the interest specified
under the Act. – –
vi) Amount of interest accrued and remaining unpaid at the end
of accounting year. – –
vii) Amount of further interest remaining due and payable even
in the succeeding years, until such date when the interest
dues as above are actually paid to the small enterprise, for
purpose of disallowance as a deductible the expenditure
under section 23 of this Act. – –
(Rs. in Lacs)
Schedules forming part of the Account
54
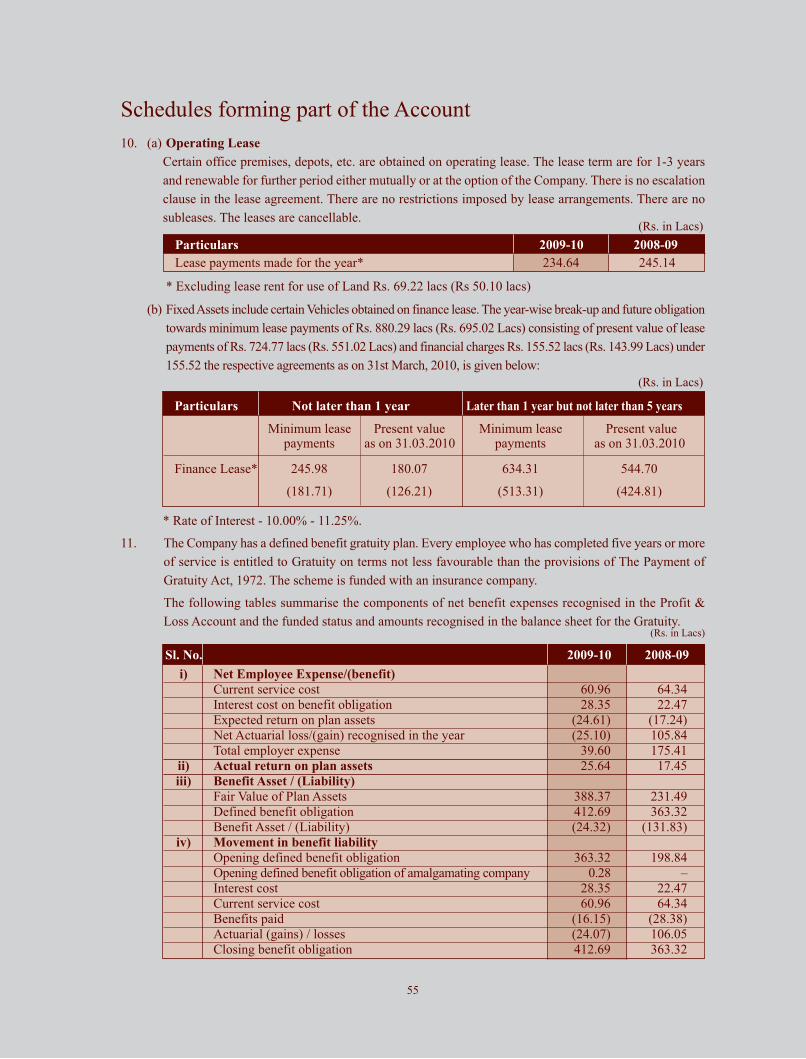
10. (a) Operating Lease
Certain office premises, depots, etc. are obtained on operating lease. The lease term are for 1-3 years
and renewable for further period either mutually or at the option of the Company. There is no escalation
clause in the lease agreement. There are no restrictions imposed by lease arrangements. There are no
subleases. The leases are cancellable.(Rs. in Lacs)
Particulars 2009-10 2008-09
Lease payments made for the year* 234.64 245.14
* Excluding lease rent for use of Land Rs. 69.22 lacs (Rs 50.10 lacs)
(b) Fixed Assets include certain Vehicles obtained on finance lease. The year-wise break-up and future obligation
towards minimum lease payments of Rs. 880.29 lacs (Rs. 695.02 Lacs) consisting of present value of lease
payments of Rs. 724.77 lacs (Rs. 551.02 Lacs) and financial charges Rs. 155.52 lacs (Rs. 143.99 Lacs) under
155.52 the respective agreements as on 31st March, 2010, is given below:
(Rs. in Lacs)
Particulars Not later than 1 year Later than 1 year but not later than 5 years
Minimum lease Present value Minimum lease Present valuepayments as on 31.03.2010 payments as on 31.03.2010
Finance Lease* 245.98 180.07 634.31 544.70
(181.71) (126.21) (513.31) (424.81)
* Rate of Interest - 10.00% - 11.25%.
11. The Company has a defined benefit gratuity plan. Every employee who has completed five years or more
of service is entitled to Gratuity on terms not less favourable than the provisions of The Payment of
Gratuity Act, 1972. The scheme is funded with an insurance company.
The following tables summarise the components of net benefit expenses recognised in the Profit &
Loss Account and the funded status and amounts recognised in the balance sheet for the Gratuity.
Sl. No. 2009-10 2008-09
i) Net Employee Expense/(benefit)
Current service cost 60.96 64.34
Interest cost on benefit obligation 28.35 22.47
Expected return on plan assets (24.61) (17.24)
Net Actuarial loss/(gain) recognised in the year (25.10) 105.84
Total employer expense 39.60 175.41
ii) Actual return on plan assets 25.64 17.45
iii) Benefit Asset / (Liability)
Fair Value of Plan Assets 388.37 231.49
Defined benefit obligation 412.69 363.32
Benefit Asset / (Liability) (24.32) (131.83)
iv) Movement in benefit liability
Opening defined benefit obligation 363.32 198.84
Opening defined benefit obligation of amalgamating company 0.28 –
Interest cost 28.35 22.47
Current service cost 60.96 64.34
Benefits paid (16.15) (28.38)
Actuarial (gains) / losses (24.07) 106.05
Closing benefit obligation 412.69 363.32
(Rs. in Lacs)
Schedules forming part of the Account
55
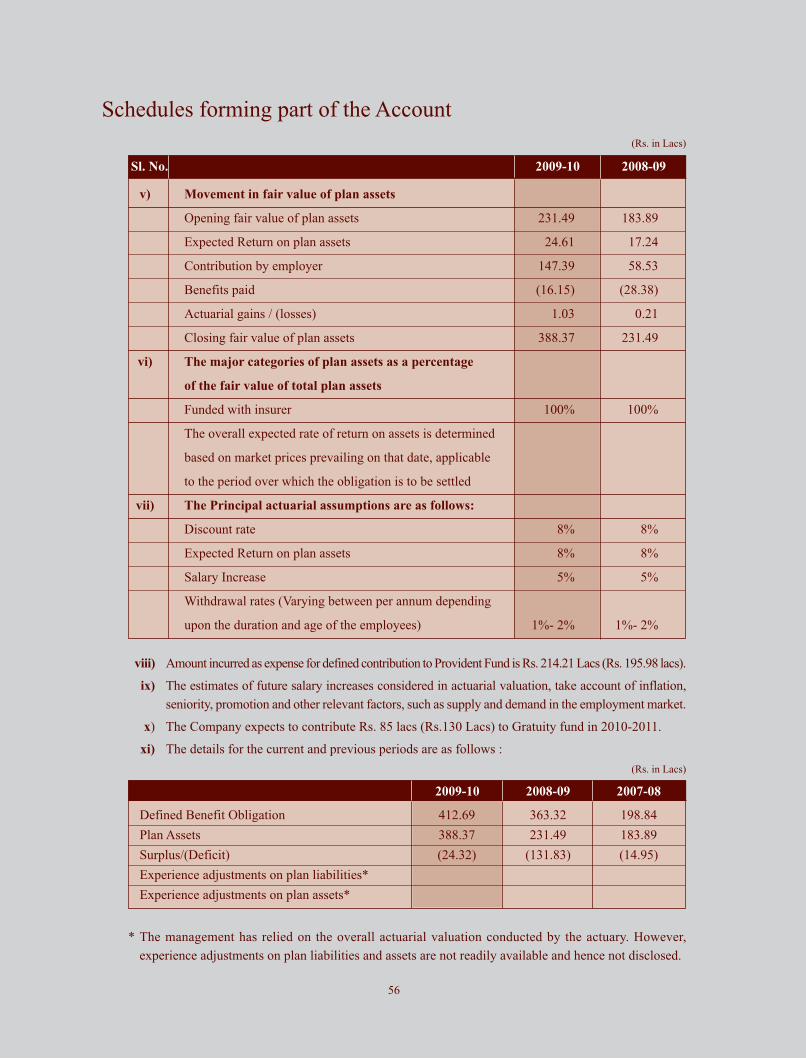
viii) Amount incurred as expense for defined contribution to Provident Fund is Rs. 214.21 Lacs (Rs. 195.98 lacs).
ix) The estimates of future salary increases considered in actuarial valuation, take account of inflation,
seniority, promotion and other relevant factors, such as supply and demand in the employment market.
x) The Company expects to contribute Rs. 85 lacs (Rs.130 Lacs) to Gratuity fund in 2010-2011.
xi) The details for the current and previous periods are as follows :
Sl. No. 2009-10 2008-09
v) Movement in fair value of plan assets
Opening fair value of plan assets 231.49 183.89
Expected Return on plan assets 24.61 17.24
Contribution by employer 147.39 58.53
Benefits paid (16.15) (28.38)
Actuarial gains / (losses) 1.03 0.21
Closing fair value of plan assets 388.37 231.49
vi) The major categories of plan assets as a percentage
of the fair value of total plan assets
Funded with insurer 100% 100%
The overall expected rate of return on assets is determined
based on market prices prevailing on that date, applicable
to the period over which the obligation is to be settled
vii) The Principal actuarial assumptions are as follows:
Discount rate 8% 8%
Expected Return on plan assets 8% 8%
Salary Increase 5% 5%
Withdrawal rates (Varying between per annum depending
upon the duration and age of the employees) 1%- 2% 1%- 2%
(Rs. in Lacs)
2009-10 2008-09 2007-08
Defined Benefit Obligation 412.69 363.32 198.84
Plan Assets 388.37 231.49 183.89
Surplus/(Deficit) (24.32) (131.83) (14.95)
Experience adjustments on plan liabilities*
Experience adjustments on plan assets*
(Rs. in Lacs)
* The management has relied on the overall actuarial valuation conducted by the actuary. However,
experience adjustments on plan liabilities and assets are not readily available and hence not disclosed.
Schedules forming part of the Account
56
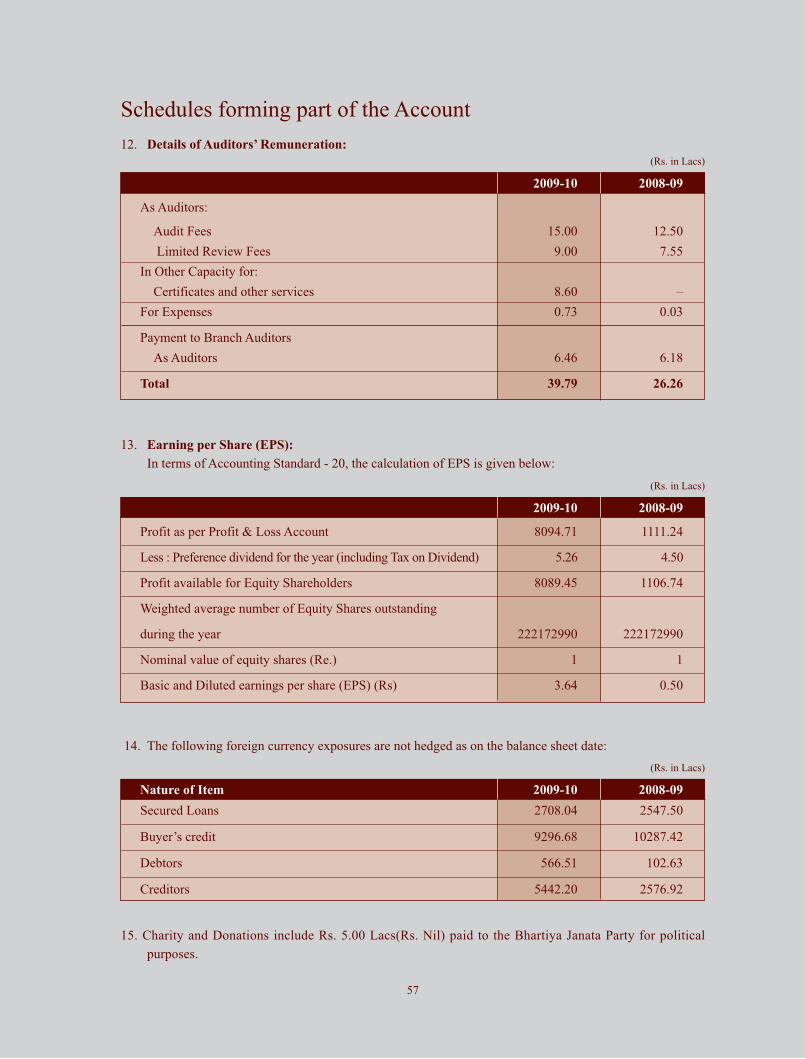
12. Details of Auditors’ Remuneration:
2009-10 2008-09
As Auditors:
Audit Fees 15.00 12.50
Limited Review Fees 9.00 7.55
In Other Capacity for:
Certificates and other services 8.60 –
For Expenses 0.73 0.03
Payment to Branch Auditors
As Auditors 6.46 6.18
Total 39.79 26.26
(Rs. in Lacs)
13. Earning per Share (EPS):
In terms of Accounting Standard - 20, the calculation of EPS is given below:
2009-10 2008-09
Profit as per Profit & Loss Account 8094.71 1111.24
Less : Preference dividend for the year (including Tax on Dividend) 5.26 4.50
Profit available for Equity Shareholders 8089.45 1106.74
Weighted average number of Equity Shares outstanding
during the year 222172990 222172990
Nominal value of equity shares (Re.) 1 1
Basic and Diluted earnings per share (EPS) (Rs) 3.64 0.50
(Rs. in Lacs)
Nature of Item 2009-10 2008-09
Secured Loans 2708.04 2547.50
Buyer’s credit 9296.68 10287.42
Debtors 566.51 102.63
Creditors 5442.20 2576.92
(Rs. in Lacs)
14. The following foreign currency exposures are not hedged as on the balance sheet date:
15. Charity and Donations include Rs. 5.00 Lacs(Rs. Nil) paid to the Bhartiya Janata Party for political
purposes.
Schedules forming part of the Account
57
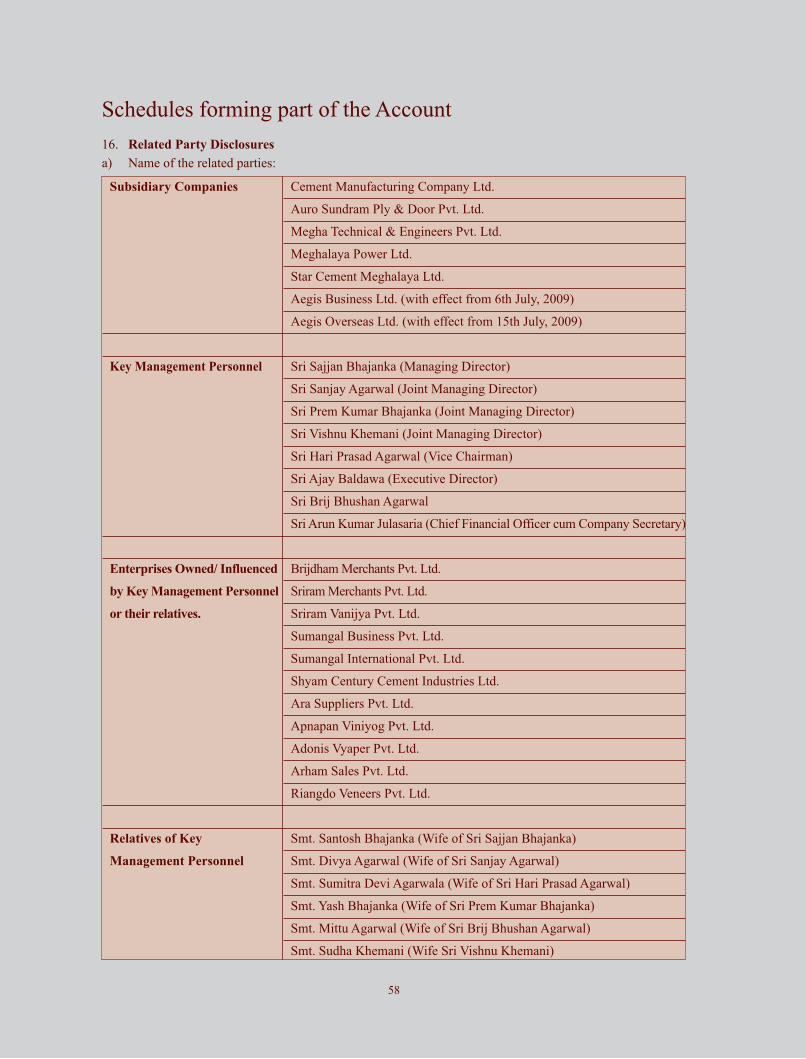
16. Related Party Disclosures
a) Name of the related parties:
Schedules forming part of the Account
58
Subsidiary Companies Cement Manufacturing Company Ltd.
Auro Sundram Ply & Door Pvt. Ltd.
Megha Technical & Engineers Pvt. Ltd.
Meghalaya Power Ltd.
Star Cement Meghalaya Ltd.
Aegis Business Ltd. (with effect from 6th July, 2009)
Aegis Overseas Ltd. (with effect from 15th July, 2009)
Key Management Personnel Sri Sajjan Bhajanka (Managing Director)
Sri Sanjay Agarwal (Joint Managing Director)
Sri Prem Kumar Bhajanka (Joint Managing Director)
Sri Vishnu Khemani (Joint Managing Director)
Sri Hari Prasad Agarwal (Vice Chairman)
Sri Ajay Baldawa (Executive Director)
Sri Brij Bhushan Agarwal
Sri Arun Kumar Julasaria (Chief Financial Officer cum Company Secretary)
Enterprises Owned/ Influenced Brijdham Merchants Pvt. Ltd.
by Key Management Personnel Sriram Merchants Pvt. Ltd.
or their relatives. Sriram Vanijya Pvt. Ltd.
Sumangal Business Pvt. Ltd.
Sumangal International Pvt. Ltd.
Shyam Century Cement Industries Ltd.
Ara Suppliers Pvt. Ltd.
Apnapan Viniyog Pvt. Ltd.
Adonis Vyaper Pvt. Ltd.
Arham Sales Pvt. Ltd.
Riangdo Veneers Pvt. Ltd.
Relatives of Key Smt. Santosh Bhajanka (Wife of Sri Sajjan Bhajanka)
Management Personnel Smt. Divya Agarwal (Wife of Sri Sanjay Agarwal)
Smt. Sumitra Devi Agarwala (Wife of Sri Hari Prasad Agarwal)
Smt. Yash Bhajanka (Wife of Sri Prem Kumar Bhajanka)
Smt. Mittu Agarwal (Wife of Sri Brij Bhushan Agarwal)
Smt. Sudha Khemani (Wife Sri Vishnu Khemani)
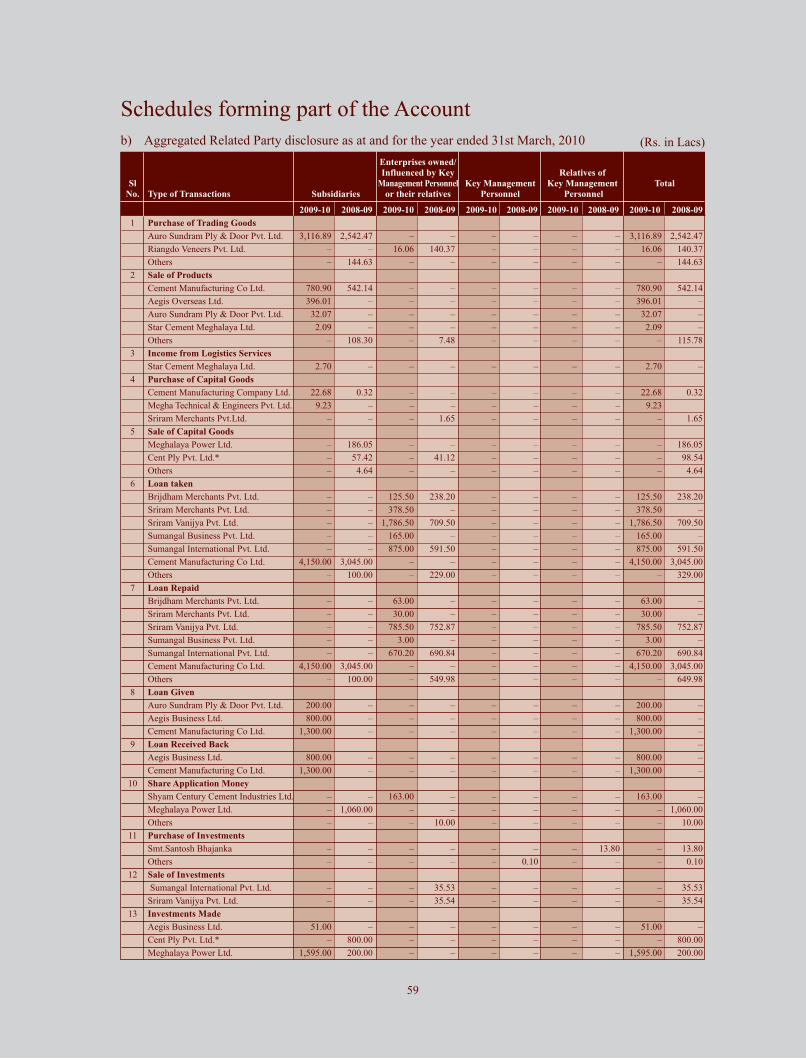
Schedules forming part of the Account
Enterprises owned/
Influenced by Key Relatives of
Sl Management Personnel Key Management Key Management Total
No. Type of Transactions Subsidiaries or their relatives Personnel Personnel
2009-10 2008-09 2009-10 2008-09 2009-10 2008-09 2009-10 2008-09 2009-10 2008-09
1 Purchase of Trading Goods
Auro Sundram Ply & Door Pvt. Ltd. 3,116.89 2,542.47 – – – – – – 3,116.89 2,542.47
Riangdo Veneers Pvt. Ltd. – – 16.06 140.37 – – – – 16.06 140.37
Others – 144.63 – – – – – – – 144.63
2 Sale of Products
Cement Manufacturing Co Ltd. 780.90 542.14 – – – – – – 780.90 542.14
Aegis Overseas Ltd. 396.01 – – – – – – – 396.01 –
Auro Sundram Ply & Door Pvt. Ltd. 32.07 – – – – – – – 32.07 –
Star Cement Meghalaya Ltd. 2.09 – – – – – – – 2.09 –
Others – 108.30 – 7.48 – – – – – 115.78
3 Income from Logistics Services
Star Cement Meghalaya Ltd. 2.70 – – – – – – – 2.70 –
4 Purchase of Capital Goods
Cement Manufacturing Company Ltd. 22.68 0.32 – – – – – – 22.68 0.32
Megha Technical & Engineers Pvt. Ltd. 9.23 – – – – – – – 9.23
Sriram Merchants Pvt.Ltd. – – – 1.65 – – – – – 1.65
5 Sale of Capital Goods
Meghalaya Power Ltd. – 186.05 – – – – – – – 186.05
Cent Ply Pvt. Ltd.* – 57.42 – 41.12 – – – – – 98.54
Others – 4.64 – – – – – – – 4.64
6 Loan taken
Brijdham Merchants Pvt. Ltd. – – 125.50 238.20 – – – – 125.50 238.20
Sriram Merchants Pvt. Ltd. – – 378.50 – – – – – 378.50 –
Sriram Vanijya Pvt. Ltd. – – 1,786.50 709.50 – – – – 1,786.50 709.50
Sumangal Business Pvt. Ltd. – – 165.00 – – – – – 165.00 –
Sumangal International Pvt. Ltd. – – 875.00 591.50 – – – – 875.00 591.50
Cement Manufacturing Co Ltd. 4,150.00 3,045.00 – – – – – – 4,150.00 3,045.00
Others – 100.00 – 229.00 – – – – – 329.00
7 Loan Repaid
Brijdham Merchants Pvt. Ltd. – – 63.00 – – – – – 63.00 –
Sriram Merchants Pvt. Ltd. – – 30.00 – – – – – 30.00 –
Sriram Vanijya Pvt. Ltd. – – 785.50 752.87 – – – – 785.50 752.87
Sumangal Business Pvt. Ltd. – – 3.00 – – – – – 3.00 –
Sumangal International Pvt. Ltd. – – 670.20 690.84 – – – – 670.20 690.84
Cement Manufacturing Co Ltd. 4,150.00 3,045.00 – – – – – – 4,150.00 3,045.00
Others – 100.00 – 549.98 – – – – – 649.98
8 Loan Given
Auro Sundram Ply & Door Pvt. Ltd. 200.00 – – – – – – – 200.00 –
Aegis Business Ltd. 800.00 – – – – – – – 800.00 –
Cement Manufacturing Co Ltd. 1,300.00 – – – – – – – 1,300.00 –
9 Loan Received Back –
Aegis Business Ltd. 800.00 – – – – – – – 800.00 –
Cement Manufacturing Co Ltd. 1,300.00 – – – – – – – 1,300.00 –
10 Share Application Money
Shyam Century Cement Industries Ltd. – – 163.00 – – – – – 163.00 –
Meghalaya Power Ltd. – 1,060.00 – – – – – – – 1,060.00
Others – – – 10.00 – – – – – 10.00
11 Purchase of Investments
Smt.Santosh Bhajanka – – – – – – – 13.80 – 13.80
Others – – – – – 0.10 – – – 0.10
12 Sale of Investments
Sumangal International Pvt. Ltd. – – – 35.53 – – – – – 35.53
Sriram Vanijya Pvt. Ltd. – – – 35.54 – – – – – 35.54
13 Investments Made
Aegis Business Ltd. 51.00 – – – – – – – 51.00 –
Cent Ply Pvt. Ltd.* – 800.00 – – – – – – – 800.00
Meghalaya Power Ltd. 1,595.00 200.00 – – – – – – 1,595.00 200.00
(Rs. in Lacs)b) Aggregated Related Party disclosure as at and for the year ended 31st March, 2010
59
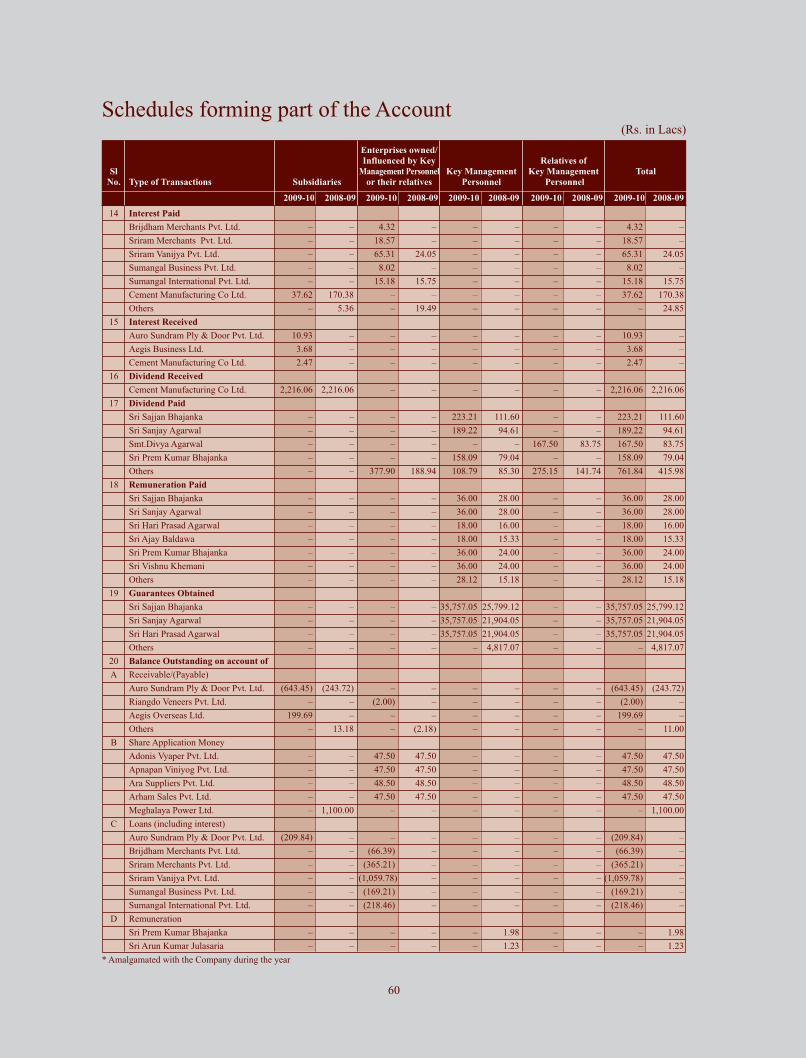
Enterprises owned/
Influenced by Key Relatives of
Sl Management Personnel Key Management Key Management Total
No. Type of Transactions Subsidiaries or their relatives Personnel Personnel
2009-10 2008-09 2009-10 2008-09 2009-10 2008-09 2009-10 2008-09 2009-10 2008-09
14 Interest Paid
Brijdham Merchants Pvt. Ltd. – – 4.32 – – – – – 4.32 –
Sriram Merchants Pvt. Ltd. – – 18.57 – – – – – 18.57 –
Sriram Vanijya Pvt. Ltd. – – 65.31 24.05 – – – – 65.31 24.05
Sumangal Business Pvt. Ltd. – – 8.02 – – – – – 8.02 –
Sumangal International Pvt. Ltd. – – 15.18 15.75 – – – – 15.18 15.75
Cement Manufacturing Co Ltd. 37.62 170.38 – – – – – – 37.62 170.38
Others – 5.36 – 19.49 – – – – – 24.85
15 Interest Received
Auro Sundram Ply & Door Pvt. Ltd. 10.93 – – – – – – – 10.93 –
Aegis Business Ltd. 3.68 – – – – – – – 3.68 –
Cement Manufacturing Co Ltd. 2.47 – – – – – – – 2.47 –
16 Dividend Received
Cement Manufacturing Co Ltd. 2,216.06 2,216.06 – – – – – – 2,216.06 2,216.06
17 Dividend Paid
Sri Sajjan Bhajanka – – – – 223.21 111.60 – – 223.21 111.60
Sri Sanjay Agarwal – – – – 189.22 94.61 – – 189.22 94.61
Smt.Divya Agarwal – – – – – – 167.50 83.75 167.50 83.75
Sri Prem Kumar Bhajanka – – – – 158.09 79.04 – – 158.09 79.04
Others – – 377.90 188.94 108.79 85.30 275.15 141.74 761.84 415.98
18 Remuneration Paid
Sri Sajjan Bhajanka – – – – 36.00 28.00 – – 36.00 28.00
Sri Sanjay Agarwal – – – – 36.00 28.00 – – 36.00 28.00
Sri Hari Prasad Agarwal – – – – 18.00 16.00 – – 18.00 16.00
Sri Ajay Baldawa – – – – 18.00 15.33 – – 18.00 15.33
Sri Prem Kumar Bhajanka – – – – 36.00 24.00 – – 36.00 24.00
Sri Vishnu Khemani – – – – 36.00 24.00 – – 36.00 24.00
Others – – – – 28.12 15.18 – – 28.12 15.18
19 Guarantees Obtained
Sri Sajjan Bhajanka – – – – 35,757.05 25,799.12 – – 35,757.05 25,799.12
Sri Sanjay Agarwal – – – – 35,757.05 21,904.05 – – 35,757.05 21,904.05
Sri Hari Prasad Agarwal – – – – 35,757.05 21,904.05 – – 35,757.05 21,904.05
Others – – – – – 4,817.07 – – – 4,817.07
20 Balance Outstanding on account of
A Receivable/(Payable)
Auro Sundram Ply & Door Pvt. Ltd. (643.45) (243.72) – – – – – – (643.45) (243.72)
Riangdo Veneers Pvt. Ltd. – – (2.00) – – – – – (2.00) –
Aegis Overseas Ltd. 199.69 – – – – – – – 199.69 –
Others – 13.18 – (2.18) – – – – – 11.00
B Share Application Money
Adonis Vyaper Pvt. Ltd. – – 47.50 47.50 – – – – 47.50 47.50
Apnapan Viniyog Pvt. Ltd. – – 47.50 47.50 – – – – 47.50 47.50
Ara Suppliers Pvt. Ltd. – – 48.50 48.50 – – – – 48.50 48.50
Arham Sales Pvt. Ltd. – – 47.50 47.50 – – – – 47.50 47.50
Meghalaya Power Ltd. – 1,100.00 – – – – – – – 1,100.00
C Loans (including interest)
Auro Sundram Ply & Door Pvt. Ltd. (209.84) – – – – – – – (209.84) –
Brijdham Merchants Pvt. Ltd. – – (66.39) – – – – – (66.39) –
Sriram Merchants Pvt. Ltd. – – (365.21) – – – – – (365.21) –
Sriram Vanijya Pvt. Ltd. – – (1,059.78) – – – – – (1,059.78) –
Sumangal Business Pvt. Ltd. – – (169.21) – – – – – (169.21) –
Sumangal International Pvt. Ltd. – – (218.46) – – – – – (218.46) –
D Remuneration
Sri Prem Kumar Bhajanka – – – – – 1.98 – – – 1.98
Sri Arun Kumar Julasaria – – – – – 1.23 – – – 1.23
(Rs. in Lacs)
* Amalgamated with the Company during the year
Schedules forming part of the Account
60
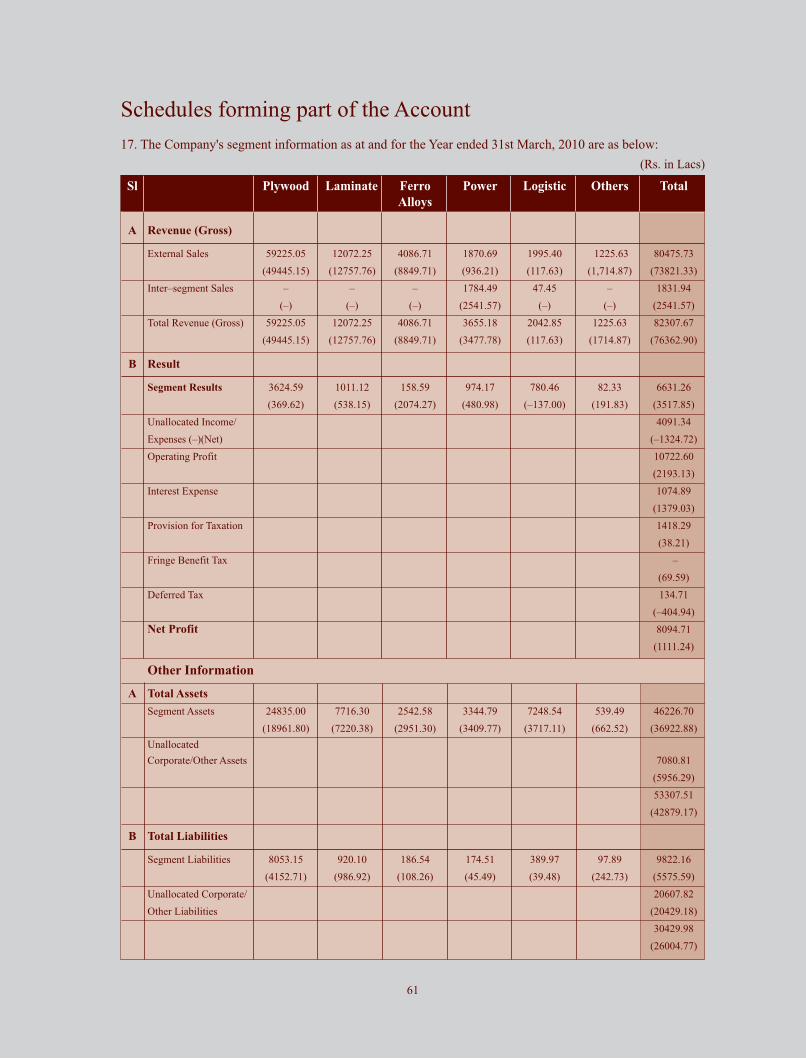
17. The Company's segment information as at and for the Year ended 31st March, 2010 are as below:
(Rs. in Lacs)
Schedules forming part of the Account
61
Sl Plywood Laminate Ferro Power Logistic Others Total
Alloys
A Revenue (Gross)
External Sales 59225.05 12072.25 4086.71 1870.69 1995.40 1225.63 80475.73
(49445.15) (12757.76) (8849.71) (936.21) (117.63) (1,714.87) (73821.33)
Inter–segment Sales – – – 1784.49 47.45 – 1831.94
(–) (–) (–) (2541.57) (–) (–) (2541.57)
Total Revenue (Gross) 59225.05 12072.25 4086.71 3655.18 2042.85 1225.63 82307.67
(49445.15) (12757.76) (8849.71) (3477.78) (117.63) (1714.87) (76362.90)
B Result
Segment Results 3624.59 1011.12 158.59 974.17 780.46 82.33 6631.26
(369.62) (538.15) (2074.27) (480.98) (–137.00) (191.83) (3517.85)
Unallocated Income/ 4091.34
Expenses (–)(Net) (–1324.72)
Operating Profit 10722.60
(2193.13)
Interest Expense 1074.89
(1379.03)
Provision for Taxation 1418.29
(38.21)
Fringe Benefit Tax –
(69.59)
Deferred Tax 134.71
(–404.94)
Net Profit 8094.71
(1111.24)
Other Information
A Total Assets
Segment Assets 24835.00 7716.30 2542.58 3344.79 7248.54 539.49 46226.70
(18961.80) (7220.38) (2951.30) (3409.77) (3717.11) (662.52) (36922.88)
Unallocated
Corporate/Other Assets 7080.81
(5956.29)
53307.51
(42879.17)
B Total Liabilities
Segment Liabilities 8053.15 920.10 186.54 174.51 389.97 97.89 9822.16
(4152.71) (986.92) (108.26) (45.49) (39.48) (242.73) (5575.59)
Unallocated Corporate/ 20607.82
Other Liabilities (20429.18)
30429.98
(26004.77)
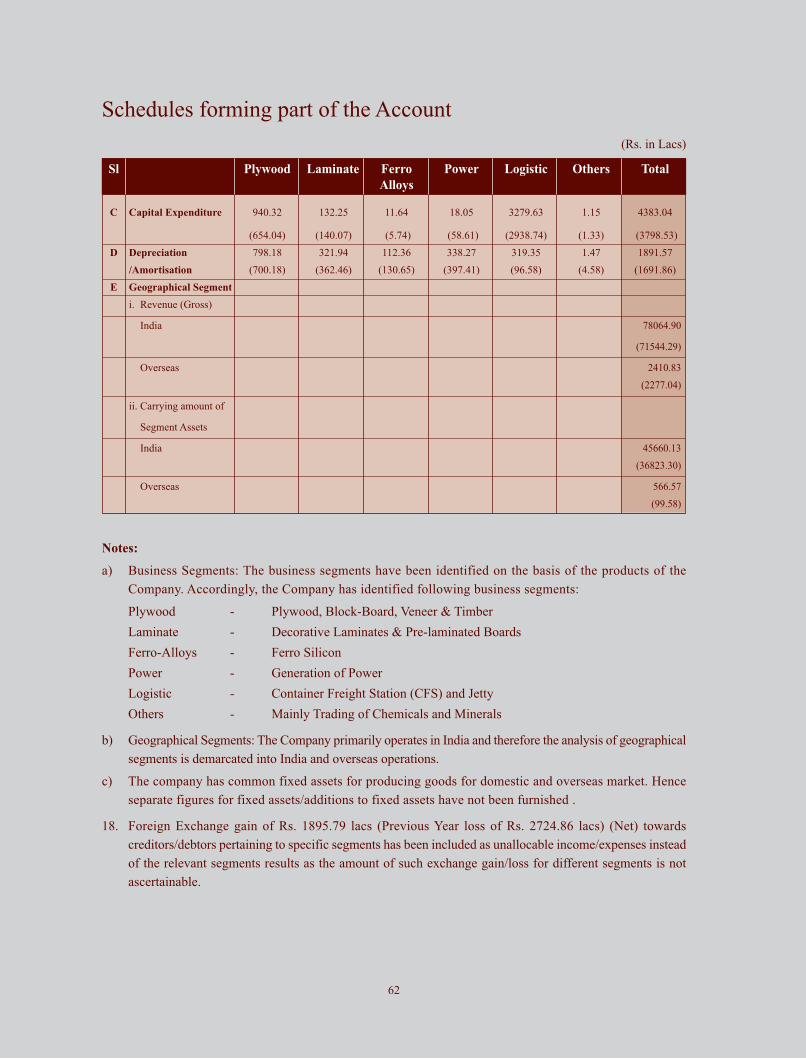
Notes:
a) Business Segments: The business segments have been identified on the basis of the products of the
Company. Accordingly, the Company has identified following business segments:
Plywood - Plywood, Block-Board, Veneer & Timber
Laminate - Decorative Laminates & Pre-laminated Boards
Ferro-Alloys - Ferro Silicon
Power - Generation of Power
Logistic - Container Freight Station (CFS) and Jetty
Others - Mainly Trading of Chemicals and Minerals
b) Geographical Segments: The Company primarily operates in India and therefore the analysis of geographical
segments is demarcated into India and overseas operations.
c) The company has common fixed assets for producing goods for domestic and overseas market. Hence
separate figures for fixed assets/additions to fixed assets have not been furnished .
18. Foreign Exchange gain of Rs. 1895.79 lacs (Previous Year loss of Rs. 2724.86 lacs) (Net) towards
creditors/debtors pertaining to specific segments has been included as unallocable income/expenses instead
of the relevant segments results as the amount of such exchange gain/loss for different segments is not
ascertainable.
Sl Plywood Laminate Ferro Power Logistic Others Total
Alloys
C Capital Expenditure 940.32 132.25 11.64 18.05 3279.63 1.15 4383.04
(654.04) (140.07) (5.74) (58.61) (2938.74) (1.33) (3798.53)
D Depreciation 798.18 321.94 112.36 338.27 319.35 1.47 1891.57
/Amortisation (700.18) (362.46) (130.65) (397.41) (96.58) (4.58) (1691.86)
E Geographical Segment
i. Revenue (Gross)
India 78064.90
(71544.29)
Overseas 2410.83
(2277.04)
ii. Carrying amount of
Segment Assets
India 45660.13
(36823.30)
Overseas 566.57
(99.58)
(Rs. in Lacs)
Schedules forming part of the Account
62

Schedules forming part of the Account
19. Information Pursuant to the Provisions of Paragraphs 3,4c and 4d of Part II of the Companies Act,1956
a) Details of Products Manufactured, Turnover, Opening Stock, Closing Stock, etc. :
a) Includes 45682 CBM (48137 CBM) of Veneer, 1MT(Nil) of Adhesive, 167CBM(Nil) of Timber, 64069 MW (90939 MW) of power
and NIL MT (487MT) chemicals for own consumption.b) Includes Excise duty and Sales tax/ VAT.
* Includes Rs. 133.91 lacs (326 CBM) transferred from the amalgamating company.
Note : Installed capacity have been certified by the management and accepted as correct by the auditors.
Sl Particulars Unit Lincensed Installed Opening Stock Production Purchases Turnover (b) Closing Stock
Capacity Capacity
Per Annum Per Annum Quantity Amount Quantity Quantity Amount Quantity Amount Quantity Amount
Rs. in Lacs Rs. in Lacs Rs. in Lacs Rs. in Lacs
i) Plywood CBM Not Applicable 122420 6,037 1,702.02* 92,657 23,584 4,578.70 116,763 52,690.33 5,515 1,674.07
(100820) (6,214) (1,500.22) (76,742) (24,021) (4,574.40) (101,266) (42,536.67) (5,711) (1,568.11)
ii) Veneer CBM Not Applicable 149000 713 430.85 71,643 (a) – – 25,738 6,077.56 936 289.61
(149000) (1,408) (260.40) (73,732) (80) (31.16) (26,370) (6,703.52) (713) (430.85)
iii) Laminate Sheets Nos. Not Applicable 2400000 276,630 1,131.27 1,804,273 – – 1,822,774 10,451.59 258,129 955.10
(2400000) (359,478) (1,267.36) (1,953,507) (–) (–) (2,036,355) (10,625.60) (276,630) (1,131.27)
iv) Pre–Laminated Boards SQM Not Applicable 800000 3,656 11.41 374,989 – – 372,466 1,336.93 6,179 20.32
(800000) (20,672) (41.14) (273,108) (–) (–) (290,124) (1,108.71) (3,656) (11.41)
v) Ferro Silicon MT Not Applicable 10620 270 95.71 6,339 – – 6,153 3,806.58 456 189.47
(10620) (557) (244.59) (10,214) (–) (–) (10,501) (7,898.09) (270) (95.71)
vi) Silicon Manganese MT 45 16.32 546 – – 517 280.14 74 28.76
(–) (–) (1,145) (–) (–) (1,100) (951.62) (45) (16.32)
vii) Power MW Not Applicable 13.80 – – 99,823 (a) – – 35,754 1,870.69 – –
(13.80) (–) (–) (108,604) (–) (–) (17,664) (936.21) (–) (–)
viii) Adhesives MT Not Applicable 2000 3 1.52 – – – 2(a) 0.24 1 0.53
(2000) (104) (58.11) (435) (–) (–) (536) (494.02) (3) (1.52)
ix) MDF/PPB CBM 606 90.30 – 819 128.00 1,074 219.96 352 55.86
(1,019) (140.95) (–) (4,318) (630.08) (4,731) (891.59) (606) (90.30)
x) Chemicals MT 40 83.21 – 273 449.04 269 761.41 44 82.94
(710) (773.84) (–) (170) (191.05) (840) (862.01) (40) (83.21)
xi) Pest Control Kits PCS 57,561 30.40 – 198,586 66.41 173,312 78.90 82,835 53.50
(111,738) (50.49) (–) (215,515) (76.86) (269,692) (127.20) (57,561) (30.40)
xii) Timber CBM 167 20.38 – – – 167(a) – – –
(301) (36.83) (–) (–) (–) (134) (10.98) (167) (20.38)
xii) Others – – – – 579.50 – 852.10 – –
– (11.59) (–) (–) (–) (–) (127.29) (–) (–)
3,613.39* 5,801.65 78,426.42 3,350.16
(4,385.52) (5,503.55) (73,273.51) (3,479.48)
b) Raw Materials Consumed
2009-10 2008-09
Sl Particulars Unit Quantity Value Quantity Value(Rs. in Lacs) (Rs. in Lacs)
i Timber Logs CBM 114437 18150.81 118191 19370.90ii Veneer CBM 113899 7073.32 91068 4285.23iii Chemicals KGS/LTR 12889005 4239.54 12670099 5104.29iv Paper KGS 5614060 3617.03 5652161 3683.61v Particle Board CBM 381603 587.39 283588 509.62vi Coal/Charcoal/Lame Coke MT 6264 548.14 1737 179.80vii Super Screen Coal MT 3952 259.47 14372 814.53viii Quartz MT 12420 147.45 19521 200.89ix Mill Scale MT 2593 69.82 3592 101.19x Manganese Ore/Slag MT 1205 108.74 2823 700.41xi Others 9.24 103.46
Total 34810.95 35053.93
63
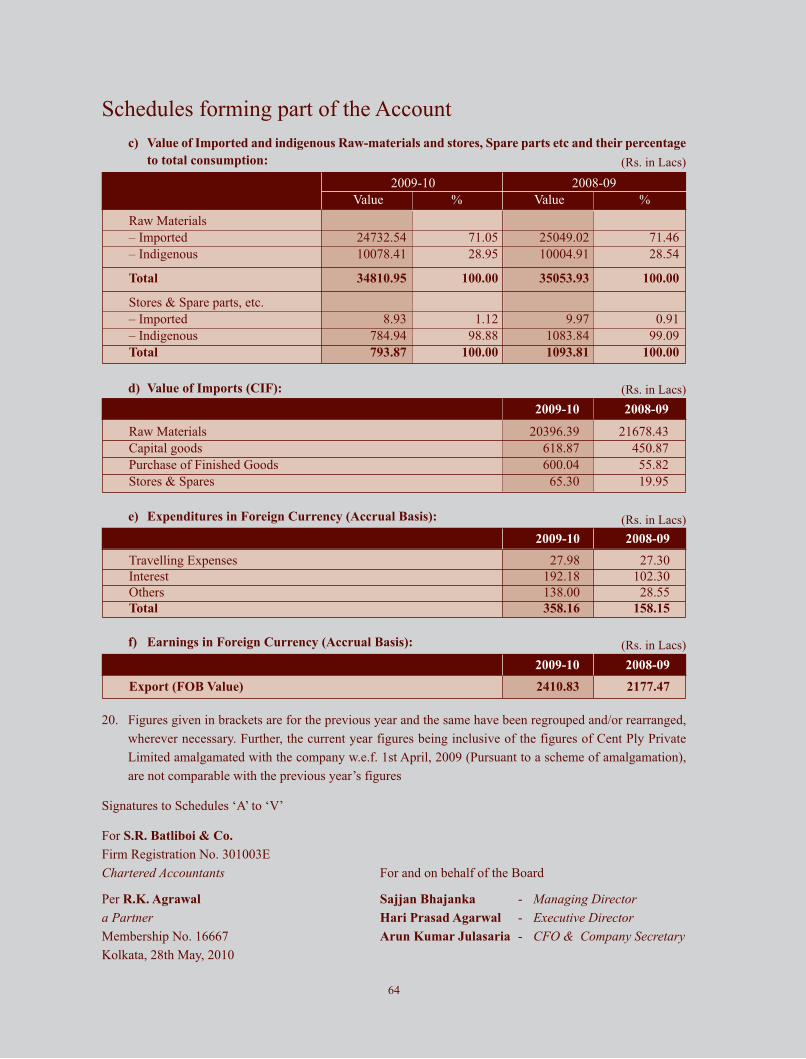
Schedules forming part of the Account
20. Figures given in brackets are for the previous year and the same have been regrouped and/or rearranged,
wherever necessary. Further, the current year figures being inclusive of the figures of Cent Ply Private
Limited amalgamated with the company w.e.f. 1st April, 2009 (Pursuant to a scheme of amalgamation),
are not comparable with the previous year’s figures
Signatures to Schedules ‘A’ to ‘V’
For S.R. Batliboi & Co.
Firm Registration No. 301003E
Chartered Accountants For and on behalf of the Board
Per R.K. Agrawal Sajjan Bhajanka - Managing Directora Partner Hari Prasad Agarwal - Executive DirectorMembership No. 16667 Arun Kumar Julasaria - CFO & Company SecretaryKolkata, 28th May, 2010
c) Value of Imported and indigenous Raw-materials and stores, Spare parts etc and their percentage
to total consumption:
2009-10 2008-09
Value % Value %
Raw Materials
– Imported 24732.54 71.05 25049.02 71.46
– Indigenous 10078.41 28.95 10004.91 28.54
Total 34810.95 100.00 35053.93 100.00
Stores & Spare parts, etc.
– Imported 8.93 1.12 9.97 0.91
– Indigenous 784.94 98.88 1083.84 99.09
Total 793.87 100.00 1093.81 100.00
d) Value of Imports (CIF):
2009-10 2008-09
Raw Materials 20396.39 21678.43
Capital goods 618.87 450.87
Purchase of Finished Goods 600.04 55.82
Stores & Spares 65.30 19.95
(Rs. in Lacs)
e) Expenditures in Foreign Currency (Accrual Basis):
2009-10 2008-09
Travelling Expenses 27.98 27.30
Interest 192.18 102.30
Others 138.00 28.55
Total 358.16 158.15
(Rs. in Lacs)
f) Earnings in Foreign Currency (Accrual Basis):
2009-10 2008-09
Export (FOB Value) 2410.83 2177.47
(Rs. in Lacs)
(Rs. in Lacs)
64
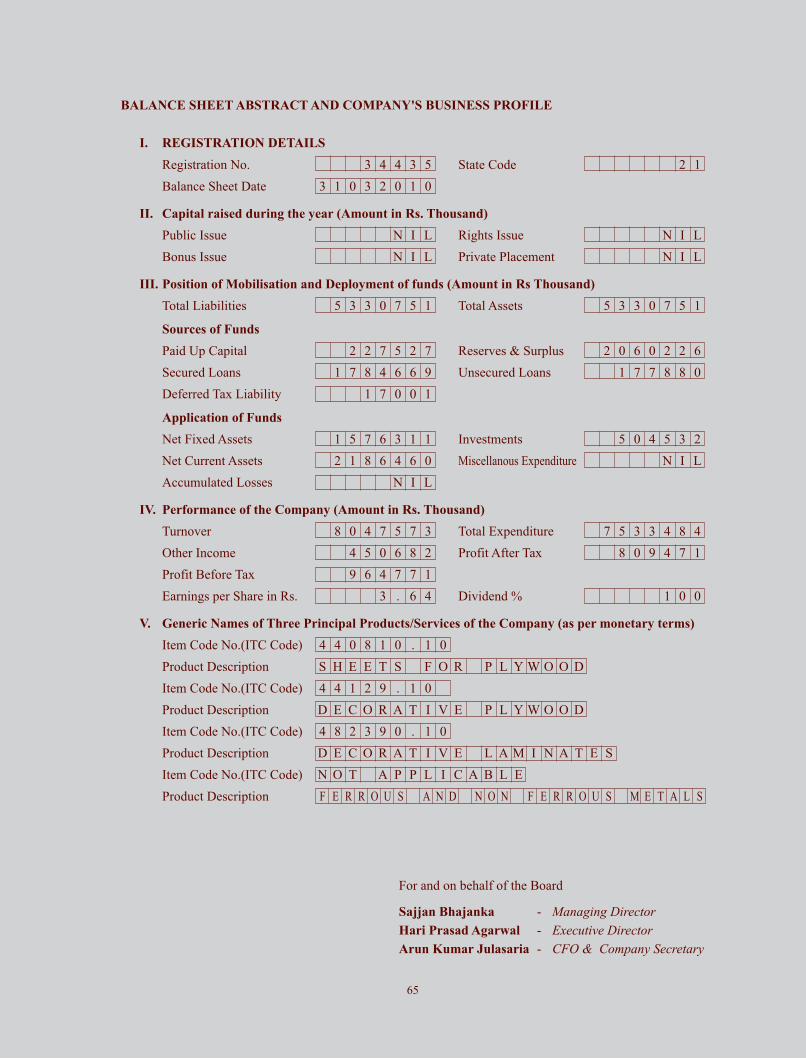
BALANCE SHEET ABSTRACT AND COMPANY'S BUSINESS PROFILE
I. REGISTRATION DETAILS
Registration No. 3 4 4 3 5 State Code 2 1
Balance Sheet Date 3 1 0 3 2 0 1 0
II. Capital raised during the year (Amount in Rs. Thousand)
Public Issue N I L Rights Issue N I L
Bonus Issue N I L Private Placement N I L
III. Position of Mobilisation and Deployment of funds (Amount in Rs Thousand)
Total Liabilities 5 3 3 0 7 5 1 Total Assets 5 3 3 0 7 5 1
Sources of Funds
Paid Up Capital 2 2 7 5 2 7 Reserves & Surplus 2 0 6 0 2 2 6
Secured Loans 1 7 8 4 6 6 9 Unsecured Loans 1 7 7 8 8 0
Deferred Tax Liability 1 7 0 0 1
Application of Funds
Net Fixed Assets 1 5 7 6 3 1 1 Investments 5 0 4 5 3 2
Net Current Assets 2 1 8 6 4 6 0 Miscellanous Expenditure N I L
Accumulated Losses N I L
IV. Performance of the Company (Amount in Rs. Thousand)
Turnover 8 0 4 7 5 7 3 Total Expenditure 7 5 3 3 4 8 4
Other Income 4 5 0 6 8 2 Profit After Tax 8 0 9 4 7 1
Profit Before Tax 9 6 4 7 7 1
Earnings per Share in Rs. 3 . 6 4 Dividend % 1 0 0
V. Generic Names of Three Principal Products/Services of the Company (as per monetary terms)
Item Code No.(ITC Code) 4 4 0 8 1 0 . 1 0
Product Description S H E E T S F O R P L Y W O O D
Item Code No.(ITC Code) 4 4 1 2 9 . 1 0
Product Description D E C O R A T I V E P L Y W O O D
Item Code No.(ITC Code) 4 8 2 3 9 0 . 1 0
Product Description D E C O R A T I V E L A M I N A T E S
Item Code No.(ITC Code) N O T A P P L I C A B L E
Product Description F E R R O U S A N D N O N F E R R O U S M E T A L S
For and on behalf of the Board
Sajjan Bhajanka - Managing DirectorHari Prasad Agarwal - Executive DirectorArun Kumar Julasaria - CFO & Company Secretary
65
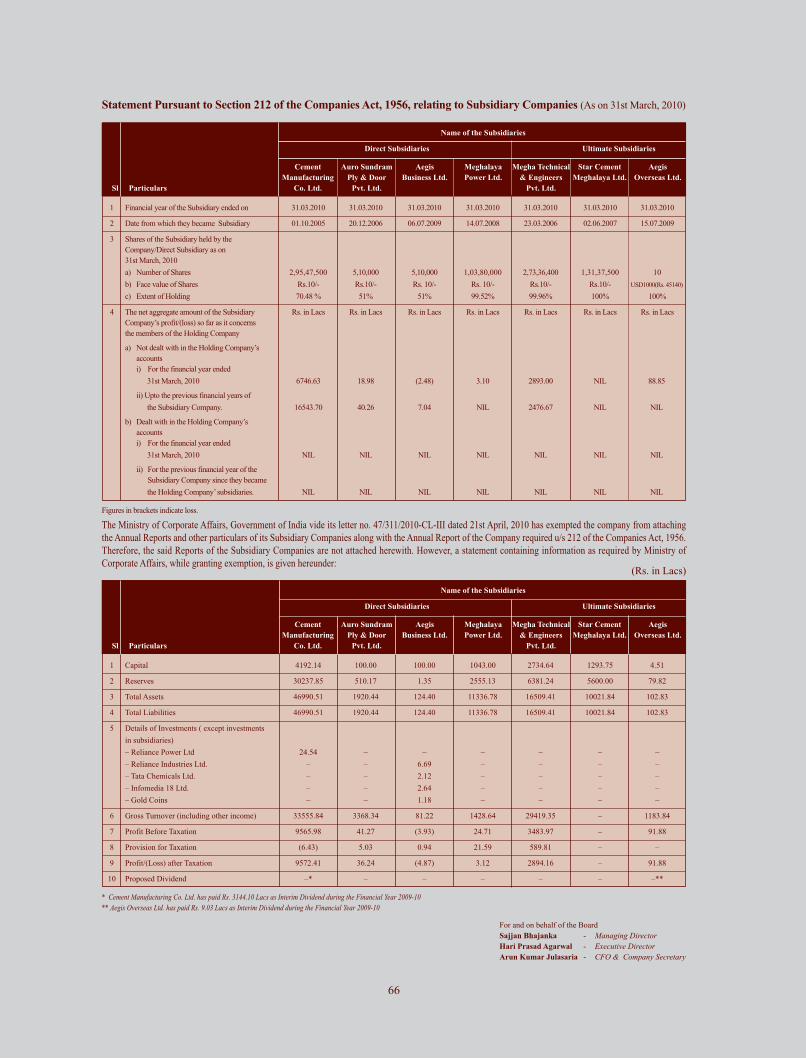
Name of the Subsidiaries
Direct Subsidiaries Ultimate Subsidiaries
Cement Auro Sundram Aegis Meghalaya Megha Technical Star Cement Aegis
Manufacturing Ply & Door Business Ltd. Power Ltd. & Engineers Meghalaya Ltd. Overseas Ltd.
Sl Particulars Co. Ltd. Pvt. Ltd. Pvt. Ltd.
1 Financial year of the Subsidiary ended on 31.03.2010 31.03.2010 31.03.2010 31.03.2010 31.03.2010 31.03.2010 31.03.2010
2 Date from which they became Subsidiary 01.10.2005 20.12.2006 06.07.2009 14.07.2008 23.03.2006 02.06.2007 15.07.2009
3 Shares of the Subsidiary held by the
Company/Direct Subsidiary as on
31st March, 2010
a) Number of Shares 2,95,47,500 5,10,000 5,10,000 1,03,80,000 2,73,36,400 1,31,37,500 10
b) Face value of Shares Rs.10/- Rs.10/- Rs. 10/- Rs. 10/- Rs.10/- Rs.10/- USD1000(Rs. 45140)
c) Extent of Holding 70.48 % 51% 51% 99.52% 99.96% 100% 100%
4 The net aggregate amount of the Subsidiary Rs. in Lacs Rs. in Lacs Rs. in Lacs Rs. in Lacs Rs. in Lacs Rs. in Lacs Rs. in Lacs
Company’s profit/(loss) so far as it concerns
the members of the Holding Company
a) Not dealt with in the Holding Company’s
accounts
i) For the financial year ended
31st March, 2010 6746.63 18.98 (2.48) 3.10 2893.00 NIL 88.85
ii) Upto the previous financial years of
the Subsidiary Company. 16543.70 40.26 7.04 NIL 2476.67 NIL NIL
b) Dealt with in the Holding Company’s
accounts
i) For the financial year ended
31st March, 2010 NIL NIL NIL NIL NIL NIL NIL
ii) For the previous financial year of the
Subsidiary Company since they became
the Holding Company’ subsidiaries. NIL NIL NIL NIL NIL NIL NIL
The Ministry of Corporate Affairs, Government of India vide its letter no. 47/311/2010-CL-III dated 21st April, 2010 has exempted the company from attaching
the Annual Reports and other particulars of its Subsidiary Companies along with the Annual Report of the Company required u/s 212 of the Companies Act, 1956.
Therefore, the said Reports of the Subsidiary Companies are not attached herewith. However, a statement containing information as required by Ministry of
Corporate Affairs, while granting exemption, is given hereunder:
Statement Pursuant to Section 212 of the Companies Act, 1956, relating to Subsidiary Companies (As on 31st March, 2010)
(Rs. in Lacs)
Name of the Subsidiaries
Direct Subsidiaries Ultimate Subsidiaries
Cement Auro Sundram Aegis Meghalaya Megha Technical Star Cement Aegis
Manufacturing Ply & Door Business Ltd. Power Ltd. & Engineers Meghalaya Ltd. Overseas Ltd.
Sl Particulars Co. Ltd. Pvt. Ltd. Pvt. Ltd.
1 Capital 4192.14 100.00 100.00 1043.00 2734.64 1293.75 4.51
2 Reserves 30237.85 510.17 1.35 2555.13 6381.24 5600.00 79.82
3 Total Assets 46990.51 1920.44 124.40 11336.78 16509.41 10021.84 102.83
4 Total Liabilities 46990.51 1920.44 124.40 11336.78 16509.41 10021.84 102.83
5 Details of Investments ( except investments
in subsidiaries)
– Reliance Power Ltd 24.54 – – – – – –
– Reliance Industries Ltd. – – 6.69 – – – –
– Tata Chemicals Ltd. – – 2.12 – – – –
– Infomedia 18 Ltd. – – 2.64 – – – –
– Gold Coins – – 1.18 – – – –
6 Gross Turnover (including other income) 33555.84 3368.34 81.22 1428.64 29419.35 – 1183.84
7 Profit Before Taxation 9565.98 41.27 (3.93) 24.71 3483.97 – 91.88
8 Provision for Taxation (6.43) 5.03 0.94 21.59 589.81 – –
9 Profit/(Loss) after Taxation 9572.41 36.24 (4.87) 3.12 2894.16 – 91.88
10 Proposed Dividend –* – – – – – –**
* Cement Manufacturing Co. Ltd. has paid Rs. 3144.10 Lacs as Interim Dividend during the Financial Year 2009-10** Aegis Overseas Ltd. has paid Rs. 9.03 Lacs as Interim Dividend during the Financial Year 2009-10
For and on behalf of the Board
Sajjan Bhajanka - Managing DirectorHari Prasad Agarwal - Executive DirectorArun Kumar Julasaria - CFO & Company Secretary
Figures in brackets indicate loss.
66
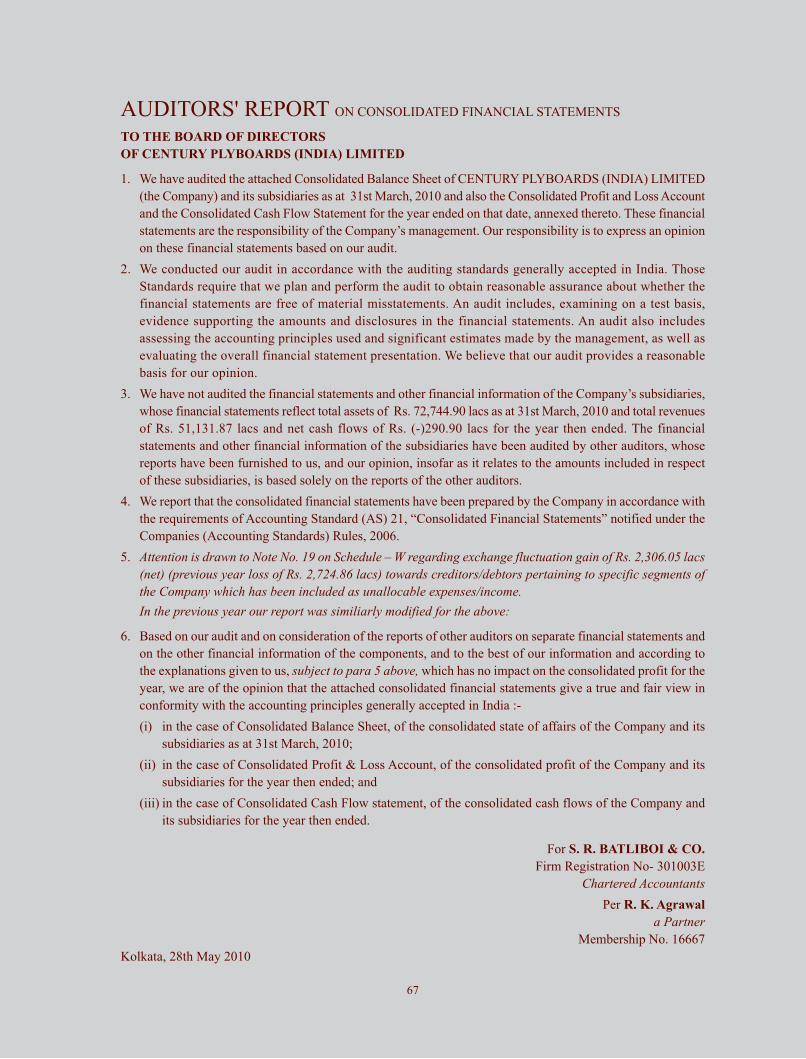
AUDITORS' REPORT ON CONSOLIDATED FINANCIAL STATEMENTS
TO THE BOARD OF DIRECTORS
OF CENTURY PLYBOARDS (INDIA) LIMITED
1. We have audited the attached Consolidated Balance Sheet of CENTURY PLYBOARDS (INDIA) LIMITED
(the Company) and its subsidiaries as at 31st March, 2010 and also the Consolidated Profit and Loss Account
and the Consolidated Cash Flow Statement for the year ended on that date, annexed thereto. These financial
statements are the responsibility of the Company’s management. Our responsibility is to express an opinion
on these financial statements based on our audit.
2. We conducted our audit in accordance with the auditing standards generally accepted in India. Those
Standards require that we plan and perform the audit to obtain reasonable assurance about whether the
financial statements are free of material misstatements. An audit includes, examining on a test basis,
evidence supporting the amounts and disclosures in the financial statements. An audit also includes
assessing the accounting principles used and significant estimates made by the management, as well as
evaluating the overall financial statement presentation. We believe that our audit provides a reasonable
basis for our opinion.
3. We have not audited the financial statements and other financial information of the Company’s subsidiaries,
whose financial statements reflect total assets of Rs. 72,744.90 lacs as at 31st March, 2010 and total revenues
of Rs. 51,131.87 lacs and net cash flows of Rs. (-)290.90 lacs for the year then ended. The financial
statements and other financial information of the subsidiaries have been audited by other auditors, whose
reports have been furnished to us, and our opinion, insofar as it relates to the amounts included in respect
of these subsidiaries, is based solely on the reports of the other auditors.
4. We report that the consolidated financial statements have been prepared by the Company in accordance with
the requirements of Accounting Standard (AS) 21, “Consolidated Financial Statements” notified under the
Companies (Accounting Standards) Rules, 2006.
5. Attention is drawn to Note No. 19 on Schedule – W regarding exchange fluctuation gain of Rs. 2,306.05 lacs(net) (previous year loss of Rs. 2,724.86 lacs) towards creditors/debtors pertaining to specific segments ofthe Company which has been included as unallocable expenses/income.In the previous year our report was similiarly modified for the above:
6. Based on our audit and on consideration of the reports of other auditors on separate financial statements and
on the other financial information of the components, and to the best of our information and according to
the explanations given to us, subject to para 5 above, which has no impact on the consolidated profit for the
year, we are of the opinion that the attached consolidated financial statements give a true and fair view in
conformity with the accounting principles generally accepted in India :-
(i) in the case of Consolidated Balance Sheet, of the consolidated state of affairs of the Company and its
subsidiaries as at 31st March, 2010;
(ii) in the case of Consolidated Profit & Loss Account, of the consolidated profit of the Company and its
subsidiaries for the year then ended; and
(iii) in the case of Consolidated Cash Flow statement, of the consolidated cash flows of the Company and
its subsidiaries for the year then ended.
For S. R. BATLIBOI & CO.
Firm Registration No- 301003E
Chartered AccountantsPer R. K. Agrawal
a PartnerMembership No. 16667
Kolkata, 28th May 2010
67
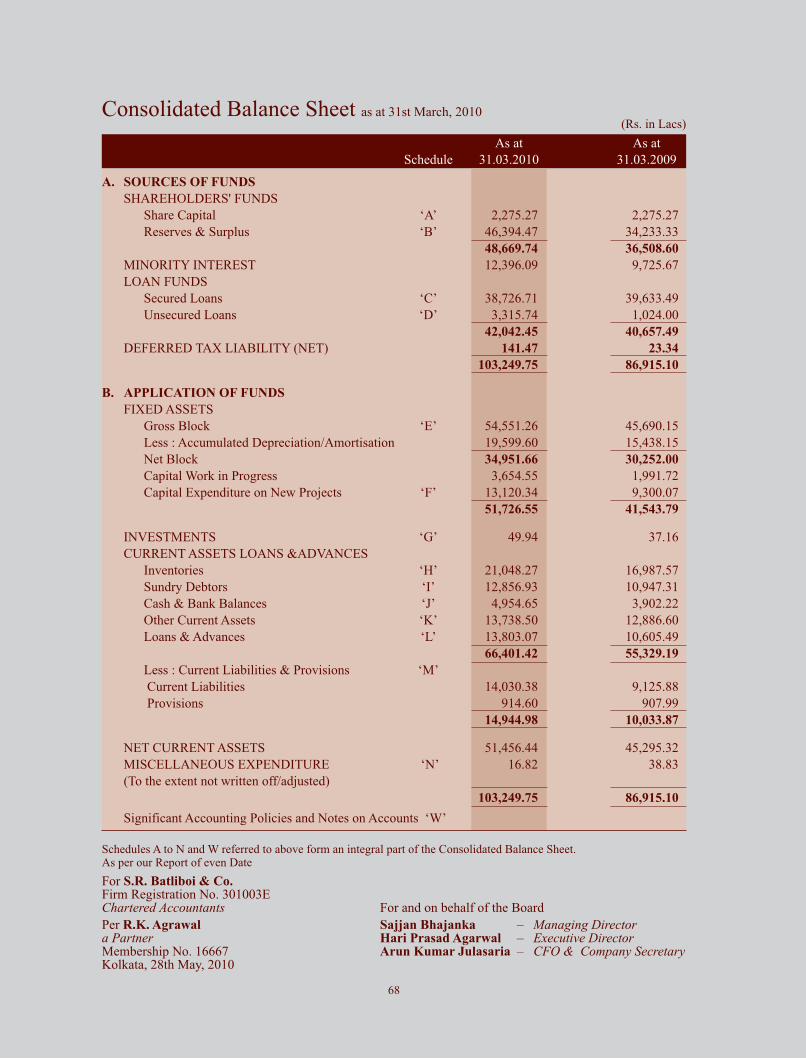
Consolidated Balance Sheet as at 31st March, 2010(Rs. in Lacs)
As at As at
Schedule 31.03.2010 31.03.2009
A. SOURCES OF FUNDS
SHAREHOLDERS' FUNDS
Share Capital ‘A’ 2,275.27 2,275.27
Reserves & Surplus ‘B’ 46,394.47 34,233.33
48,669.74 36,508.60
MINORITY INTEREST 12,396.09 9,725.67
LOAN FUNDS
Secured Loans ‘C’ 38,726.71 39,633.49
Unsecured Loans ‘D’ 3,315.74 1,024.00
42,042.45 40,657.49
DEFERRED TAX LIABILITY (NET) 141.47 23.34
103,249.75 86,915.10
B. APPLICATION OF FUNDS
FIXED ASSETS
Gross Block ‘E’ 54,551.26 45,690.15
Less : Accumulated Depreciation/Amortisation 19,599.60 15,438.15
Net Block 34,951.66 30,252.00
Capital Work in Progress 3,654.55 1,991.72
Capital Expenditure on New Projects ‘F’ 13,120.34 9,300.07
51,726.55 41,543.79
INVESTMENTS ‘G’ 49.94 37.16
CURRENT ASSETS LOANS &ADVANCES
Inventories ‘H’ 21,048.27 16,987.57
Sundry Debtors ‘I’ 12,856.93 10,947.31
Cash & Bank Balances ‘J’ 4,954.65 3,902.22
Other Current Assets ‘K’ 13,738.50 12,886.60
Loans & Advances ‘L’ 13,803.07 10,605.49
66,401.42 55,329.19
Less : Current Liabilities & Provisions ‘M’
Current Liabilities 14,030.38 9,125.88
Provisions 914.60 907.99
14,944.98 10,033.87
NET CURRENT ASSETS 51,456.44 45,295.32
MISCELLANEOUS EXPENDITURE ‘N’ 16.82 38.83
(To the extent not written off/adjusted)
103,249.75 86,915.10
Significant Accounting Policies and Notes on Accounts ‘W’
Schedules A to N and W referred to above form an integral part of the Consolidated Balance Sheet.As per our Report of even Date
For S.R. Batliboi & Co.Firm Registration No. 301003EChartered Accountants For and on behalf of the Board
Per R.K. Agrawal Sajjan Bhajanka – Managing Directora Partner Hari Prasad Agarwal – Executive DirectorMembership No. 16667 Arun Kumar Julasaria – CFO & Company SecretaryKolkata, 28th May, 2010
68
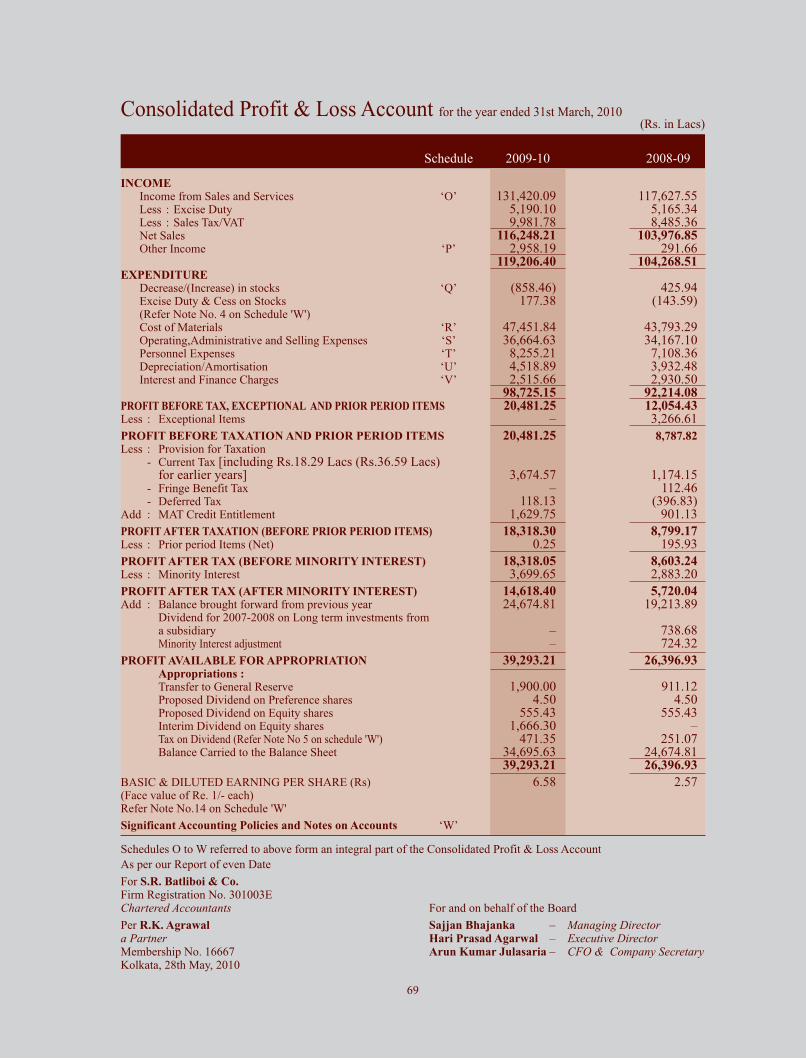
Schedules O to W referred to above form an integral part of the Consolidated Profit & Loss Account
As per our Report of even Date
For S.R. Batliboi & Co.Firm Registration No. 301003EChartered Accountants For and on behalf of the Board
Per R.K. Agrawal Sajjan Bhajanka – Managing Directora Partner Hari Prasad Agarwal – Executive DirectorMembership No. 16667 Arun Kumar Julasaria – CFO & Company SecretaryKolkata, 28th May, 2010
(Rs. in Lacs)Consolidated Profit & Loss Account for the year ended 31st March, 2010
Schedule 2009-10 2008-09
INCOMEIncome from Sales and Services ‘O’ 131,420.09 117,627.55Less : Excise Duty 5,190.10 5,165.34Less : Sales Tax/VAT 9,981.78 8,485.36Net Sales 116,248.21 103,976.85Other Income ‘P’ 2,958.19 291.66
119,206.40 104,268.51EXPENDITURE
Decrease/(Increase) in stocks ‘Q’ (858.46) 425.94Excise Duty & Cess on Stocks 177.38 (143.59)(Refer Note No. 4 on Schedule 'W')Cost of Materials ‘R’ 47,451.84 43,793.29Operating,Administrative and Selling Expenses ‘S’ 36,664.63 34,167.10Personnel Expenses ‘T’ 8,255.21 7,108.36Depreciation/Amortisation ‘U’ 4,518.89 3,932.48Interest and Finance Charges ‘V’ 2,515.66 2,930.50
98,725.15 92,214.08PROFIT BEFORE TAX, EXCEPTIONAL AND PRIOR PERIOD ITEMS 20,481.25 12,054.43Less : Exceptional Items – 3,266.61
PROFIT BEFORE TAXATION AND PRIOR PERIOD ITEMS 20,481.25 8,787.82Less : Provision for Taxation
- Current Tax [including Rs.18.29 Lacs (Rs.36.59 Lacs)for earlier years] 3,674.57 1,174.15
- Fringe Benefit Tax – 112.46- Deferred Tax 118.13 (396.83)
Add : MAT Credit Entitlement 1,629.75 901.13
PROFIT AFTER TAXATION (BEFORE PRIOR PERIOD ITEMS) 18,318.30 8,799.17Less : Prior period Items (Net) 0.25 195.93
PROFIT AFTER TAX (BEFORE MINORITY INTEREST) 18,318.05 8,603.24Less : Minority Interest 3,699.65 2,883.20
PROFIT AFTER TAX (AFTER MINORITY INTEREST) 14,618.40 5,720.04Add : Balance brought forward from previous year 24,674.81 19,213.89
Dividend for 2007-2008 on Long term investments froma subsidiary – 738.68Minority Interest adjustment – 724.32
PROFIT AVAILABLE FOR APPROPRIATION 39,293.21 26,396.93Appropriations :Transfer to General Reserve 1,900.00 911.12Proposed Dividend on Preference shares 4.50 4.50Proposed Dividend on Equity shares 555.43 555.43Interim Dividend on Equity shares 1,666.30 –Tax on Dividend (Refer Note No 5 on schedule 'W') 471.35 251.07Balance Carried to the Balance Sheet 34,695.63 24,674.81
39,293.21 26,396.93
BASIC & DILUTED EARNING PER SHARE (Rs) 6.58 2.57(Face value of Re. 1/- each)Refer Note No.14 on Schedule 'W'
Significant Accounting Policies and Notes on Accounts ‘W’
69
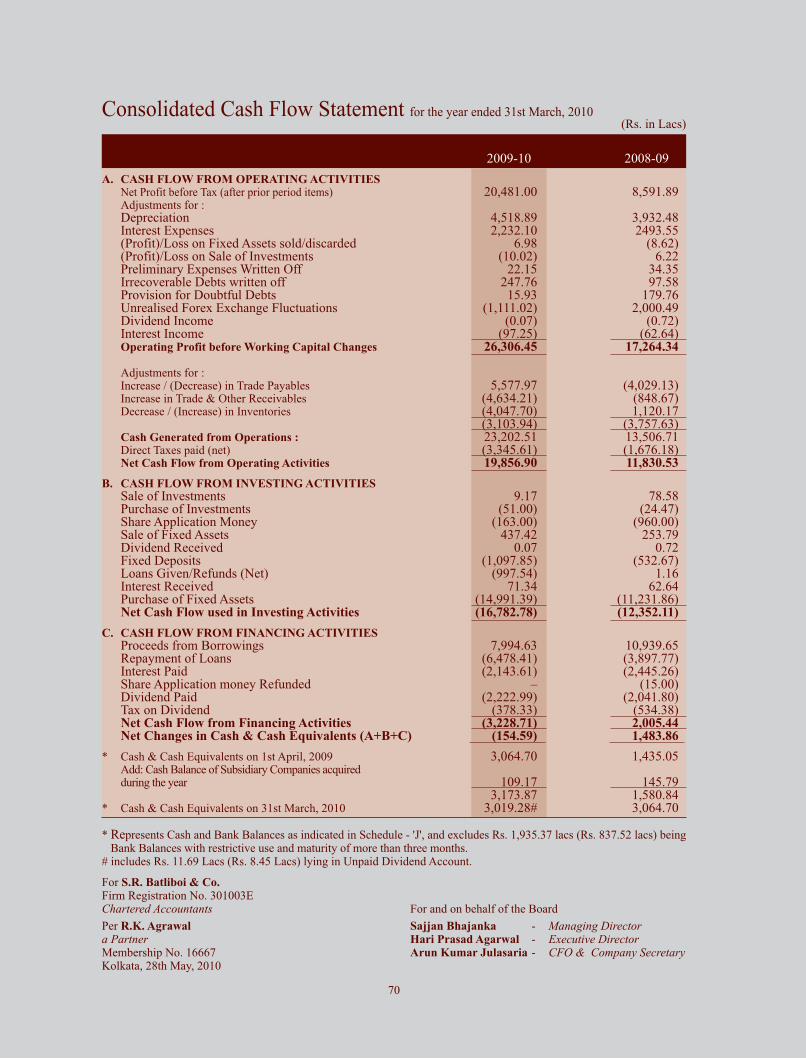
* Represents Cash and Bank Balances as indicated in Schedule - 'J', and excludes Rs. 1,935.37 lacs (Rs. 837.52 lacs) beingBank Balances with restrictive use and maturity of more than three months.
# includes Rs. 11.69 Lacs (Rs. 8.45 Lacs) lying in Unpaid Dividend Account.
For S.R. Batliboi & Co.Firm Registration No. 301003EChartered Accountants For and on behalf of the Board
Per R.K. Agrawal Sajjan Bhajanka - Managing Directora Partner Hari Prasad Agarwal - Executive DirectorMembership No. 16667 Arun Kumar Julasaria - CFO & Company SecretaryKolkata, 28th May, 2010
(Rs. in Lacs)Consolidated Cash Flow Statement for the year ended 31st March, 2010
2009-10 2008-09
A. CASH FLOW FROM OPERATING ACTIVITIES Net Profit before Tax (after prior period items) 20,481.00 8,591.89Adjustments for :Depreciation 4,518.89 3,932.48Interest Expenses 2,232.10 2493.55(Profit)/Loss on Fixed Assets sold/discarded 6.98 (8.62)(Profit)/Loss on Sale of Investments (10.02) 6.22Preliminary Expenses Written Off 22.15 34.35Irrecoverable Debts written off 247.76 97.58Provision for Doubtful Debts 15.93 179.76Unrealised Forex Exchange Fluctuations (1,111.02) 2,000.49Dividend Income (0.07) (0.72)Interest Income (97.25) (62.64)Operating Profit before Working Capital Changes 26,306.45 17,264.34
Adjustments for :Increase / (Decrease) in Trade Payables 5,577.97 (4,029.13)Increase in Trade & Other Receivables (4,634.21) (848.67)Decrease / (Increase) in Inventories (4,047.70) 1,120.17
(3,103.94) (3,757.63)Cash Generated from Operations : 23,202.51 13,506.71Direct Taxes paid (net) (3,345.61) (1,676.18)Net Cash Flow from Operating Activities 19,856.90 11,830.53
B. CASH FLOW FROM INVESTING ACTIVITIESSale of Investments 9.17 78.58Purchase of Investments (51.00) (24.47)Share Application Money (163.00) (960.00)Sale of Fixed Assets 437.42 253.79Dividend Received 0.07 0.72Fixed Deposits (1,097.85) (532.67)Loans Given/Refunds (Net) (997.54) 1.16Interest Received 71.34 62.64Purchase of Fixed Assets (14,991.39) (11,231.86)Net Cash Flow used in Investing Activities (16,782.78) (12,352.11)
C. CASH FLOW FROM FINANCING ACTIVITIESProceeds from Borrowings 7,994.63 10,939.65Repayment of Loans (6,478.41) (3,897.77)Interest Paid (2,143.61) (2,445.26)Share Application money Refunded – (15.00)Dividend Paid (2,222.99) (2,041.80)Tax on Dividend (378.33) (534.38)Net Cash Flow from Financing Activities (3,228.71) 2,005.44Net Changes in Cash & Cash Equivalents (A+B+C) (154.59) 1,483.86
* Cash & Cash Equivalents on 1st April, 2009 3,064.70 1,435.05Add: Cash Balance of Subsidiary Companies acquired during the year 109.17 145.79
3,173.87 1,580.84* Cash & Cash Equivalents on 31st March, 2010 3,019.28# 3,064.70
70
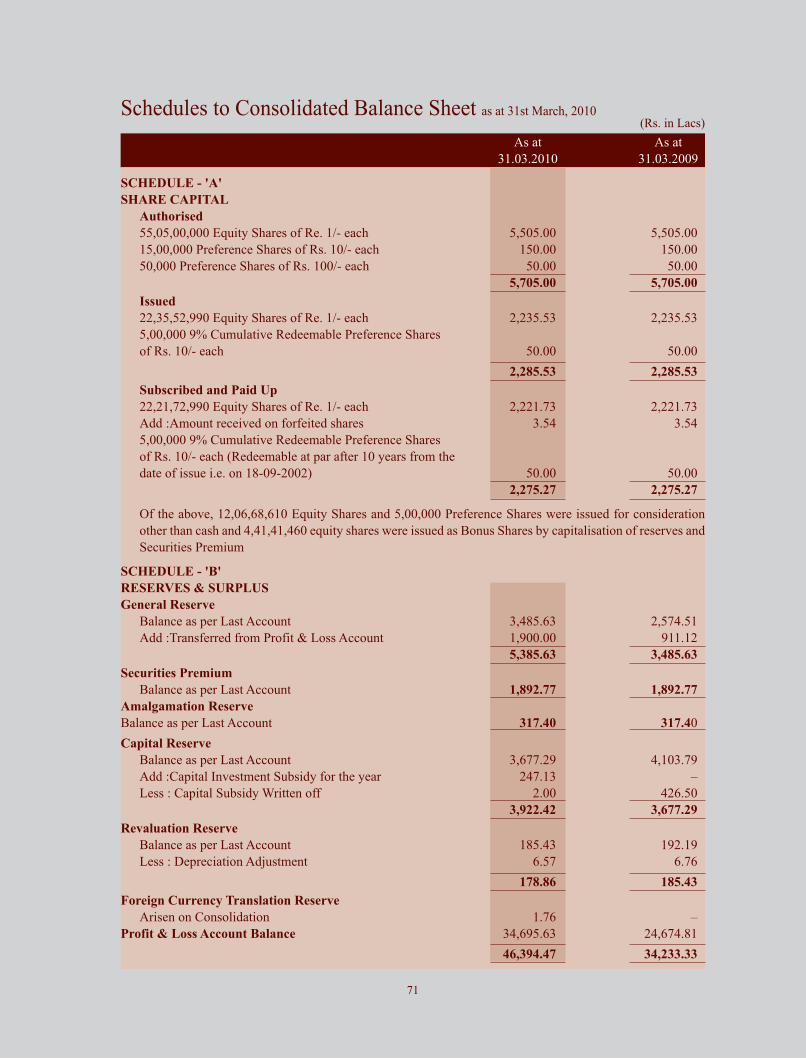
Schedules to Consolidated Balance Sheet as at 31st March, 2010(Rs. in Lacs)
As at As at
31.03.2010 31.03.2009
SCHEDULE - 'A'
SHARE CAPITAL
Authorised
55,05,00,000 Equity Shares of Re. 1/- each 5,505.00 5,505.00
15,00,000 Preference Shares of Rs. 10/- each 150.00 150.00
50,000 Preference Shares of Rs. 100/- each 50.00 50.00
5,705.00 5,705.00
Issued
22,35,52,990 Equity Shares of Re. 1/- each 2,235.53 2,235.53
5,00,000 9% Cumulative Redeemable Preference Shares
of Rs. 10/- each 50.00 50.00
2,285.53 2,285.53
Subscribed and Paid Up
22,21,72,990 Equity Shares of Re. 1/- each 2,221.73 2,221.73
Add :Amount received on forfeited shares 3.54 3.54
5,00,000 9% Cumulative Redeemable Preference Shares
of Rs. 10/- each (Redeemable at par after 10 years from the
date of issue i.e. on 18-09-2002) 50.00 50.00
2,275.27 2,275.27
Of the above, 12,06,68,610 Equity Shares and 5,00,000 Preference Shares were issued for consideration
other than cash and 4,41,41,460 equity shares were issued as Bonus Shares by capitalisation of reserves and
Securities Premium
SCHEDULE - 'B'
RESERVES & SURPLUS
General Reserve
Balance as per Last Account 3,485.63 2,574.51
Add :Transferred from Profit & Loss Account 1,900.00 911.12
5,385.63 3,485.63
Securities Premium
Balance as per Last Account 1,892.77 1,892.77
Amalgamation Reserve
Balance as per Last Account 317.40 317.40
Capital Reserve
Balance as per Last Account 3,677.29 4,103.79
Add :Capital Investment Subsidy for the year 247.13 –
Less : Capital Subsidy Written off 2.00 426.50
3,922.42 3,677.29
Revaluation Reserve
Balance as per Last Account 185.43 192.19
Less : Depreciation Adjustment 6.57 6.76
178.86 185.43
Foreign Currency Translation Reserve
Arisen on Consolidation 1.76 –
Profit & Loss Account Balance 34,695.63 24,674.81
46,394.47 34,233.33
71

Schedules to Consolidated Balance Sheet as at 31st March, 2010(Rs. in Lacs)
As at As at
31.03.2010 31.03.2009
SCHEDULE - 'C'
SECURED LOANS
Rupee Term Loans
From Financial Institution 1,389.72 2,185.23
From Banks 16,325.06 13,325.40
FCNRB Term Loan from a Bank 1,478.84 2,553.06
Buyers' Credit from Banks
For Capital Expenditure 384.59 165.89
For Operational Use 9,094.91 10,326.99
Working Capital Facilities from Banks
Cash Credit 5,610.06 6,280.98
FCNRB Demand Loan 2,649.72 4,054.18
Short Term Loan 1,000.00 –
Hire Purchase Finance
From Banks 109.30 138.65
From Bodies Corporate 684.51 599.63
Interest Accured and due – 3.48
38,726.71 39,633.49
Notes
1. Term Loans are secured/to be secured against first charge on the fixed assets and second charge on thecurrent assets of the respective units of the Company as given below:
Amount (Rs. in Lacs) Location
782.05 (604.05) Plywood and Laminate units at Kanchowki, Dist.-24 Parganas(S),West Bengal
– (47.00) Plywood unit at Chinnappolapuram, Gummidipoondi, Tamil Nadu
598.12 (1145.07) Ferro Alloy Unit at Byrnihat, Meghalaya
1363.77 (1491.15) Plywood Unit at Mirza, Assam
4266.35 (4046.99) Power Unit at Lumsnong, Meghalaya
126.02 (178.85) Plywood Unit at Roorkee, Uttaranchal
12057.31 (10550.58 ) Cement Units at Lumsnong, Meghalaya
2. Working Capital facilities (including buyers' credit) from Banks are secured/to be secured by a first charge onthe current assets and second charge on the fixed assets of the company for the respective units as given below:
Amount (Rs. in Lacs) Location
13484.54 (16337.79) Plywood units at Kanchowki, Dist.-24 Parganas (S),West Bengal;
Chinnapploapuram,Gummidipoondi, Tamilnadu; Taraori,Haryana and
Laminate unit at Kanchowki, Dist.-24 Parganas (S), West Bengal
739.02 (1108.79) Ferro Alloy Unit at Byrnihat, Meghalaya
154.42 (–) Plywood Unit at Mirza, Assam
570.27 (538.30) Plywood Unit at Roorkee, Uttaranchal
3608.21 (2637.70) Cement Units at Lumsnong, Meghalaya
– (39.57) Power Units at Lumsnong, Meghalaya
Further, (i) Buyers Credit of Rs. 35.21 lacs (Rs. Nil) from a Bank, availed against Letter of Credit issued bythe Bank, is secured against fixed deposit with the Bank, and
(ii) Buyers Credit of Rs. 147.61 lacs (Rs. 165.89 lacs) from a Bank, availed against Letter of Credit issuedby the Bank, is secured by first charge on fixed assets of the Company's cement plant on pari passu basis.
3. Term Loans and working capital facilities from Banks/Financial Institutions are also guaranteed by fiveDirectors of the Company and its subsidiaries.
4. Hire Purchase finance is secured by hypothecation of the assets purchased there against.5. The above term loans include Rs. 3598.17 Lacs (Rs. 5064.91 Lacs) falling due for payment within one year.
72
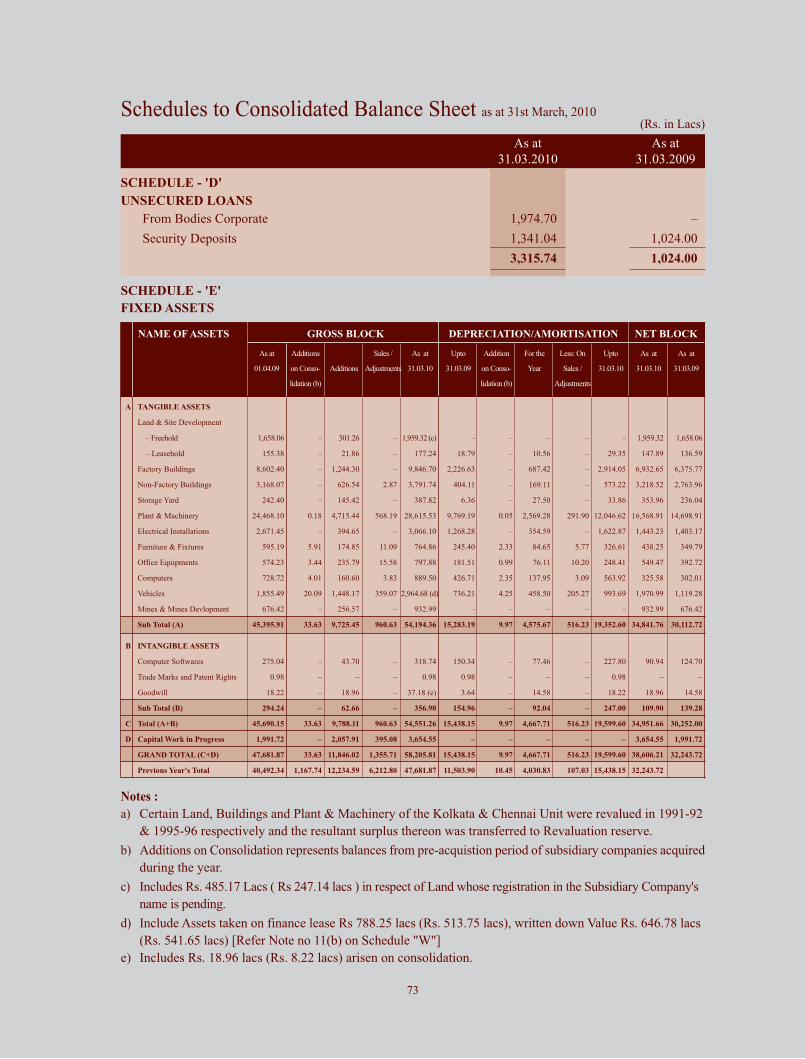
Schedules to Consolidated Balance Sheet as at 31st March, 2010(Rs. in Lacs)
As at As at
31.03.2010 31.03.2009
SCHEDULE - 'D'
UNSECURED LOANS
From Bodies Corporate 1,974.70 –
Security Deposits 1,341.04 1,024.00
3,315.74 1,024.00
SCHEDULE - 'E'
FIXED ASSETS
NAME OF ASSETS GROSS BLOCK DEPRECIATION/AMORTISATION NET BLOCK
As at Additions Sales / As at Upto Addition For the Less: On Upto As at As at
01.04.09 on Conso- Additions Adjustments 31.03.10 31.03.09 on Conso- Year Sales / 31.03.10 31.03.10 31.03.09
lidation (b) lidation (b) Adjustments
A TANGIBLE ASSETS
Land & Site Development
– Freehold 1,658.06 – 301.26 – 1,959.32 (c) – – – – – 1,959.32 1,658.06
– Leasehold 155.38 – 21.86 – 177.24 18.79 – 10.56 – 29.35 147.89 136.59
Factory Buildings 8,602.40 – 1,244.30 – 9,846.70 2,226.63 – 687.42 – 2,914.05 6,932.65 6,375.77
Non-Factory Buildings 3,168.07 – 626.54 2.87 3,791.74 404.11 – 169.11 – 573.22 3,218.52 2,763.96
Storage Yard 242.40 – 145.42 – 387.82 6.36 – 27.50 – 33.86 353.96 236.04
Plant & Machinery 24,468.10 0.18 4,715.44 568.19 28,615.53 9,769.19 0.05 2,569.28 291.90 12,046.62 16,568.91 14,698.91
Electrical Installations 2,671.45 – 394.65 – 3,066.10 1,268.28 – 354.59 – 1,622.87 1,443.23 1,403.17
Furniture & Fixtures 595.19 5.91 174.85 11.09 764.86 245.40 2.33 84.65 5.77 326.61 438.25 349.79
Office Equipments 574.23 3.44 235.79 15.58 797.88 181.51 0.99 76.11 10.20 248.41 549.47 392.72
Computers 728.72 4.01 160.60 3.83 889.50 426.71 2.35 137.95 3.09 563.92 325.58 302.01
Vehicles 1,855.49 20.09 1,448.17 359.07 2,964.68 (d) 736.21 4.25 458.50 205.27 993.69 1,970.99 1,119.28
Mines & Mines Devlopment 676.42 – 256.57 – 932.99 – – – – – 932.99 676.42
Sub Total (A) 45,395.91 33.63 9,725.45 960.63 54,194.36 15,283.19 9.97 4,575.67 516.23 19,352.60 34,841.76 30,112.72
B INTANGIBLE ASSETS
Computer Softwares 275.04 – 43.70 – 318.74 150.34 – 77.46 – 227.80 90.94 124.70
Trade Marks and Patent Rights 0.98 – – – 0.98 0.98 – – – 0.98 – –
Goodwill 18.22 – 18.96 – 37.18 (e) 3.64 – 14.58 – 18.22 18.96 14.58
Sub Total (B) 294.24 – 62.66 – 356.90 154.96 – 92.04 – 247.00 109.90 139.28
C Total (A+B) 45,690.15 33.63 9,788.11 960.63 54,551.26 15,438.15 9.97 4,667.71 516.23 19,599.60 34,951.66 30,252.00
D Capital Work in Progress 1,991.72 – 2,057.91 395.08 3,654.55 – – – – – 3,654.55 1,991.72
GRAND TOTAL (C+D) 47,681.87 33.63 11,846.02 1,355.71 58,205.81 15,438.15 9.97 4,667.71 516.23 19,599.60 38,606.21 32,243.72
Previous Year's Total 40,492.34 1,167.74 12,234.59 6,212.80 47,681.87 11,503.90 10.45 4,030.83 107.03 15,438.15 32,243.72
Notes :
a) Certain Land, Buildings and Plant & Machinery of the Kolkata & Chennai Unit were revalued in 1991-92
& 1995-96 respectively and the resultant surplus thereon was transferred to Revaluation reserve.
b) Additions on Consolidation represents balances from pre-acquistion period of subsidiary companies acquired
during the year.
c) Includes Rs. 485.17 Lacs ( Rs 247.14 lacs ) in respect of Land whose registration in the Subsidiary Company's
name is pending.
d) Include Assets taken on finance lease Rs 788.25 lacs (Rs. 513.75 lacs), written down Value Rs. 646.78 lacs
(Rs. 541.65 lacs) [Refer Note no 11(b) on Schedule "W"]
e) Includes Rs. 18.96 lacs (Rs. 8.22 lacs) arisen on consolidation.
73
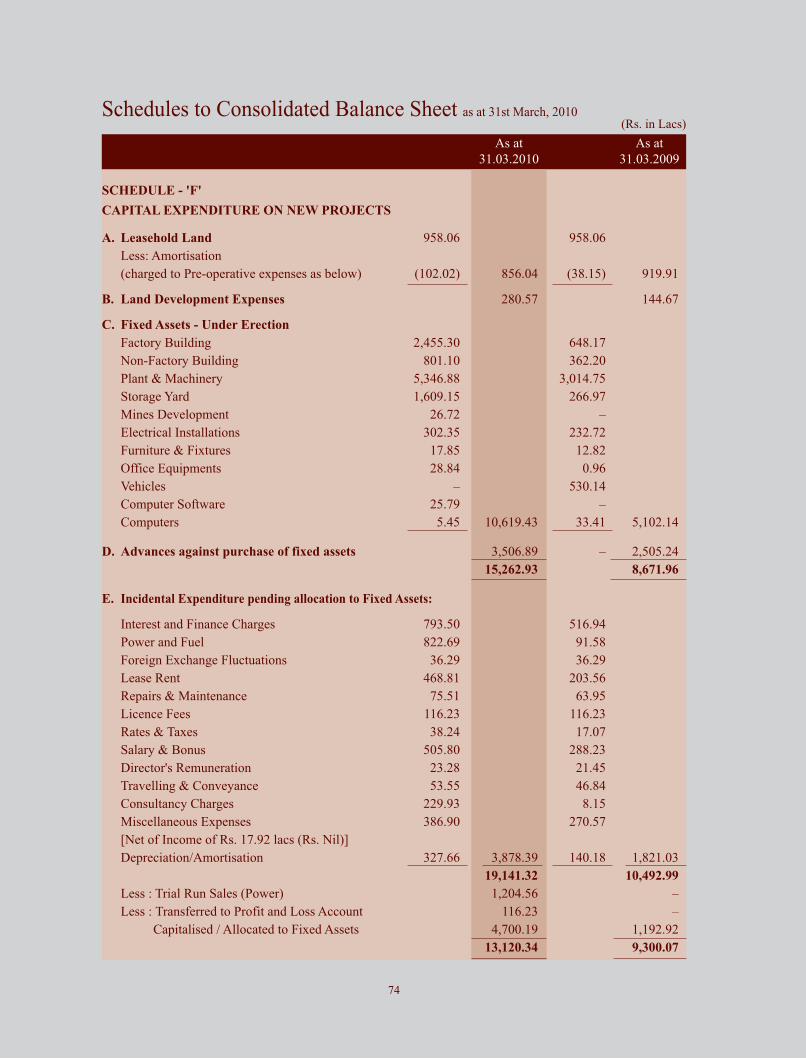
Schedules to Consolidated Balance Sheet as at 31st March, 2010(Rs. in Lacs)
As at As at
31.03.2010 31.03.2009
SCHEDULE - 'F'
CAPITAL EXPENDITURE ON NEW PROJECTS
A. Leasehold Land 958.06 958.06
Less: Amortisation
(charged to Pre-operative expenses as below) (102.02) 856.04 (38.15) 919.91
B. Land Development Expenses 280.57 144.67
C. Fixed Assets - Under Erection
Factory Building 2,455.30 648.17
Non-Factory Building 801.10 362.20
Plant & Machinery 5,346.88 3,014.75
Storage Yard 1,609.15 266.97
Mines Development 26.72 –
Electrical Installations 302.35 232.72
Furniture & Fixtures 17.85 12.82
Office Equipments 28.84 0.96
Vehicles – 530.14
Computer Software 25.79 –
Computers 5.45 10,619.43 33.41 5,102.14
D. Advances against purchase of fixed assets 3,506.89 – 2,505.24
15,262.93 8,671.96
E. Incidental Expenditure pending allocation to Fixed Assets:
Interest and Finance Charges 793.50 516.94
Power and Fuel 822.69 91.58
Foreign Exchange Fluctuations 36.29 36.29
Lease Rent 468.81 203.56
Repairs & Maintenance 75.51 63.95
Licence Fees 116.23 116.23
Rates & Taxes 38.24 17.07
Salary & Bonus 505.80 288.23
Director's Remuneration 23.28 21.45
Travelling & Conveyance 53.55 46.84
Consultancy Charges 229.93 8.15
Miscellaneous Expenses 386.90 270.57
[Net of Income of Rs. 17.92 lacs (Rs. Nil)]
Depreciation/Amortisation 327.66 3,878.39 140.18 1,821.03
19,141.32 10,492.99
Less : Trial Run Sales (Power) 1,204.56 –
Less : Transferred to Profit and Loss Account 116.23 –
Capitalised / Allocated to Fixed Assets 4,700.19 1,192.92
13,120.34 9,300.07
74
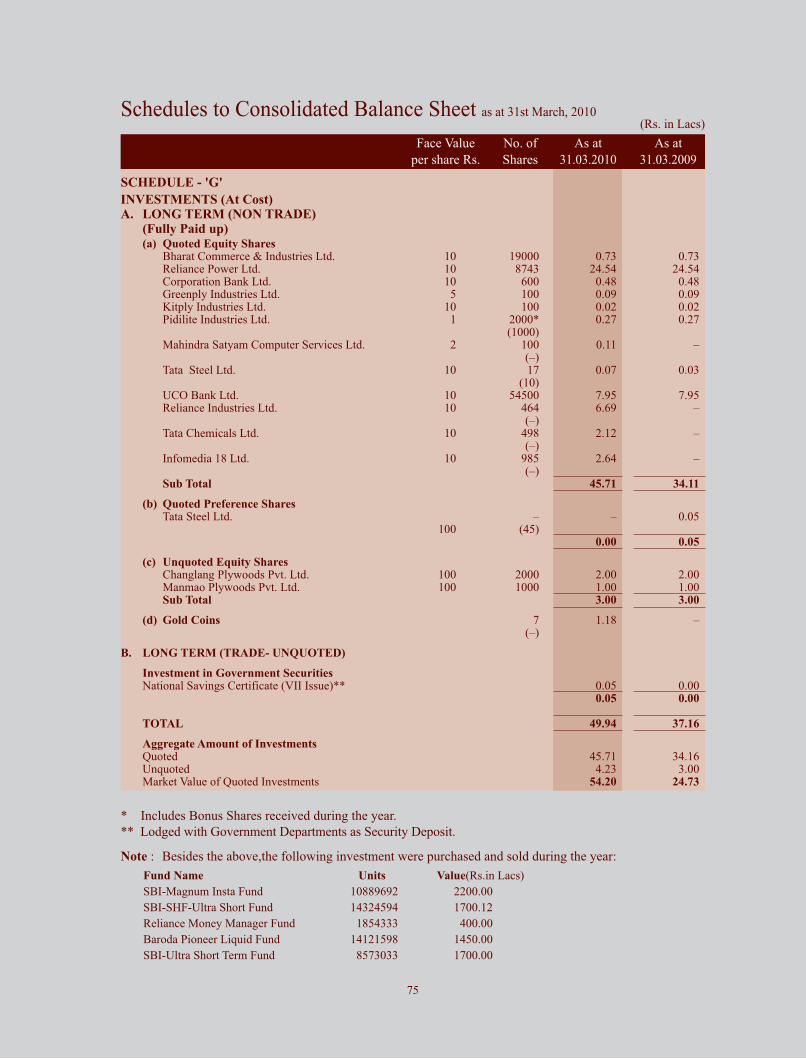
Schedules to Consolidated Balance Sheet as at 31st March, 2010(Rs. in Lacs)
Face Value No. of As at As at
per share Rs. Shares 31.03.2010 31.03.2009
SCHEDULE - 'G'
INVESTMENTS (At Cost)A. LONG TERM (NON TRADE)
(Fully Paid up)(a) Quoted Equity Shares
Bharat Commerce & Industries Ltd. 10 19000 0.73 0.73Reliance Power Ltd. 10 8743 24.54 24.54Corporation Bank Ltd. 10 600 0.48 0.48Greenply Industries Ltd. 5 100 0.09 0.09Kitply Industries Ltd. 10 100 0.02 0.02Pidilite Industries Ltd. 1 2000* 0.27 0.27
(1000)Mahindra Satyam Computer Services Ltd. 2 100 0.11 –
(–)Tata Steel Ltd. 10 17 0.07 0.03
(10)UCO Bank Ltd. 10 54500 7.95 7.95Reliance Industries Ltd. 10 464 6.69 –
(–)Tata Chemicals Ltd. 10 498 2.12 –
(–)Infomedia 18 Ltd. 10 985 2.64 –
(–)Sub Total 45.71 34.11
(b) Quoted Preference SharesTata Steel Ltd. – – 0.05
100 (45)0.00 0.05
(c) Unquoted Equity Shares Changlang Plywoods Pvt. Ltd. 100 2000 2.00 2.00Manmao Plywoods Pvt. Ltd. 100 1000 1.00 1.00Sub Total 3.00 3.00
(d) Gold Coins 7 1.18 –(–)
B. LONG TERM (TRADE- UNQUOTED)
Investment in Government SecuritiesNational Savings Certificate (VII Issue)** 0.05 0.00
0.05 0.00
TOTAL 49.94 37.16
Aggregate Amount of InvestmentsQuoted 45.71 34.16Unquoted 4.23 3.00Market Value of Quoted Investments 54.20 24.73
* Includes Bonus Shares received during the year.
** Lodged with Government Departments as Security Deposit.
Note : Besides the above,the following investment were purchased and sold during the year:
Fund Name Units Value(Rs.in Lacs)
SBI-Magnum Insta Fund 10889692 2200.00
SBI-SHF-Ultra Short Fund 14324594 1700.12
Reliance Money Manager Fund 1854333 400.00
Baroda Pioneer Liquid Fund 14121598 1450.00
SBI-Ultra Short Term Fund 8573033 1700.00
75
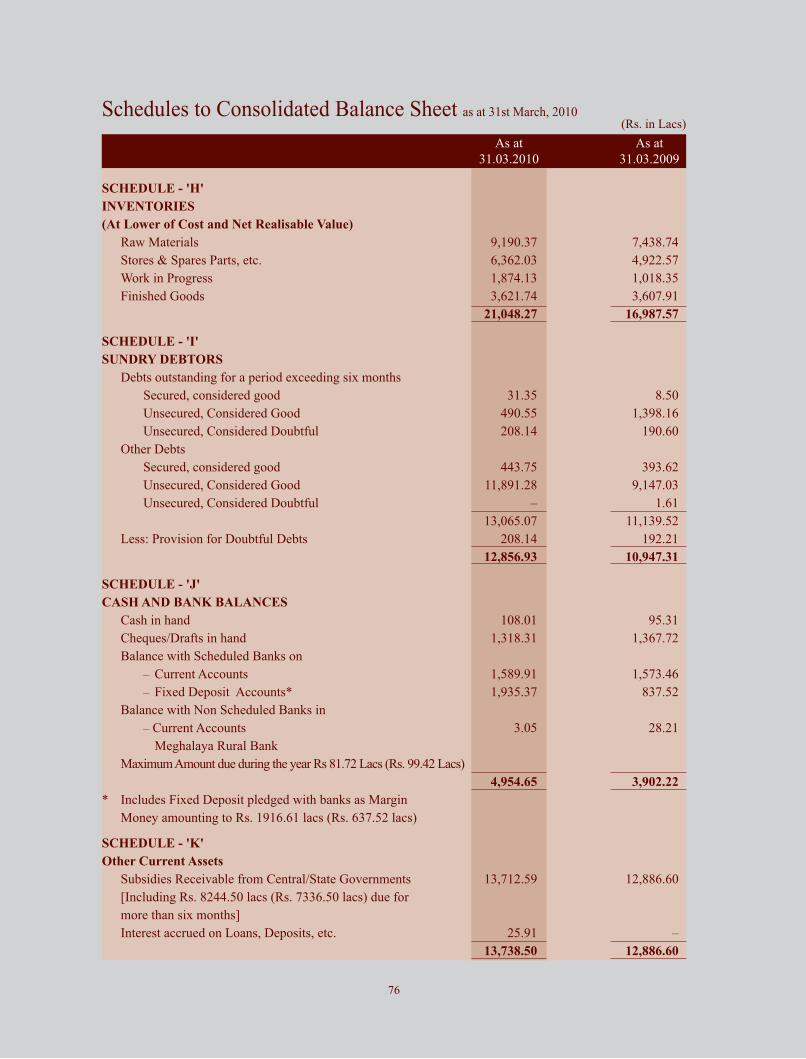
Schedules to Consolidated Balance Sheet as at 31st March, 2010(Rs. in Lacs)
As at As at
31.03.2010 31.03.2009
SCHEDULE - 'H'
INVENTORIES
(At Lower of Cost and Net Realisable Value)
Raw Materials 9,190.37 7,438.74
Stores & Spares Parts, etc. 6,362.03 4,922.57
Work in Progress 1,874.13 1,018.35
Finished Goods 3,621.74 3,607.91
21,048.27 16,987.57
SCHEDULE - 'I'
SUNDRY DEBTORS
Debts outstanding for a period exceeding six months
Secured, considered good 31.35 8.50
Unsecured, Considered Good 490.55 1,398.16
Unsecured, Considered Doubtful 208.14 190.60
Other Debts
Secured, considered good 443.75 393.62
Unsecured, Considered Good 11,891.28 9,147.03
Unsecured, Considered Doubtful – 1.61
13,065.07 11,139.52
Less: Provision for Doubtful Debts 208.14 192.21
12,856.93 10,947.31
SCHEDULE - 'J'
CASH AND BANK BALANCES
Cash in hand 108.01 95.31
Cheques/Drafts in hand 1,318.31 1,367.72
Balance with Scheduled Banks on
– Current Accounts 1,589.91 1,573.46
– Fixed Deposit Accounts* 1,935.37 837.52
Balance with Non Scheduled Banks in
– Current Accounts 3.05 28.21
Meghalaya Rural Bank
Maximum Amount due during the year Rs 81.72 Lacs (Rs. 99.42 Lacs)
4,954.65 3,902.22
* Includes Fixed Deposit pledged with banks as Margin
Money amounting to Rs. 1916.61 lacs (Rs. 637.52 lacs)
SCHEDULE - 'K'
Other Current Assets
Subsidies Receivable from Central/State Governments 13,712.59 12,886.60
[Including Rs. 8244.50 lacs (Rs. 7336.50 lacs) due for
more than six months]
Interest accrued on Loans, Deposits, etc. 25.91 –
13,738.50 12,886.60
76

Schedules to Consolidated Balance Sheet as at 31st March, 2010
(Rs. in Lacs)
As at As at
31.03.2010 31.03.2009
SCHEDULE - 'L'
LOANS AND ADVANCES
(Unsecured, considered good)
Loan to Bodies Corporate 1,000.00 –
Loan to Employees (Bearing Interest) 4.51 6.97
Advances recoverable in cash or in kind or for value to be received * 5,641.84 5,063.77
Share Application Money 354.00 191.00
Advance Income Tax (Net of Provisions) 380.89 414.33
MAT Credit Entitlement 3,302.52 1,981.41
Deposits 770.24 784.28
Balance with Excise, Customs and Other Government Authorities 2,349.07 2,163.73
13,803.07 10,605.49
*Amount due from a Director of the company – 0.70
Maximum amount due at any time during the year 0.70 0.70
SCHEDULE - 'M'
CURRENT LIABILITIES & PROVISIONS
a) CURRENT LIABILITIES
Sundry Creditors
– Dues to Micro and Small Enterprises
(Refer Note No. 10 on Schedule 'W) 0.13 –
– Dues to Others 7,310.53 4,211.31
Investor Education and Protection Fund (Payable when due)
– Unpaid Dividend 11.69 8.45
Advance from Customers 302.33 593.87
Other Liabilities 6,259.64 4,258.16
Interest accrued but not due on loans 146.06 54.09
14,030.38 9,125.88
b) PROVISIONS
Retirement Benefits 261.65 336.73
Fringe Benefit Tax (Net) – 11.33
Proposed Dividend 559.93 559.93
Tax on Dividend 93.02 –
914.60 907.99
SCHEDULE - 'N'
MISCELLANEOUS EXPENDITURE
(to the extent not written off/adjusted)
Preliminary Expenses 16.82 38.83
16.82 38.83
77
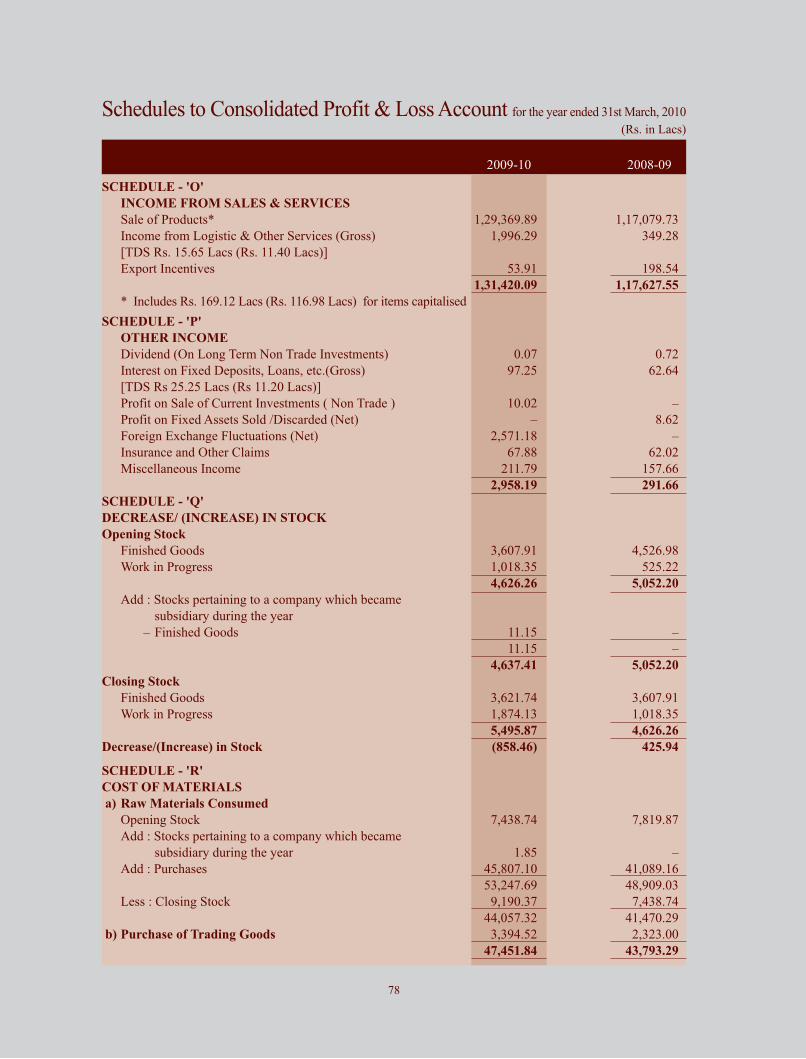
Schedules to Consolidated Profit & Loss Account for the year ended 31st March, 2010
(Rs. in Lacs)
2009-10 2008-09
SCHEDULE - 'O'
INCOME FROM SALES & SERVICES
Sale of Products* 1,29,369.89 1,17,079.73
Income from Logistic & Other Services (Gross) 1,996.29 349.28
[TDS Rs. 15.65 Lacs (Rs. 11.40 Lacs)]
Export Incentives 53.91 198.54
1,31,420.09 1,17,627.55
* Includes Rs. 169.12 Lacs (Rs. 116.98 Lacs) for items capitalised
SCHEDULE - 'P'
OTHER INCOME
Dividend (On Long Term Non Trade Investments) 0.07 0.72
Interest on Fixed Deposits, Loans, etc.(Gross) 97.25 62.64
[TDS Rs 25.25 Lacs (Rs 11.20 Lacs)]
Profit on Sale of Current Investments ( Non Trade ) 10.02 –
Profit on Fixed Assets Sold /Discarded (Net) – 8.62
Foreign Exchange Fluctuations (Net) 2,571.18 –
Insurance and Other Claims 67.88 62.02
Miscellaneous Income 211.79 157.66
2,958.19 291.66
SCHEDULE - 'Q'
DECREASE/ (INCREASE) IN STOCK
Opening Stock
Finished Goods 3,607.91 4,526.98
Work in Progress 1,018.35 525.22
4,626.26 5,052.20
Add : Stocks pertaining to a company which became
subsidiary during the year
– Finished Goods 11.15 –
11.15 –
4,637.41 5,052.20
Closing Stock
Finished Goods 3,621.74 3,607.91
Work in Progress 1,874.13 1,018.35
5,495.87 4,626.26
Decrease/(Increase) in Stock (858.46) 425.94
SCHEDULE - 'R'
COST OF MATERIALS
a) Raw Materials Consumed
Opening Stock 7,438.74 7,819.87
Add : Stocks pertaining to a company which became
subsidiary during the year 1.85 –
Add : Purchases 45,807.10 41,089.16
53,247.69 48,909.03
Less : Closing Stock 9,190.37 7,438.74
44,057.32 41,470.29
b) Purchase of Trading Goods 3,394.52 2,323.00
47,451.84 43,793.29
78
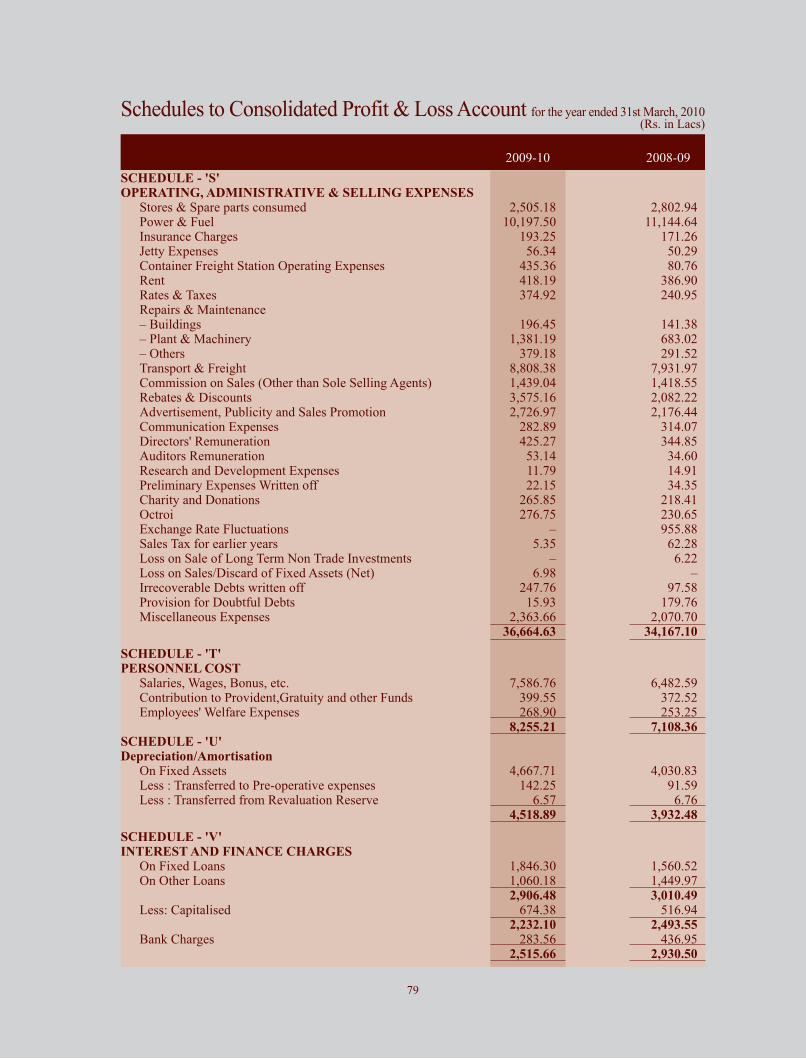
Schedules to Consolidated Profit & Loss Account for the year ended 31st March, 2010(Rs. in Lacs)
2009-10 2008-09
SCHEDULE - 'S'OPERATING, ADMINISTRATIVE & SELLING EXPENSES
Stores & Spare parts consumed 2,505.18 2,802.94Power & Fuel 10,197.50 11,144.64Insurance Charges 193.25 171.26Jetty Expenses 56.34 50.29Container Freight Station Operating Expenses 435.36 80.76 Rent 418.19 386.90Rates & Taxes 374.92 240.95Repairs & Maintenance– Buildings 196.45 141.38– Plant & Machinery 1,381.19 683.02– Others 379.18 291.52Transport & Freight 8,808.38 7,931.97Commission on Sales (Other than Sole Selling Agents) 1,439.04 1,418.55Rebates & Discounts 3,575.16 2,082.22Advertisement, Publicity and Sales Promotion 2,726.97 2,176.44Communication Expenses 282.89 314.07Directors' Remuneration 425.27 344.85Auditors Remuneration 53.14 34.60Research and Development Expenses 11.79 14.91Preliminary Expenses Written off 22.15 34.35Charity and Donations 265.85 218.41Octroi 276.75 230.65Exchange Rate Fluctuations – 955.88Sales Tax for earlier years 5.35 62.28Loss on Sale of Long Term Non Trade Investments – 6.22 Loss on Sales/Discard of Fixed Assets (Net) 6.98 –Irrecoverable Debts written off 247.76 97.58Provision for Doubtful Debts 15.93 179.76Miscellaneous Expenses 2,363.66 2,070.70
36,664.63 34,167.10
SCHEDULE - 'T'PERSONNEL COST
Salaries, Wages, Bonus, etc. 7,586.76 6,482.59Contribution to Provident,Gratuity and other Funds 399.55 372.52Employees' Welfare Expenses 268.90 253.25
8,255.21 7,108.36SCHEDULE - 'U'Depreciation/Amortisation
On Fixed Assets 4,667.71 4,030.83Less : Transferred to Pre-operative expenses 142.25 91.59Less : Transferred from Revaluation Reserve 6.57 6.76
4,518.89 3,932.48
SCHEDULE - 'V'INTEREST AND FINANCE CHARGES
On Fixed Loans 1,846.30 1,560.52On Other Loans 1,060.18 1,449.97
2,906.48 3,010.49Less: Capitalised 674.38 516.94
2,232.10 2,493.55Bank Charges 283.56 436.95
2,515.66 2,930.50
79
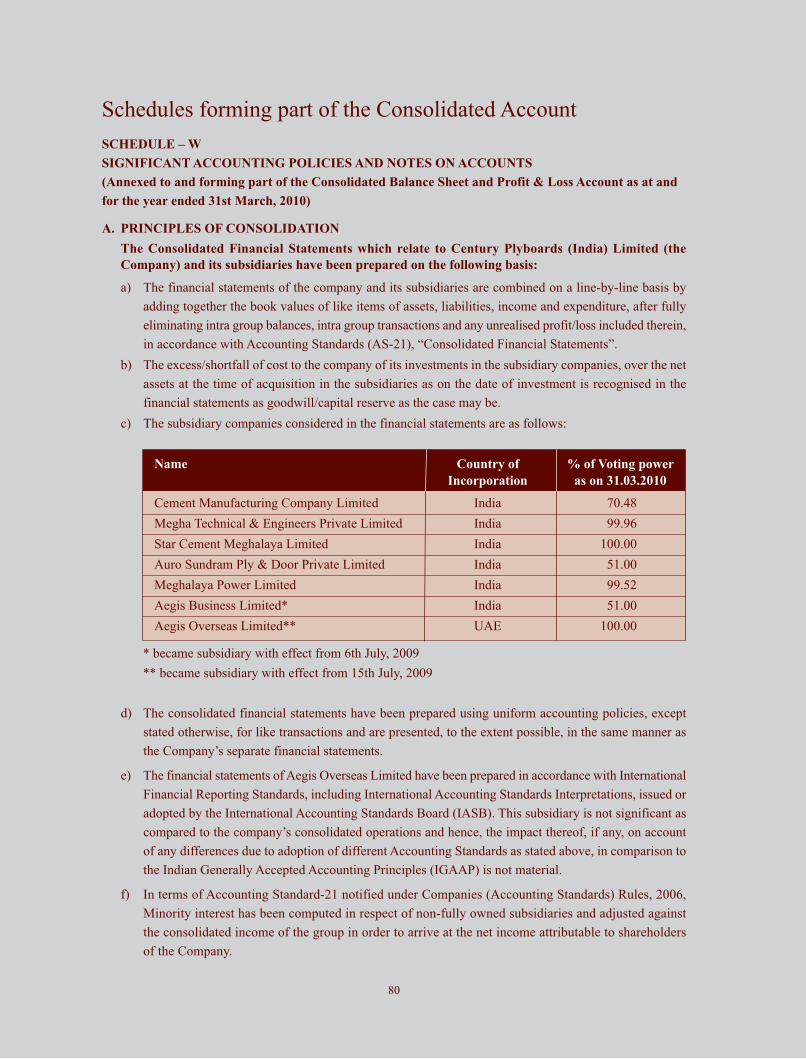
Schedules forming part of the Consolidated Account
SCHEDULE – W
SIGNIFICANT ACCOUNTING POLICIES AND NOTES ON ACCOUNTS
(Annexed to and forming part of the Consolidated Balance Sheet and Profit & Loss Account as at and
for the year ended 31st March, 2010)
A. PRINCIPLES OF CONSOLIDATION
The Consolidated Financial Statements which relate to Century Plyboards (India) Limited (the
Company) and its subsidiaries have been prepared on the following basis:
a) The financial statements of the company and its subsidiaries are combined on a line-by-line basis by
adding together the book values of like items of assets, liabilities, income and expenditure, after fully
eliminating intra group balances, intra group transactions and any unrealised profit/loss included therein,
in accordance with Accounting Standards (AS-21), “Consolidated Financial Statements”.
b) The excess/shortfall of cost to the company of its investments in the subsidiary companies, over the net
assets at the time of acquisition in the subsidiaries as on the date of investment is recognised in the
financial statements as goodwill/capital reserve as the case may be.
c) The subsidiary companies considered in the financial statements are as follows:
Name Country of % of Voting power
Incorporation as on 31.03.2010
Cement Manufacturing Company Limited India 70.48
Megha Technical & Engineers Private Limited India 99.96
Star Cement Meghalaya Limited India 100.00
Auro Sundram Ply & Door Private Limited India 51.00
Meghalaya Power Limited India 99.52
Aegis Business Limited* India 51.00
Aegis Overseas Limited** UAE 100.00
* became subsidiary with effect from 6th July, 2009
** became subsidiary with effect from 15th July, 2009
d) The consolidated financial statements have been prepared using uniform accounting policies, except
stated otherwise, for like transactions and are presented, to the extent possible, in the same manner as
the Company’s separate financial statements.
e) The financial statements of Aegis Overseas Limited have been prepared in accordance with International
Financial Reporting Standards, including International Accounting Standards Interpretations, issued or
adopted by the International Accounting Standards Board (IASB). This subsidiary is not significant as
compared to the company’s consolidated operations and hence, the impact thereof, if any, on account
of any differences due to adoption of different Accounting Standards as stated above, in comparison to
the Indian Generally Accepted Accounting Principles (IGAAP) is not material.
f) In terms of Accounting Standard-21 notified under Companies (Accounting Standards) Rules, 2006,
Minority interest has been computed in respect of non-fully owned subsidiaries and adjusted against
the consolidated income of the group in order to arrive at the net income attributable to shareholders
of the Company.
80
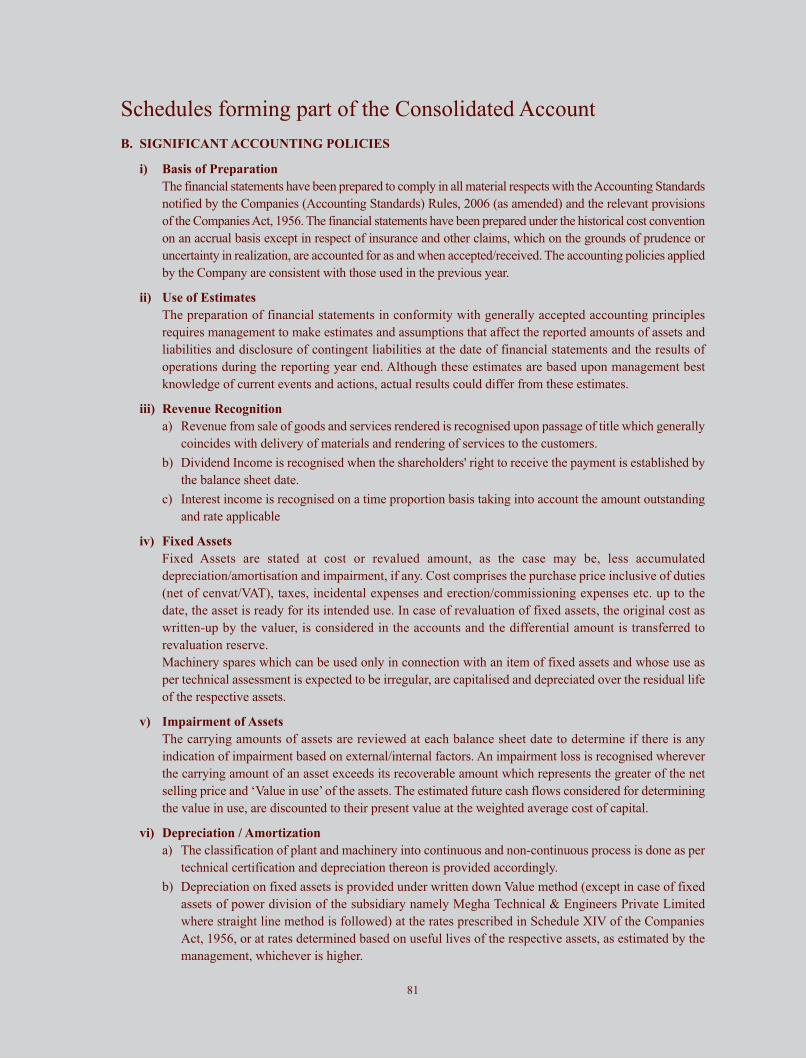
Schedules forming part of the Consolidated Account
B. SIGNIFICANT ACCOUNTING POLICIES
i) Basis of Preparation
The financial statements have been prepared to comply in all material respects with the Accounting Standards
notified by the Companies (Accounting Standards) Rules, 2006 (as amended) and the relevant provisions
of the Companies Act, 1956. The financial statements have been prepared under the historical cost convention
on an accrual basis except in respect of insurance and other claims, which on the grounds of prudence or
uncertainty in realization, are accounted for as and when accepted/received. The accounting policies applied
by the Company are consistent with those used in the previous year.
ii) Use of Estimates
The preparation of financial statements in conformity with generally accepted accounting principles
requires management to make estimates and assumptions that affect the reported amounts of assets and
liabilities and disclosure of contingent liabilities at the date of financial statements and the results of
operations during the reporting year end. Although these estimates are based upon management best
knowledge of current events and actions, actual results could differ from these estimates.
iii) Revenue Recognition
a) Revenue from sale of goods and services rendered is recognised upon passage of title which generally
coincides with delivery of materials and rendering of services to the customers.
b) Dividend Income is recognised when the shareholders' right to receive the payment is established by
the balance sheet date.
c) Interest income is recognised on a time proportion basis taking into account the amount outstanding
and rate applicable
iv) Fixed Assets
Fixed Assets are stated at cost or revalued amount, as the case may be, less accumulated
depreciation/amortisation and impairment, if any. Cost comprises the purchase price inclusive of duties
(net of cenvat/VAT), taxes, incidental expenses and erection/commissioning expenses etc. up to the
date, the asset is ready for its intended use. In case of revaluation of fixed assets, the original cost as
written-up by the valuer, is considered in the accounts and the differential amount is transferred to
revaluation reserve.
Machinery spares which can be used only in connection with an item of fixed assets and whose use as
per technical assessment is expected to be irregular, are capitalised and depreciated over the residual life
of the respective assets.
v) Impairment of Assets
The carrying amounts of assets are reviewed at each balance sheet date to determine if there is any
indication of impairment based on external/internal factors. An impairment loss is recognised wherever
the carrying amount of an asset exceeds its recoverable amount which represents the greater of the net
selling price and ‘Value in use’ of the assets. The estimated future cash flows considered for determining
the value in use, are discounted to their present value at the weighted average cost of capital.
vi) Depreciation / Amortization
a) The classification of plant and machinery into continuous and non-continuous process is done as per
technical certification and depreciation thereon is provided accordingly.
b) Depreciation on fixed assets is provided under written down Value method (except in case of fixed
assets of power division of the subsidiary namely Megha Technical & Engineers Private Limited
where straight line method is followed) at the rates prescribed in Schedule XIV of the Companies
Act, 1956, or at rates determined based on useful lives of the respective assets, as estimated by the
management, whichever is higher.
81
Schedules forming part of the Consolidated Account
c) Depreciation on revalued assets is provided at the rates specified under section 205 (2)(b) of the
Companies Act, 1956. However, in case of fixed assets whose life is determined by the valuer to be
less than their useful life under section 205, depreciation is provided at higher rate, to ensure the write
offof these assets over their useful life.
d) Depreciation on fixed assets added/disposed of during the year is provided on pro-rata basis with
reference to the date of addition/disposal.
e) Leasehold properties are depreciated over the primary period of lease or their respective useful lives,
whichever is shorter.
f) Intangible assets are amortised on a written down value method over a period of 5 years except in case
of subsidiary companies where the same is written off over a period of 3 years.
g) In case of impairment, depreciation is provided on the revised carrying amount of the assets over its
remaining useful life.
vii) Foreign Currency Transactions
(a) Initial Recognition
Foreign currency transactions are recorded in the reporting currency, by applying to the foreign
currency amount the exchange rate between the reporting currency and the foreign currency at the
date of the transaction.
(b) Conversion
Foreign currency monetary items are reported using the closing rate. Non-monetary items which
are carried in terms of historical cost denominated in a foreign currency are reported using the
exchange rate at the date of the transaction, and non-monetary items which are carried at fair value
or other similar valuation denominated in a foreign currency are reported using the exchange rates
that existed when the values were determined.
(c) Exchange Differences
Exchange differences arising on the settlement/conversion of monetary items are recognised as income
or expenses in the year in which they arise.
(d) Forward Exchange Contracts not entered for trading or speculation purpose
The premium or discount arising at the inception of forward exchange contracts is amortised as expenses
or income over the life of the respective contracts. Exchange differences on such contracts are recognised
in the statement of profit and loss in the period in which the exchange rates change. Any profit or loss arising
on cancellation or renewal of forward exchange contracts is recognised as income or expense for the year.
viii)Investments
Investments that are readily realisable and intended to be held for not more than a year are classifiedas
Current investments. All other investments are classified as long-term investments. Current investments
are carried at lower of cost and market value on individual investment basis. Long Term Investments are
considered at cost, unless there is an "other than temporary" decline in value, in which case adequate
provision is made for the diminution in the value of Investments.
ix) Inventories
Raw Materials, stores and spares are valued at lower of cost and net realizable value. However, these
items are considered to be realizable at cost if the finished products, in which they will be used, are
expected to be sold at or above cost.
Work in progress and finished goods are valued at lower of cost and net realisable value. Cost includes
direct materials & labour and a part of manufacturing overheads based on normal operating capacity.
Cost of finished goods includes excise duty.
Cost of Inventories is computed on Weighted Average Basis/FIFO.
82

Schedules forming part of the Consolidated Account
Net realizable value is the estimated selling price in the ordinary course of business, less estimated costs
of completion and estimated costs necessary to make the sale.
x) Government Grants and subsidies
Government Grants and subsidies are recognised when there is a reasonable assurance that the same will
be received. Revenue grants/subsidies are recognised in the Profit & Loss Account. Capital grants relating
to specific fixed assets are reduced from the gross value of the respective fixed assets. Other capital grants
are credited to capital reserve.
xi) Research Costs and Development costs
Research costs are expensed as incurred. Development expenditure incurred on an individual project is carried
forward when its future recoverability can reasonably be regarded as assured. Any expenditure carried forward
is amortised over the period of expected future sales from the related project, not exceeding ten years.
The carrying value of development costs is reviewed for impairment annually when the asset is not yet
in use, and otherwise when events or changes in circumstances indicates that the carrying value may not
be recoverable.
xii) Retirement and other employee benefits
(a) Retirement benefit in the form of Provident Fund is a defined contribution scheme and is charged to
the Profit and Loss Account of the year when the contributions to the respective funds are due. The
Company has no obligations other than the contribution payable to the respective funds.
(b) Gratuity liability, being a defined benefit obligation, is provided for on the basis of an actuarial
valuation on projected unit credit method made at the end of each financial year.
(c) Short term compensated absences are provided for based on estimates.Long term compensated
absences are provided for based on actuarial valuation which is done as per projected unit credit
method at the end of each financial year.
(d) Actuarial gains/losses are immediately taken to profit and loss account and are not deferred.
xiii)Miscellaneous Expenditure
Preliminary expenses in respect of subsidiary companies are written off over a period of five years after
commencement of commercial production.
xiv)Earning per Share
Basic Earning per Share is calculated by dividing the net profit or loss for the year attributable to equity
shareholders by the weighted number of equity shares outstanding during the year.
For the purpose of calculating diluted earning per share, net profit or loss for the year attributable to
equity shareholders and the weighted average number of shares outstanding during the year are adjusted
for the effect of all dilutive potential equity shares.
xv) Excise Duty and Custom Duty
Excise duty on finished goods stock lying at the factories is accounted for at the point of manufacture of
goods and accordingly, is considered for valuation of finished goods stock lying in the factories as on the
balance sheet date. Similarly, customs duty on imported material in transit/lying in bonded warehouse is
accounted for at the time of import/bonding of materials.
xvi)Borrowing Costs
Borrowing costs relating to acquisition/construction of qualifying assets are capitalised until the time all
substantial activities necessary to prepare the qualifying assets for their intended use are complete. A
qualifying asset is one that necessarily takes substantial period of time to get ready for its intended use.
All other borrowing costs are charged to revenue.
xvii)Taxation
Tax expenses comprises of current and deferred tax. Current income tax is measured at the amount
expected to be paid to the tax authorities in accordance with the Indian Income Tax Act, 1961. Deferred
income taxes reflect the impact of current year timing differences between taxable income for the year
and reversal of timing differences of earlier years.
83

Schedules forming part of the Consolidated Account
The deferred tax for timing differences between the book and tax profits for the year is accounted for using
the tax rates and laws that have been substantially enacted as of the Balance Sheet date. Deferred tax assets
and deferred tax liabilities are offset, if a legally enforceable right exists to set off current tax assets against
current tax liabilities and the deferred tax assets and deferred tax liabilities relate to the taxes on income
levied by same governing taxation laws. Deferred tax assets are recognised only to the extent that there is
reasonable certainty that sufficient future taxable income will be available against which such deferred tax
assets can be realised. If the company has carry forward unabsorbed depreciation and tax losses, deferred
tax assets are recognised only to the extent there is virtual certainty supported by convincing evidence that
sufficient taxable income will be available against which such deferred tax asset can be realised.
The carrying amounts of deferred tax assets are reviewed at each balance sheet date. The company writes-down
the carrying amount of deferred tax assets to the extent that it is no longer reasonably certain or virtually certain,
as the case may be, that sufficient future taxable income will be available against which deferred tax asset can
be realised. Any such write-down is reversed to the extent that it becomes reasonably certain or virtually certain,
as the case may be, that sufficient future taxable income will be available.
Minimum Alternative Tax (MAT) credit is recognised as an asset only when and to the extent there is
convincing evidence that the company will pay normal income tax during the specified period. The
company reviews the carrying amount of MAT at each Balance Sheet date and writes down MAT credit
entitlement to the extent there is no longer convincing evidence to the effect that the company will pay
normal income-tax during specified period.
xviii)Segment Reporting
a) Identification of segments
The company has identified that its business segments are the primary segments. The Company’s
business are organised and managed separately according to the nature of products/services, with
each segment representing a strategic business unit that offers different product/services and serves
different markets. The analysis of geographical segments is based on the areas in which the customers
of the company are located.
b) Inter-segment transfers
The Company generally accounts for inter-segment sales and transfers at current market prices.
c) Allocation of Common Costs
Common allocable costs are allocated to each segment on case to case basis applying the ratio, appropriate
to each relevant case. Revenues and expenses, which relate to the enterprise as a whole and are not
allocable to segment on a reasonable basis, have been included under the head “Unallocated”.
The accounting policies adopted for segment reporting are in line with those of the Company’s
accounting policies.
xix)Fixed Assets acquired under Lease
a) Finance Lease
Assets acquired under lease agreements which effectively transfer to the company substantially all
the risk and benefits incidental to ownership of the leased items, are capitalised at the lower of the
fair value and present value of minimum lease payment at the inception of the lease term and
disclosed as leased assets. Lease payments are apportioned between the finance charges and the
reduction of the lease liability so as to achieve a constant rate of interest on the remaining balance
of their liability. Finance charges are charged directly to the expenses account.
b) Operating Lease
Leases where the lessor effectively retains substantially all the risks and benefits of the ownership
of the leased assets are classified as operating leases. Operating lease payments are recognised as an
expense in the profit and loss account.
xx) Cash and Cash equivalents
Cash and cash equivalents in the cash flow statement comprise of cash at bank and in hand and short-term
investments with an original maturity of three months or less.
84
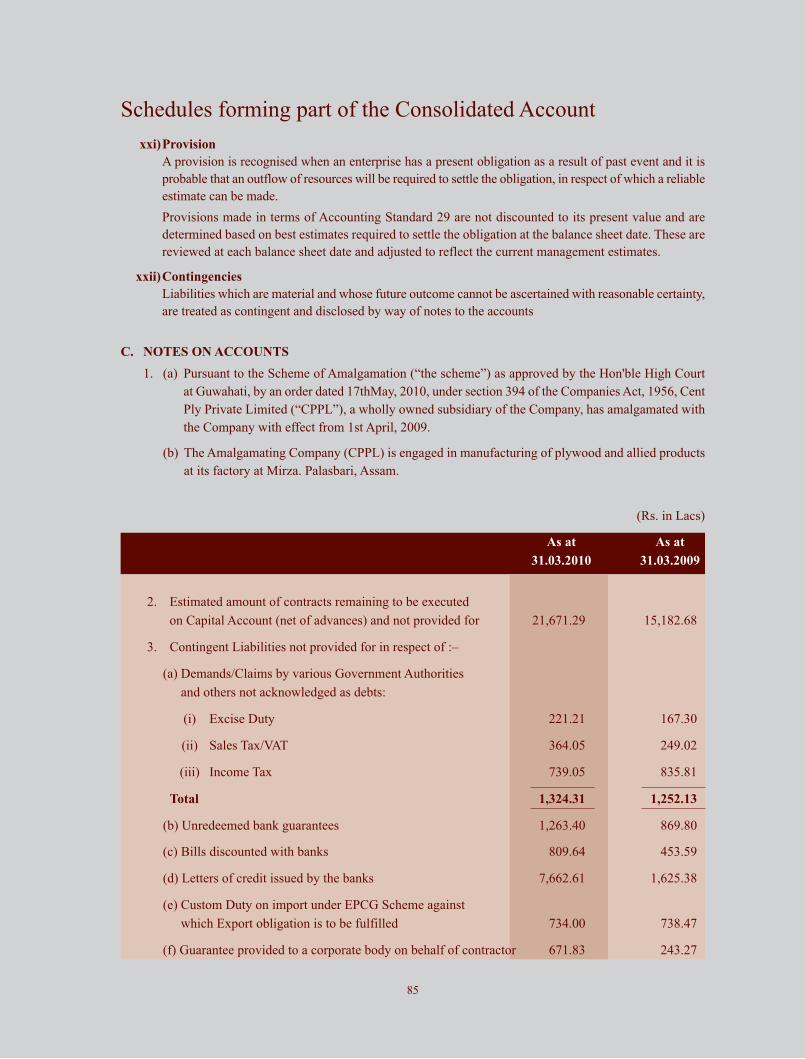
Schedules forming part of the Consolidated Account
xxi)Provision
A provision is recognised when an enterprise has a present obligation as a result of past event and it is
probable that an outflow of resources will be required to settle the obligation, in respect of which a reliable
estimate can be made.
Provisions made in terms of Accounting Standard 29 are not discounted to its present value and are
determined based on best estimates required to settle the obligation at the balance sheet date. These are
reviewed at each balance sheet date and adjusted to reflect the current management estimates.
xxii)Contingencies
Liabilities which are material and whose future outcome cannot be ascertained with reasonable certainty,
are treated as contingent and disclosed by way of notes to the accounts
C. NOTES ON ACCOUNTS
1. (a) Pursuant to the Scheme of Amalgamation (“the scheme”) as approved by the Hon'ble High Court
at Guwahati, by an order dated 17thMay, 2010, under section 394 of the Companies Act, 1956, Cent
Ply Private Limited (“CPPL”), a wholly owned subsidiary of the Company, has amalgamated with
the Company with effect from 1st April, 2009.
(b) The Amalgamating Company (CPPL) is engaged in manufacturing of plywood and allied products
at its factory at Mirza. Palasbari, Assam.
(Rs. in Lacs)
As at As at
31.03.2010 31.03.2009
2. Estimated amount of contracts remaining to be executed
on Capital Account (net of advances) and not provided for 21,671.29 15,182.68
3. Contingent Liabilities not provided for in respect of :–
(a) Demands/Claims by various Government Authorities
and others not acknowledged as debts:
(i) Excise Duty 221.21 167.30
(ii) Sales Tax/VAT 364.05 249.02
(iii) Income Tax 739.05 835.81
Total 1,324.31 1,252.13
(b) Unredeemed bank guarantees 1,263.40 869.80
(c) Bills discounted with banks 809.64 453.59
(d) Letters of credit issued by the banks 7,662.61 1,625.38
(e) Custom Duty on import under EPCG Scheme against
which Export obligation is to be fulfilled 734.00 738.47
(f) Guarantee provided to a corporate body on behalf of contractor 671.83 243.27
85

Schedules forming part of the Consolidated Account
4. Excise Duty on sales has been reduced from sales in Profit & Loss Account and excise duty on
increase/decrease in stocks has been considered as income/expenses in Profit & Loss Account.
5. In terms of Section 115-O of the Income Tax Act,1961, interim and final dividend on Equity shares is not subject
to tax on dividend to the extent of interim dividend to received from a subsidiary company during the year.
6. The financial position as at the year end and the results for the period from 6th July, 2009 to 31st March,
2010 and from 15th July, 2009 to 31st March, 2010 in respect of Aegis Business Limited and Aegis Overseas
Limited, respectively which have become subsidiary of the Company during the year on the above respective
dates, are as follows:
Liabilities Rs. in lacs
Secured Loans 9.32
Current Liabilities 31.16
Assets
Fixed Assets 19.22
Investments 12.63
Inventories 8.93
Cash and Bank Balances 139.69
Loans & Advances 7.26
Miscellaneous Expenditure 0.07
Income
Sale of Products 1209.45
Other Income 39.90
Expenses
Other Expenses 1142.73
Depreciation 4.45
Interest 11.69
Profit for the period 90.48
The above is after eliminating intra group transactions and balances.
7. a) Details of Directors’ Remuneration:
2009-10 2008-09
Managing Director / Whole Time Directors’ Remuneration
- Salary* 417.79 346.25
Non Executive Chairman’s Remuneration 12.00 9.00
Sitting fees 1.35 1.10
Total 431.14 356.35
(Rs. in Lacs)
*Including Rs. 5.87 lacs (Rs. 11.50 lacs) included in pre-operative expenses.
Note: As the provision of gratuity and leave encashment is made on an accrual basis of the company as a whole, the
amount pertaining to Directors, is not included above.
86
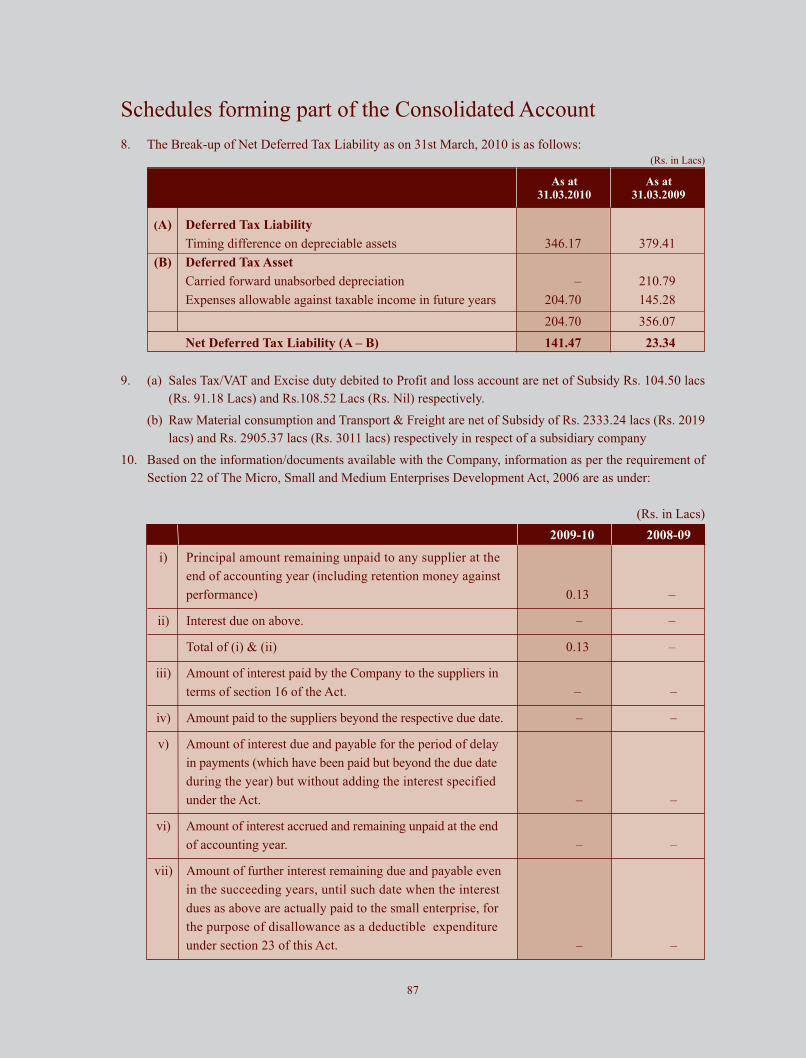
Schedules forming part of the Consolidated Account
(Rs. in Lacs)
9. (a) Sales Tax/VAT and Excise duty debited to Profit and loss account are net of Subsidy Rs. 104.50 lacs
(Rs. 91.18 Lacs) and Rs.108.52 Lacs (Rs. Nil) respectively.
(b) Raw Material consumption and Transport & Freight are net of Subsidy of Rs. 2333.24 lacs (Rs. 2019
lacs) and Rs. 2905.37 lacs (Rs. 3011 lacs) respectively in respect of a subsidiary company
10. Based on the information/documents available with the Company, information as per the requirement of
Section 22 of The Micro, Small and Medium Enterprises Development Act, 2006 are as under:
8. The Break-up of Net Deferred Tax Liability as on 31st March, 2010 is as follows:
2009-10 2008-09
i) Principal amount remaining unpaid to any supplier at the
end of accounting year (including retention money against
performance) 0.13 –
ii) Interest due on above. – –
Total of (i) & (ii) 0.13 –
iii) Amount of interest paid by the Company to the suppliers in
terms of section 16 of the Act. – –
iv) Amount paid to the suppliers beyond the respective due date. – –
v) Amount of interest due and payable for the period of delay
in payments (which have been paid but beyond the due date
during the year) but without adding the interest specified
under the Act. – –
vi) Amount of interest accrued and remaining unpaid at the end
of accounting year. – –
vii) Amount of further interest remaining due and payable even
in the succeeding years, until such date when the interest
dues as above are actually paid to the small enterprise, for
the purpose of disallowance as a deductible expenditure
under section 23 of this Act. – –
(Rs. in Lacs)
87
As at As at31.03.2010 31.03.2009
(A) Deferred Tax Liability
Timing difference on depreciable assets 346.17 379.41
(B) Deferred Tax Asset
Carried forward unabsorbed depreciation – 210.79
Expenses allowable against taxable income in future years 204.70 145.28
204.70 356.07
Net Deferred Tax Liability (A – B) 141.47 23.34
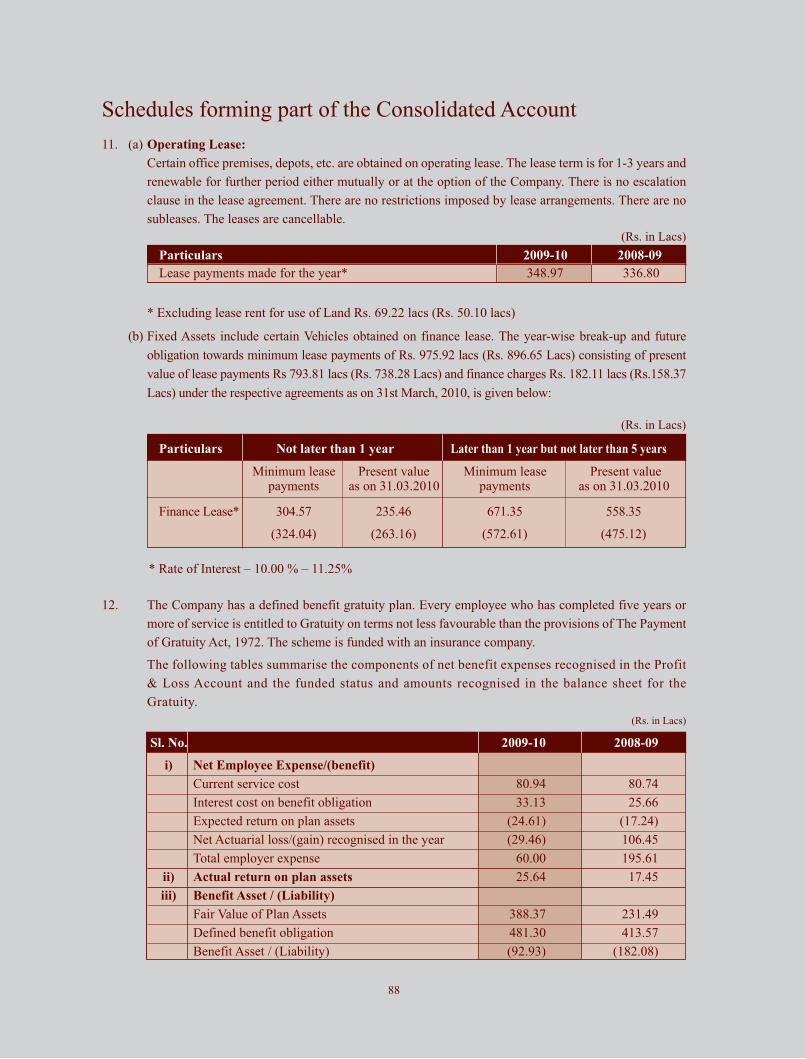
Schedules forming part of the Consolidated Account
11. (a) Operating Lease:
Certain office premises, depots, etc. are obtained on operating lease. The lease term is for 1-3 years and
renewable for further period either mutually or at the option of the Company. There is no escalation
clause in the lease agreement. There are no restrictions imposed by lease arrangements. There are no
subleases. The leases are cancellable.
(Rs. in Lacs)
Particulars 2009-10 2008-09
Lease payments made for the year* 348.97 336.80
* Excluding lease rent for use of Land Rs. 69.22 lacs (Rs. 50.10 lacs)
(b) Fixed Assets include certain Vehicles obtained on finance lease. The year-wise break-up and future
obligation towards minimum lease payments of Rs. 975.92 lacs (Rs. 896.65 Lacs) consisting of present
value of lease payments Rs 793.81 lacs (Rs. 738.28 Lacs) and finance charges Rs. 182.11 lacs (Rs.158.37
Lacs) under the respective agreements as on 31st March, 2010, is given below:
(Rs. in Lacs)
Particulars Not later than 1 year Later than 1 year but not later than 5 years
Minimum lease Present value Minimum lease Present valuepayments as on 31.03.2010 payments as on 31.03.2010
Finance Lease* 304.57 235.46 671.35 558.35
(324.04) (263.16) (572.61) (475.12)
12. The Company has a defined benefit gratuity plan. Every employee who has completed five years or
more of service is entitled to Gratuity on terms not less favourable than the provisions of The Payment
of Gratuity Act, 1972. The scheme is funded with an insurance company.
The following tables summarise the components of net benefit expenses recognised in the Profit
& Loss Account and the funded status and amounts recognised in the balance sheet for the
Gratuity.
Sl. No. 2009-10 2008-09
i) Net Employee Expense/(benefit)
Current service cost 80.94 80.74
Interest cost on benefit obligation 33.13 25.66
Expected return on plan assets (24.61) (17.24)
Net Actuarial loss/(gain) recognised in the year (29.46) 106.45
Total employer expense 60.00 195.61
ii) Actual return on plan assets 25.64 17.45
iii) Benefit Asset / (Liability)
Fair Value of Plan Assets 388.37 231.49
Defined benefit obligation 481.30 413.57
Benefit Asset / (Liability) (92.93) (182.08)
(Rs. in Lacs)
* Rate of Interest – 10.00 % – 11.25%
88
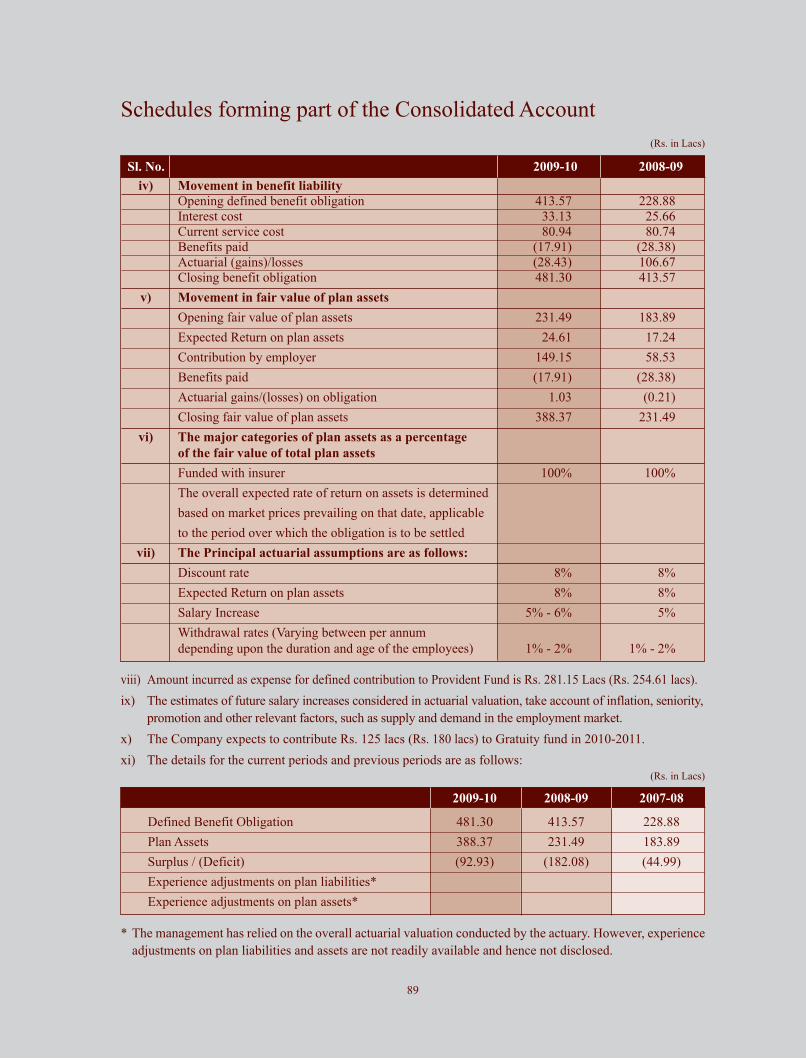
Schedules forming part of the Consolidated Account
viii) Amount incurred as expense for defined contribution to Provident Fund is Rs. 281.15 Lacs (Rs. 254.61 lacs).
ix) The estimates of future salary increases considered in actuarial valuation, take account of inflation, seniority,
promotion and other relevant factors, such as supply and demand in the employment market.
x) The Company expects to contribute Rs. 125 lacs (Rs. 180 lacs) to Gratuity fund in 2010-2011.
xi) The details for the current periods and previous periods are as follows:
Sl. No. 2009-10 2008-09
iv) Movement in benefit liability
Opening defined benefit obligation 413.57 228.88
Interest cost 33.13 25.66
Current service cost 80.94 80.74
Benefits paid (17.91) (28.38)
Actuarial (gains)/losses (28.43) 106.67
Closing benefit obligation 481.30 413.57
v) Movement in fair value of plan assets
Opening fair value of plan assets 231.49 183.89
Expected Return on plan assets 24.61 17.24
Contribution by employer 149.15 58.53
Benefits paid (17.91) (28.38)
Actuarial gains/(losses) on obligation 1.03 (0.21)
Closing fair value of plan assets 388.37 231.49
vi) The major categories of plan assets as a percentage
of the fair value of total plan assets
Funded with insurer 100% 100%
The overall expected rate of return on assets is determined
based on market prices prevailing on that date, applicable
to the period over which the obligation is to be settled
vii) The Principal actuarial assumptions are as follows:
Discount rate 8% 8%
Expected Return on plan assets 8% 8%
Salary Increase 5% - 6% 5%
Withdrawal rates (Varying between per annum
depending upon the duration and age of the employees) 1% - 2% 1% - 2%
(Rs. in Lacs)
* The management has relied on the overall actuarial valuation conducted by the actuary. However, experience
adjustments on plan liabilities and assets are not readily available and hence not disclosed.
2009-10 2008-09 2007-08
Defined Benefit Obligation 481.30 413.57 228.88
Plan Assets 388.37 231.49 183.89
Surplus / (Deficit) (92.93) (182.08) (44.99)
Experience adjustments on plan liabilities*
Experience adjustments on plan assets*
(Rs. in Lacs)
89
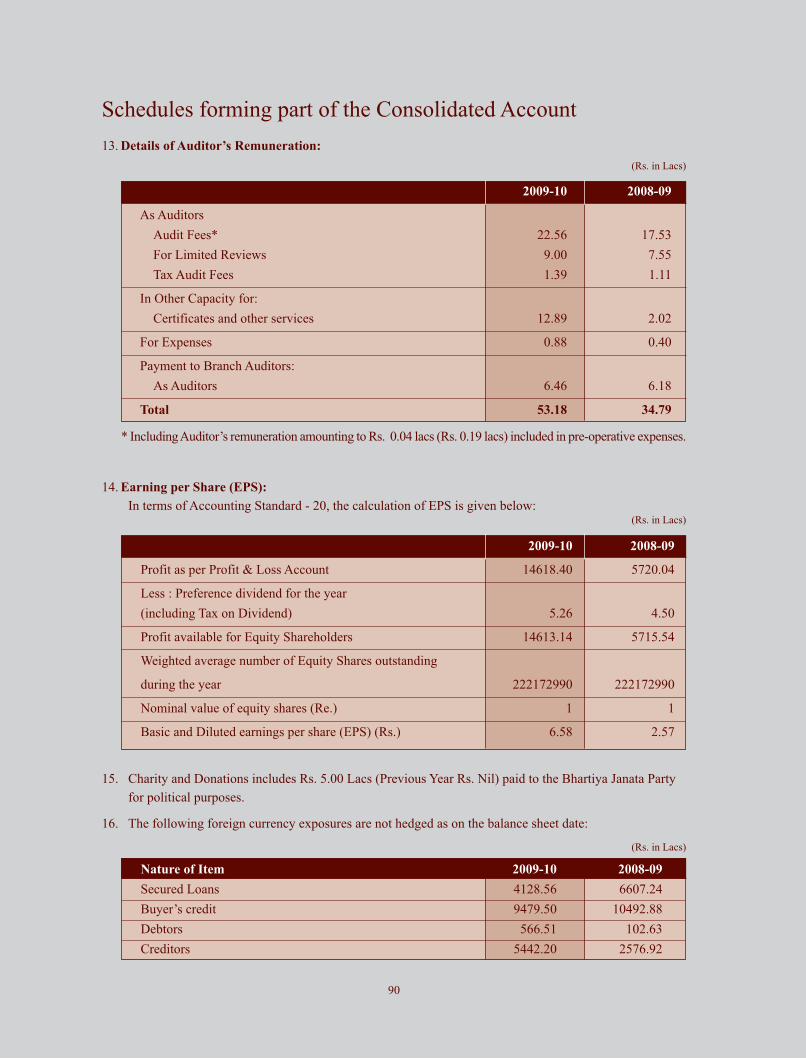
Schedules forming part of the Consolidated Account
13. Details of Auditor’s Remuneration:
* Including Auditor’s remuneration amounting to Rs. 0.04 lacs (Rs. 0.19 lacs) included in pre-operative expenses.
14. Earning per Share (EPS):
In terms of Accounting Standard - 20, the calculation of EPS is given below:
2009-10 2008-09
Profit as per Profit & Loss Account 14618.40 5720.04
Less : Preference dividend for the year
(including Tax on Dividend) 5.26 4.50
Profit available for Equity Shareholders 14613.14 5715.54
Weighted average number of Equity Shares outstanding
during the year 222172990 222172990
Nominal value of equity shares (Re.) 1 1
Basic and Diluted earnings per share (EPS) (Rs.) 6.58 2.57
(Rs. in Lacs)
15. Charity and Donations includes Rs. 5.00 Lacs (Previous Year Rs. Nil) paid to the Bhartiya Janata Party
for political purposes.
16. The following foreign currency exposures are not hedged as on the balance sheet date:
Nature of Item 2009-10 2008-09
Secured Loans 4128.56 6607.24
Buyer’s credit 9479.50 10492.88
Debtors 566.51 102.63
Creditors 5442.20 2576.92
(Rs. in Lacs)
2009-10 2008-09
As Auditors
Audit Fees* 22.56 17.53
For Limited Reviews 9.00 7.55
Tax Audit Fees 1.39 1.11
In Other Capacity for:
Certificates and other services 12.89 2.02
For Expenses 0.88 0.40
Payment to Branch Auditors:
As Auditors 6.46 6.18
Total 53.18 34.79
(Rs. in Lacs)
90

Schedules forming part of the Consolidated Account
Key Management Personnel Sri Sajjan Bhajanka (Managing Director)
Sri Sanjay Agarwal (Joint Managing Director)
Sri Prem Kumar Bhajanka (Joint Managing Director)
Sri Vishnu Khemani (Joint Managing Director)
Sri Hari Prasad Agarwal (Vice Chairman)
Sri Ajay Baldawa (Executive Director)
Sri Arun Kumar Julasaria (Chief Financial Officer cum Company Secretary)
Sri Brij Bhusan Agarwal (Vice Chairman)
Sri S. B. Roongta (Managing Director)
Sri Rajendra Chamaria (Vice Chairman & Managing Director)
Sri Pankaj Kejrwal (Executive Director)
Smt. Payal Agrawal (Bhajanka) (Executive Director)
Sri Sanjay Kumar Gupta (Chief Financial Officer)
Sri Rangbahduh Khonglh
Sri Lamshwa Kyndoh
Sri Carmel Suja
Sri Girish Agarwal
Sri Shambhu Nath Choudhary
Sri Anil Kumar Choudhary
Sri Ashok Kumar Choudhary
Smt. Sunita Choudhary
Enterprises Owned/ Influenced Brijdham Merchants Pvt. Ltd.
by Key Management Personnel Sriram Merchants Pvt. Ltd.
Sriram Vanijya Pvt. Ltd.
Sumangal Business Pvt. Ltd.
Sumangal International Pvt. Ltd.
Ara Suppliers Pvt. Ltd.
Apnapan Viniyog Pvt. Ltd.
Adonis Vyaper Pvt. Ltd.
Arham Sales Pvt. Ltd.
Skipper Ltd.
Riangdo Veneers Pvt. Ltd.
Shyam Sel & Power Ltd.
Shyam Energy Ltd.
Star India Cement Ltd.
Shyam DRI Power Ltd.
Shyam Century Cement Industries Ltd.
Relatives of Key Smt. Santosh Bhajanka (Wife of Sri Sajjan Bhajanka)
Management Personnel Smt. Divya Agarwal (Wife of Sri Sanjay Agarwal)
Smt. Sumitra Devi Agarwala (Wife of Sri Hari Prasad Agarwal)
Smt. Yash Bhajanka (Wife of Sri Prem Kumar Bhajanka)
Smt. Mittu Agarwala (Wife of Sri Brij Bhushan Agarwal)
Smt. Sudha Khemani (Wife of Sri Vishnu Khemani)
17. Related Party Disclosures
a) Name of the related parties:
91
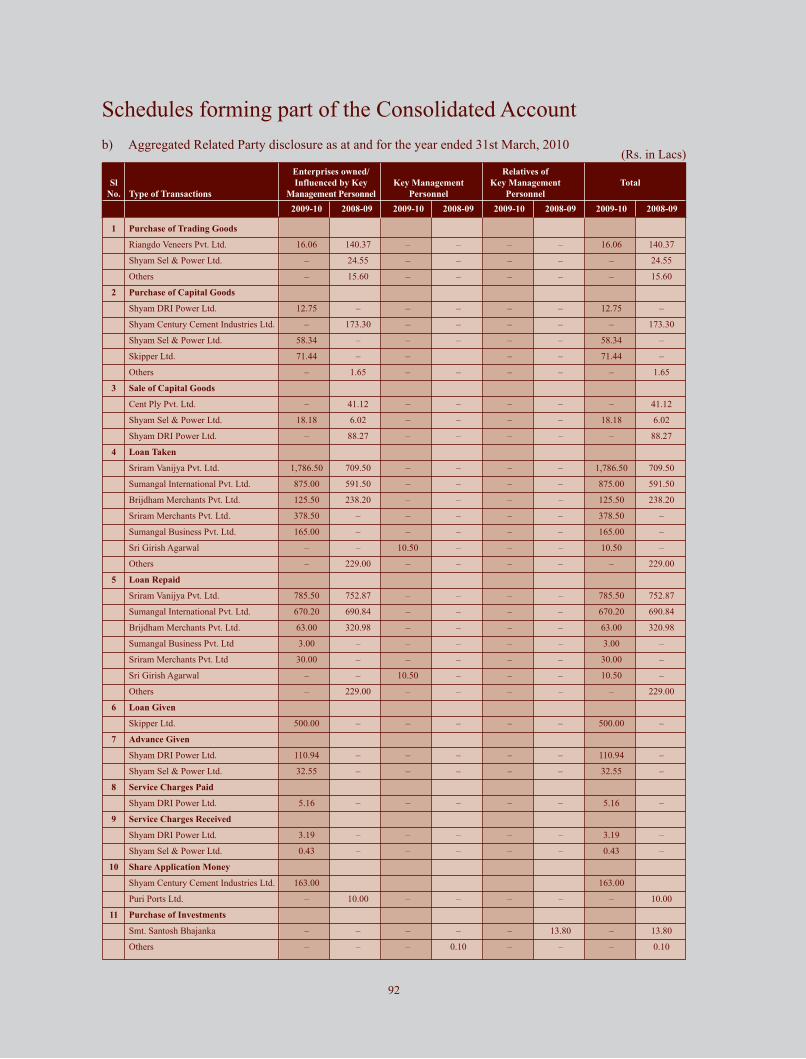
Schedules forming part of the Consolidated Account
b) Aggregated Related Party disclosure as at and for the year ended 31st March, 2010(Rs. in Lacs)
92
Enterprises owned/ Relatives of
Sl Influenced by Key Key Management Key Management Total
No. Type of Transactions Management Personnel Personnel Personnel
2009-10 2008-09 2009-10 2008-09 2009-10 2008-09 2009-10 2008-09
1 Purchase of Trading Goods
Riangdo Veneers Pvt. Ltd. 16.06 140.37 – – – – 16.06 140.37
Shyam Sel & Power Ltd. – 24.55 – – – – – 24.55
Others – 15.60 – – – – – 15.60
2 Purchase of Capital Goods
Shyam DRI Power Ltd. 12.75 – – – – – 12.75 –
Shyam Century Cement Industries Ltd. – 173.30 – – – – – 173.30
Shyam Sel & Power Ltd. 58.34 – – – – – 58.34 –
Skipper Ltd. 71.44 – – – – 71.44 –
Others – 1.65 – – – – – 1.65
3 Sale of Capital Goods
Cent Ply Pvt. Ltd. – 41.12 – – – – – 41.12
Shyam Sel & Power Ltd. 18.18 6.02 – – – – 18.18 6.02
Shyam DRI Power Ltd. – 88.27 – – – – – 88.27
4 Loan Taken
Sriram Vanijya Pvt. Ltd. 1,786.50 709.50 – – – – 1,786.50 709.50
Sumangal International Pvt. Ltd. 875.00 591.50 – – – – 875.00 591.50
Brijdham Merchants Pvt. Ltd. 125.50 238.20 – – – – 125.50 238.20
Sriram Merchants Pvt. Ltd. 378.50 – – – – – 378.50 –
Sumangal Business Pvt. Ltd. 165.00 – – – – – 165.00 –
Sri Girish Agarwal – – 10.50 – – – 10.50 –
Others – 229.00 – – – – – 229.00
5 Loan Repaid
Sriram Vanijya Pvt. Ltd. 785.50 752.87 – – – – 785.50 752.87
Sumangal International Pvt. Ltd. 670.20 690.84 – – – – 670.20 690.84
Brijdham Merchants Pvt. Ltd. 63.00 320.98 – – – – 63.00 320.98
Sumangal Business Pvt. Ltd 3.00 – – – – – 3.00 –
Sriram Merchants Pvt. Ltd 30.00 – – – – – 30.00 –
Sri Girish Agarwal – – 10.50 – – – 10.50 –
Others – 229.00 – – – – – 229.00
6 Loan Given
Skipper Ltd. 500.00 – – – – – 500.00 –
7 Advance Given
Shyam DRI Power Ltd. 110.94 – – – – – 110.94 –
Shyam Sel & Power Ltd. 32.55 – – – – – 32.55 –
8 Service Charges Paid
Shyam DRI Power Ltd. 5.16 – – – – – 5.16 –
9 Service Charges Received
Shyam DRI Power Ltd. 3.19 – – – – – 3.19 –
Shyam Sel & Power Ltd. 0.43 – – – – – 0.43 –
10 Share Application Money
Shyam Century Cement Industries Ltd. 163.00 163.00
Puri Ports Ltd. – 10.00 – – – – – 10.00
11 Purchase of Investments
Smt. Santosh Bhajanka – – – – – 13.80 – 13.80
Others – – – 0.10 – – – 0.10
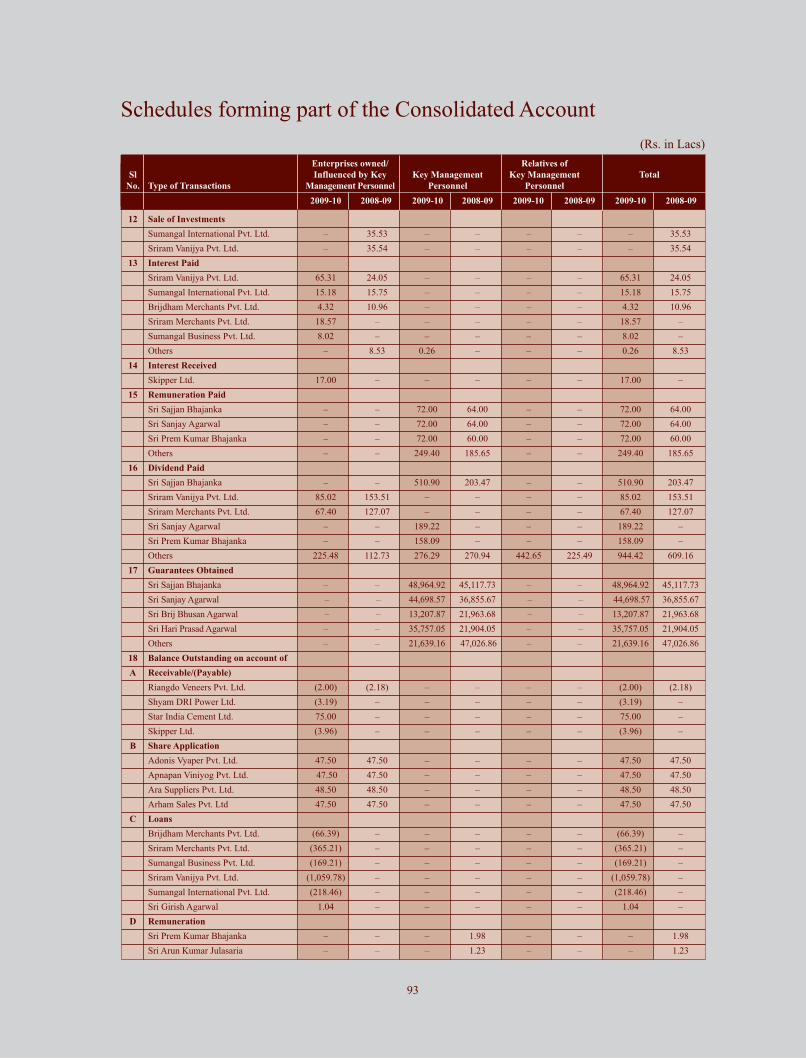
Schedules forming part of the Consolidated Account
Enterprises owned/ Relatives of
Sl Influenced by Key Key Management Key Management Total
No. Type of Transactions Management Personnel Personnel Personnel
2009-10 2008-09 2009-10 2008-09 2009-10 2008-09 2009-10 2008-09
12 Sale of Investments
Sumangal International Pvt. Ltd. – 35.53 – – – – – 35.53
Sriram Vanijya Pvt. Ltd. – 35.54 – – – – – 35.54
13 Interest Paid
Sriram Vanijya Pvt. Ltd. 65.31 24.05 – – – – 65.31 24.05
Sumangal International Pvt. Ltd. 15.18 15.75 – – – – 15.18 15.75
Brijdham Merchants Pvt. Ltd. 4.32 10.96 – – – – 4.32 10.96
Sriram Merchants Pvt. Ltd. 18.57 – – – – – 18.57 –
Sumangal Business Pvt. Ltd. 8.02 – – – – – 8.02 –
Others – 8.53 0.26 – – – 0.26 8.53
14 Interest Received
Skipper Ltd. 17.00 – – – – – 17.00 –
15 Remuneration Paid
Sri Sajjan Bhajanka – – 72.00 64.00 – – 72.00 64.00
Sri Sanjay Agarwal – – 72.00 64.00 – – 72.00 64.00
Sri Prem Kumar Bhajanka – – 72.00 60.00 – – 72.00 60.00
Others – – 249.40 185.65 – – 249.40 185.65
16 Dividend Paid
Sri Sajjan Bhajanka – – 510.90 203.47 – – 510.90 203.47
Sriram Vanijya Pvt. Ltd. 85.02 153.51 – – – – 85.02 153.51
Sriram Merchants Pvt. Ltd. 67.40 127.07 – – – – 67.40 127.07
Sri Sanjay Agarwal – – 189.22 – – – 189.22 –
Sri Prem Kumar Bhajanka – – 158.09 – – – 158.09 –
Others 225.48 112.73 276.29 270.94 442.65 225.49 944.42 609.16
17 Guarantees Obtained
Sri Sajjan Bhajanka – – 48,964.92 45,117.73 – – 48,964.92 45,117.73
Sri Sanjay Agarwal – – 44,698.57 36,855.67 – – 44,698.57 36,855.67
Sri Brij Bhusan Agarwal – – 13,207.87 21,963.68 – – 13,207.87 21,963.68
Sri Hari Prasad Agarwal – – 35,757.05 21,904.05 – – 35,757.05 21,904.05
Others – – 21,639.16 47,026.86 – – 21,639.16 47,026.86
18 Balance Outstanding on account of
A Receivable/(Payable)
Riangdo Veneers Pvt. Ltd. (2.00) (2.18) – – – – (2.00) (2.18)
Shyam DRI Power Ltd. (3.19) – – – – – (3.19) –
Star India Cement Ltd. 75.00 – – – – – 75.00 –
Skipper Ltd. (3.96) – – – – – (3.96) –
B Share Application
Adonis Vyaper Pvt. Ltd. 47.50 47.50 – – – – 47.50 47.50
Apnapan Viniyog Pvt. Ltd. 47.50 47.50 – – – – 47.50 47.50
Ara Suppliers Pvt. Ltd. 48.50 48.50 – – – – 48.50 48.50
Arham Sales Pvt. Ltd 47.50 47.50 – – – – 47.50 47.50
C Loans
Brijdham Merchants Pvt. Ltd. (66.39) – – – – – (66.39) –
Sriram Merchants Pvt. Ltd. (365.21) – – – – – (365.21) –
Sumangal Business Pvt. Ltd. (169.21) – – – – – (169.21) –
Sriram Vanijya Pvt. Ltd. (1,059.78) – – – – – (1,059.78) –
Sumangal International Pvt. Ltd. (218.46) – – – – – (218.46) –
Sri Girish Agarwal 1.04 – – – – – 1.04 –
D Remuneration
Sri Prem Kumar Bhajanka – – – 1.98 – – – 1.98
Sri Arun Kumar Julasaria – – – 1.23 – – – 1.23
(Rs. in Lacs)
93

Schedules forming part of the Consolidated Account
18. The Company's segment information as at and for the Year ended 31st March, 2010 are as below:
Sl Plywood Laminate Ferro Power Logistic Cement Others Total
Alloys
A Revenue(Gross)
External Sales 59,463.69 12,072.25 4,086.71 1,150.62 1,995.40 50,612.21 2,039.21 1,31,420.09
(49,031.07) (12,757.76) (8,849.71) (936.21) (117.63) (44,220.30) (1,714.87) (1,17,627.55)
Inter–segment Sales – – – 3,927.77 47.45 – – 3,975.22
(–) (–) (–) (2,541.57) (–) (–) (–) (2,541.57)
Total Revenue (Gross) 59,463.69 12,072.25 4,086.71 5,078.39 2,042.85 50,612.21 2,039.21 1,35,395.31
(49,031.07) (12,757.76) (8,849.71) (3,477.78) (117.63) (44,220.30) (1,714.87) (1,20,169.12)
B Result
Segment Results 3,769.07 1,011.12 158.59 1,208.03 780.46 13,384.35 196.39 20,508.01
(320.33) (538.15) (2,074.27) (480.98) (–137.00) (12,634.85) (191.83) (16,103.41)
Unallocated Income/ 2,205.34
(Expenses) (–) (Net) (–4,822.04)
Operating Profit 22,713.35
(11,281.37)
Interest Expense 2,232.10
(2,493.55)
Prior Period Items 0.25
(195.93)
Provison for Taxation 3,674.57
(1,174.15)
MAT Credit Entitlement 1,629.75
(901.13)
Fringe Benefit Tax –
(112.46)
Deferred Tax 118.13
(–396.83)
Net Profit (before
minority interest) 18,318.05
(8,603.24)
Other Information
A Total Assets
Segment Assets 26,104.70 7,716.31 2,542.58 12,569.80 7,248.54 56,141.22 755.19 1,13,078.34
(22,604.42) (7,220.38) (2,951.30) (10,942.23) (3,717.11) (46,179.84) (662.52) (94,277.80)
Unallocated 5,099.57
Corporate/Other Assets (2,632.34)
1,18,177.91
(96,910.14)
94
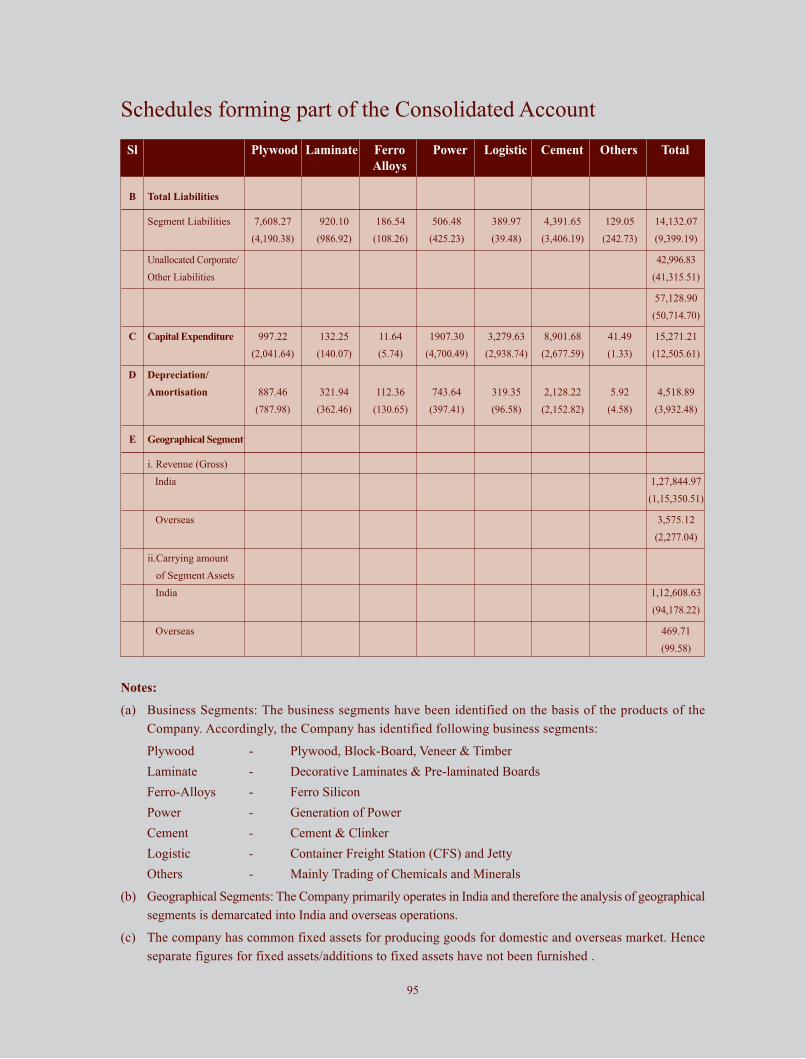
Schedules forming part of the Consolidated Account
Notes:
(a) Business Segments: The business segments have been identified on the basis of the products of the
Company. Accordingly, the Company has identified following business segments:
Plywood - Plywood, Block-Board, Veneer & Timber
Laminate - Decorative Laminates & Pre-laminated Boards
Ferro-Alloys - Ferro Silicon
Power - Generation of Power
Cement - Cement & Clinker
Logistic - Container Freight Station (CFS) and Jetty
Others - Mainly Trading of Chemicals and Minerals
(b) Geographical Segments: The Company primarily operates in India and therefore the analysis of geographical
segments is demarcated into India and overseas operations.
(c) The company has common fixed assets for producing goods for domestic and overseas market. Hence
separate figures for fixed assets/additions to fixed assets have not been furnished .
Sl Plywood Laminate Ferro Power Logistic Cement Others Total
Alloys
B Total Liabilities
Segment Liabilities 7,608.27 920.10 186.54 506.48 389.97 4,391.65 129.05 14,132.07
(4,190.38) (986.92) (108.26) (425.23) (39.48) (3,406.19) (242.73) (9,399.19)
Unallocated Corporate/ 42,996.83
Other Liabilities (41,315.51)
57,128.90
(50,714.70)
C Capital Expenditure 997.22 132.25 11.64 1907.30 3,279.63 8,901.68 41.49 15,271.21
(2,041.64) (140.07) (5.74) (4,700.49) (2,938.74) (2,677.59) (1.33) (12,505.61)
D Depreciation/
Amortisation 887.46 321.94 112.36 743.64 319.35 2,128.22 5.92 4,518.89
(787.98) (362.46) (130.65) (397.41) (96.58) (2,152.82) (4.58) (3,932.48)
E Geographical Segment
i. Revenue (Gross)
India 1,27,844.97
(1,15,350.51)
Overseas 3,575.12
(2,277.04)
ii.Carrying amount
of Segment Assets
India 1,12,608.63
(94,178.22)
Overseas 469.71
(99.58)
95

19 Foreign Exchange gain of Rs. 2306.05 lacs (Previous Year Loss of Rs. 2724.86 Lacs) (Net) towards
creditors/debtors pertaining to specific segments has been included as unallocable income/expenses
instead of the relevant segments results as the amount of such exchange gain/loss for different segments
is not ascertainable.
20. During the year, a subsidiary Company namely Meghalaya Power Limited has successfully implemented
the project of 8 MW Thermal Power Plant, which commenced operations from 23rd September, 2009. An
amount of Rs. 5361.00 lacs was capitalised towards the cost of above project which includes cost over-run
of Rs. 1400.00 lacs due to delay in implementation of the project.
21. Figures given in brackets are for the previous year and the same have been regrouped and/or rearranged,
wherever necessary. Further, the current year figures being inclusive of the figures of Aegis Business Ltd
and Aegis Overseas Ltd which became subsidiaries during the year w.e.f. 6th July, 2009 and 15th July,
2009 respectively, are not comparable with the previous year’s figures.
Signatures to Schedules ‘A’ to ‘W’
For S.R. Batliboi & Co.
Firm Registration No. 301003E
Chartered Accountants For and on behalf of the Board
Per R.K. Agrawal Sajjan Bhajanka - Managing Directora Partner Hari Prasad Agarwal - Executive DirectorMembership No. 16667 Arun Kumar Julasaria - CFO & Company SecretaryKolkata, 28th May, 2010
Schedules forming part of the Consolidated Account
96

Notes
97

98
Notes