ceo and boards, the ill performance of similar social networks€¦ · 1 ceo and boards, the ill...
TRANSCRIPT

1
CEO and Boards, The Ill Performance of Similar Social Networks
Research Paper
HEC Master in Finance Program
Paul Petrescu
June 2017
Under the supervision of
Prof. Nicolas Naillon
Public report
Abstract
This paper shows the negative impacts of boards of directors’ interlocks and
educational shared networks on the performance of the top 120 French companies.
This negative impact is particularly due to the similarity between CEO and board of
directors’ social networks. Those findings are made on several performance metrics
for the year 2016: sales growth, returns on assets, price-earnings ratio, Tobin’s q and
stock price returns.

2
Introduction
Any investor putting money in a new start-up will tell you that what matters is the
team. This major criterion does not disappear when considering large and more mature
companies. Corporate governance can be key when assessing business past and future
performance. This paper aims at assessing the impact of Board of Directors (BoD) and
management networks on French large companies’ performance.
Ties between executive and non-executive directors can be of two types: i) direct ties
based on sharing seats at different BoDs and ii) indirect ties based on having been at the same
school or sharing other specific social networks. The goal of this paper is to measure the
impact of social networks on the performance of French large companies with two angles:
first, whether companies more connected are performing better, second, whether the
similarities between CEO and BoD social networks (indirect ties) are impacting positively or
negatively the performance of the company. The second topic relates to the argument
between the agency theory and the stewardship theory. On the one hand, BoD has an advisory
and controlling role on management of the company therefore it should be as independent
as possible from it. On the other hand, a good company is based on having efficient
management and directors working together. Shared social networks are helping better
selecting executive and non-executive directors and efficiently functioning.
This paper looks at 116 top public companies in the French market, which are the most
actively traded stocks listed in Paris. Data were gathered concerning each directors and CEO
of those companies especially looking at their educational backgrounds and at the interlocks
between boards. For the 116 firms in the scope of this paper, data on the performance during
the year 2016 were also collected. Performance of companies is measured based on the
following accounting and market-based metrics: sales’ growth, return on assets, return on
capital employed, return on equity, price-earnings ratio, price-to-book ratio, Tobin’s q,
economic value added and market adjusted stock returns.
Principal results of this paper are that more connected firms are performing worse
accordingly to several performance metrics. This connectedness is assessed either through
direct ties of interlocks or indirect ties of same educational backgrounds. To explain those
rather not intuitive results, this paper shows that the similarity between CEO and BoD social

3
networks (educational networks) is negatively impacting the performance of the company. A
specific analysis is made on CEO compensations that does not conclude to an impact of those
different social networks on the level of compensation.
This paper is organized as follows. The first section provides a literature review on the
relationship between firm performance and boards of directors, underlining the specific role
of CEO. The second section details the different data gathered and the construction of the
different firms’ performance indicators. The third section analyses the impact of boards of
directors’ interlocks and educational backgrounds on firms’ performance.

4
Section 1 Literature review
Social networks’ impact on companies’ performance is a growing field of study. Those
studies must tackle two issues: first, what measurement of connection should be used
concerning boards and management of companies and, second, how to assess properly
companies’ performance. The latter area of study is of course the most important field of
questioning for corporate finance. Without going into too much details on that point, this
paper will rely on few key metrics that can be considered as good proxies for business
performance and will dive more on the former difficulty.
Corporate Governance Interlocks and Country Specific Schemes
Following Granovetter (1973) seminal paper, research has been looking at the impact
of social networks on the way people do business. Part of corporate governance studies
influenced by sociology of organizations has been focusing on depicting the differences
between countries, regions and cultures regarding companies’ networks. One of the main
differences described is for example the Anglo-Saxon versus the Continental European and
the Japanese corporate governance models. The Anglo-Saxon model is based on
entrepreneurship and private property. Companies are owned by independent persons
and/or individual shareholders. Management is responsible to the BoD and shareholders. The
shareholding structure is dispersed with shares trading in stock market. The Continental
Europe on the contrary has a shareholding structure more concentrated. It relies on banking
market rather than on stock market to raise capital. The Japanese model is considered even
more concentrated with cross-participations between companies creating a dense network
between them (Aoki (1994) on the Japanese specificities).
More specifically looking at France, corporate governance is driven by two main
factors: first, a strong involvement of the French State in big companies and second a relatively
concentrated elite trained in few major schools. French State involvement must be traced
back to the end of World War II. French State played a key role in rebuilding the French
economy with major companies being state-owned. Though the 1980s and 1990s saw many
privatisations, French State remains a major player for business companies. With many
5
companies, previously state-owned, still managed by former civil servants trained at Ecole
Nationale d’Adminisration (ENA) or from Grands Corps accesses (X-Ponts, X-Mines, etc.).
Kramarz and Thesmar (2011) specifically show the impact of social networks on board
composition and corporate governance of French companies for the years 1992 to 2003. They
show the strong correlation between the CEO’s network and that of his BoD, especially in the
case of high civil servants’ networks. They find that CEO’s compensation, CEO’s turnover and
acquisition’s decision-making are influenced by CEO’s and BoD’s company networks and links.
This paper will build on their research while looking more at assessing companies’
performance related to those networks.
Different studies tackle more the relationship between corporate social network and
firm’s performance.
Information is Key
The nature and specificities of the ties linking board and management people with
their industries appear to influence over the performance of their firms. Indeed, one can
understand that those networks are means to convey information which are major assets
when making strategic decisions for one’s company.
Better networked boards and management have access to crucial information via their
networks that make them more informed in both their monitoring, advising and decision-
making capacities. An interesting research by Schonlau and Singh (2009) sets light on the
impact of boards’ networks on merger post-performance. The paper shows that less-
connected boards are associated with weaker performing acquisitions compare to more
connected ones. They distinguish three capacities that more connected boards have
developed: i) operational strategy to merge properly by learning by doing and sometimes
failing at other boards, ii) better general knowledge on the industry and iii) reduce search
efforts and asymmetry of information on many deals looked at. To sum up, firms that are more
connected have more knowledge on the dynamic of their industry and the right acquisitions
to be made. The impact of information is here key for making a good deal happening.
When considering companies performance more generally it is harder to fully identify
the relationship between firm performance and executives’ and non-executives’ networks. As

6
a matter of fact, many studies have shown the impact on different specific key strategic
decisions: Shonlau and Singh (2009) on merger performance and Gulati and Westphal (1999)
on the formation of alliances for example. One could expect this impact on strategic decision
to also impact companies’ performance in the long run. An important paper realized by Cohen,
Frazzini and Malloy (2008) shows the impact of the ties between mutual fund managers and
corporate board members via shared education networks on performance of their
investment. They find that portfolio managers place larger bets on connected firms and
perform significantly better on these holdings relative to their peers. Having more inside
information and betting on more connected firms is therefore apparently a good strategy
indicating indirectly that the well-connected companies are potentially performing better.
To take a closer look at firm social networks a distinction must be made between CEO
and BoD connectedness.
CEO versus BoD connectedness: Agency theory versus social network
Agency theory as developed by Fama (1980) modelled a firm as a set of contracts
where ownership and control of the firm are two separate things. This creates an ‘agency
problem’ as managers need to be incentivized in managing the company in the interest of the
shareholders and not only in their own interest.
In this respect, one needs to differentiate between BoD and CEO connectedness.
Whereas the former connectedness is seen in most studies as a positive factor for firm
performance, the latter is a subject of discussion. Bebchuk and all (2007) especially argue that
CEO centrality is negatively associated with firm performance. They find that greater CEO
centrality entails: i) lower profitability, ii) lower stock returns especially after acquisitions of
other firms, iii) lower CEO turnover and iv) greater compensation package not related to
specific company performance. Nevertheless, Bebchuk and all use a rather simple and
potentially problematic proxy of CEO centrality. In their study, CEO centrality is indeed
measured by the fraction of the top-five compensation captured by CEO. This metric is
certainly important when assessing corporate governance but it does not really correspond to
CEO networks but rather to the CEO centrality inside the management of the company.
7
Another study from Kirchmaier and Stathopoulos (2007) finds that CEOs’ large social
networks have a negative impact on firm performance. Their measure is more accurate
regarding CEO social network by calculating direct ties created through all CEO past
appointments. It is a very empirical measure but probably more precise to really assess CEO
connectedness. Their study supports the argument that well-connected CEO perform badly in
serving the interest of shareholders. They are more inclined to use their power in their own
interest without being too accountable to shareholders, their connectedness being in a way a
guarantee for them to keep their job or find a new one in another company.
Adopting a similar approach to Kirchmaier and Stathopoulos, this paper will consider
both CEO and BoD networks in France and their impacts on firm performance.
CEO Duality: Agency theory versus stewardship
A specific case where BoD connectedness and CEO connectedness are partially similar
is CEO duality. It is an interesting topic of discussion as it opposes agency theory to
stewardship theory. CEO duality is defined as one person heading both the management and
the board of a company. This situation creates imbalances according to the agency theory as
it concentrates corporate power in the hand of one person. Proper monitoring and
independence of the board is questioned by this situation. On the contrary, stewardship
theory (Donaldson and Davis (1991) opposes this vision by arguing that shareholders’ interests
are maximized by shared incumbency of the two roles. Empirical evidences have not yet
enabled to provide a final answer to this discussion.
Social Network Metrics: Direct and indirect ties
Studies on corporate networks face a major difficulty which is the proper assessment
of ties linking different BoD or executives together. As underlined by Gulati and Westphal
(1999) there are different types of ties: i) direct ties or relational embeddedness and ii) more
distant network ties or structural embeddedness. Two persons coming from the same school
may have never met but nevertheless they share the same social network and have a lot in

8
common. Both structural and relational embeddedness can influence corporate behaviours.
Different research by Gulati (1995) and Burt and Knez (1995) have specifically shown that
relational embeddedness can be strengthened by structural one.
Gulati and Westphal also underline that relationships between two executives may be
characterized by distrust or at least independence. Interlocks are in the literature generally
assumed to be positive connections that help the sharing of information and the overall
cohesion of the network. But it is also known that executive suites are places of tough
competitions and rivalry. Assessing that dimension is particularly difficult and will not be
treated in this research, but it could weaken the modelling.
Considering more in detail the different measure of connectivity, three main metrics
have been developed: i) degree (number of immediate connections), ii) eigenvector
(measures the centrality of a board by looking at the board’s number of interlocks and
weighting those connections by the centrality of the interlocked firms) and iii) betweeness
(measures how many boards’ connected paths connect via a given board).
Depending on the metric chosen, the research findings can be quite different in terms
of impact of corporate networks.
Firm Performance Metrics
When modelling firm performance, there are different potentially relevant metrics: i)
traditional accounting and stock market metrics, ii) tobin’s q and other specific ratios and iii)
more complex valuation models such as economic value added.
Bhagat and Black (1999) study the interaction between board independence and firm
performance. Directors of boards can be divided into inside directors (persons who are
currently officers of the firm), affiliated directors (past inside persons, relatives of officers,
investment bankers or lawyers) and independent directors (outside directors without such
affiliations). Board independence depends on the number and the weight of independent
directors. They study performance of companies notably by assessing market adjusted stock
price returns, measured by cumulating daily returns minus the return on S&P 500 index. They
believe this measure is better to assess performance than cumulative abnormal returns or
standardized abnormal returns. An interesting element of their methodology is their use of
9
simultaneous equations to both assess the impact of firm governance on firm performance
and firm performance on firm governance without making assumptions on which one causes
the other. Indeed, they specifically argue that numerous firms in their dataset facing lower
returns decided to increase BoD independence level.
David Yermack (1996) especially uses Tobin’s q as an approximation of market
valuation and found an inverse association between board size and firm value modelled by
Tobin’s q for years 1984 to 1991. To compute Tobin’s q, Yermack needs for each firm the
market value of assets (numerator) and the replacement cost of assets (denominator). The
market value of assets depends on market value of common stock, valuation of preferred
shares and debts and other liabilities being valued at book value. The replacement costs are
computed through an algorithm taking into account inflation, real depreciation rates, capital
expenditures and inventory valuation. Tobin’s q is very interesting tool to assess firm
performance but it does rely on numerous assumptions and a relatively complex modelling.
Adjaoud and all (2007) show in their paper no significant relationships between
governance corporate governance and performance for Canadian companies when using
accounting and stock market metrics such as ROE, EPS and market-to-book value. But they
find links between board’s quality and performance when using market value added and
economic valued added. Nevertheless, their study does not look at BoDs’ networks but only
at BoDs’ quality reflected by composition of BoDs, independence of different specific
committee (audit and nominating), compensation and shareholder rights. The EVA is
calculated as the difference between firm’s net profit after tax and the total cost of capital
employed being computed in their paper as cost of equity from CAPM multiplied by common
equity.

10
Section 2. Data
2.1 Sources and sample characteristics
The sample corresponds to French companies listed in the SBF 120 (Société des
Bourses Françaises) index, which is based on the 120 most actively traded stocks listed in Paris.
The period of study is the year 2016. Data collection was divided into two tasks: data collection
regarding BoD people and data collection for measuring firms’ performance.
Among the companies listed in the SBF 120, a few companies were dropped because
of: 1) merger or acquisition in the period of study or previously (Saft, Montupet, Technip), 2)
not French-based company (Sartorius). After those exclusions, the sample is made of 116
companies. A list of all companies is provided in annex 1.
2.1.1 BoD variables and characteristics
To analyse network effects, data were gathered on each member of each BoD in the
scope. This corresponds to 1248 individuals. Different sources were used to collect those data:
i) registration documents of each company, ii) investor relations website of each company, iii)
Who’s Who database, iv) Bloomberg Executive Profile & Biography database. The following
information were collected for each individual:
- Gender,
- Date of birth,
- Nationality,
- Position in the BoD (Chairman and or CEO, independent or non-independent director),
- Education (Grandes Ecoles, Universities, MBA),
- Other boards’ positions.
In the scope of 116 firms, 47% have a CEO which is also chairman of the board. The share
of independent directors in the board is on average of 44%. Table 1 provides summary
statistics concerning BoDs’ characteristics in the sample. The fact that French BoD are mostly
constituted of French nationals will be useful in the study of school network impact. Indeed,
11
though many directors attended Anglo-Saxon universities for exchanges or MBA, school
networks’ impacts will be studied only concerning top French schools namely Sciences Po,
ENA, HEC and Polytechnic (X).
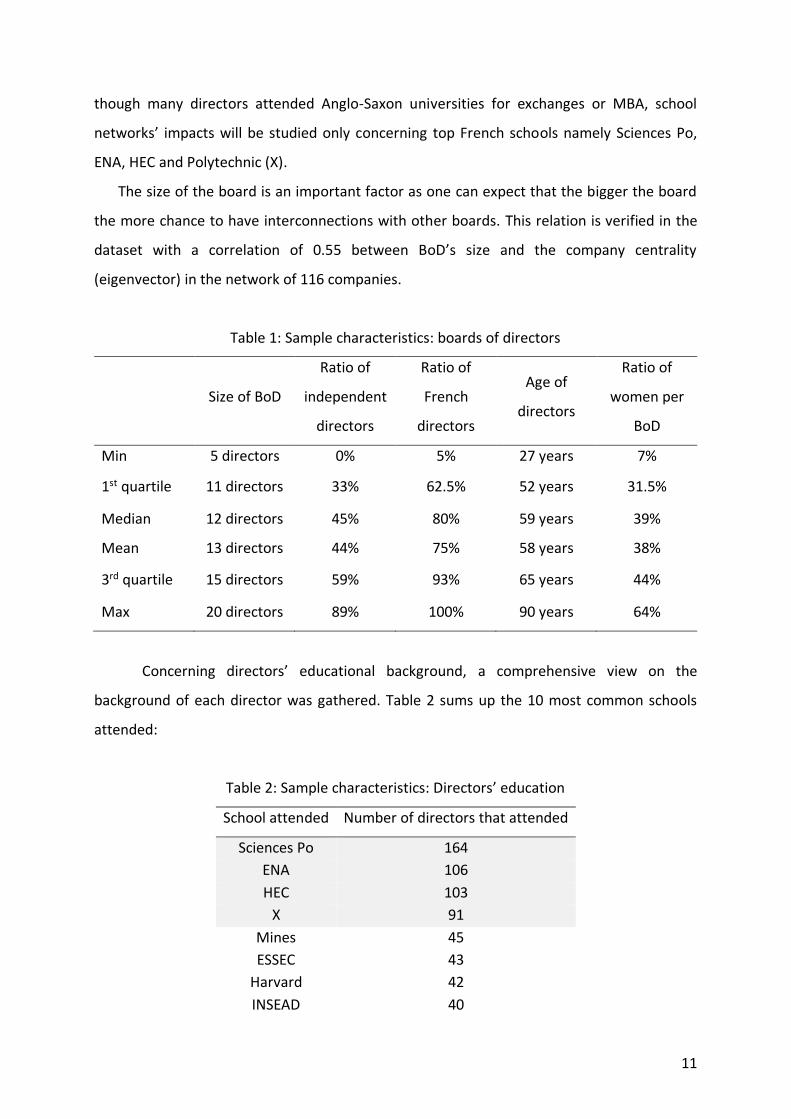
The size of the board is an important factor as one can expect that the bigger the board
the more chance to have interconnections with other boards. This relation is verified in the
dataset with a correlation of 0.55 between BoD’s size and the company centrality
(eigenvector) in the network of 116 companies.
Table 1: Sample characteristics: boards of directors
Size of BoD
Ratio of
independent
directors
Ratio of
French
directors
Age of
directors
Ratio of
women per
BoD
Min 5 directors 0% 5% 27 years 7%
1st quartile 11 directors 33% 62.5% 52 years 31.5%
Median 12 directors 45% 80% 59 years 39%
Mean 13 directors 44% 75% 58 years 38%
3rd quartile 15 directors 59% 93% 65 years 44%
Max 20 directors 89% 100% 90 years 64%
Concerning directors’ educational background, a comprehensive view on the
background of each director was gathered. Table 2 sums up the 10 most common schools
attended:
Table 2: Sample characteristics: Directors’ education
School attended Number of directors that attended
Sciences Po 164
ENA 106
HEC 103
X 91
Mines 45
ESSEC 43
Harvard 42
INSEAD 40

12
ESCP 29
ENS 26
Among the people that went to Sciences Po about half of them also did ENA (75 directors both
went to ENA and Sciences Po) and 10 directors both did Polytechnic and ENA.
For the sake of simplicity, this study will only consider school networks’ impact
regarding the top 4 schools attended (Sciences Po, ENA, HEC and X).
2.1.2 Performance variables and characteristics
The period of study is the year 2016 and the evolution between the year 2015 end and
the year 2016 end. Data on companies were collected in two ways: 1) using registration
documents for year 2015 and 2016 of the companies and 2) financial information on stock
prices’ evolution using Yahoo Finance mainly (in some specific case data from other sources
like investor relations websites or Google finance). The following information were collected
for each company for year 2015 and year 2016:
- Sales,
- EBIT,
- Net financing cost,
- Net income,
- Weighted average number of shares outstanding,
- Basic EPS,
- Total assets,
- Total equity,
- Total liabilities,
- Net financial debt,
- Effective tax rate,
- CEO total compensation,
- Stock prices throughout the period.
13
Financial statements of 6 companies were not in euros: Aperam (USD), ArcelorMittal
(USD), CGG (USD), LafargeHolcim (CHF), STMicroelectronics (USD) and Total (USD). The
conversion exchange rates used were the ones of 31 December 2015 and 31 December 2016.
Furthermore, several companies’ calendar results are not December-based (Elior,
Eutelsat, Neopost, Pernod Ricard, etc.). To keep a similar market environment, the stock
prices’ period considered was the same for all companies despite those calendar
discrepancies.
As mentioned in section 1, there are several ways of measuring firms’ performance. In this
research, the following metrics of performance are used:
- Sales’ growth,
- Return on Assets (ROA),
- Return on Capital Employed (ROCE),
- Return on Equity (ROE),
- Price-earnings ratio (PE),
- Price-to-book value (PB),
- Tobin’s q (QTob),
- Market adjusted returns (MAR),
- Economic value added (EVA).
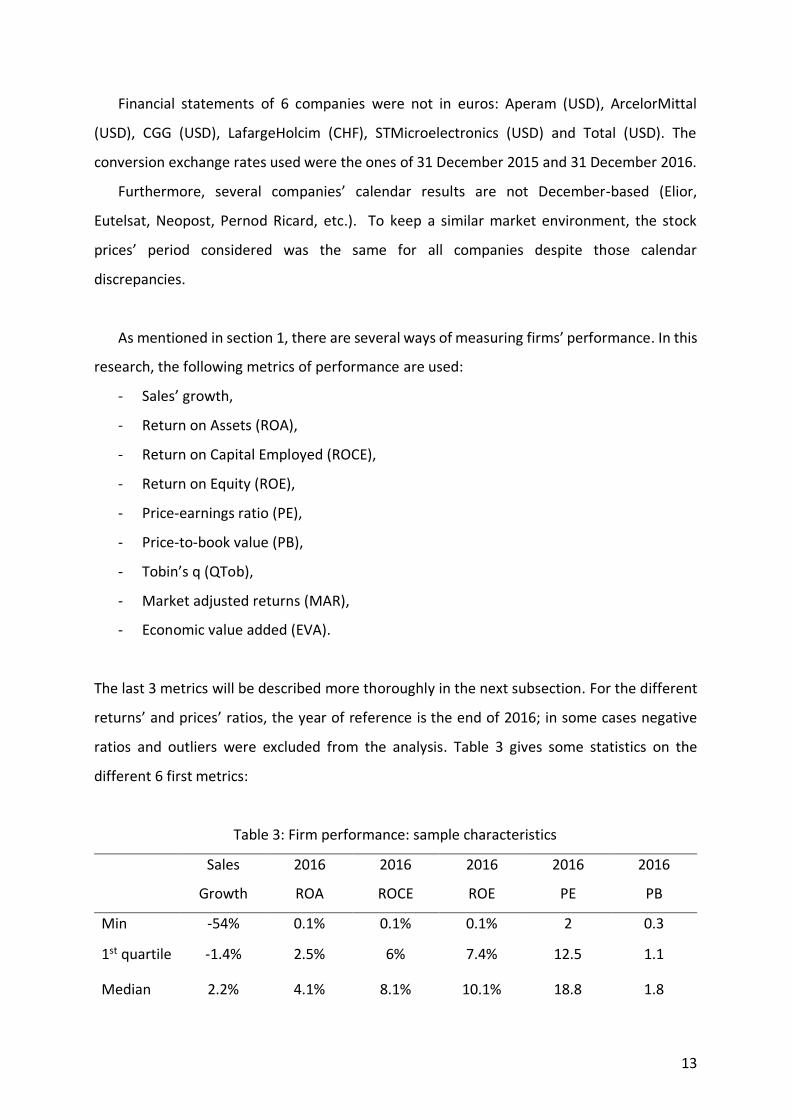
The last 3 metrics will be described more thoroughly in the next subsection. For the different
returns’ and prices’ ratios, the year of reference is the end of 2016; in some cases negative
ratios and outliers were excluded from the analysis. Table 3 gives some statistics on the
different 6 first metrics:
Table 3: Firm performance: sample characteristics
Sales
Growth
2016
ROA
2016
ROCE
2016
ROE
2016
PE
2016
PB
Min -54% 0.1% 0.1% 0.1% 2 0.3
1st quartile -1.4% 2.5% 6% 7.4% 12.5 1.1
Median 2.2% 4.1% 8.1% 10.1% 18.8 1.8

14
Mean 4.8% 4.3% 10.6% 11.3% 19.6 2.4
3rd quartile 6.9% 5.3% 12.2% 13.9% 25 3.1
Max 162% 26% 43.8% 36% 48.7 13.3
Sample 116 104 86 101 100 114
Strong sales’ growths correspond to small companies (for example Innate Pharma
+162%, Plastic Omnium -54%, Genfit +55% and DBV Technologies +47%) and were not
excluded of this metric. On average, companies in the sample grew by 4.8%. Those are
international and mature companies of relatively high scale.
Negative ROA are excluded from the scope, with 11 companies that have negative net
income for the year 2016. Gaztransport and Technigaz company was also excluded with an
ROA of 54%. GTT is a small but very profitable company (net income margin above 50%, only
359 staffs, market cap above €1.4 bn) with very few assets enabling it to have those important
ROA levels. The ROA of 2016 was compared to the ROA of 2015 to check for big discrepancies.
The two ROA are very similar with small variations for some companies. For each metric, year
2015 and year 2016 were compared to avoid big discrepancies.
ROCE was calculated as:
𝑅𝑂𝐶𝐸 =𝐸𝐵𝐼𝑇 × (1 − 𝑇𝑎𝑥 𝑅𝑎𝑡𝑒)
𝐶𝑎𝑝𝑖𝑡𝑎𝑙 𝐸𝑚𝑝𝑙𝑜𝑦𝑒𝑑
The EBIT corresponds to continuing operating profit stated by companies in their financial
statements. In this respect, this ROCE calculation is a strong approximation as the
denominator is not retreated from discontinuing elements and the continuing operating profit
is based only on the financial statement’s value given and not by recalculating it. The ROCE
metric is therefore not strongly reliable.
As for ROA, negative ROE are excluded from the scope: 11 companies with negative
net income and two companies with negative equity (Solocal because of current
restructuration and Edenred which was spun off Accor company). GTT group with an ROE close
to 100% and Air France-KLM of 61% are also excluded.

15
Negative PE ratios were excluded from the analysis. Furthermore, a few companies
with important PE were also excluded for this metric (Plastic Omnium, STMicroelectronics,
ENGIE, Icade, Innate Pharma).
Concerning the PB ratios, only the two companies with negative equity were excluded
from the scope.
2.2 QTob, MAR and EVA
2.2.1 Tobin’s q
Tobin’s q is defined as:
𝑞 =𝐸𝑞𝑢𝑖𝑡𝑦 𝑀𝑎𝑟𝑘𝑒𝑡 𝑉𝑎𝑙𝑢𝑒 + 𝐿𝑖𝑎𝑏𝑖𝑙𝑖𝑡𝑖𝑒𝑠 𝑀𝑎𝑟𝑘𝑒𝑡 𝑉𝑎𝑙𝑢𝑒
𝐸𝑞𝑢𝑖𝑡𝑦 𝐵𝑜𝑜𝑘 𝑉𝑎𝑙𝑢𝑒 + 𝐿𝑖𝑎𝑏𝑖𝑙𝑖𝑡𝑖𝑒𝑠 𝐵𝑜𝑜𝑘 𝑉𝑎𝑙𝑢𝑒
It is a relatively well used indicator in the financial literature, as most papers do this paper will
assume the same value for the liabilities market and book value, this approximation enables
a way more easy and quick calculation of Tobin’s q. Tobin’s q is therefore calculated as:
𝑞 =𝐸𝑞𝑢𝑖𝑡𝑦 𝑀𝑎𝑟𝑘𝑒𝑡 𝑉𝑎𝑙𝑢𝑒 + 𝐿𝑖𝑎𝑏𝑖𝑙𝑖𝑡𝑖𝑒𝑠 𝐵𝑜𝑜𝑘 𝑉𝑎𝑙𝑢𝑒
𝐸𝑞𝑢𝑖𝑡𝑦 𝐵𝑜𝑜𝑘 𝑉𝑎𝑙𝑢𝑒 + 𝐿𝑖𝑎𝑏𝑖𝑙𝑖𝑡𝑖𝑒𝑠 𝐵𝑜𝑜𝑘 𝑉𝑎𝑙𝑢𝑒
The main intuition is that if Tobin’s q is higher than 1, the market value is higher than the book
value indicating some unmeasured or unaccounted assets for the company. Tobin’s q for a
specific market evolves through market ups and downs. This is therefore a useful indicator of
potential bubbles. When used not to compare time-period but across companies, it can also
show intangible assets owned by each company (human capital, relational capital,
organisational capital) and therefore it gives a specific view on companies’ performance and
capacity to generate future wealth.

16
Table 4: Tobin’s q distribution
2016 QTob
Min 0.78
1st quartile 1.03
Median 1.3
Mean 1.6
3rd quartile 1.7
Max 7.2
Sample 116
As for the other performance indicators, there are some high values slightly driving the mean
up. Those high Tobin’s q correspond to: i) small companies with high market cap valuations
(GTT with a Tobin’s Q of 7.2, DBV Technologies 6 and Adocia 5.7) but also bigger companies
with intangible assets of different sorts (Hermès 7.1, Dassault 3.1 and L’Oréal 3.5 for example).
2.2.2 Market Adjusted Stock Price Returns
To measure company performance, one can be interested at looking at the stock
evolution during the year. This measure can be impacted by volatility for some stocks.
Financial papers often use cumulative abnormal returns (CAR). This metric is very useful when
studying an event and its impact on a stock but CAR metric is less pertinent on longer period
of time. Following Bhagat and Black (1999), this paper uses a more direct metric which they
call market adjusted stock price returns (MAR), which correspond to daily returns minus the
return on the market cumulated over the year. In this paper, the market return is measured
by the SBF 120 index provided by Euronext. The returns were geometrically compounded
rather than arithmetically summed. The MAR calculated are very close to the yearly stock
returns.
Table 5: MAR
2016 MAR
Min -84%

17
1st quartile -13%
Median -1.3%
Mean -0.3%
3rd quartile 12%
Max 169%
Sample 116
The 169% increase corresponds to ArcelorMittal which went from a stock close to €2
to a stock above €7 in the year 2016. The 84% decrease correspond to CGG company.
2.2.3 Economic Value Added
The economic value added (EVA) metric has been developed to further measure
companies’ performance. The EVA aims at measuring the wealth created in excess to the
required return for a company to pay its shareholders and debt holders. Following Adjaoud,
Zeghal and Andaleeb (2007), this paper uses the EVA to better model firms’ performance. The
EVA is defined as:
𝐸𝑉𝐴 = 𝐸𝐵𝐼𝑇 × (1 − 𝑇𝑎𝑥 𝑅𝑎𝑡𝑒) − 𝑊𝐴𝐶𝐶 × 𝐶𝑎𝑝𝑖𝑡𝑎𝑙 𝐼𝑛𝑣𝑒𝑠𝑡𝑒𝑑 (1)
The Weighted Average Cost of Capital (WACC) corresponds to:
𝑊𝐴𝐶𝐶 = 𝐶𝑜𝑠𝑡 𝑜𝑓 𝑑𝑒𝑏𝑡 × (1 − 𝑇𝑎𝑥 𝑅𝑎𝑡𝑒) ×𝑁𝑒𝑡 𝐷𝑒𝑏𝑡
𝑁𝑒𝑡 𝐷𝑒𝑏𝑡 + 𝐸𝑞𝑢𝑖𝑡𝑦
+ 𝐶𝑜𝑠𝑡 𝑜𝑓 𝑒𝑞𝑢𝑖𝑡𝑦 ×𝐸𝑞𝑢𝑖𝑡𝑦
𝑁𝑒𝑡 𝐷𝑒𝑏𝑡 + 𝐸𝑞𝑢𝑖𝑡𝑦
If one neglects or cannot calculate the cost of debt, the EVA can be approximated by:
𝐸𝑉𝐴 = 𝐸𝐵𝐼𝑇 × (1 − 𝑇𝑎𝑥 𝑅𝑎𝑡𝑒) − 𝐶𝑜𝑠𝑡 𝑜𝑓 𝐸𝑞𝑢𝑖𝑡𝑦 × 𝐶𝑜𝑚𝑚𝑜𝑛 𝐸𝑞𝑢𝑖𝑡𝑦 (2)

18
Depending on the capacity to calculate the cost of debt, the EVA was calculated using the first
or second formula. When both can be calculated, the two EVA are highly correlated
(correlation of 0.94) and similar for each company. This indicates that the EVA based only on
the cost of equity is a good proxy for the EVA based on the full cost of capital for the companies
when the EVA based on full cost is not available.
Cost of capital: cost of equity and cost of debt
CAPM model was used to evaluate the cost of equity for each firm:
𝐶𝑜𝑠𝑡 𝑜𝑓 𝑒𝑞𝑢𝑖𝑡𝑦 = 𝑅𝑖𝑠𝑘 𝐹𝑟𝑒𝑒 𝑅𝑎𝑡𝑒 + 𝛽 × 𝑀𝑎𝑟𝑘𝑒𝑡 𝑃𝑟𝑒𝑚𝑖𝑢𝑚
The risk-free rate was set at 1% which is close to the actual rate of return of the 10
years OAT published by the Banque de France. The market premium was set at 10%.
Beta coefficients were calculated based on the covariation of the daily stock price
return of each company and the daily return of the SBF 120 index divided by the variance of
the daily return of the SBF 120 index.
The cost of debt was calculated by dividing the net financing cost by the net financial
debt for each company. Only companies with a positive net financial debt and net financing
cost were kept.
Table 6 summarizes the findings concerning the WACC which were calculated for 72
companies:
Table 6: WACC
2016 WACC
Min 2.2%
1st quartile 5.2%
Median 6.3%
Mean 6.8 %
3rd quartile 8.4%
19
Max 15.9%
Sample 72
ENGIE beneficiates from the smallest WACC in the modelling. ArcelorMittal has the highest
but it is notably driven by a high cost of equity for ArcelorMittal of 17% based on a high beta
calculation.
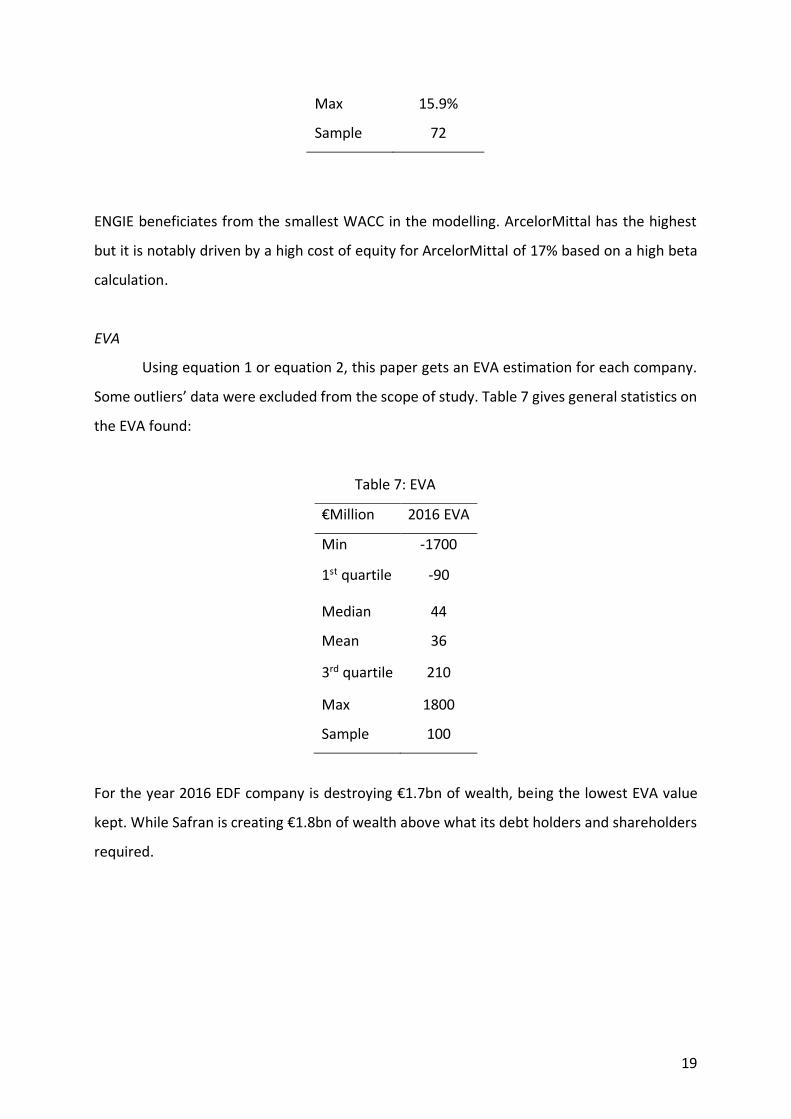
EVA
Using equation 1 or equation 2, this paper gets an EVA estimation for each company.
Some outliers’ data were excluded from the scope of study. Table 7 gives general statistics on
the EVA found:
Table 7: EVA
€Million 2016 EVA
Min -1700
1st quartile -90
Median 44
Mean 36
3rd quartile 210
Max 1800
Sample 100
For the year 2016 EDF company is destroying €1.7bn of wealth, being the lowest EVA value
kept. While Safran is creating €1.8bn of wealth above what its debt holders and shareholders
required.

20
2.3. CEO Compensation
This paper also studies the impact of BoDs’ networks and education networks on the
compensations of the CEO of each firm. Data were collected from the registration documents
of each company. Table 8 provides simple statistics on the compensations of CEO:
Table 8: CEO Compensation
€Million 2016 Total Compensation
Min 0.125
1st quartile 1.25
Median 1.9
Mean 2.4
3rd quartile 2.9
Max 8.4
Sample 108
The lowest compensation corresponds to the compensation given to the CEO of Alten of about
€125K for the year 2016. This does not take into account other revenues its CEO received as
director of Alten and sub entity of Alten.
21
Section 3. Modelling
To study the impact of BoDs’ networks and educational network on firms’
performance, this paper had first to model those networks. The first subsection will explain
the modelling of those networks before using them as inputs to see their impacts on firms’
performance and CEO compensation in the following subsections.
3.1 Network modelling
3.1.1 BoD interlocks
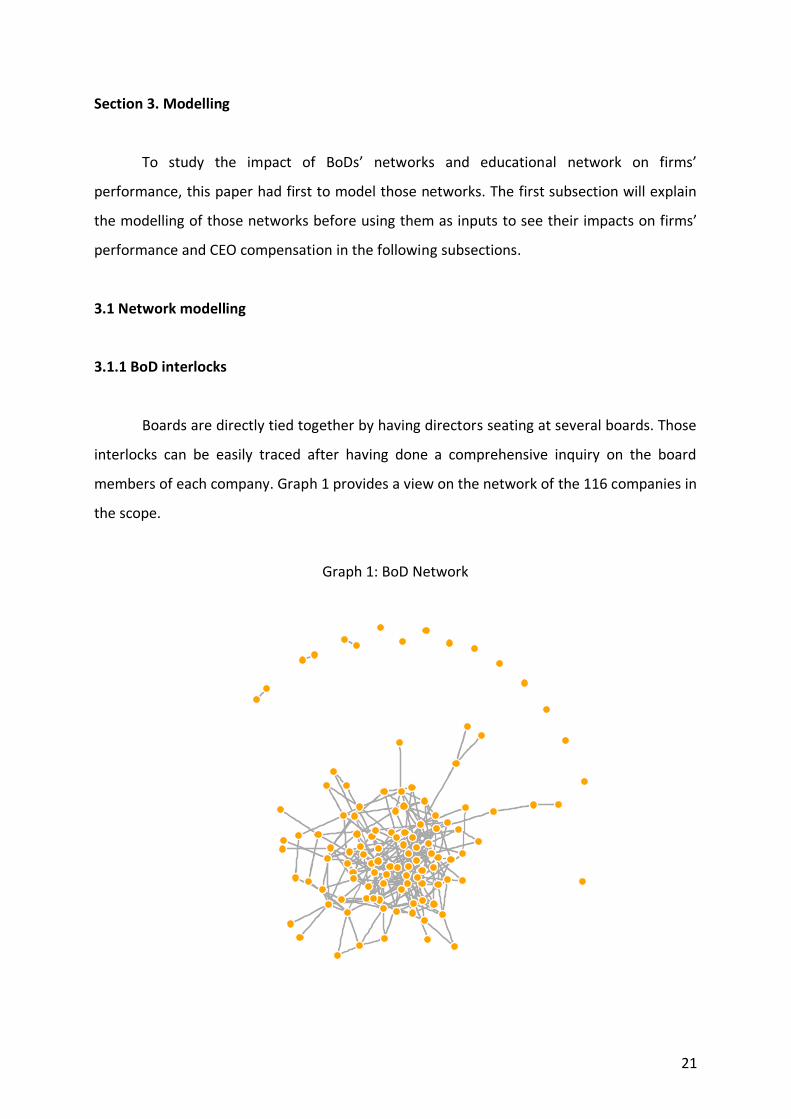
Boards are directly tied together by having directors seating at several boards. Those
interlocks can be easily traced after having done a comprehensive inquiry on the board
members of each company. Graph 1 provides a view on the network of the 116 companies in
the scope.
Graph 1: BoD Network
22
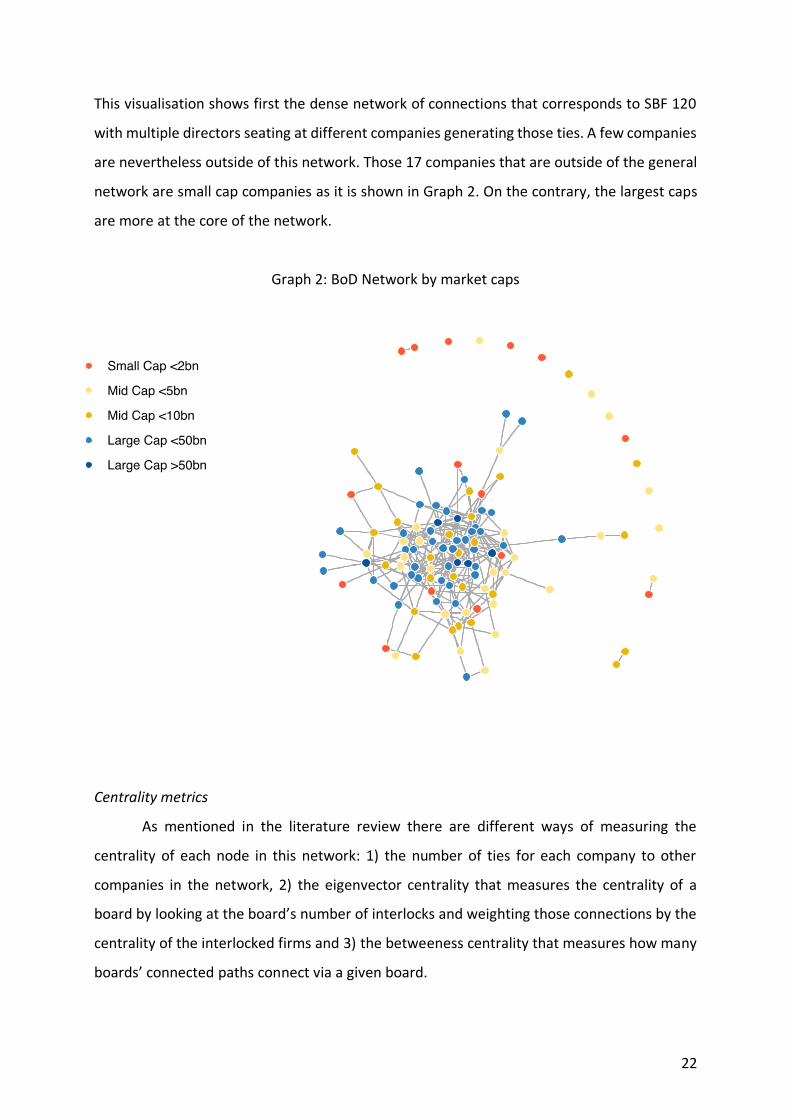
This visualisation shows first the dense network of connections that corresponds to SBF 120
with multiple directors seating at different companies generating those ties. A few companies
are nevertheless outside of this network. Those 17 companies that are outside of the general
network are small cap companies as it is shown in Graph 2. On the contrary, the largest caps
are more at the core of the network.
Graph 2: BoD Network by market caps
Centrality metrics
As mentioned in the literature review there are different ways of measuring the
centrality of each node in this network: 1) the number of ties for each company to other
companies in the network, 2) the eigenvector centrality that measures the centrality of a
board by looking at the board’s number of interlocks and weighting those connections by the
centrality of the interlocked firms and 3) the betweeness centrality that measures how many
boards’ connected paths connect via a given board.

23
Table 9: BoD network centrality metrics correlations
Number of ties Eigenvector Betweeness
Number of ties 1
Eigenvector 0.92 1
Betweeness 0.76 0.69 1
Table 9 shows the important correlation between those different metrics using this
paper’s sample. In this respect, the modelling will be mainly based on the eigenvector
centrality.
Table 10 provides statistics on the eigenvector values:
Table 10: Eigenvector centrality
Eigenvector
Min 0
1st quartile 0.04
Median 0.22
Mean 0.28
3rd quartile 0.45
Max 1
Sample 116
The eigenvector values are limited between 0 and 1. The major values correspond to the more
connected boards namely: Imerys (value of 1), Bouygues (0.96), ENGIE (0.96), Veolia (0.92)
and BNP Paribas (0.81).
3.1.2 Education networks
The impact of educational networks for each board was evaluated by measuring the
share of directors who attended Sciences Po, ENA, HEC and or X during their studies compare
24
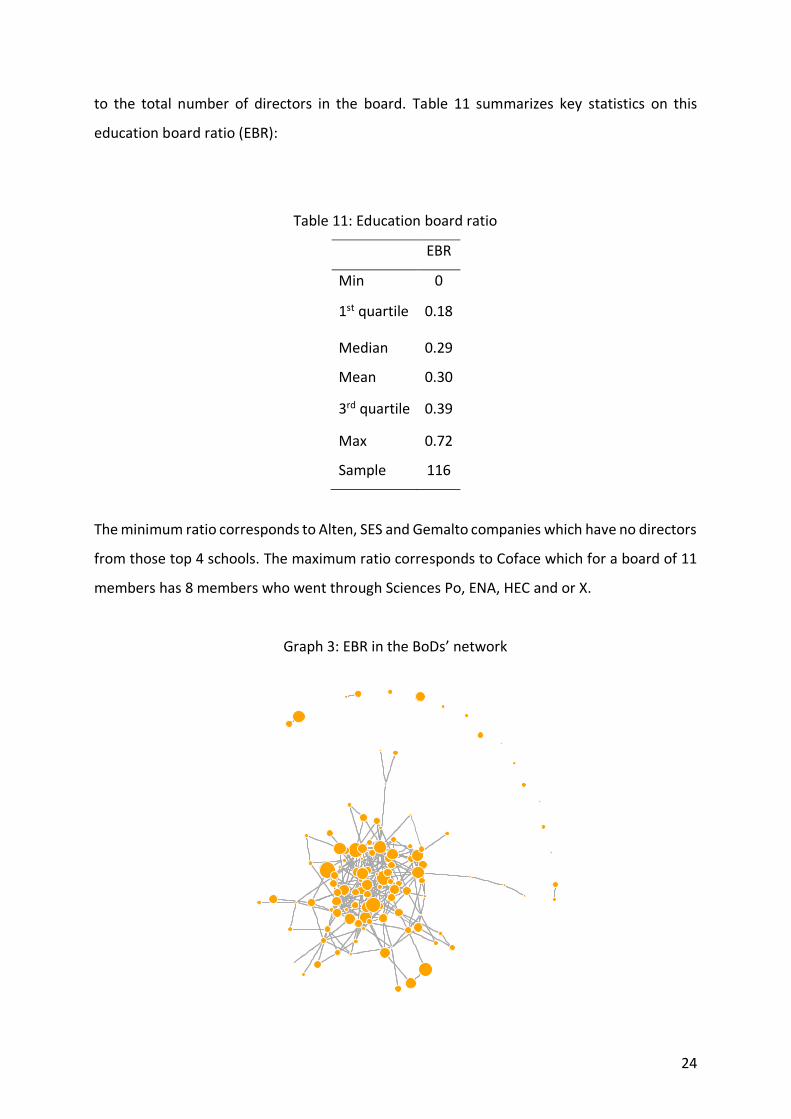
to the total number of directors in the board. Table 11 summarizes key statistics on this
education board ratio (EBR):
Table 11: Education board ratio
EBR
Min 0
1st quartile 0.18
Median 0.29
Mean 0.30
3rd quartile 0.39
Max 0.72
Sample 116
The minimum ratio corresponds to Alten, SES and Gemalto companies which have no directors
from those top 4 schools. The maximum ratio corresponds to Coface which for a board of 11
members has 8 members who went through Sciences Po, ENA, HEC and or X.
Graph 3: EBR in the BoDs’ network
25
Graph 3 shows a heterogeneous landscape when comparing education network to BoDs’
network. The eigenvector centrality and the EBR can be judged relatively independent (this is
confirmed by other statistics).
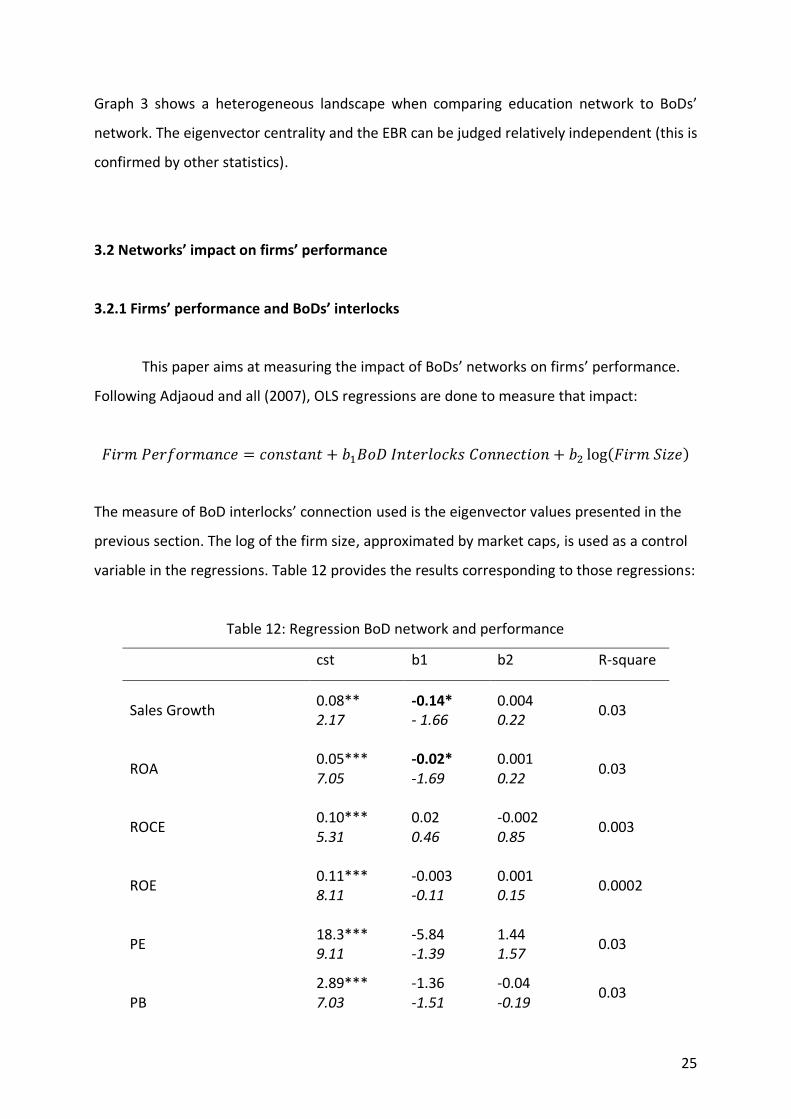
3.2 Networks’ impact on firms’ performance
3.2.1 Firms’ performance and BoDs’ interlocks
This paper aims at measuring the impact of BoDs’ networks on firms’ performance.
Following Adjaoud and all (2007), OLS regressions are done to measure that impact:
𝐹𝑖𝑟𝑚 𝑃𝑒𝑟𝑓𝑜𝑟𝑚𝑎𝑛𝑐𝑒 = 𝑐𝑜𝑛𝑠𝑡𝑎𝑛𝑡 + 𝑏1𝐵𝑜𝐷 𝐼𝑛𝑡𝑒𝑟𝑙𝑜𝑐𝑘𝑠 𝐶𝑜𝑛𝑛𝑒𝑐𝑡𝑖𝑜𝑛 + 𝑏2 log(𝐹𝑖𝑟𝑚 𝑆𝑖𝑧𝑒)
The measure of BoD interlocks’ connection used is the eigenvector values presented in the
previous section. The log of the firm size, approximated by market caps, is used as a control
variable in the regressions. Table 12 provides the results corresponding to those regressions:
Table 12: Regression BoD network and performance
cst b1 b2 R-square
Sales Growth
0.08** 2.17
-0.14* - 1.66
0.004 0.22
0.03
ROA
0.05*** 7.05
-0.02* -1.69
0.001 0.22
0.03
ROCE
0.10*** 5.31
0.02 0.46
-0.002 0.85
0.003
ROE
0.11*** 8.11
-0.003 -0.11
0.001 0.15
0.0002
PE
18.3*** 9.11
-5.84 -1.39
1.44 1.57
0.03
PB
2.89*** 7.03
-1.36 -1.51
-0.04 -0.19
0.03
26
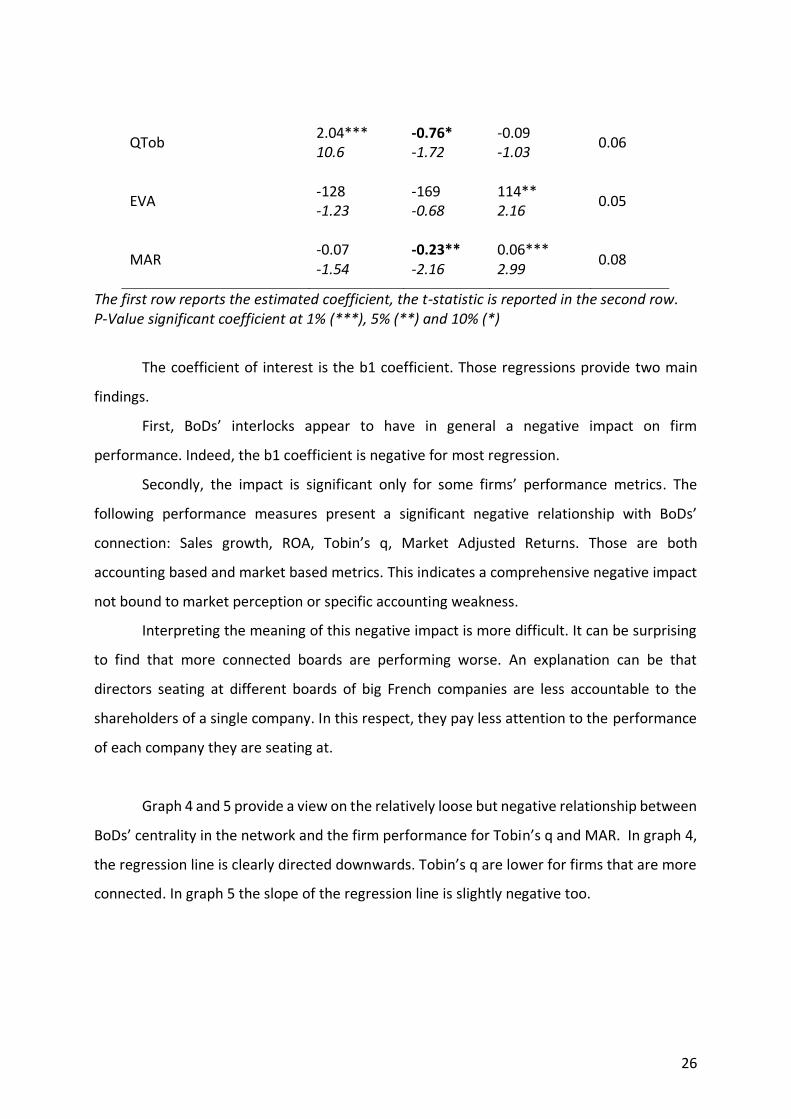
QTob
2.04*** 10.6
-0.76* -1.72
-0.09 -1.03
0.06
EVA
-128 -1.23
-169 -0.68
114** 2.16
0.05
MAR
-0.07 -1.54
-0.23** -2.16
0.06*** 2.99
0.08
The first row reports the estimated coefficient, the t-statistic is reported in the second row. P-Value significant coefficient at 1% (***), 5% (**) and 10% (*)
The coefficient of interest is the b1 coefficient. Those regressions provide two main
findings.
First, BoDs’ interlocks appear to have in general a negative impact on firm
performance. Indeed, the b1 coefficient is negative for most regression.
Secondly, the impact is significant only for some firms’ performance metrics. The
following performance measures present a significant negative relationship with BoDs’
connection: Sales growth, ROA, Tobin’s q, Market Adjusted Returns. Those are both
accounting based and market based metrics. This indicates a comprehensive negative impact
not bound to market perception or specific accounting weakness.
Interpreting the meaning of this negative impact is more difficult. It can be surprising
to find that more connected boards are performing worse. An explanation can be that
directors seating at different boards of big French companies are less accountable to the
shareholders of a single company. In this respect, they pay less attention to the performance
of each company they are seating at.
Graph 4 and 5 provide a view on the relatively loose but negative relationship between
BoDs’ centrality in the network and the firm performance for Tobin’s q and MAR. In graph 4,
the regression line is clearly directed downwards. Tobin’s q are lower for firms that are more
connected. In graph 5 the slope of the regression line is slightly negative too.
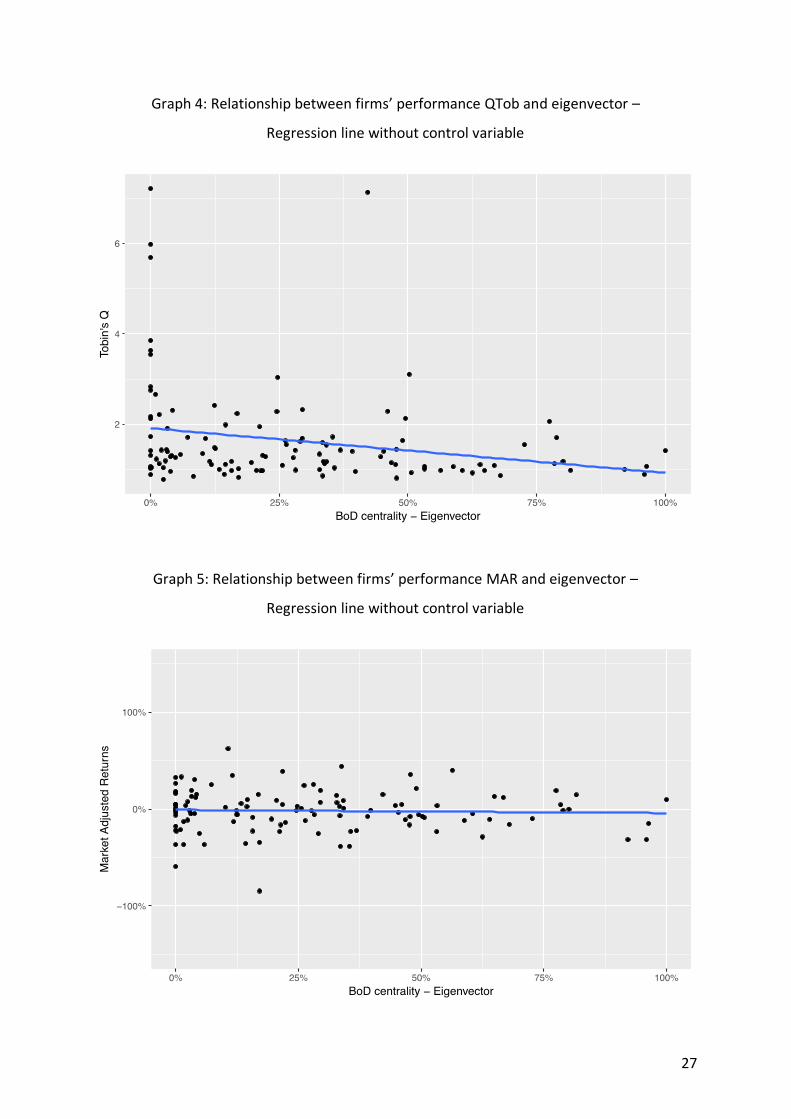
27
Graph 4: Relationship between firms’ performance QTob and eigenvector –
Regression line without control variable
Graph 5: Relationship between firms’ performance MAR and eigenvector –
Regression line without control variable

28
3.2.2 Firms’ performance and education network
To measure the impact of educational network on firms’ performance a similar
regression is used:
𝐹𝑖𝑟𝑚 𝑃𝑒𝑟𝑓𝑜𝑟𝑚𝑎𝑛𝑐𝑒 = 𝑐𝑜𝑛𝑠𝑡𝑎𝑛𝑡 + 𝑏1𝐵𝑜𝐷 𝐸𝑑𝑢𝑐𝑎𝑡𝑖𝑜𝑛 𝐶𝑜𝑛𝑛𝑒𝑐𝑡𝑖𝑜𝑛 + 𝑏2 log(𝐹𝑖𝑟𝑚 𝑆𝑖𝑧𝑒)
The BoD education connection corresponds to the EBR indicator developed in
subsection 3.1.2. Table 13 gives the regression results. As for BoDs’ connection impact, the
education connections appear to have a negative impact on some firms’ performances
metrics. Sales growth, ROA, PE ratio and MAR are significantly impacted negatively by the ratio
of directors from ENA, Sciences Po, X and HEC in the board.
Table 13: Regression education network and performance
cst b1 b2 R-square
Sales Growth
0.13** 2.65
-0.23* - 1.85
-0.007 -0.48
0.04
ROA
0.06*** 6.61
-0.04** -2.03
-0.001 -0.47
0.04
ROCE
0.12*** 4.99
-0.06 -0.98
0.001 0.18
0.01
ROE
0.12*** 7.13
-0.03 -0.80
0.001 0.23
0.007
PE
21.8*** 8.42
-13.6** -2.34
0.93 1.17
0.06
PB
3.27*** 6.05
-1.80 -1.34
-0.15 -0.85
0.03
QTob
2.13*** 8.04
-0.53 -0.80
-0.16** -2.02
0.04
EVA
15.6 0.11
-564 -1.58
104** 2.26
0.07

29
MAR
-0.001 -0.03
-0.31** -1.98
0.05** 2.40
0.07
The first row reports the estimated coefficient, the t-statistic is reported in the second row. P-Value significant coefficient at 1% (***), 5% (**) and 10% (*)
Companies with a board composed of people from similar educational backgrounds
are performing worse in terms of performance metrics. This relationship may be explained by
the idea that people sharing very similar backgrounds are less prone to take independent and
efficient decisions for the company or are less accountable for short-term bad performance
such as stock price’s undervaluation. The fact that those directors have very similar
experience and overall careers may also be weakening their capacity to provide wider and
more diverse information and knowledge that the board needs to be more efficient and the
company to be better performing.
Graph 6 and 7 give a complementary view on this impact. The negative relationship is
relatively strong for the market adjusted returns with a p-value lower to 5% and similarly for
price-earnings ratios.
Nevertheless, one must underline that the overall negative relationship between
education network and firm performance, as for BoD centrality, remains relatively weak with
many regressions’ coefficients that are not significant.

30
Graph 6: Relationship between firm performance PE ratio and education connection –
Regression without control variable
Graph 7: Relationship between firm performance MAR and education connection
31
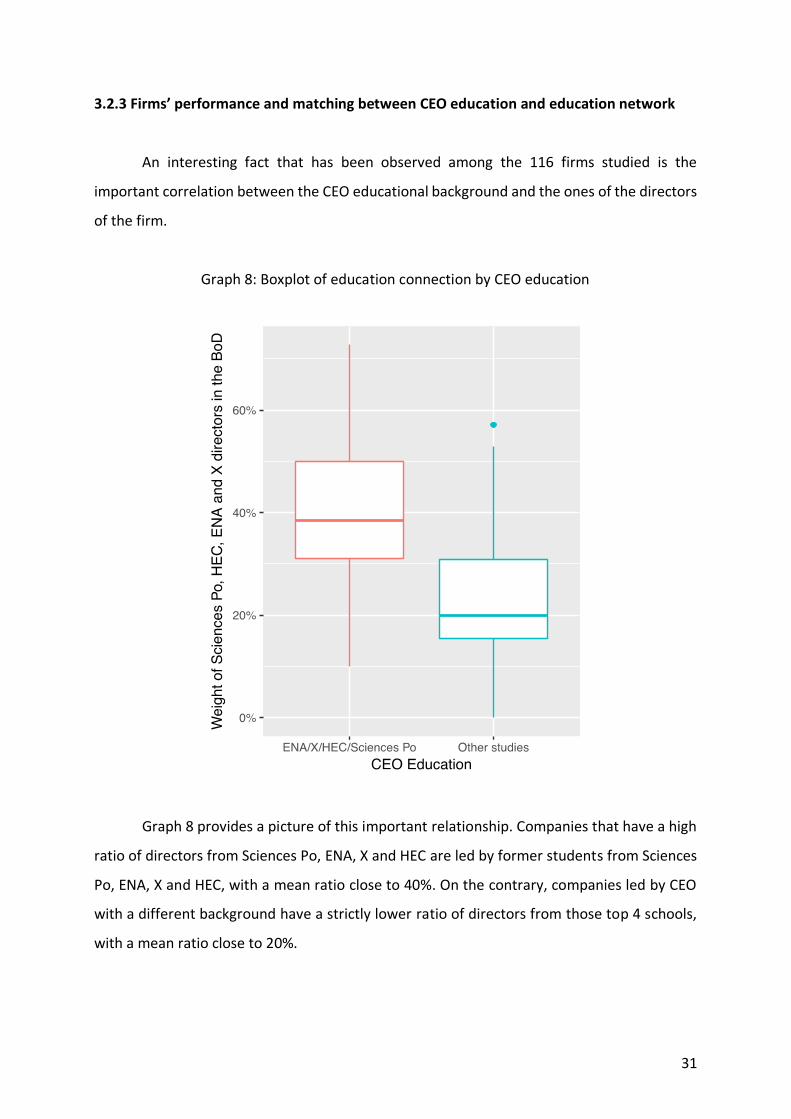
3.2.3 Firms’ performance and matching between CEO education and education network
An interesting fact that has been observed among the 116 firms studied is the
important correlation between the CEO educational background and the ones of the directors
of the firm.
Graph 8: Boxplot of education connection by CEO education
Graph 8 provides a picture of this important relationship. Companies that have a high
ratio of directors from Sciences Po, ENA, X and HEC are led by former students from Sciences
Po, ENA, X and HEC, with a mean ratio close to 40%. On the contrary, companies led by CEO
with a different background have a strictly lower ratio of directors from those top 4 schools,
with a mean ratio close to 20%.

32
Other statistical measures such as an ANOVA study indicate the existence of those two
groups of companies based on the similar education between the CEO education and its board
of directors. The F-stat of the ANOVA analysis is of 44.5 corresponding to a p-value close to 0.
When controlling for firms’ size, using firms’ market caps, the relationship remains highly
significant.
Therefore, boards made of directors with similar educational backgrounds tends to
choose a CEO that have the same educational background. As discussed in the literature
review, for boards information is key when selecting the right CEO. Educational networks are
helping the selection decision by providing information to directors. They know the candidates
or indirectly know them via their networks. Knowing that the CEO went to a top French school
is good signal for them when making their decision. Conversely, after being appointed the
CEO, and even more when he is also the chairman of the board, may try to reshuffle the board
to have more obedient directors. The CEO will pick specific directors more in their networks.
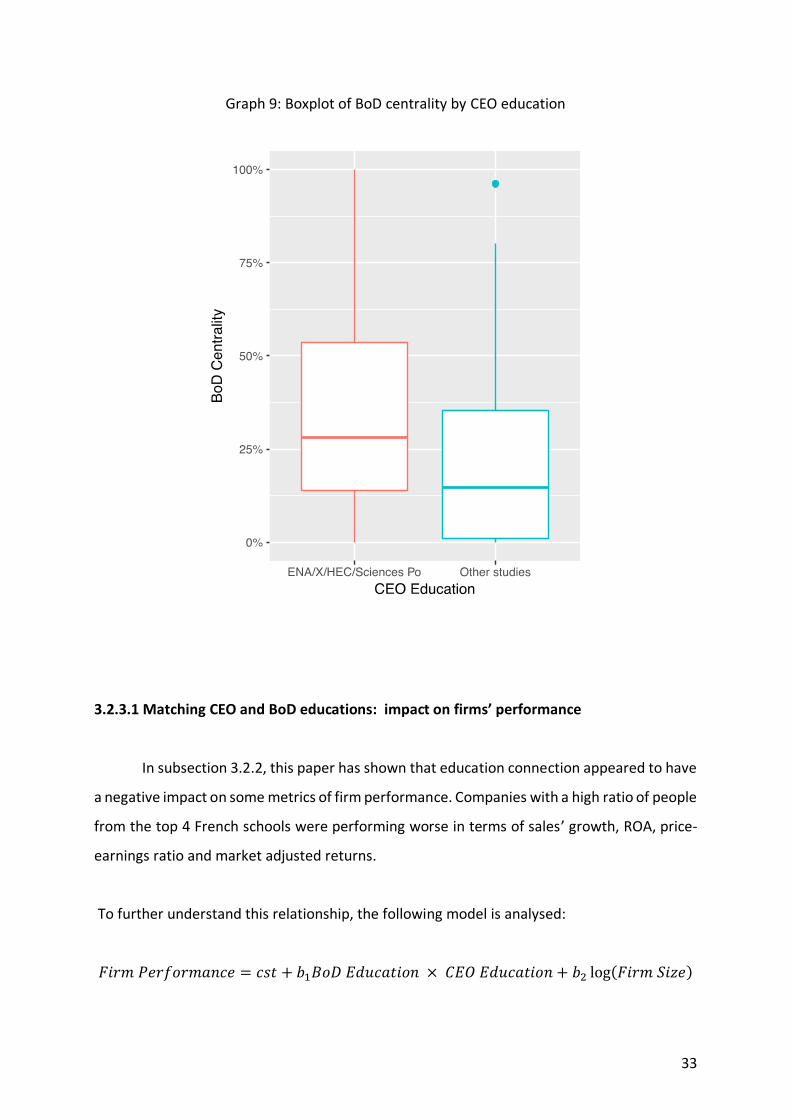
The relationship between the CEO education and the centrality of its company in the
network of companies is less clear but existent (see graph 9). Doing an ANOVA analysis one
cannot reject the existence of a relationship between the CEO education and the centrality of
its BoD. Nevertheless, when controlling for firm size, the relationship is no more significant.
Therefore, CEO that went to ENA, X, HEC or Sciences Po are more present in more
connected companies but it depends mostly on the size of the company.
33
Graph 9: Boxplot of BoD centrality by CEO education
3.2.3.1 Matching CEO and BoD educations: impact on firms’ performance
In subsection 3.2.2, this paper has shown that education connection appeared to have
a negative impact on some metrics of firm performance. Companies with a high ratio of people
from the top 4 French schools were performing worse in terms of sales’ growth, ROA, price-
earnings ratio and market adjusted returns.
To further understand this relationship, the following model is analysed:
𝐹𝑖𝑟𝑚 𝑃𝑒𝑟𝑓𝑜𝑟𝑚𝑎𝑛𝑐𝑒 = 𝑐𝑠𝑡 + 𝑏1𝐵𝑜𝐷 𝐸𝑑𝑢𝑐𝑎𝑡𝑖𝑜𝑛 × 𝐶𝐸𝑂 𝐸𝑑𝑢𝑐𝑎𝑡𝑖𝑜𝑛 + 𝑏2 log(𝐹𝑖𝑟𝑚 𝑆𝑖𝑧𝑒)
34
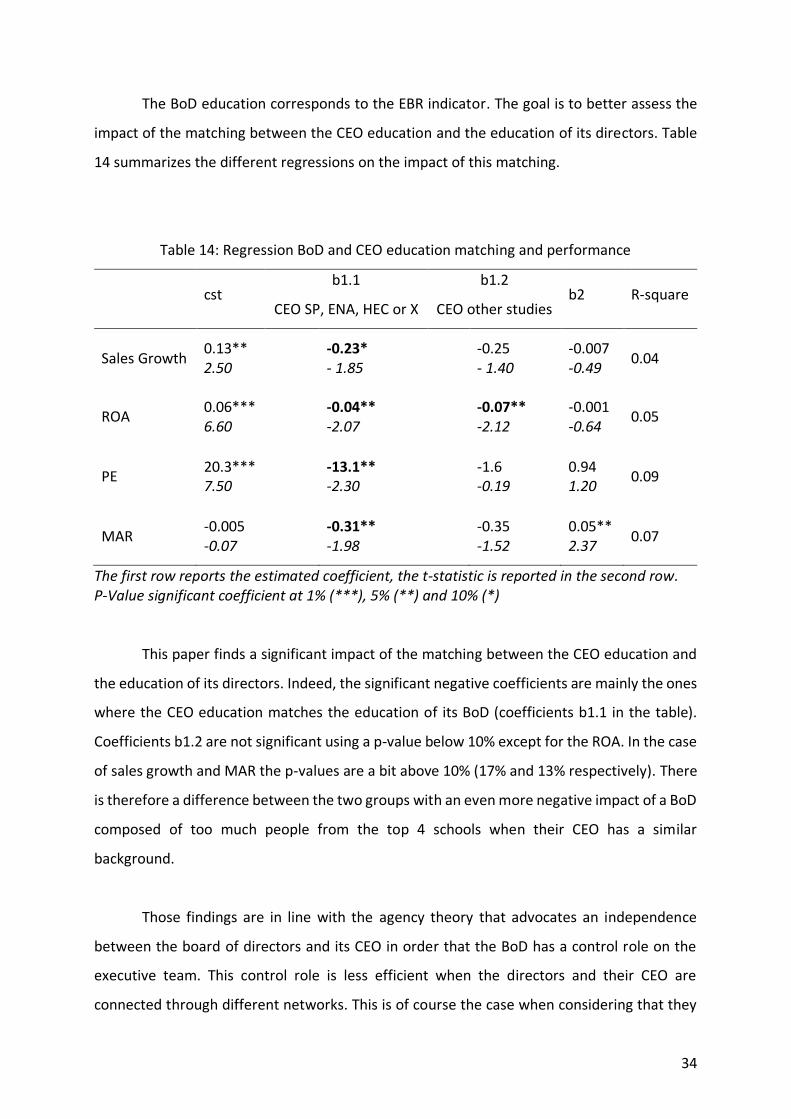
The BoD education corresponds to the EBR indicator. The goal is to better assess the
impact of the matching between the CEO education and the education of its directors. Table
14 summarizes the different regressions on the impact of this matching.
Table 14: Regression BoD and CEO education matching and performance
cst b1.1
CEO SP, ENA, HEC or X
b1.2
CEO other studies b2 R-square
Sales Growth
0.13** 2.50
-0.23* - 1.85
-0.25 - 1.40
-0.007 -0.49
0.04
ROA
0.06*** 6.60
-0.04** -2.07
-0.07** -2.12
-0.001 -0.64
0.05
PE
20.3*** 7.50
-13.1** -2.30
-1.6 -0.19
0.94 1.20
0.09
MAR
-0.005 -0.07
-0.31** -1.98
-0.35 -1.52
0.05** 2.37
0.07
The first row reports the estimated coefficient, the t-statistic is reported in the second row. P-Value significant coefficient at 1% (***), 5% (**) and 10% (*)
This paper finds a significant impact of the matching between the CEO education and
the education of its directors. Indeed, the significant negative coefficients are mainly the ones
where the CEO education matches the education of its BoD (coefficients b1.1 in the table).
Coefficients b1.2 are not significant using a p-value below 10% except for the ROA. In the case
of sales growth and MAR the p-values are a bit above 10% (17% and 13% respectively). There
is therefore a difference between the two groups with an even more negative impact of a BoD
composed of too much people from the top 4 schools when their CEO has a similar
background.
Those findings are in line with the agency theory that advocates an independence
between the board of directors and its CEO in order that the BoD has a control role on the
executive team. This control role is less efficient when the directors and their CEO are
connected through different networks. This is of course the case when considering that they

35
went to similar schools and that they are part of similar educational and professional
networks.
Graph 10: Relationship between MAR performance and matching of BoD and CEO education
The relationship between the education of the directors and the one of their CEO and
its impact on the firm performance is observed in graph 10.

36
There is a clear distinction between the firms lead by CEO with other studies’
background (green points) and the ones who went to Sciences Po, ENA, HEC and or X (red
points). The former are on the left side of the graph corresponding to boards with low ratio of
directors from Sciences Po, ENA, HEC and X. The latter are on the right side.
Overall, the MAR is going down accordingly to the EBR ratio. But, accordingly to the
regression of table 14, this is mainly driven by the red points whereas green points present a
less significant negative regression line.
3.2.3.2 Matching CEO education and BoD centrality: impact on firms’ performance
To further inquire results of subsection 3.2.1, this paper also studied whether the
educational background of the CEO had an impact on firm performance in relation with the
BoD interlocks’ connection. As seen, BoD interlocks appear to have a negative impact on some
performance metrics. The following model is analysed:
𝑃𝑒𝑟𝑓 = 𝑐𝑠𝑡 + 𝑏1𝐵𝑜𝐷 𝐼𝑛𝑡𝑒𝑟𝑙𝑜𝑐𝑘𝑠 𝐶𝑜𝑛𝑛𝑒𝑐𝑡𝑖𝑜𝑛 × 𝐶𝐸𝑂 𝐸𝑑𝑢𝑐𝑎𝑡𝑖𝑜𝑛 + 𝑏2 log(𝐹𝑖𝑟𝑚 𝑆𝑖𝑧𝑒)
Table 15: Regression BoD interlocks and CEO education matching on performance
cst b1.1
CEO SP, ENA, HEC or X
b1.2
CEO other studies b2 R-square
Sales Growth
0.08** 2.17
-0.13 - 1.36
-0.15 - 1.49
0.004 0.21
0.03
ROA
0.05*** 6.99
-0.02 -1.53
-0.02 -1.36
0.001 0.22
0.03
QTob
2.04*** 10.6
-0.68 -1.36
-0.87 -1.61
-0.10 -1.05
0.06
MAR
-0.07 -1.45
-0.20 -1.65
-0.27** -2.08
0.06*** 2.93
0.08
The first row reports the estimated coefficient, the t-statistic is reported in the second row.

37
P-Value significant coefficient at 1% (***), 5% (**) and 10% (*)
Graph 9 already showed that the distinction between companies led by CEO who went
to Sciences Po, ENA, HEC and or X and companies led by CEO who did other studies was less
stringent regarding BoD interlocks connection. The different regressions shown in table 15
confirmed that situation with coefficient b1.1 and b1.2 being no more significant at a 10% p-
value level.
The only specific situation is concerning MAR performance. In that case, it seems that
there is an even more negative impact on firm performance of having directors that are well-
connected because of interlocks while their CEO is less connected regarding its educational
background.
One must underline the fact that the p-values are better for coefficients b1.2 than
coefficients b1.1 (this can be judged in table 15 by considering the t-stats). This provides an
additional view by showing that CEO being connected by their educational background is not
a bad thing per se. It is the interaction between the CEO network and the ones of the firm’s
directors that matters. Too similar networks are weakening the capacity of both the executive
team and the non-executive team to work more efficiently and help the company performing
better.
3.3 Networks’ impact on CEO compensation
In the literature on firms’ governance, a specific interest is given to CEO compensation.
As a complementary element, this paper analyses the impact of education networks and BoD
interlocks on CEO compensation. As a first point of reflexion, one must underline the fact that
in the scope of research there appears no relationship between the CEO compensation and
the firm performance.
The following regressions were done:
𝐹𝑖𝑟𝑚 𝑃𝑒𝑟𝑓𝑜𝑟𝑚𝑎𝑛𝑐𝑒 = 𝑐𝑠𝑡 + 𝑏1log (𝐶𝐸𝑂 𝐶𝑜𝑚𝑝𝑒𝑛𝑠𝑎𝑡𝑖𝑜𝑛) + 𝑏2 log(𝐹𝑖𝑟𝑚 𝑆𝑖𝑧𝑒)

38
Table 16 provides only the b1 coefficients of those regressions. They are all not significant.
There is no clear relationship between the CEO compensation and the different firms’
performance metrics used in this paper.
Table 16: Firm performance and CEO compensation
Sales
Growth ROA ROCE ROE PE PB QTob EVA MAR
b1
-0.01 -0.51
0.001 0.39
0.004 0.34
0.001 0.18
1.02 0.75
0.32 1.10
0.12 0.81
76.2 1.00
0.02 0.87
The first row reports the estimated coefficient, the t-statistic is reported in the second row. P-Value significant coefficient at 1% (***), 5% (**) and 10% (*)
The second point of analysis is to look at the impact of BoD interlocks’ connections and
education connections. The following regressions are performed changing the second variable
of interest accordingly (corresponding to b1 coefficient):
𝐿𝑜𝑔(𝐶𝐸𝑂 𝐶𝑜𝑚𝑝𝑒𝑛𝑠𝑎𝑡𝑖𝑜𝑛) = 𝑐𝑠𝑡 + 𝑏1𝑉𝑎𝑟𝑖𝑎𝑏𝑙𝑒 𝑜𝑓 𝐼𝑛𝑡𝑒𝑟𝑒𝑠𝑡 + 𝑏2 log(𝐹𝑖𝑟𝑚 𝑆𝑖𝑧𝑒)
Table 17: Regression education network and performance
Log (CEO Compensation)
cst
3.20*** 3.43
3.28*** 3.58
Variable of interest:
BoD Interlock Connection
0.04 0.13
EBR
-0.30 -0.64
Log(Firm Size)
0.27*** 4.62
0.27** 4.67
39
R-square
0.17 0.17
The first row reports the estimated coefficient, the t-statistic is reported in the second row. P-Value significant coefficient at 1% (***), 5% (**) and 10% (*)
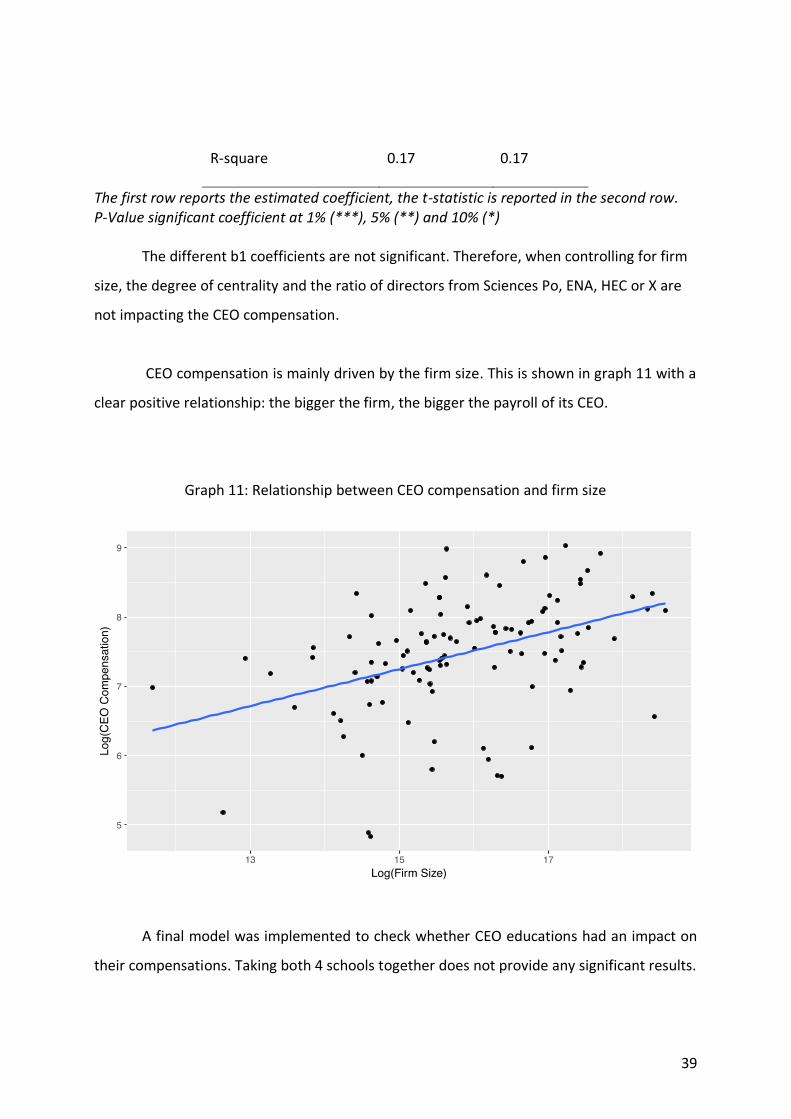
The different b1 coefficients are not significant. Therefore, when controlling for firm
size, the degree of centrality and the ratio of directors from Sciences Po, ENA, HEC or X are
not impacting the CEO compensation.
CEO compensation is mainly driven by the firm size. This is shown in graph 11 with a
clear positive relationship: the bigger the firm, the bigger the payroll of its CEO.
Graph 11: Relationship between CEO compensation and firm size
A final model was implemented to check whether CEO educations had an impact on
their compensations. Taking both 4 schools together does not provide any significant results.
40
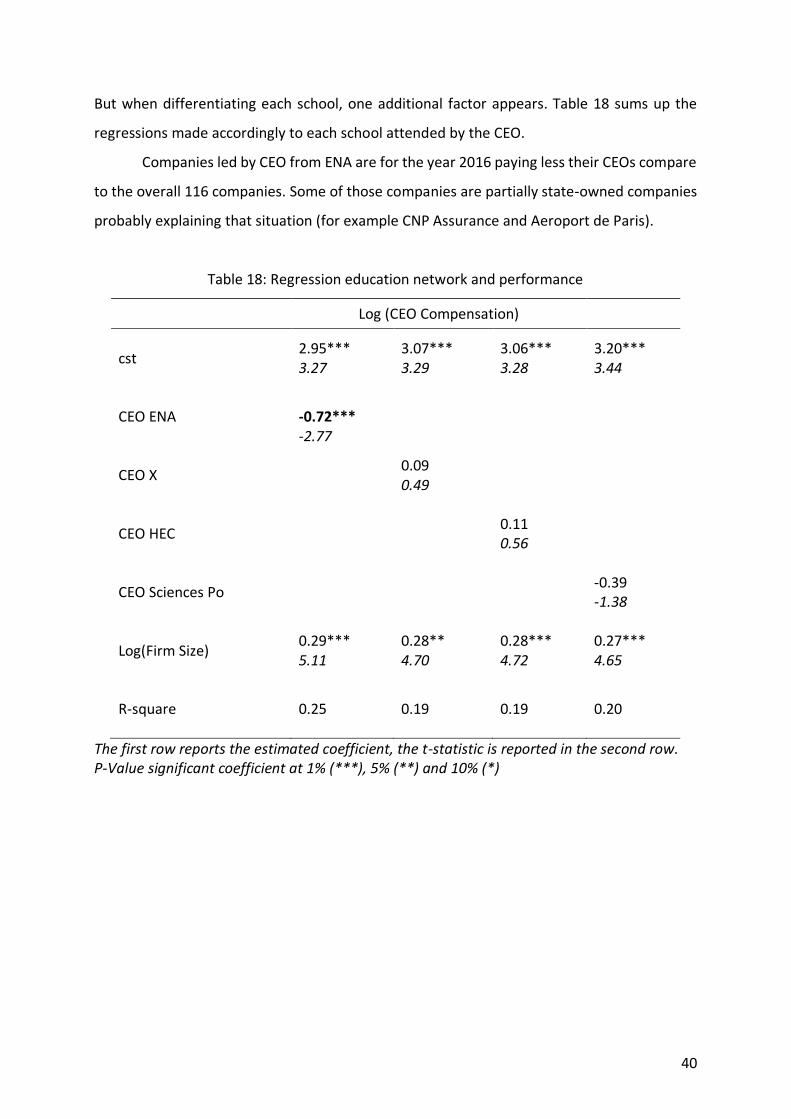
But when differentiating each school, one additional factor appears. Table 18 sums up the
regressions made accordingly to each school attended by the CEO.
Companies led by CEO from ENA are for the year 2016 paying less their CEOs compare
to the overall 116 companies. Some of those companies are partially state-owned companies
probably explaining that situation (for example CNP Assurance and Aeroport de Paris).
Table 18: Regression education network and performance
Log (CEO Compensation)
cst
2.95*** 3.27
3.07*** 3.29
3.06*** 3.28
3.20*** 3.44
CEO ENA
-0.72*** -2.77
CEO X
0.09 0.49
CEO HEC
0.11 0.56
CEO Sciences Po
-0.39 -1.38
Log(Firm Size)
0.29*** 5.11
0.28** 4.70
0.28*** 4.72
0.27*** 4.65
R-square
0.25 0.19
0.19 0.20
The first row reports the estimated coefficient, the t-statistic is reported in the second row. P-Value significant coefficient at 1% (***), 5% (**) and 10% (*)

41
Conclusion
This paper has found that social networks have an impact on firms’ performance.
Direct ties created by interlocks between boards of directors and educational networks based
on same universities’ and schools’ attending are impacting the way boards work and the way
they prompt the performance of the firm. Contrary to some intuitions, more connected firms
do not appear to fare better than less connected firms concerning key accounting and market
based metrics of performance that are sales growth, return on assets, stock prices’ evolution,
price-earnings ratio and Tobin’s Q ratio. The interaction between the CEO and its boards is a
key element here to better explain that bad performance. Boards and CEO that have too
similar educational backgrounds are not leading companies towards their best. The counter-
power that must be played by each of the two is no longer existing making them less
accountable to shareholders. Complementarily, well-connected directors, that seat in
different boards, need a differently but yet well-connected CEO to better conduct the
company.

42
References
Aoki, Masahiko (1994): “The Japanese Firm as a System of Attributes”. In Aoki, Masahiko and
Ronald Dore (Eds.) The Japanese Firm: Sources of Competitive Strength. Oxford, Oxford
University Press. pp.11-40.
Burt, Ronald S and Marc Knez (1995): “Kinds of Third-party Effects on Trust” Rationality and
Society 7:255-92
Donaldson and Davis (1991): “Stewardship Theory or Agency Theory: CEO governance and
shareholder returns” Australian Journal of Management, 16: 49-65
Fama, Eugene (1980): “Agency Problems and the Theory of the Firm”, Journal of Political
Economy Vol. 88, 288.
Fama, Eugene and Michael Jensen (1983): “Agency Problems and Residual Claims”, Journal of
Law and Economics 26, 327-349.
Fodil Adjaoud, Daniel Zeghal and Syed Andaleeb (2007): “The Effect of Board’s Quality on
Performance: a study of Canadian firms” Corporate Governance An International Review,
Volume 15, Issue 4 Pages 623–635
Francis Kramarzy David Thesmarz (2011): “Social Networks in The Boardroom”
Granovetter, Mark (1973): “The Strength of Weak Ties”, American Journal of Sociology, 78
(May), pp 1360-1380
Lauren Cohen, Andrea Frazzini and Christopher Malloy (2008): “The Small World of Investing:
Board Connections and Mutual Fund Returns”, Journal of Political Economy, 2008, vol. 116,
no. 5

43
Lucian A. Bebchuk, Martijn Cremersn and Urs Peyer (2007): “CEO Centrality” NBER Working
Paper No. 13701
Ranjay Gulati and Martin Gargiuto(1999): "Where Do Interorganizational Networks Come
From?" American Journal of Sociology, 104: 1439-1493.
Ranjay Gulati and James D. Westphal (1999): “Cooperative or Controlling? The Effects of
CEO-board Relations and the Content of Interlocks on the Formation of Joint Ventures”
Administrative Science Quarterly, 44 (1999): 473-506
Sanjai Bhagat and Bernard Black (2000): “Board Independence And Long-Term Firm
Performance”
Schonlau and Singh (2009): “Board Networks and Merger Performances”, Carnegie Mellon
University
Tom Kirchmaier and Konstantinos Stathopoulos† (2007): “From Fiction to Fact: The Impact
of CEO Social Networks”, Discussion paper, 608. Financial Markets Group, London School of
Economics and Political Science, London, UK.

44
Annex 1
AccorHotels DBV Technologies Kering Sanofi
Adocia Edenred Klepierre Schneider Electric
Aeroport de Paris EDF Korian Scor
Air France-KLM Eiffage L'Oreal SEB
Air Liquide Elior LafargeHolcim SES
Airbus Elis Lagardere SFR
Alstom ENGIE Legrand Societe Generale
Alten Essilor LVMH Sodexo
Altran Eurazeo M6 Solocal
Aperam Eurofins Scientific Maurel et Prom Solvay
ArcelorMittal Euronext Mercialys Sopra Steria
Arkema Eurotunnel Michelin Spie
Atos Eutelsat Natixis STMicroelectronics
AXA Faurecia Neopost Suez
BIC Fonciere des Regions Nexans Technicolor
bioMerieux GTT Nexity Teleperformance
BNP Paribas Gecina Nokia TF1
Bollore Gemalto Orange Thales
Bouygues Genfit Orpea Total
Bureau Veritas Havas Pernod Ricard Ubisoft
Cap Gemini Hermes Plastic Omnium Unibail-Rodamco
Carrefour Icade PSA Valeo
Casino Iliad Publicis Vallourec
CGG Imerys Remy Cointreau Veolia
CNP Assurances Ingenico Renault Vicat
Coface Innate Pharma Rexel Vinci
Credit Agricole Ipsen Rubis Vivendi
Danone Ipsos Safran Wendel
Dassault JC Decaux Saint-Gobain Zodiac Aerospace

45
Urkund confirmation of receipt
URKUND has received the document - Research paper2017_P_Petrescu_CEO and Boards The Ill Performance of Similar Social Networks.pdf - 6/30/2017 12:10:00 AM. It was sent from [email protected] to [email protected]. The document has been allocated a reference ID - D29525221. Please fill in your name so that we can link your name to your e-mail address. https://secure.urkund.com/account/account/submitter/6460892-783261-571895 At no point are any documents in URKUND's archive/repository browsable, nor are they sorted and they cannot be accessed through Google or any other search engine. Your university/school will have chosen a default setting; clicking the link below will take you to a page where you can change this setting. If you have questions about this, please contact your university or school. https://secure.urkund.com/account/document/exemptionstatus/29525221-365540-314838 Exempted: Documents which are marked "exempted" will not have their content disclosed to other universities/schools if there is a match within the document. Unexempted: These documents will have their content shown to other users if the other users have a match in the document. Regards, URKUND automatic registrar This is an automated e-mail message. You cannot reply to it. If you have questions about URKUND and its use, contact our Customer Support: +46 (0)8 738 5210 (Mon-Fri 08.00-16.30 CET) or by e-mail to [email protected].