ceo cfo cro presentation q2 2016 final - bank of … 2016 analyst...presentation for the quarter...
TRANSCRIPT

Financial Results Month xx, 2015 116Q2
Investor PresentationFor the Quarter Ended April 30, 2016
May 25, 2016

May 25, 2016 2
Caution Regarding Forward-Looking Statements
Bank of Montreal’s public communications often include written or oral forward-looking statements. Statements of this type are included in this document, and may be included in other filings with Canadian securities regulators or the U.S. Securities and Exchange Commission, or in other communications. All such statements are made pursuant to the “safe harbor” provisions of, and are intended to be forward-looking statements under, the United States Private Securities Litigation Reform Act of 1995 and any applicable Canadian securities legislation. Forward-looking statements may involve, but are not limited to, comments with respect to our objectives and priorities for 2016 and beyond, our strategies or future actions, our targets, expectations for our financial condition or share price, and the results of or outlook for our operations or for the Canadian, U.S. and international economies.
By their nature, forward-looking statements require us to make assumptions and are subject to inherent risks and uncertainties. There is significant risk that predictions, forecasts, conclusions or projections will not prove to be accurate, that our assumptions may not be correct and that actual results may differ materially from such predictions, forecasts, conclusions or projections. We caution readers of this document not to place undue reliance on our forward-looking statements as a number of factors could cause actual future results, conditions, actions or events to differ materially from the targets, expectations, estimates or intentions expressed in the forward-looking statements.
The future outcomes that relate to forward-looking statements may be influenced by many factors, including but not limited to: general economic and market conditions in the countries in which we operate; weak, volatile or illiquid capital and/or credit markets; interest rate and currency value fluctuations; changes in monetary, fiscal, tax or economic policy; the level of competition in the geographic and business areas in which we operate; changes in laws or in supervisory expectations or requirements, including capital, interest rate and liquidity requirements and guidance; judicial or regulatory proceedings; the accuracy and completeness of the information we obtain with respect to our customers and counterparties; our ability to execute our strategic plans and to complete and integrate acquisitions, including obtaining regulatory approvals; critical accounting estimates and the effect of changes to accounting standards, rules and interpretations on these estimates; operational and infrastructure risks; changes to our credit ratings; general political conditions; global capital markets activities; the possible effects on our business of war or terrorist activities; outbreaks of disease or illness that affect local, national or international economies; natural disasters and disruptions to public infrastructure, such as transportation, communications, power or water supply; technological changes; and our ability to anticipate and effectively manage risks associated with all of the foregoing factors.
We caution that the foregoing list is not exhaustive of all possible factors. Other factors and risks could adversely affect our results. For more information, please see the Enterprise-Wide Risk Management section on pages 86 to 117 of BMO’s 2015 Annual MD&A, which outlines certain key factors and risks that may affect Bank of Montreal’s future results. When relying on forward-looking statements to make decisions with respect to Bank of Montreal, investors and others should carefully consider these factors and risks, as well as other uncertainties and potential events, and the inherent uncertainty of forward-looking statements. Bank of Montreal does not undertake to update any forward-looking statements, whether written or oral, that may be made from time to time by the organization or on its behalf, except as required by law. The forward-looking information contained in this document is presented for the purpose of assisting our shareholders in understanding our financial position as at and for the periods ended on the dates presented, as well as our strategic priorities and objectives, and may not be appropriate for other purposes.
Assumptions about the performance of the Canadian and U.S. economies, as well as overall market conditions and their combined effect on our business, are material factors we consider when determining our strategic priorities, objectives and expectations for our business. In determining our expectations for economic growth, both broadly and in the financial services sector, we primarily consider historical economic data provided by the Canadian and U.S. governments and their agencies. See the Economic Review and Outlook section of our Second Quarter 2016 Report to Shareholders.
Non-GAAP Measures
Bank of Montreal uses both GAAP and non-GAAP measures to assess performance. Readers are cautioned that earnings and other measures adjusted to a basis other than GAAP do not have standardized meanings under GAAP and are unlikely to be comparable to similar measures used by other companies. Reconciliations of GAAP to non-GAAP measures as well as the rationale for their use can be found on page 5 of Bank of Montreal’s Second Quarter 2016 Report to Shareholders and on page 33 of BMO’s 2015 Annual Report all of which are available on our website at www.bmo.com/investorrelations.
Examples of non-GAAP amounts or measures include: efficiency and leverage ratios; revenue and other measures presented on a taxable equivalent basis (teb); amounts presented net of applicabletaxes; results and measures that exclude the impact of Canadian/U.S. dollar exchange rate movements, adjusted net income, revenues, non-interest expenses, earnings per share, effective tax rate, ROE, efficiency ratio and other adjusted measures which exclude the impact of certain items such as, acquisition integration costs, amortization of acquisition-related intangible assets, decrease (increase) in collective allowance for credit losses and restructuring costs.
Bank of Montreal provides supplemental information on combined business segments to facilitate comparisons to peers.
Forward looking statements & non-GAAP measures

Financial Results Month xx, 2015 3
Strategic HighlightsFor the Quarter Ended April 30, 2016
May 25, 2016
Bill DowneChief Executive Officer
16Q2

Strategic Highlights May 25, 2016 4
• Adjusted1 EPS of $1.73, up 1%
– Earned through a $0.12 write-down of an investment, excluding which EPS was up 8%
– Good operating performance driven by strong growth in our combined personal and commercial banking business and good pre-provision, pre-tax income growth in BMO Capital Markets
– Adjusted1 net operating leverage was positive 1.6% excluding the write-down, and was positive in three of our operating groups
• $1.2B in adjusted1 net income
• CET1 ratio at 10%
• Quarterly dividend increased $0.02 or 2% per common share
– Annual dividend of $3.44 per common share, up 5% from a year ago
Q2 2016 Financial HighlightsYear-to-date adjusted EPS growth of 7% with good operating performance
1 Adjusted measures are non-GAAP measures, See slide 2 for more information. Reported results: YTD EPS up 3%; Q2’16 EPS $1.45, down 3%.; net income of $973MM; net operating leverage (2.2)%See slide 25 for adjustments to reported results

Strategic Highlights May 25, 2016 5
Operating GroupAdjusted Net Income – LTM1,2
BMO CM21%
BMO WM16%
U.S. P&C20%
Canadian P&C43%
• Personal and Commercial Banking earnings up 14% Y/Y
– Canadian P&C net income up 8% with third consecutive quarter of positive operating leverage2
– U.S. P&C net income2 up 27% (21% in USD) with 3.7% positive operating leverage2 in USD
• BMO Capital Markets pre-provision pre-tax earnings2 up 10% with 3% positive operating leverage
• BMO Wealth Management results reflect a write-down of an equity investment and lower year-over-year equity markets
Operating Group Performance Results reflect the benefits of BMO’s diversified business mix by both customer and geography
1 Adjusted measures are non-GAAP measures, see slide 2 for more information 2 Reported net income by operating group (excludes Corporate Services) Canadian P&C 44%, U.S. P&C 19%, BMO WM 15%, BMO CM 22%; by geography last twelve months (LTM): Canada 72%, U.S. 23%, Other 5%.
On a reported basis: Canadian P&C operating leverage was positive for second consecutive quarter; U.S. P&C net income up 29% (23% in USD) with positive operating leverage of 4.5% in USD; BMO Capital Markets pre-provision pre-tax earnings up 11%. See slide 25 for adjustments to reported results
Adjusted Net Income by Geography - LTM1,2
Canada71%
U.S.23%
Other6%

6Strategic Highlights May 25, 2016

Financial Results Month xx, 2015 7
Financial ResultsFor the Quarter Ended April 30, 2016
May 25, 2016
Tom FlynnChief Financial Officer
16Q2

Financial Results May 25, 2016 8
Q2 2016 - Financial HighlightsGood operating results with adjusted net income of $1.2B and EPS of $1.73
• Adjusted EPS up 1% Y/Y, or 8% excluding a $0.12 ($79MM after-tax) write-down of an investment
• Net revenue up 4% Y/Y, or 5% Y/Y in CCY1, excluding the write-down
• Adjusted expenses up 5% Y/Y or 3% in CCY1
• Adjusted2 net operating leverage positive 1.7% for Q2 and 2.4% YTD, both in CCY1 and excluding the write-down
• PCL of $201MM, up $40MM Y/Y
• ROE of 12.1%, with book value per share up 8% Y/Y. ROTCE4
of 14.8%
• Reported results include a $132MM after-tax restructuring charge as we accelerate the use of technology to enhance customer experience and focus on driving operational efficiencies
Adjusted ($MM)2 Q2 15 Q1 16 Q2 16
Net Revenue3 4,502 4,793 4,694
PCL 161 183 201
Expense 2,912 3,204 3,060
Net Income 1,146 1,178 1,152
Reported Net Income 999 1,068 973
Diluted EPS ($) 1.71 1.75 1.73
ROE (%) 13.2 12.1 12.1
Common Equity Tier 1 (CET1) Ratio (%) 10.2 10.1 10.0
1 Constant currency (CCY) refers to impact of CAD/US exchange rate movements on the U.S. segment only and is a non-GAAP measure. For more information see the Foreign Exchange section on page 7 of Bank of Montreal’s Second Quarter 2016 Report to Shareholders
2 See slide 25 for adjustments to reported results. Adjusted measures are non-GAAP measures, see slide 2 for more information. Reported results: Net revenue – Q2’16 $4,694MM, Q1’16 $4,709MM, Q2’15 $4,502MM; Expenses – Q2’16 $3,312MM, Q1’16 $3,270MM, Q2’15 $3,112MM; EPS – diluted: Q2’16 $1.45, Q1’16 $1.58, Q2’15 $1.49; ROE – Q2’16 10.1%, Q1’16 10.9%, Q2’15 11.4%; reported PCL same as adjusted amounts. Reported net operating leverage of (2.2)% for Q2 and (0.9)% YTD
3 Net revenue is net of insurance claims, commissions and changes in policy benefit liabilities (CCPB). Reported gross revenue: Q2’16 $5,101MM; Q1’16 $5,075MM, Q2’15 $4,526MM 4 Return on tangible common equity (ROTCE) = (Annualized Net Income available to Common Shareholders) / (Average Common shareholders equity less Goodwill and acquisition-related intangibles net of associated
deferred tax liabilities)

Financial Results May 25, 2016 9
10.2 10.4 10.7 10.1 10.0
Q2'15 Q3'15 Q4'15 Q1'16 Q2'16
Capital & Risk Weighted AssetsCET1 Ratio steady at 10.0%
Common Equity Tier 1 Ratio (%)
231 240 239265 256
Q2'15 Q3'15 Q4'15 Q1'16 Q2'16
Risk Weighted Assets ($B)
• Common Equity Tier 1 Ratio of 10.0%, ~10 bps lower than Q1’16
– Lower CET1 capital from AOCI, partially offset by lower capital deductions and retained earnings growth, which was lower than normal given the restructuring charge
– Lower RWA of ~$9B primarily due to FX movement ($15B), which is largely offset through AOCI, and model changes ($1B), partially offset by business growth ($5B) and changes in book quality ($2B)
• Q1 reduction in CET1 Ratio reflects impact of BMO Transportation Finance acquisition
• Common dividend increased 2 cents to $0.86 per share. Attractive dividend yield of ~4%
Financial Results May 25, 2016 10
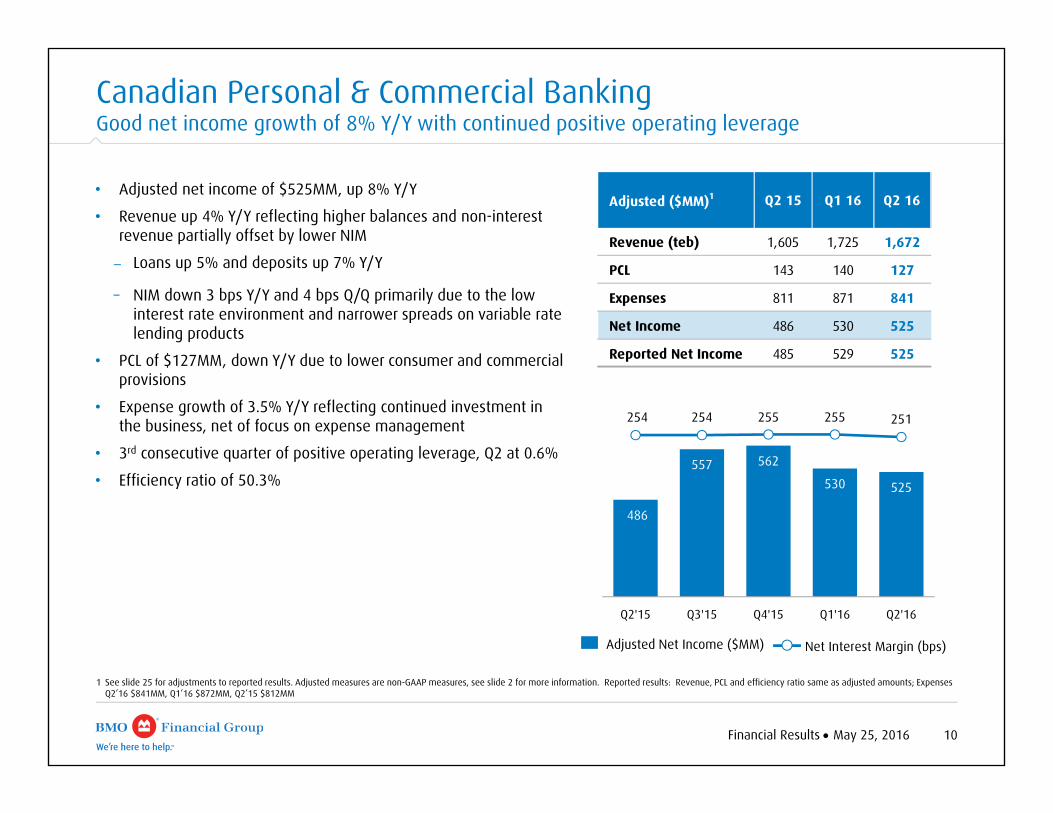
Canadian Personal & Commercial BankingGood net income growth of 8% Y/Y with continued positive operating leverage
486
557 562
530 525
254 254 255 255 251
Q2'15 Q3'15 Q4'15 Q1'16 Q2'16
Adjusted Net Income ($MM) Net Interest Margin (bps)
• Adjusted net income of $525MM, up 8% Y/Y
• Revenue up 4% Y/Y reflecting higher balances and non-interest revenue partially offset by lower NIM
– Loans up 5% and deposits up 7% Y/Y
– NIM down 3 bps Y/Y and 4 bps Q/Q primarily due to the low interest rate environment and narrower spreads on variable rate lending products
• PCL of $127MM, down Y/Y due to lower consumer and commercial provisions
• Expense growth of 3.5% Y/Y reflecting continued investment in the business, net of focus on expense management
• 3rd consecutive quarter of positive operating leverage, Q2 at 0.6%
• Efficiency ratio of 50.3%
1 See slide 25 for adjustments to reported results. Adjusted measures are non-GAAP measures, see slide 2 for more information. Reported results: Revenue, PCL and efficiency ratio same as adjusted amounts; Expenses Q2’16 $841MM, Q1’16 $872MM, Q2’15 $812MM
Adjusted ($MM)1 Q2 15 Q1 16 Q2 16
Revenue (teb) 1,605 1,725 1,672
PCL 143 140 127
Expenses 811 871 841
Net Income 486 530 525
Reported Net Income 485 529 525

Financial Results May 25, 2016 11
Adjusted Net Income (US$MM)
U.S. Personal & Commercial BankingStrong growth with adjusted net income up 27% Y/Y or 21% in USD
177 186 168 191 216
346 345 347 363 371
Q2'15 Q3'15 Q4'15 Q1'16 Q2'16
• Adjusted1 net income of $279MM, up 27% Y/Y. Figures that follow are in U.S. dollars
• Adjusted net income up 21% Y/Y
• BMO TF represented ~15% of Q2’16 revenue and adjusted expenses
• Revenue up 24% Y/Y driven by BMO TF, higher loan and deposit volumes and higher NIM
• Average loans up 16% and deposits up 6% Y/Y
– NIM up 8 bps Q/Q driven by increased deposit spreads and the full quarter impact of BMO TF
• PCL up from prior year due to lower recoveries and BMO TF
• Expenses up 20% Y/Y primarily due to the addition of the BMO TF business
• Efficiency ratio of 62.0%1 improved 190 bps Y/Y
• Operating leverage of 3.7%
1 See slide 25 for adjustments to reported results. Adjusted measures are non-GAAP measures, see slide 2 for more information. Reported results: revenue and PCL same as adjusted amounts; Expenses (US$): Q2’16 $558MM, Q1’16 $531MM, Q2’15 $467MM; Efficiency ratio: Q2’16 63.5%, Q1’16 64.1%, Q2’15 65.9%; net income C$267MM, up 29%. Beginning in the first quarter of 2016, the reduction in the credit mark that is reflected in net interest income and the provision for credit losses on the purchased performing portfolio are being recognized in U.S. P&C, consistent with the accounting for the acquisition of BMO TF. Results for prior periods have not been reclassified
Net Interest Margin (bps)
Adjusted (US$MM)1 Q2 15 Q1 16 Q2 16
Revenue (teb) 708 828 879
PCL 14 47 39
Expenses 453 518 545
Net Income 177 191 216
Reported Net Income 167 182 206

Financial Results May 25, 2016 12
296 273 242 260 291
17.9 15.6 12.5 13.2 14.7
Q2'15 Q3'15 Q4'15 Q1'16 Q2'16
Adjusted Net Income ($MM) Return on Equity(%)
BMO Capital MarketsGood results in an improving market environment; positive operating leverage of 3.0%
• Adjusted net income down 2% Y/Y reflecting higher PCLs; PPPT1 up 10% Y/Y
• Revenue up 6% Y/Y or 4% in CCY2:
– Trading Products benefited from higher client activity
– Investment and Corporate Banking decreased primarily from lower net securities gains, partially offset by higher corporate banking related revenue
• Expenses up 3% or 1% Y/Y in CCY2
• PCL up Y/Y largely due to higher resource-related provisions
• Efficiency ratio of 59.2% improved 170 bps Y/Y
• 3rd consecutive quarter of positive operating leverage, Q2 at 3.0%
1 PPPT refers to pre-provision, pre-tax profit contribution, and is the difference between adjusted revenue and adjusted expenses2 CCY/Constant Currency refers to impact of CAD/US exchange rate movements on the U.S. segment only and is a non-GAAP measure. For more information see the Foreign Exchange section on page 7 of Bank of
Montreal’s Second Quarter 2016 Report to Shareholders3 See slide 25 for adjustments to reported results. Adjusted measures are non-GAAP measures, see slide 2 for more information. Reported results: Revenue, PCL and efficiency ratio same as adjusted amounts; Expenses:
Q2’16 $633MM, Q1’16 $661MM, Q2’15 $616MM
Adjusted ($MM)3 Q2 15 Q1 16 Q2 16
Trading Products Revenue 660 589 730
I&CB Revenue 351 431 340
Revenue (teb) 1,011 1,020 1,070
PCL 5 8 44
Expenses 616 661 633
Net Income 296 260 291
Reported Net Income 296 260 291

Financial Results May 25, 2016 13
BMO Wealth ManagementSolid underlying performance with impacts from write-down and lower Y/Y equity markets
• Adjusted net income of $158MM impacted by a $79MM after-tax write-down of an investment
• Figures that follow exclude the write-down:
- Traditional Wealth underlying results of $169MM were unchanged Y/Y, as business growth was offset by the impact of equity markets; Q/Q up due to lower expenses
- Insurance earnings down Y/Y as Q2’15 was above trend
- Net revenue down Y/Y driven by equity markets and divestitures including the sale of our U.S. Retirement Services business in the prior year, partially offset by business growth
• Expenses down Y/Y mainly due to the sale of the business and lower revenue-based costs
• AUM/AUA down Y/Y mainly due to market depreciation partially offset by favourable FX movements
1 See slide 25 for adjustments to reported results. Adjusted measures are non-GAAP measures, see slide 2 for more information. Reported results: Revenue and PCL same as adjusted amounts; Expenses: Q2’16 $816MM, Q1’16 $877MM, Q2’15 $836MM; Traditional wealth net income Q2’16 $66MM, Q1’16 $126MM, Q4’15 $186MM, Q3’15 $154MM, Q2’15 $142MM; Insurance reported net income same as adjusted.
2 For purposes of this slide net revenue is net of insurance claims, commissions and changes in policy benefit liabilities (CCPB). Gross revenue: Q2’16 $1,397MM; Q1’16 $1,437MM, Q2’15 $1,188MM3 Excludes $79MM after-tax impact of write-down of an investment. Reported net income of $213MM excluding the write-down
Adjusted1 ($MM) Q2 15 Q1 16 Q2 16
Net Revenue2 1,164 1,071 990
PCL 1 2 2
Expenses 803 841 787
Net Income 265 176 158
Reported Net Income 238 148 134
AUM/AUA ($B) 833 864 817
96 56 57 22
68
169 177 214
154 90
79
Q2'15 Q3'15 Q4'15 Q1'16 Q2'16
265233
271
176
2373
Insurance Adjusted1 Net Income ($MM)
Traditional WealthAdjusted1 Net Income ($MM)
After-tax Write-down of Investment ($MM)
158

Financial Results May 25, 2016 14
Corporate Services
• Adjusted net loss of $101MM improved from a net loss of $121MM in the prior year mainly due to below trend expenses and higher credit recoveries
• The current quarter reported results included a $132MM after-tax restructuring charge
• Group teb offset is eliminated in taxes with no impact on net income
1 See slide 25 for adjustments to reported results. Adjusted measures are non-GAAP measures, see slide 2 for more information. Reported results: Expenses Q2’16 $295MM, Q1’16 $130MM, Q2’15 $269MM; Total Revenue Q2’16 $(182)MM, Q1’16 $(246)MM, Q2’15 $(157)MM
2 Operating group revenue, income taxes and net interest margin are stated on a taxable equivalent basis (teb). This teb adjustment is offset in Corporate Services, and total BMO revenue, income taxes and net interest margin are stated on a GAAP basis
3 Effective November 1, 2015 Purchased Portfolio revenue and PCL are reflected in U.S. P&C
Adjusted ($MM)1,2,3 Q2 15 Q1 16 Q2 16
Revenue (57) (2) (62)
Group teb offset2 (100) (160) (120)
Total Revenue (teb)2 (157) (162) (182)
PCL (recovery) (6) (32) (23)
Expenses 120 119 89
Net Loss (121) (52) (101)
Reported Net Loss (227) (120) (244)

Financial Results Month xx, 2015 1516Q2
Risk ReviewFor the Quarter Ended April 30, 2016
May 25, 2016
Surjit RajpalChief Risk Officer

Risk Review May 25, 2016 16
161 160 128183 201
Q2'15 Q3'15 Q4'15 Q1'16 Q2'16
Quarterly Specific PCL ($MM)
• PCL ratio at 23 bps, up 2 bps from prior quarter due to higher resource-related provisions in BMO Capital Markets
PCL By Operating Group ($MM) Q2 15 Q1 161 Q2 161
Consumer – Canadian P&C 114 113 105
Commercial – Canadian P&C 29 27 22
Total Canadian P&C 143 140 127
Consumer – U.S. P&C1 24 48 35
Commercial – U.S. P&C1 (6) 17 16
Total U.S. P&C 18 65 51
Wealth Management 1 2 2
Capital Markets 5 8 44
Corporate Services1 (6) (32) (23)
Specific PCL 161 183 201
Change in Collective Allowance - - -
Total PCL 161 183 201
PCL in bps 20 21 23
Provision for Credit Losses (PCL)
1 Beginning in the first quarter of 2016 the provision for credit losses on the purchased performing portfolio is being recognized in U.S. P&C, consistent with the accounting for the acquisition of BMO TF. Results for prior periods have not been reclassified. Recoveries or provisions on the 2011 purchased credit impaired portfolio continue to be recognized in Corporate Services. Purchased loan accounting impacts related to BMO TF are recognized in U.S. P&C

Risk Review May 25, 2016 17
454 559 484 594 718
Q2'15 Q3'15 Q4'15 Q1'16 Q2'16
Formations ($MM)
2,047 2,165 1,959 2,158 2,196
Q2'15 Q3'15 Q4'15 Q1'16 Q2'16
Gross Impaired Loans ($MM)
1 Commercial & Corporate includes ~$1MM GIL from Other Countries2 Other Commercial & Corporate includes industry segments that are each <1% of total GIL
• GIL and impaired formations increased this quarter mainly due to Oil & Gas
By Industry($MM)
Formations Gross Impaired LoansCanada & Other U.S. Total Canada
& Other1 U.S. Total
Consumer 155 104 259 358 555 913
Oil & Gas 41 245 286 87 323 410
Agriculture 16 9 25 72 93 165
Manufacturing 2 68 70 19 131 150
Service Industries 5 4 9 38 73 111
Commercial Real Estate 16 2 18 66 32 98
Transportation 1 24 25 6 58 64
Construction (non-real estate) 1 1 2 15 44 59
Financial Institutions 5 0 5 8 49 57
Wholesale Trade 1 0 1 6 35 41
Mining 0 0 0 4 36 40
Retail Trade 8 3 11 19 11 30
Other Commercial & Corporate2 2 5 7 21 37 58
Commercial & Corporate 98 361 459 361 922 1,283
Total Bank 253 465 718 719 1,477 2,196
Gross Impaired Loans (GIL) and Formations

Risk Review May 25, 2016 18
Oil and Gas Balances – By Sector ($B)
Oil and Gas and Alberta Consumer Portfolios
Oil and Gas – Corporate/Commercial
• Oil and Gas loans of $7.3B; 2% of total bank loans with close to half investment grade
• $7.9B in undrawn exposure1, of which more than half is investment grade
Consumer Exposure in Alberta
• Alberta consumer loans represent 6% of total bank loans of which over 80% are Real Estate Secured (RESL)
– ~60% of Alberta RESL is insured
– 57% LTV on uninsured RESL
$5.069%
$0.22%
$1.318%
$0.811%
Exploration & DevelopmentManufacturing & RefiningPipelinesServices
1 Credit exposures on committed undrawn amounts of loans. See Credit Risk Exposure by Industry table on page 43 of Supplementary Financial Information

Risk Review May 25, 2016 19
1 Commercial & Corporate includes ~$10.9B from Other Countries2 Except for Mining, Other Commercial & Corporate includes industry segments that are each <2% of total loans
155.6
22.861.8 70.0
24.6 20.9
Canada & Other Countries U.S.
Loans by Geography and Operating Group ($B)
P&C/Wealth Management - ConsumerP&C/Wealth Management - CommercialBMO Capital Markets
• Loans are well diversified by geography and industry
Gross Loans & Acceptances By Industry($B)
Canada & Other1 U.S. Total % of Total
Residential Mortgages 98.3 8.3 106.6 30%
Personal Lending 49.9 14.0 63.9 18%
Cards 7.4 0.5 7.9 2%
Total Consumer 155.6 22.8 178.4 50%
Financial Institutions 14.1 20.3 34.4 10%
Service Industries 14.0 18.2 32.2 9%
Commercial Real Estate 14.3 8.7 23.0 6%
Manufacturing 6.0 11.4 17.4 5%
Retail Trade 9.2 7.6 16.8 5%
Wholesale Trade 4.1 6.7 10.8 3%
Agriculture 8.3 2.2 10.5 3%
Transportation 1.8 8.1 9.9 3%
Oil & Gas 4.5 2.8 7.3 2%
Mining 1.2 0.4 1.6 0%
Other Commercial & Corporate2 8.9 4.5 13.4 4%
Total Commercial & Corporate 86.4 90.9 177.3 50%
Total Loans 242.0 113.7 355.7 100%
Loan Portfolio Overview

Risk Review May 25, 2016 20
Residential Mortgages by Region Insured Uninsured Total % of Total
($B)
Atlantic 3.7 1.7 5.4 5%
Quebec 9.1 5.3 14.4 15%
Ontario 24.2 16.5 40.7 41%
Alberta 11.3 4.5 15.8 16%
British Columbia 7.6 10.7 18.3 19%
All Other Canada 2.4 1.3 3.7 4%
Total Canada 58.3 40.0 98.3 100%
Canadian Residential Mortgages
• Total Canadian residential mortgage portfolio at $98.3B or 43% of Canadian gross loans and acceptances─ 59% of the portfolio is insured
─ Loan-to-value (LTV)1 on the uninsured portfolio is 57%2
─ 71% of the portfolio has an effective remaining amortization of 25 years or less
─ Loss rates for the trailing 4 quarter period were less than 1 bp
─ 90 day delinquency rate remains good at 24 bps
─ Condo Mortgage portfolio is $14.2B with 51% insured
1 LTV is the ratio of outstanding mortgage balance to the original property value indexed using Teranet data. Portfolio LTV is the combination of each individual mortgage LTV weighted by the mortgage balance
2 To facilitate comparisons, the equivalent simple average LTV on uninsured mortgages in Q2‘16 was 52%

Risk Review May 25, 2016 21
Trading Revenue vs. VaR
(25)
(5)
15
35
Feb
02
Feb
09
Feb
16
Feb
23
Mar
01
Mar
08
Mar
15
Mar
22
Mar
30
Apr 0
7
Apr 1
4
Apr 2
1
Apr 2
8
February 1, 2016 to April 29, 2016 (in MM's and on a Pre-Tax Basis)
Daily Revenue Total Trading VaR

Financial Results Month xx, 2015 22
Appendix

Financial Results May 25, 2016 23
47.7 51.9 50.4
83.5 87.6 89.7
Q2'15 Q1'16 Q2'16
Average Loans & Acceptances ($B) Average Deposits ($B)
• Loan growth of 5% Y/Y
– Mortgages up 5%
– Consumer loan balances up 2%
– Commercial loan balances1 up 10%
Canadian Personal and Commercial Banking - Balances
• Deposit growth of 7% Y/Y
– Personal deposit balances up 7% reflecting strong chequing account growth
– Commercial deposit balances up 6%
131.2 139.5
1 Commercial lending growth excludes commercial cards. Commercial cards balances approximately 8% of total credit card portfolio in Q2’16, and approximately 7% in Q1’16 and Q2’15
140.1
193.4201.7 203.6
52.6 55.8 57.8
8.4 8.7 8.4
43.3 43.9 44.0
89.1 93.3 93.4
Q2'15 Q1'16 Q2'16Consumer Loans
Credit Cards Commercial Loans & Acceptances
Residential Mortgages Personal Deposits Commercial Deposits

Financial Results May 25, 2016 24
U.S. Personal & Commercial Banking – Balances
35.3 42.6 47.5
2.9
2.32.2
6.86.4
6.04.9
5.15.0
11.010.3
10.15.15.4
5.4
Q2'15 Q1'16 Q2'16
66.0*72.1*
76.2*Average Loans & Acceptances (US$B)
37.4 38.9 40.1
24.2 26.0 25.5
Q2'15 Q1'16 Q2'16
61.664.9 65.6
Average Deposits (US$B)
• Commercial deposit balances up 6% Y/Y
• Personal Deposit balances up 7% Y/Y
– Chequing balance growth of 6% Y/Y
• Commercial loans up 13% Y/Y excluding BMO TF
• Serviced mortgage portfolio up 6% Y/Y; mortgage portfolio down 8% Y/Y
• Business Banking up 2% Y/Y
• Indirect Auto down 12% Y/Y due to strategic decision to reduce portfolio originations
• BMO TF added $7.5B of average loans in Q2`16 ($4.9B in Q1`16)
* Total includes Serviced Mortgages which are off-balance sheet1 Mortgages include Wealth Management Mortgages (Q2’16 $1.8B, Q1’16 $1.8B, Q2’15 $1.6B) and Home Equity (Q2’16 $3.8B, Q1’16 $3.9B, Q2’15 $4.3B)2 Other loans include non-strategic portfolios such as wholesale mortgages, purchased home equity, and certain small business CRE, as well as credit card balances, other personal loans and credit mark on certain
purchased performing loans 3 Business Banking includes Small Business
Commercial Loans
Personal Loans
Indirect Auto
Serviced Mortgages Mortgages (1)
Other Loans (2) Commercial
Business Banking (3) Commercial Deposits Personal Deposits

Financial Results May 25, 2016 25
Adjusting Items
Adjusting1 items – Pre-tax ($MM) Q2 15 Q1 16 Q2 16
Amortization of acquisition-related intangible assets2 (40) (43) (40)
Acquisition integration costs2 (11) (22) (24)
Cumulative accounting adjustment3 - (85) -
Restructuring costs4 (149) - (188)
Adjusting items included in reported pre-tax income (200) (150) (252)
Adjusting1 items – After-tax ($MM) Q2 15 Q1 16 Q2 16
Amortization of acquisition-related intangible assets2 (31) (33) (31)
Acquisition integration costs2 (10) (15) (16)
Cumulative accounting adjustment3 - (62) -
Restructuring costs4 (106) - (132)
Adjusting items included in reported net income after tax (147) (110) (179)
Impact on EPS ($) (0.22) (0.17) (0.28)
1 Adjusted measures are non-GAAP measures, see slide 2 for more information 2 Amortization of acquisition-related intangible assets reflected across the Operating Groups. Acquisition integration costs related to F&C are charged to Wealth Management. Acquisition integration costs related to
BMO TF are charged to Corporate Services since the acquisition impacts both Canadian and U.S. P&C businesses. Acquisition integration costs are primarily recorded in non-interest expense3 Cumulative accounting adjustment recognized in other non-interest revenue, related to foreign currency translation, largely impacting prior periods4 Restructuring charge in Q2’16, as we accelerate the use of technology to enhance customer experience and focus on driving operational efficiencies. Restructuring charge in Q2’15, primarily due to restructuring
to drive operational efficiencies

Financial Results May 25, 2016 26
Investor Relations Contact Information
Fax: 416.867.3367bmo.com/investorrelationsE-mail: [email protected]
LISA HOFSTATTERManaging Director, Investor [email protected]
CHRISTINE VIAUDirector, Investor [email protected]