ceo reputation and stock-based compensation - olin business school
TRANSCRIPT
Journal of Financial Economics 68 (2003) 233–262
CEO reputation and stock-based compensation$
Todd T. Milbourn*
John M. Olin School of Business, Washington University, St. Louis, MO 63130, USA
Received 20 January 2000; received in revised form 13 February 2002
Abstract
I develop a theory of stock-based compensation contracts for the chief executive officers
(CEOs) of firms and confront the theoretical predictions with recent CEO compensation data.
The model characterizes the optimal contract for a CEO whose reputation evolves as signals of
the executive’s ability are observed by shareholders. Using various proxies for CEO
reputation, I show a positive and economically meaningful relationship between stock-based
pay-sensitivities and CEO reputation. The findings are robust to controls for CEO age, firm
size, the dollar variability of the stock returns, and industry effects.
r 2003 Elsevier Science B.V. All rights reserved.
JEL classificaion: D8; G3; J3
Keywords: CEO compensation; Reputation; Stock-based pay
1. Introduction
The question of efficiency underlying the compensation packages awarded to thechief executive officers (CEOs) of publicly traded firms is one that has received great
$For their helpful comments, I would like to thank Arnoud Boot, John Boquist, Bart Hamilton, Joe
Haubrich, Craig Holden, Kevin J. Murphy, Canice Prendergast, Raghu Rajan, Patty Wilson, and
especially an anonymous referee, Jeff Bacidore, Gerald Garvey, Bill Schwert (editor), and Anjan Thakor. I
also thank seminar participants at Boston College, Indiana University, London Business School,
Michigan State University, UCLA, University of Georgia, University of Miami, University of Michigan,
University of Minnesota, University of Missouri, UMSL, University of North Carolina, University of
Pittsburgh, University of Texas, University of Western Ontario, York University, and participants at the
1996 WFA meeting, 1996 EFA meeting, and the 1997 FMA International meeting for their comments on
an earlier version of this paper.
*Tel.: 314-935-6392; fax: 314-935-6359.
E-mail address: [email protected] (T.T. Milbourn).
0304-405X/03/$ - see front matter r 2003 Elsevier Science B.V. All rights reserved.
doi:10.1016/S0304-405X(03)00066-7
attention over the years. Much of this literature owes its origin to the seminal workof Jensen and Murphy (1990). They were among the first to examine the agency-theoretic prediction that CEOs are only motivated to act in their shareholders’ bestinterest if they are offered incentive contracts that ‘‘pay for performance.’’ Using alarge sample of compensation contracts, Jensen and Murphy show a statisticallypositive, but small, average relationship between CEO compensation and firmperformance. They find that the average CEO’s firm-related wealth changes only$3.25 for every $1,000 change in shareholder wealth.Hall and Liebman (1998) construct a highly comprehensive sample of more recent
CEO pay packages, including executive shareholdings and stock option grants. Withthese data, they show an average pay-for-performance sensitivity of $25.11 for every$1,000 change in shareholder wealth, an average nearly eight times greater than thatof Jensen and Murphy (1990). Arguably more important is their evidence ofenormous cross-sectional variation in individual pay-for-performance sensitivitiesunderlying this higher average sensitivity. What could explain this incredible richnessin the cross-section of CEO compensation contracts? In particular, what empiricalcontrol variables would help explain this heterogeneity?In this paper, I attempt to add to our understanding of the heterogeneity in stock-
based compensation contracts by developing a theory of CEO compensation andbringing its prediction to the data. Naturally, this work is partially motivated byJensen and Murphy (1990). However, I specifically focus, both theoretically andempirically, on the cross-sectional variation in CEO pay-for-performance sensitiv-ities when shareholders can only write performance contracts on the firm’s stockprice. While other performance measures might also be important, attempts tounderstand the findings of Jensen and Murphy (1990) and Hall and Liebman (1998)are necessarily tied to stock-based compensation. Furthermore, by focussing solelyon the sensitivity of compensation to the firm’s stock price, I can address thequestion of what makes a firm’s stock price a more effective contracting tool in oneenvironment over another.In my model, the effectiveness of stock-based pay depends directly on its
informativeness of the CEO’s contributions, which is affected in equilibrium by hisperceived ability, or reputation. Therefore, the optimal stock-based contract dependson the CEO’s reputation at the time of contracting, which I find to be stronglysupported by the data using a host of empirical proxies for CEO reputation. Yet, inboth the theoretical and empirical environment, a CEO’s true underlying ability isunobservable. Thus, market participants form beliefs over CEO ability and updatethem according to Bayes rule as new information is observed. I define a CEO’sreputation as this Bayesian assessment of ability.The model I develop is one in which shareholders initially have a CEO of
unknown ability managing their firm. The firm generates a single, noisy, terminalcash flow that depends on who is the CEO in place at the end of the game. The modelcharacterizes the optimal (second-best) compensation contract offered to theincumbent CEO. Critical to the model is the feature that the firm has an opportunityto replace the incumbent CEO before the end of the game, and this has directimplications for the optimal contract.
T.T. Milbourn / Journal of Financial Economics 68 (2003) 233–262234
In the model, the stock price is realized after the contract is offered to the CEO,but before the date at which the firm will make its retention/dismissal decision.Given the fact that the stock price represents the expected cash flow that will beearned in the future, the possibility that the CEO will be fired and replaced with arandomly drawn CEO from the labor pool affects the stock price. The reason is thatthe firm’s terminal cash flow depends on the ability of the firm’s CEO in place at theend of the game. Therefore, the stock price naturally reflects the probability that theincumbent CEO will be fired and replaced in the future. This is where perceptions ofCEO ability (interpreted as a CEO’s reputation) play an important role. Thelikelihood that the CEO will be retained in the future is increasing in the assessmentof his ability at the time the compensation contract is offered. For higher estimates ofCEO ability, there is a greater likelihood that the CEO will be retained until the endof the game. The stock price reflects this fact and thereby offers a more informativecontracting mechanism. On the other hand, if the initial assessment of the incumbentCEO’s ability is quite low, the likelihood of ultimately being retained in the future isalso low. The stock price again reflects this fact and consequently puts more weighton the expected contribution to be made by the replacement CEO, as opposed to theincumbent CEO. This reduces the relative informativeness of stock price as ameasure of the incumbent’s contribution.The model therefore predicts that the optimal stock-based pay sensitivity is
increasing in the a priori reputational assessment of the CEO. As the assessment ofthe incumbent’s ability increases, the relative weight that the stock price puts on theincumbent CEO’s contribution increases and the optimal contract can be made moresensitive to the firm’s stock price. Analogously, as the incumbent CEO’s reputationfalls, the stock price more heavily weights the value of a potential replacement,thereby minimizing its sensitivity to the incumbent CEO’s effort choices. Given thislack of responsiveness, the reliance on stock-based compensation is optimallysmaller for CEOs with lower reputations.I confront this prediction with CEO compensation data drawn from Compustat’s
ExecuComp for the years 1993 to 1998. Similar to Jensen and Murphy (1990), Iestimate stock-based pay sensitivities by the empirical relationship between changesin a CEO’s firm-related wealth and changes in his shareholders’ wealth. The changein a CEO’s firm-related wealth includes yearly compensation flows (salary, bonus,stock option grants, and so on), as well as the change in the value of the stock andstock options held by the CEO during the year. Changes in shareholder wealth areestimated as the dollar return to shareholders each year. One way in which themethodology employed in this paper differs from that of Jensen and Murphy (1990)is that I rely on median regressions in place of ordinary least squares to minimize theeffects of outliers. I also include a variety of executive- and firm-specific controlsincluding CEO age, firm size, the variability of shareholder dollar returns, andindustry effects. The empirical findings on the positive relationship between CEOreputation and pay sensitivities are robust to all of these controls.To examine the model’s claim that the heterogeneity in empirically observed,
stock-based pay sensitivities can be (at least partially) explained by a CEO’sreputation at the time compensation contracts are set, I collect several empirical
T.T. Milbourn / Journal of Financial Economics 68 (2003) 233–262 235
proxies of CEO reputation. In line with the model, the proxies are observable to themarket and include:
(i) CEO tenure,(ii) the number of business-related articles containing the CEO’s name as returned
by a search of the Dow Jones New Retrieval Service,(iii) being appointed CEO from outside of the firm, and(iv) industry-adjusted firm performance during the CEO’s tenure.
I argue that each of these is positively related to the market’s perception of theCEO’s ability. For instance, a longer CEO tenure implies that the firm’s board hashistorically been inclined to retain this executive.1 More reputable CEOs should alsofind their names in the business press more often than those of lower perceivedabilities. The third proxy relies on the idea that the perceived hurdle for becoming aCEO as an outsider is higher than for an insider who already possesses potentiallyvaluable firm-specific knowledge. Lastly, generating favorable performance (relativeto the firm’s industry) while at the CEO helm should be associated with a higherreputation. A full discussion of the economic motivation underlying the choice ofeach of these proxies is given in Section 3.I find that the data strongly support the model’s prediction. The empirical proxies
for CEO reputation are all positively associated with stock-based pay sensitivities inboth a statistically and economically significant manner. For example, if CEOreputation is proxied by CEO tenure and the number of business articles in which theCEO’s name appears, the range of pay sensitivities not explained by CEO age, firmsize, or industry effects is $9.03 per $1, 000 change in shareholder wealth. To put thisestimate in economic perspective, firm size alone explains a range of pay sensitivitiesof approximately $20. The estimates underlying this range are as follows. For amedian-aged CEO in a median-sized firm with the shortest CEO tenure and thefewest number of name-appearing articles, a compensation contract awards $8.76per $1,000 change in shareholder wealth. However, if this same size firm employed asimilar-aged CEO with the longest tenure and the most name-appearing businesspublications, the contract awards $17.79 per $1,000 change in shareholder wealth.2
Completely analogous results are shown when the other measures of reputationare included. Thus, given these empirical results, I conclude that CEO reputation (asproxied by several, observable control variables) is an important determinant inexplaining the heterogeneity of observed stock-based pay sensitivities awarded toCEOs.The remainder of the paper is organized as follows. Section 2 develops the
theoretical model and characterizes the optimal stock-based compensation contract.Section 3 describes the data employed in this paper, including the proxies for CEOreputation, and outlines the empirical methodology. Section 4 shows the empiricalfindings on the link between pay sensitivities and CEO reputation. Section 5
1Corporate founders have been removed from the sample.2As seen in Section 4, the range of the effect of CEO reputation on pay sensitivities is not affected by the
choice of CEO age or firm size. The choice of any CEO age or firm size simply allows for an estimate of the
overall pay sensitivities awarded CEOs with different reputations holding age and firm size fixed.
T.T. Milbourn / Journal of Financial Economics 68 (2003) 233–262236
concludes. The appendix includes detailed discussions on parts of the data collectionprocess.
2. The model
This is a model of the compensation design problem between a firm’s shareholdersand its CEO. Shareholders have the responsibility of hiring the firm’s CEO,designing a compensation plan for the position, and potentially firing and replacingthe CEO if performance is subpar. There is also an active financial market in whichthe claim on the firm’s cash flow is priced. The model characterizes how the optimalstock-based contract changes as a function of the CEO’s reputation and itsrelationship to the overall informativeness of the stock price.
2.1. Sequence of events
The model solves for a single-period compensation contract. However, there areseveral stages to the game. Each of these is described in detail and motivated below,but to fix ideas, the sequence of events can be summarized as follows:
1. At the start of the game, the firm has a CEO of unknown ability in place. Theestimate of the incumbent CEO’s ability is given by Z1, where Z1BNð%Z1;s
2Z1Þ: No
one, including the CEO, knows this ability.2. Shareholders offer a compensation contract to the CEO that is linear in thefirm’s stock price. Contracts take the form W=S+bP, where S represents thefixed salary, bA[0, 1] is the pay-for-performance sensitivity, and P is the firm’sstock price for its one outstanding share.
3. The CEO decides whether to accept the wage contract, and if he does, privatelychooses an effort level eA[0, N).
4. Stock market participants observe an informative, yet noncontractible signalabout the incumbent CEO’s effort choice. A stock price obtains that representsthe expected terminal cash flow for the firm based on this signal and a rationalconjecture regarding the retention of the incumbent CEO.
5. Shareholders observe a signal of the incumbent CEO’s ability, given by s=ZI+n,where ZI is the incumbent’s true ability and nBNð0;s2nÞ: The CEO is fired if theposterior assessment of his ability, conditional on the signal s (where theposterior is denoted Z2), falls below a cutoff ZC. If the incumbent CEO isdismissed, a replacement CEO is chosen at random, and the prior over hisability is Z0BNð%Z0;s
2Z0Þ: For simplicity, let %Z0 � 0:3
6. The terminal cash flow of the firm is realized and the game ends.
3The subscript 1 denotes an incumbent CEO at the start of the game. I use 1 since shareholders may
have observed some information over his ability. I let the subscript 2 denote the fact that at this stage more
information (s) has been observed about the incumbent’s ability. Lastly, I denote a randomly drawn
replacement CEO, for whom there is less information, with a subscript 0.
T.T. Milbourn / Journal of Financial Economics 68 (2003) 233–262 237
2.2. Agents and preferences
Risk-neutral shareholders own the firm. While these shareholders are interested inthe firm’s terminal cash flow, I assume that they act such that the stock price reflectsits expected value at all points in time. A natural way to motivate this is to assumethat a fraction of shareholders are forced to sell their claims for exogenous liquidityreasons. Henceforth, assume that shareholders maximize the expected value of theirshares in their compensation design decision.All CEOs are risk averse. Each has negative exponential utility given by
UðW ; eÞ ¼ �exp �r W �k
2e2
� �� �; ð1Þ
where W is the CEO’s total wage, e is the CEO’s effort choice, r is the coefficient ofrisk aversion, and k>0 is a constant reflecting the CEO’s aversion to effort.Reservation wages are not specified as I am not characterizing the total wage
contract, only the optimal sharing rule. The model, however, is directly amenable tosuch an exercise. What is implicit in the model is that firms prefer a more talentedCEO to a less talented one. This necessitates that the contribution to firm value froman increase in CEO ability is greater than the commensurate increase in the CEO’sreservation wage.
2.3. Signals, beliefs and retention policy
As noted in the sequence of events, shareholders observe a signal about the qualityof the incumbent CEO before the end of the game, offering the shareholdersan opportunity to fire and replace him. This signal, denoted s; is observed after
the market price of the firm is realized. The signal is noncontractible and givenby s ¼ ZI þ n; where ZI is the incumbent’s true ability and nBNð0;s2nÞ: Condi-tional on observing s, the updated estimate of the incumbent CEO’s ability is givenby
EðZjs; Z1Þ � Z2; ð2Þ
where Z2BNð½s2n %Z1 þ s2Z1s=½s2Z1þ s2n ; ½s
2n=½s
2Z1þ s2n s
2Z1Þ: Let %Z2 denote the mean of
the posterior estimate of the incumbent CEO’s ability. Observe thatVarðZ2ÞoVarðZ1Þ: That is, the variance of the estimate of a CEO’s ability diminishesover time. This relates to the Gibbons and Murphy (1992) tenure effect. As a CEOspends time on the job, the market learns about his ability and hence the variance ofhis estimated ability falls. The distinction between the role of tenure in reducing thevariance of the estimate of ability and its role as a proxy for reputation is discussedlater.After shareholders observe the signal
s ¼ ZI þ n ð3Þ
and update their beliefs surrounding the ability of the incumbent CEO, the CEO isfired and replaced with a random draw from the labor pool of CEOs if this estimate
T.T. Milbourn / Journal of Financial Economics 68 (2003) 233–262238
falls below a critical level. I denote this termination cutoff as ZC. This cutoff can bederived in a number of ways, and I do not restrict the firm to any specific firingpolicy. Naturally, shareholders should adopt a firing policy to maximize their wealthand this would imply that they consider firing the CEO whenever his estimatedability fell below the average ability of the labor pool (that is, when Z2o%Z0 � 0).However, there may be costs associated with firing a CEO. Moreover, the insideshareholders (or the board) can have other implicit ties to the CEO and be reluctantto dismiss him.4 To allow for a variety of dismissal policies, I simply specify that theCEO is fired if Z2 (the CEO’s perceived ability conditional on the signal s) falls belowZC, where ZCAR1:The efforts of the incumbent CEO are lost completely upon his dismissal, and I
assume that a newly appointed CEO doesn’t contribute effort. Therefore, areplacement’s contribution to the firm’s cash flow stems solely from his ability. Sincethe focus of this paper is on the design of the optimal contract for an incumbentCEO, I treat the replacement CEO exogenously. This assumption is innocuous.What is necessary for the results is that there is some part of the stock price thatreflects the contributions of the replacement CEO, rather than the incumbent. Thesecontributions could obviously include the replacement’s effort choice, but need notfor my purposes.Although the retention/dismissal decision is made on the basis of the signal s; the
wage contract is written prior to its realization. Hence, when shareholders design theCEO’s compensation, they must assess the expected probability that the CEO will befired in the future. Let 1� GðZ1Þ be defined as the expected probability (as of the startof the game) that a CEO with perceived ability of Z1 (reputation) will have anassessed ability after the signal s is observed that falls below the cutofor retention.That is, let
1� GðZ1Þ � E½PrðZ2oZCjZ1Þ: ð4Þ
Hence, G(Z1) represents the likelihood that a CEO that initially has a perceivedability of Z1 will be retained until the end of the game. Since the signal is normallydistributed, G(Z1) is monotonic in Z1: Therefore, the probability that a CEO isretained is strictly increasing in the CEO’s reputation at the start of the game. Thatis, G(Z1) is strictly increasing in the CEO’s perceived ability Z1.
2.4. Cash flows and stock price
Given the firm’s retention policy, there is a chance that either the incumbent CEOwill survive until the end of the game, or that he will be replaced before the end. If
4Hermalin and Weisbach (1998) provide a theory of the bargaining game between a board of directors
and the incumbent CEO. In their work, an important determinant to the board’s firing rule is its perceived
independence from the CEO (who may have appointed many of its members). Their result could certainly
impact the cutoff ZC. The firing threshold can also be time-varying. Berkovitch, Israel, and Spiegel (2000)show that the threshold below which an incumbent CEO would be fired is increasing over his tenure. The
intuition is that over time, a CEO loses his ‘‘option value’’ and thus his expected ability must be sufficiently
high to outweigh the option value on an untried, yet riskier replacement.
T.T. Milbourn / Journal of Financial Economics 68 (2003) 233–262 239
the CEO is retained until the end of the game, the firm’s terminal cash flow is
XI ¼ e þ ZI þ e; ð5Þ
where e is the incumbent CEO’s effort choice, ZI is the value of his true ability, andeBNð0; s2e Þ is noise. On the other hand, if the CEO is fired and replaced, the terminalcash flow is XR ¼ ZR þ e; where ZR denotes the true ability of the replacement CEOand e remains noise.The financial market consists of competitive risk-neutral traders that set the price
for the firm after observing a noncontractible signal of the incumbent CEO’s effortchoice. That is, the signal is a noisy estimate of XI�ZI, given by Y ¼ ½e þ e þ o;where oBNð0; s2oÞ and is independent of e. With the different potential cash flowrealizations that one could obtain, market participants compare the likelihood thatthe incumbent CEO will be retained until the end of the game to the chance that theCEO will be fired and replaced. The expected likelihood that the CEO will beretained is G(Z1). When he is retained (occurring when Z2XZC), price is equal to theconditional expected cash flow of the incumbent given the observed signal of theincumbent’s effort choice, Y. This expectation takes account of the fact that only aCEO with an ability of Z2XZC is retained. When the CEO is fired (occurring whenZ2oZC), the expected value of the firm is simply the expected contribution of thereplacement CEO who is randomly drawn from the CEO population. This value isgiven by %Z0 � 0: Lastly, to insure that the effects of this mixing can’t be perfectlyunwound, I assume that there is an independent noise term in the stock price, givenby xBNð0;s2xÞ Uncertainty over the firing cutoff level of Z
C would serve the samepurpose.Ignoring the CEO’s wage, price can then be written as
P ¼PrðCEO RetainedjZ1Þ E½XIjY ; Z1
þPrðCEO FiredjZ1Þ E½XR
" #þ x; ð6Þ
where E½XR ¼ %Z0 � 0: The expected value of the incumbent’s contribution is
E½XIjY ; Z1 ¼ ½½1� bE½XI � ZI þ bY þ E½ZjZ2 > ZC
¼ ½½1� b½e þ b½e þ eþ o þ %Z1 þ sZ1fðaÞ
1� FðaÞ
� �; ð7Þ
whereb ¼ Covðe þ e;Y Þ=VarðY Þ ¼ s2e=½s
2e þ s2oÞ; a ¼ ½ZC � %Z1=sZ1 ; ;Y ¼ e þ eþ o is the
signal observed by traders, and fð�Þ and Fð�Þ are the density and distributionfunctions of the standard normal distribution, respectively. Collecting these pieces,the stock price is
P ¼ GðZ1Þ ½½1� b½e þ b½e þ eþ o þ %Z1 þ sZ1fðaÞ
1� FðaÞ
� �� �þ x; ð8Þ
T.T. Milbourn / Journal of Financial Economics 68 (2003) 233–262240
and its variance is
varðPÞ ¼ ½GðZ1Þ2b2 s2e þ s2o
� �þ s2x: ð9Þ
2.5. CEO’s compensation contract
In characterizing the optimal contract, I begin with the CEO’s maximizationprogram. The CEO receives a stock-based wage contract of the form W ¼ S þ bP;where P is given by equation (8). Given normality and the CEO’s negativeexponential utility, the CEO will choose his effort to maximize the following:
maxeA½0;NÞ
bGðZ1Þe �k
2e2 �
r
2b2VarðPÞ: ð10Þ
The maximand reflects the manager’s certainty equivalent from choosing effort levele: The first order condition yields the manager’s choice of effort,
e� ¼bGðZ1Þ
k: ð11Þ
The CEO’s equilibrium effort choice is naturally increasing in his share of the stockprice, b: However, his equilibrium effort choice is also increasing in the likelihoodthat he will be retained until the end of the game. This is intuitive. If it is highlyunlikely that the CEO will be retained, the stock price is not very responsive to theCEO’s efforts since these are lost when he is fired. Thus, given that the CEO findseffort costly, he exerts less effort when his compensation is less responsive to it.
2.5.1. Optimal pay-for-performance sensitivity
With the CEO’s first-order condition in hand, the shareholders will choose thedesired effort level and the performance-sensitivity of the contract, b; to maximizethe price of the firm. The shareholders’ maximization program is
maxeA½0;NÞ;bA½0;1h i
GðZ1Þe �k
2e2 �
r
2b2VarðPÞ
s:t: e� ¼bGðZ1Þ
k:
ð12Þ
Observe the absence of the participation constraint in the maximization program.Given the CEO’s utility function, this constraint does not affect the optimal sharingrule b: This solution relies on the first-order approach, which owes its origins toHolmstrom (1979), Rogerson (1985), and Jewitt (1988). The solution to the programyields the following:
e� ¼GðZ1Þ
k½1þ rkVarðPÞ=½GðZ1Þ2
ð13Þ
b� ¼1
½1þ rkVarðPÞ=½GðZ1Þ2: ð14Þ
T.T. Milbourn / Journal of Financial Economics 68 (2003) 233–262 241
2.5.2. Theorem
Theorem 1. The optimal pay-for-performance sensitivity, b*, is increasing in the
reputational assessment of the CEO at the time the contract is written, given by Z1:
The derivation of Theorem 1 is straightforward. As we can see from Eq. (14), thepay-for-performance sensitivity of the wage contract is strictly increasing in theprobability that the CEO is retained until the end of the game, GðZ1Þ: Naturally, thelikelihood of being retained is strictly increasing in the perceived ability of theincumbent CEO when the contract is written ðZ1Þ: Interpreting this perception ofability as the CEO’s reputation, we have the result that b* is increasing in the CEO’sreputation at the time of contracting. The intuition is as follows. As the likelihoodthat the CEO will be in place to the end of the game increases, the forward-looking
stock price more heavily weights information related to the incumbent CEO. As thisweight increases, stock price informativeness with respect to the incumbent CEO’sactions goes up, increasing the weight the stock price receives in the optimalcontract. Thus, the model shows that involuntary CEO turnover affects the optimalcontract in a novel way.The result of Theorem 1 can be neatly distinguished from the pure tenure effect
of Gibbons and Murphy (1992). They show that the pay-for-performance sensitivityis increasing in the CEO’s tenure since the variance in the estimate of the CEO’sability declines over time. Their result would hold here as well. Observefrom equation (9) that the variance of price is strictly decreasing in the variance ofthe incumbent CEO’s estimated ability. In a repeated version of my model, thevariance surrounding ability would be less for an incumbent CEO than a randomlydrawn CEO. To see this, recall that within my model VarðZ2ÞoVarðZ1Þ: Therefore,since the optimal pay-for-performance sensitivity b* is decreasing in the variance ofprice, it is also decreasing in the variance of the CEO’s ability. The variance overability is reduced over the life of a CEO, and thus the performance sensitivity of theoptimal contract would be increasing in the CEO’s tenure as well. However, whatTheorem 1 says is that, holding tenure fixed, a CEO with a greater Z1 will have agreater b�: That is, it is not just tenure that matters, but it is also the CEO’sreputation and how that impacts the probabilistic assessment that he will be retainedin the future. While a longer tenure can imply that there is less uncertainty over hisestimated ability, if the assessment of his ability has dropped, the CEO is more likelyto be dismissed. Consuquently, this CEO will have a lower pay-for-performancesensitivity.
3. Data description and empirical methodology
In this section, I summarize the data and empirical methods employed to bring theprediction of Theorem 1 that stock-based pay sensitivities are strictly increasing inCEO reputation to the data. The necessary data include CEO compensation data,stockholder return data for the employing firms of these CEOs, and empiricalproxies for CEO reputation at the time the terms of the compensation contract are
T.T. Milbourn / Journal of Financial Economics 68 (2003) 233–262242
set. The collection process for each of these is detailed below, followed by adescription of the empirical methodology employed.
3.1. CEO compensation data
The CEO compensation data are collected from Compustat’s ExecuComp,spanning the years 1993 to 1998. These data include explicit calculations of executivecompensation flows, as well as information related to changes in the value of anexecutive’s stock and stock option holdings. Given that the theory is explicitlydeveloped for CEO compensation, the first step is to glean only CEOs from thisdatabase that covers (up to) the top five executives of firms that are either in theStandard and Poor’s (S&P) 500, the S&P MidCap Index, or the S&P SmallCapIndex. ExecuComp provides an indicator field of whether the executive appearing inthe database was in fact CEO of that firm during the fiscal year. However, thisdelineator is frequently at odds with the dates given for when that executive becameCEO and importantly, when he left office. To most accurately retain true CEOs inthe sample, I rely on three ExecuComp and Compustat fields including BecameCEO, Left Office, and Month of Fiscal year-end for the firm. In the case of CEOswho left their offices midyear, these executives are keyed as CEOs in that corporateyear only if they remained CEOs for at least six months. Similarly, for thoseexecutives who became CEOs during a year, they are only keyed as the CEO if theywere in office at least six months of the fiscal year.To focus the empirical analysis on the most direct principal–agent relationship, all
corporate founders are removed. Unlike the Forbes annual compensation surveys,ExecuComp does not include a field denoting whether the CEO is the corporatefounder. However, using S&P’s Net Advantage, I identify 65 corporate founders,and these founding CEOs comprise 3.89% of the original sample. See the Appendixfor a detailed discussion of the S&P’s Net Advantage, a web-based, searchabledatabase, and how it was employed to identify founders in the ExecuComp sample.Note that none of the empirical results in this paper are sensitive to this restriction toa non-founder sample.With the list of CEOs in hand, I define flow compensation as the sum of a CEO’s
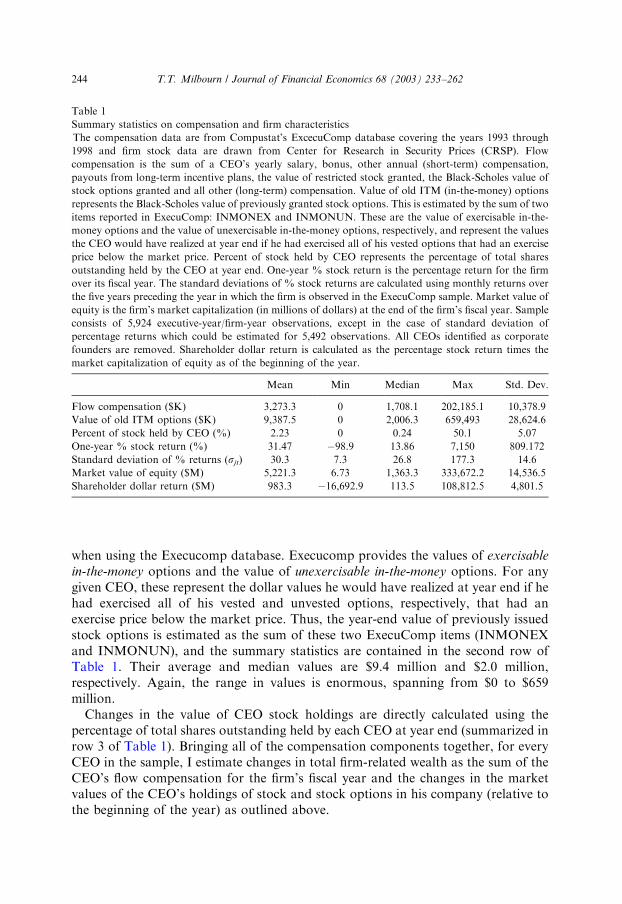
yearly salary, bonus, other annual (short-term) compensation, payouts from long-term incentive plans, the value of restricted stock granted, the Black–Scholes value ofstock options granted, and all other (long-term) compensation. The first row ofTable 1 summarizes the flow compensation for CEOs in the years 1993 to 1998.Yearly flow compensation awarded to CEOs ranges from $0 to $202.2 million, withan average value of $3.3 million and median value of $1.7 million. The rightskewness of these data is quite evident here, and attempts to minimize the effects ofsevere outliers are outlined later.While compensation flows certainly reflect significant dollar amounts, it is the
change in the value of a CEO’s stock and stock option portfolio over the year thatconstitutes the overwhelming majority of the heterogeneity in empirically estimatedpay-sensitivities (see Murphy, 1999). In contrast to yearly compensation flows,estimating the change in the value of previously granted stock options is less direct
T.T. Milbourn / Journal of Financial Economics 68 (2003) 233–262 243
when using the Execucomp database. Execucomp provides the values of exercisable
in-the-money options and the value of unexercisable in-the-money options. For anygiven CEO, these represent the dollar values he would have realized at year end if hehad exercised all of his vested and unvested options, respectively, that had anexercise price below the market price. Thus, the year-end value of previously issuedstock options is estimated as the sum of these two ExecuComp items (INMONEXand INMONUN), and the summary statistics are contained in the second row ofTable 1. Their average and median values are $9.4 million and $2.0 million,respectively. Again, the range in values is enormous, spanning from $0 to $659million.Changes in the value of CEO stock holdings are directly calculated using the
percentage of total shares outstanding held by each CEO at year end (summarized inrow 3 of Table 1). Bringing all of the compensation components together, for everyCEO in the sample, I estimate changes in total firm-related wealth as the sum of theCEO’s flow compensation for the firm’s fiscal year and the changes in the marketvalues of the CEO’s holdings of stock and stock options in his company (relative tothe beginning of the year) as outlined above.
Table 1
Summary statistics on compensation and firm characteristics
The compensation data are from Compustat’s ExcecuComp database covering the years 1993 through
1998 and firm stock data are drawn from Center for Research in Security Prices (CRSP). Flow
compensation is the sum of a CEO’s yearly salary, bonus, other annual (short-term) compensation,
payouts from long-term incentive plans, the value of restricted stock granted, the Black-Scholes value of
stock options granted and all other (long-term) compensation. Value of old ITM (in-the-money) options
represents the Black-Scholes value of previously granted stock options. This is estimated by the sum of two
items reported in ExecuComp: INMONEX and INMONUN. These are the value of exercisable in-the-
money options and the value of unexercisable in-the-money options, respectively, and represent the values
the CEO would have realized at year end if he had exercised all of his vested options that had an exercise
price below the market price. Percent of stock held by CEO represents the percentage of total shares
outstanding held by the CEO at year end. One-year % stock return is the percentage return for the firm
over its fiscal year. The standard deviations of % stock returns are calculated using monthly returns over
the five years preceding the year in which the firm is observed in the ExecuComp sample. Market value of
equity is the firm’s market capitalization (in millions of dollars) at the end of the firm’s fiscal year. Sample
consists of 5,924 executive-year/firm-year observations, except in the case of standard deviation of
percentage returns which could be estimated for 5,492 observations. All CEOs identified as corporate
founders are removed. Shareholder dollar return is calculated as the percentage stock return times the
market capitalization of equity as of the beginning of the year.
Mean Min Median Max Std. Dev.
Flow compensation ($K) 3,273.3 0 1,708.1 202,185.1 10,378.9
Value of old ITM options ($K) 9,387.5 0 2,006.3 659,493 28,624.6
Percent of stock held by CEO (%) 2.23 0 0.24 50.1 5.07
One-year % stock return (%) 31.47 �98.9 13.86 7,150 809.172
Standard deviation of % returns (sjt) 30.3 7.3 26.8 177.3 14.6
Market value of equity ($M) 5,221.3 6.73 1,363.3 333,672.2 14,536.5
Shareholder dollar return ($M) 983.3 �16,692.9 113.5 108,812.5 4,801.5
T.T. Milbourn / Journal of Financial Economics 68 (2003) 233–262244

3.2. Stockholder return data
In order to empirically estimate the sensitivity of compensation to changes inshareholder wealth, I match the firms in the ExecuComp database to fiscal-yearstockholder performance data from CRSP. The fourth and fifth rows of Table 1summarize each firm’s annual percentage stock return in its current fiscal year and itsstandard deviation of returns, which is calculated using monthly return data fromthe previous five years’ returns. Annual stock returns average 31.47% (median returnis 13.86%) across firms in this time period, and the five-year standard deviation ofmonthly stock returns averages 30.3% (median standard deviation is 26.8%). Themarket capitalization of equity is calculated at year end and has an average value of$5,221.3 million (median value was $1,363.3 million), as seen in row 6. Lastly, row 7summarizes the changes in shareholder wealth (i.e., the dollar return to share-holders), calculated as the percentage stock return for the current fiscal year timesthe beginning of period market capitalization of equity. The average dollarshareholder return is $983.3 million, and the median is $113.5 million.
3.3. Empirical measures of CEO reputation
The theoretical model developed in this paper offers a clear message. Theperceived ability of the CEO at the time of contracting (defined in the model as Z1)plays a key role in determining the stock-based pay-sensitivity of the optimalcontract. A CEO’s reputation is essentially the market’s assessment of his ability.However, a direct empirical measure for CEO reputation is less obvious. Ultimately,I would like to identify an observable measure (or set of measures) that captures thecapital market’s assessment of the CEO’s ability. This reputational assessment isrealistically multi-dimensional and in this spirit I consider four empirical proxies,including CEO tenure, whether the CEO is appointed from inside or outside of thefirm, the number of business-related articles returned by Dow Jones RetrievalService in which the CEO’s name appears, and industry-adjusted stockholder returnswhile the CEO has been at the firm (estimated separately over one-year, three-year,and five-year time intervals). Below, I first define and discuss the three proxies forCEO reputation that are not explicitly tied to a firm’s stock performance. I then turnto the fourth measure, industry-adjusted stockholder returns, which is explicitlybased on firm (stockholder) performance. Summary statistics for each measure arecontained in Table 2, Panel A.The first proxy for reputation is CEO tenure, defined as the number of years the
executive has been CEO at this firm as of the compensation year in ExecuComp. Theeconomic interpretation is that the longer is the CEO’s tenure, the greater are theboard of directors’ assessments of his ability given that this CEO has survivedprevious retention/dismissal decisions. While the market can’t observe the board’sfull information set, it can learn from past retention decisions. As seen in the firstrow of the table, average and median CEO tenure are 8.50 and 6.46 years,respectively. It is important to note that while the theory above distinguishesbetween a CEO-tenure effect (as in Gibbons and Murphy, 1992) and a reputation
T.T. Milbourn / Journal of Financial Economics 68 (2003) 233–262 245
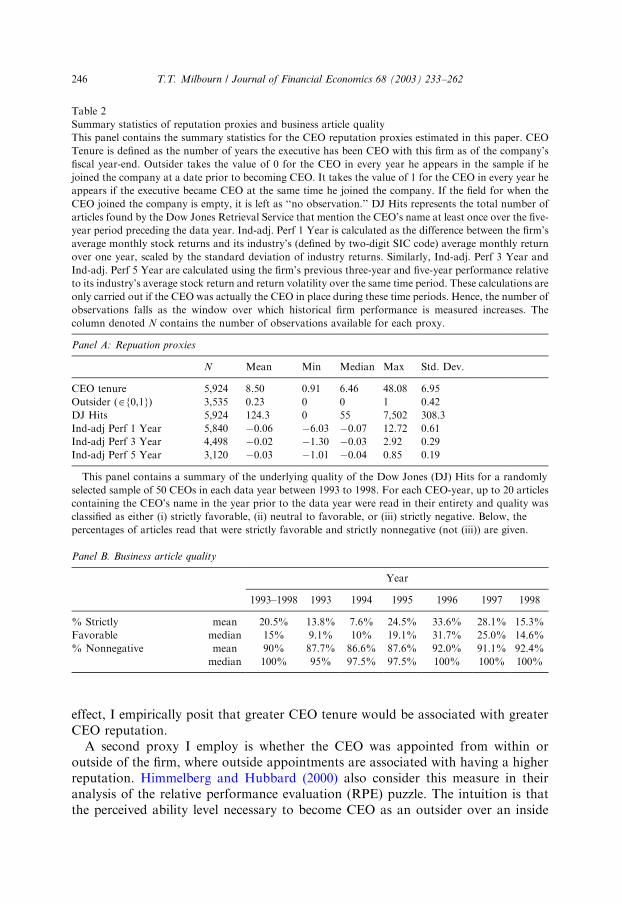
effect, I empirically posit that greater CEO tenure would be associated with greaterCEO reputation.A second proxy I employ is whether the CEO was appointed from within or
outside of the firm, where outside appointments are associated with having a higherreputation. Himmelberg and Hubbard (2000) also consider this measure in theiranalysis of the relative performance evaluation (RPE) puzzle. The intuition is thatthe perceived ability level necessary to become CEO as an outsider over an inside
Table 2
Summary statistics of reputation proxies and business article quality
This panel contains the summary statistics for the CEO reputation proxies estimated in this paper. CEO
Tenure is defined as the number of years the executive has been CEO with this firm as of the company’s
fiscal year-end. Outsider takes the value of 0 for the CEO in every year he appears in the sample if he
joined the company at a date prior to becoming CEO. It takes the value of 1 for the CEO in every year he
appears if the executive became CEO at the same time he joined the company. If the field for when the
CEO joined the company is empty, it is left as ‘‘no observation.’’ DJ Hits represents the total number of
articles found by the Dow Jones Retrieval Service that mention the CEO’s name at least once over the five-
year period preceding the data year. Ind-adj. Perf 1 Year is calculated as the difference between the firm’s
average monthly stock returns and its industry’s (defined by two-digit SIC code) average monthly return
over one year, scaled by the standard deviation of industry returns. Similarly, Ind-adj. Perf 3 Year and
Ind-adj. Perf 5 Year are calculated using the firm’s previous three-year and five-year performance relative
to its industry’s average stock return and return volatility over the same time period. These calculations are
only carried out if the CEO was actually the CEO in place during these time periods. Hence, the number of
observations falls as the window over which historical firm performance is measured increases. The
column denoted N contains the number of observations available for each proxy.
Panel A: Repuation proxies
N Mean Min Median Max Std. Dev.
CEO tenure 5,924 8.50 0.91 6.46 48.08 6.95
Outsider (A{0,1}) 3,535 0.23 0 0 1 0.42
DJ Hits 5,924 124.3 0 55 7,502 308.3
Ind-adj Perf 1 Year 5,840 �0.06 �6.03 �0.07 12.72 0.61
Ind-adj Perf 3 Year 4,498 �0.02 �1.30 �0.03 2.92 0.29
Ind-adj Perf 5 Year 3,120 �0.03 �1.01 �0.04 0.85 0.19
This panel contains a summary of the underlying quality of the Dow Jones (DJ) Hits for a randomly
selected sample of 50 CEOs in each data year between 1993 to 1998. For each CEO-year, up to 20 articles
containing the CEO’s name in the year prior to the data year were read in their entirety and quality was
classified as either (i) strictly favorable, (ii) neutral to favorable, or (iii) strictly negative. Below, the
percentages of articles read that were strictly favorable and strictly nonnegative (not (iii)) are given.
Panel B. Business article quality
Year
1993–1998 1993 1994 1995 1996 1997 1998
% Strictly mean 20.5% 13.8% 7.6% 24.5% 33.6% 28.1% 15.3%
Favorable median 15% 9.1% 10% 19.1% 31.7% 25.0% 14.6%
% Nonnegative mean 90% 87.7% 86.6% 87.6% 92.0% 91.1% 92.4%
median 100% 95% 97.5% 97.5% 100% 100% 100%
T.T. Milbourn / Journal of Financial Economics 68 (2003) 233–262246
candidate with better knowledge of the firm’s inner workings is greater. I let anindicator variable, denoted outsider, take the value of zero if the CEO joined thecompany at a date prior to becoming CEO. Outsider takes the value of one if the datethe CEO joined the company is the same as the date at which he became CEO. Thesecond row of Table 2, Panel A highlights that 23% of the sample of CEOs areoutside appointments. Two points are noteworthy. First, once a CEO is identified asan outside appointment, the executive carries the outsider=1 field in every year theCEO appears in the sample while employed by the same firm. Second, there aremany CEOs for which the date at which they joined the company is unavailable inExecuComp. These CEOs are not assigned any value for outsider. Thus, the samplesize drops by nearly one-third whenever I proxy for CEO reputation with outsider.The third measure of CEO reputation is the total number of articles returned by
the Dow Jones News Retrieval Service in which the executive’s name appears at leastonce over a time period of five years prior to the ExecuComp data-year. Onlyselected business publications are searched, and these include newswires, businessperiodicals, and major newspapers. Full details of the search methodology areoutlined in the Appendix. The idea is that a CEO who appears in selected businesspublications more often than others has a higher reputation. For instance, anexecutive perceived to be the industry expert would be interviewed and cited moreoften. Again, an executive’s prominence in the financial press would be observableby the market and a potentially reliable guide to the aggregate assessment of hisability. The article count is denoted DJ Hits, and this rolling five-year window isupdated each time the CEO appears in the sample. As seen in the third row of Table2, Panel A, article hits per CEO average 124.3 articles, ranging from zero to 7,502.The median number of articles is 55.Naturally, not all press is necessarily ‘‘good’’ press. However, it seems reasonable
that publicity and reputation are on the whole positively related. In fact, Panel B ofTable 2 shows that for a subsample of these Execucomp CEOs, very few negativearticles appear in print. This subsample is collected as follows. Fifty CEOs arerandomly selected in each of the years between 1993 and 1998. The Dow Jones NewsRetrieval Service is searched for all articles (up to a maximum of 20) containing theCEO’s name in the year prior to the data year. Each article is read and then classifiedas being either (i) strictly favorable, (ii) neutral to favorable, or (iii) strictly negativewith respect to the CEO.Based on these classifications, Panel B of Table 2 summarizes the percentage of
total articles read that are strictly favorable, and the percentage that are strictlynonnegative (i.e., those that were either strictly favorable or neutral to favorable).Column 1 shows that on average, 20.5% (median value of 15%) of the articlesassociated with these 50 CEOs are strictly favorable, and 90% of articles on average(median value of 100%) are strictly nonnegative. The remaining columns display thesame percentages for each year in the sample, where values are qualitatively similar.While such classifications of the data were not carried out for the full sample owingto the sheer number of articles, the subsample statistics certainly support the ideathat prominence in the business publications is associated with favorable assessmentson average. Consequently, screening the article counts to contain only nonnegative
T.T. Milbourn / Journal of Financial Economics 68 (2003) 233–262 247

references essentially wouldn’t change this measure in a material way. It seemsreasonable that to the extent that some CEOs do receive negative press on occassion,those CEOs are less likely to survive to future periods. Thus, conditional onsurviving as CEO suggests that historical press coverage was most likelynonnegative.The last proxy for CEO reputation that I employ is explicitly performance-based,
and is the industry-adjusted stock price performance while the CEO has been at thehelm of the firm. Over a variety of time intervals, I calculate a relative performancemeasure within the industry in which the firm operates based on its two-digit SICcode. This approach accounts for the fact that the market would not necessarilydevalue a CEO’s reputation based on poor performance if the entire industryexhibited such performance. Under this industry-adjusted measure, the reputation ofthe CEO of firm j; which operates in industry I ; is proxied by
Ind-adj Perf T Yearj ¼ ½ %Rj � %RI =sI ; ð15Þ
where %Rj is the average monthly return on the firm’s equity over the performanceperiod, %RI is the average monthly return on an equally weighted portfolio for firm j’s
two-digit SIC industry over the performance period, sI is the standard deviation ofthe average monthly industry returns over the period, and TAf1; 3; 5g is the numberof years over which the industry-adjusted performance is measured. I use an equallyweighted industry portfolio since it is difficult for a CEO of a firm that represents alarge fraction of the industry to ever outperform the industry average.This metric is estimated for each CEO over performance periods of one, three, and
five years prior to the ExecuComp data year. As I turn to the empirical testsinvolving this proxy, only CEOs whose tenures as of the beginning of the data periodare at least as long as the estimated performance period are retained in thesubsample. Thus, the sample size falls when I replace one-year industry-adjustedreturns with three-year industry-adjusted returns as a proxy for CEO reputation, andfalls further when a five-year window is used. The fourth, fifth, and sixth rows ofPanel A of Table 2 contain the summary statistics over the three differentperformance windows. As can be seen there, the average and median industry-adjusted returns are slightly negative. Not surprisingly, the standard deviations ofthese measures significantly decline as the performance window increases.
3.3.1. Relationship among reputation measures
With the reputation proxies in hand, a natural question is whether these are jointlyindependent signals of a CEO’s reputation, or in the worst case, simply noise. Toexamine the issue of independence, Table 3 summarizes the Pearson correlationsbetween each of the CEO reputation proxies (CEO tenure, Outsider, Dow JonesHits, Industry-Adjusted Performance over one, three, and five years) along with theCEO’s age. Correlations among the non-performance-based reputation proxies arequite small, although not surprisingly, CEO age and tenure are significantlycorrelated (38.4%). CEO age is also significantly correlated with all of the otherproxies, but no correlation exceeds 11.1% in absolute value. CEO tenure has acorrelation of 8.3% with the CEO being hired as an outsider, and a correlation of
T.T. Milbourn / Journal of Financial Economics 68 (2003) 233–262248
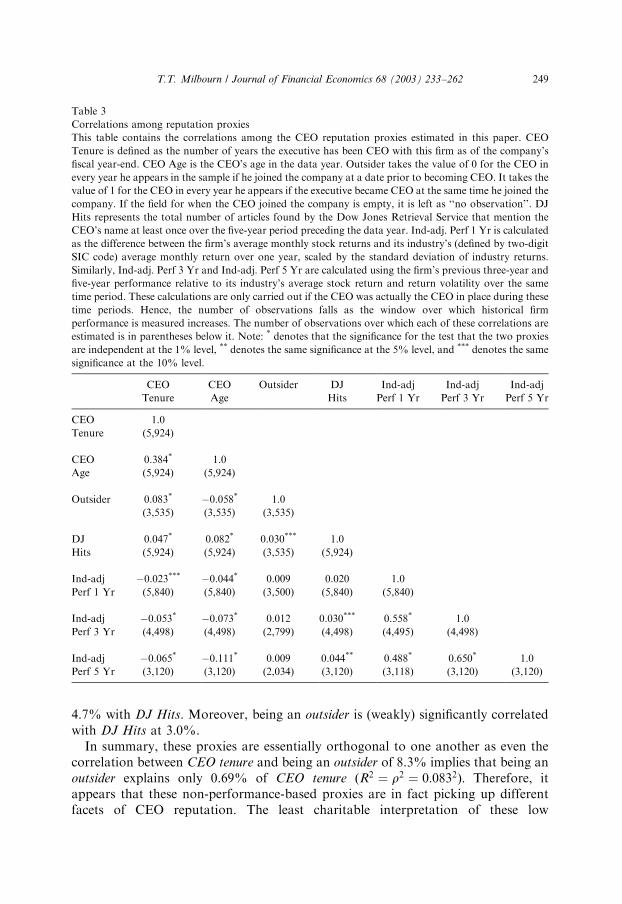
4.7% with DJ Hits. Moreover, being an outsider is (weakly) significantly correlatedwith DJ Hits at 3.0%.In summary, these proxies are essentially orthogonal to one another as even the
correlation between CEO tenure and being an outsider of 8.3% implies that being anoutsider explains only 0.69% of CEO tenure ðR2 ¼ r2 ¼ 0:0832Þ: Therefore, itappears that these non-performance-based proxies are in fact picking up differentfacets of CEO reputation. The least charitable interpretation of these low
Table 3
Correlations among reputation proxies
This table contains the correlations among the CEO reputation proxies estimated in this paper. CEO
Tenure is defined as the number of years the executive has been CEO with this firm as of the company’s
fiscal year-end. CEO Age is the CEO’s age in the data year. Outsider takes the value of 0 for the CEO in
every year he appears in the sample if he joined the company at a date prior to becoming CEO. It takes the
value of 1 for the CEO in every year he appears if the executive became CEO at the same time he joined the
company. If the field for when the CEO joined the company is empty, it is left as ‘‘no observation’’. DJ
Hits represents the total number of articles found by the Dow Jones Retrieval Service that mention the
CEO’s name at least once over the five-year period preceding the data year. Ind-adj. Perf 1 Yr is calculated
as the difference between the firm’s average monthly stock returns and its industry’s (defined by two-digit
SIC code) average monthly return over one year, scaled by the standard deviation of industry returns.
Similarly, Ind-adj. Perf 3 Yr and Ind-adj. Perf 5 Yr are calculated using the firm’s previous three-year and
five-year performance relative to its industry’s average stock return and return volatility over the same
time period. These calculations are only carried out if the CEO was actually the CEO in place during these
time periods. Hence, the number of observations falls as the window over which historical firm
performance is measured increases. The number of observations over which each of these correlations are
estimated is in parentheses below it. Note: * denotes that the significance for the test that the two proxies
are independent at the 1% level, ** denotes the same significance at the 5% level, and *** denotes the same
significance at the 10% level.
CEO CEO Outsider DJ Ind-adj Ind-adj Ind-adj
Tenure Age Hits Perf 1 Yr Perf 3 Yr Perf 5 Yr
CEO 1.0
Tenure (5,924)
CEO 0.384* 1.0
Age (5,924) (5,924)
Outsider 0.083* �0.058* 1.0
(3,535) (3,535) (3,535)
DJ 0.047* 0.082* 0.030*** 1.0
Hits (5,924) (5,924) (3,535) (5,924)
Ind-adj �0.023*** �0.044* 0.009 0.020 1.0
Perf 1 Yr (5,840) (5,840) (3,500) (5,840) (5,840)
Ind-adj �0.053* �0.073* 0.012 0.030*** 0.558* 1.0
Perf 3 Yr (4,498) (4,498) (2,799) (4,498) (4,495) (4,498)
Ind-adj �0.065* �0.111* 0.009 0.044** 0.488* 0.650* 1.0
Perf 5 Yr (3,120) (3,120) (2,034) (3,120) (3,118) (3,120) (3,120)
T.T. Milbourn / Journal of Financial Economics 68 (2003) 233–262 249
correlations is that the measures are simply picking up noise. However, as shownlater, not only are all of these measures statistically and economically significantexplanatory variables for observed stock-based pay sensitivities, they all work in thesame direction. Thus, it appears less plausible that these proxies are just noise.Turning to the performance-based proxies across different time windows, these are
highly correlated with each other. Industry-adjusted performance over one year hascorrelations of 53.8% and 48.8% with industry-adjusted performance over three andfive years, respectively, and industry-adjusted performance over three years has acorrelation of 65.0% with the performance over five years. Empirically, these highcorrelations are not problematic as only one industry-adjusted measure at a time willbe included as a proxy for CEO reputation in the analysis. Correlations between theindustry-adjusted and the non-performance-based measures are never larger than7.3% in absolute value. Moreover, as in the case of CEO tenure, outsider, and DJ
Hits, these proxies also turn out to be positively and significantly related to CEO paysensitivities.
3.3.2. Reputation measures and future job retention
While the low correlations among the reputation measures are consistent with theidea that CEO reputation is multi-dimensional, the theory I develop dictates thathigher values of these measures should be associated with a greater likelihood ofbeing retained in future periods. This is an important issue, but a difficult one toaddress empirically. Ideally, I would construct an entire career path for eachexecutive and use his eventual tenure to test the theory directly. However, given thatmy sample period only spans seven years, I cannot accurately determine how longCEOs stay, and instead proxy for the market’s expectation of future tenure with myfour measures. That said, it can still be instructive to determine if my reputationmeasures are related to the limited data on actual turnover using a multinomial logitmodel, even though we know from Warner, Watts, and Wruck (1988) that thesemodels perform quite poorly in predicting turnover.Table 4 provides a summary of the estimated coefficients from multinomial logit
regressions of whether the incumbent CEO remains in office in the year following thedata year as a function of my reputation measures. To maximize sample size, Iestimate four separate specifications that always include CEO Tenure and DJ Hits,and for robustness, a variety of standard controls, including CEO age, firm size, thepercentage of CEO share ownership, and the firm’s one-year stock return. Column IIadds the proxy outsider to the specification, and Columns III and IV add the one-year and five-year industry-adjusted performance measures, respectively. As seen inthe table, the coefficients on CEO age, CEO ownership, and firm performance revealthat these controls perform in the standard way. Older CEOs are less likely to beretained in the next period, while those with greater share ownership and stock-priceperformance are more likely to be retained. Estimated coefficients on the reputationmeasures reveal (at worst) weakly supportive results. Both the coefficients on CEO
Tenure and outsider are insignificantly different from zero. However, observe thatboth DJ Hits and the performance-based reputation measures perform quite well.The estimated coefficient on DJ Hits is positive and significant in three out of four
T.T. Milbourn / Journal of Financial Economics 68 (2003) 233–262250

Table 4
CEO reputation and future job retention
This table contains logit regressions of whether the incumbent CEO remains in once in the year after the
data year as a function of the reputation proxies given in Table 2 and other relevant controls. Note that
‘‘cdf’’ signifies that the empirical cumulative density function is estimated for the relevant variable. CEO
Tenure is defined as the number of years the executive has been CEO with this firm as of the company’s
fiscal year-end. DJ Hits represents the total number of articles found by the Dow Jones Retrieval Service
that mention the CEO’s name at least once over the five-year period preceding the data year. CEO Age is
the CEO’s age in the data year. Outsider takes the value of for the CEO in every year he appears in the
sample if he joined the company at a date prior to becoming CEO. It takes the value of 1 for the CEO in
every year he appears if the executive became CEO at the same time he joined the company. If the field for
when the CEO joined the company is empty, it is left as ‘‘no observation.’’ Ind-adj. Perf 1 Yr is calculated
as the difference between the firm’s average monthly stock returns and its industry’s (defined by two-digit
SIC code) average monthly return over one year, scaled by the standard deviation of industry returns.
Similarly, Ind-adj. Perf 5 Yr is calculated using the firm’s previous five-year performance relative to its
industry’s average stock return and return volatility over the same time period. Size is the firm’s size, given
by the firm’s market capitalization of equity (in millions of dollars) at the end of the firm’s fiscal year. %
Share Ownership represents the percentage of total shares outstanding held by the CEO at year end. One-
year % stock return is the percentage return for the firm over its fiscal year. Estimated coefficients for the
constants in each model are suppressed. Standard errors are in parentheses below the estimated
coefficients. * denotes significance at the 1% level, ** at the 5% level, and *** at the 10% level.
CEO in office next year I II III IV
cdf(CEO tenure) �0.045 �0.139 �0.055 0.329
(0.166) (0.214) (0.167) (0.205)
cdf(DJ Hits) 0.334** �0.020 0.316** 0.475**
(0.145) (0.129) (0.147) (0.195)
cdf(CEO Age) �1.216* �1.081* �1.221* �1.483*
(0.157) (0.202) (0.157) (0.215)
outsider �0.196(0.129)
cdf(Ind-adj. Perf 1 Yr) 0.455*
(0.149)
cdf(Ind-adj. Perf 5 Yr) 0.358***
(0.206)
cdf(size) �0.154 0.346 �0.067 �0.318(0.176) (0.243) (0.176) (0.242)
cdf(% Share Ownership) 0.273 0.547** 0.265 0.534**
(0.178) (0.232) (0.180) (0.245)
cdf(1-Year % Stock Return) 0.582* 0.220
(0.155) (0.195)
Sample size 4,769 2,913 4,695 2,485
Likelihood Ratio Chi-Squared 94.40* 39.92* 86.70* 73.72*
T.T. Milbourn / Journal of Financial Economics 68 (2003) 233–262 251

specifications. In fact, the magnitude of its coefficient is roughly as large as those offirm size and past stock performance. The industry-adjusted performance measuresover one- and five-year windows are also both positively and significantly related toretention.While the estimated coefficient on outsider is insignificant, it is the one proxy for
which I can say something about eventual tenure. Since this variable, unlike theother proxies, is defined as of the CEO’s start date, the summary statistics on tenureconditional on the value of outsider are informative. For the sample of 2,738 CEO-firm years for which the CEO is an insider, CEO tenure is on average 8.49 years(median of 6.66). On the other hand, for the sample of 797 CEO-firm years for whichthe CEO is in fact an outside appointment, average tenure is 9.87 years (median of7.08). Thus, it doesn’t appear that the average outside appointment is more oftenhired as a short-term, turn-around specialist.In summary, given the poor predictive power of such logit specifications
in general, and the neutral to positive relationship shown between mymeasures and actual turnover in Table 4, I suggest that it is reasonable to concludethat my reputation measures capture something material with respect to eventualtenure.
3.4. Empirical methodology
The empirical analysis employed in this paper to estimate stock-based paysensitivities is rooted in the method of Jensen and Murphy (1990). I estimate changesin a CEO’s firm-related wealth in year t as a function of the dollar return earned bythe employing firms’ shareholders (change in shareholder wealth) in year t by thefollowing linear specification:
wjt ¼ b0 þ b1DRjt þX98t¼93
Yt þ ejt: ð16Þ
Here, wjt is the change in the CEO’s firm-related wealth while employed by firm j
in year t; DRjt is the dollar return to shareholders in firm j in year t;P98
t¼93 Yt
are indicator variables for each year 1993 to 1998, and ejt is the error term. Yeareffects are included to capture any changes in pay levels across time. Moreover,given the extreme right skewness in changes in CEO firm-related wealth (as inits underlying components in Table 1), I estimate median regressions (as in Halland Liebman, 1998) which minimize the sum of the absolute residuals rather thanthe sum of the squares of the residuals as in ordinary least squares regressions.Thus, the influence of outliers on the empirically estimated results is greatlyreduced.Estimating the specification in Eq. (16) does not speak to the heterogeneity in
stock-based pay sensitivities as the estimated coefficient b1 offers only the median
pay sensitivity observed in CEO compensation. The theory developed above predictsthat the cross-sectional variation in CEO reputation is positively associated with thecross-sectional heterogeneity in stock-based pay sensitivities. In order to test the
T.T. Milbourn / Journal of Financial Economics 68 (2003) 233–262252
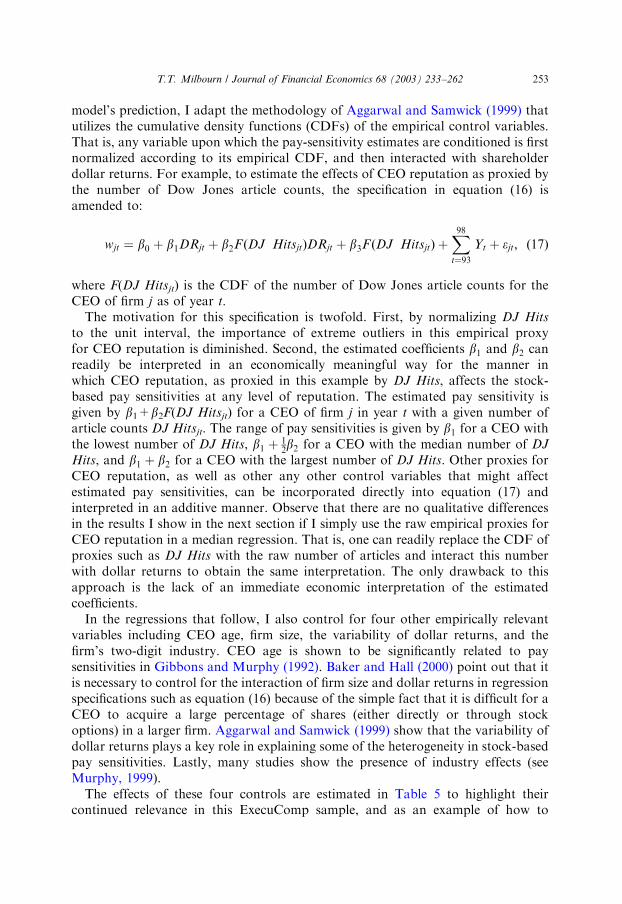
model’s prediction, I adapt the methodology of Aggarwal and Samwick (1999) thatutilizes the cumulative density functions (CDFs) of the empirical control variables.That is, any variable upon which the pay-sensitivity estimates are conditioned is firstnormalized according to its empirical CDF, and then interacted with shareholderdollar returns. For example, to estimate the effects of CEO reputation as proxied bythe number of Dow Jones article counts, the specification in equation (16) isamended to:
wjt ¼ b0 þ b1DRjt þ b2F ðDJ HitsjtÞDRjt þ b3F ðDJ HitsjtÞ þX98t¼93
Yt þ ejt; ð17Þ
where F(DJ Hitsjt) is the CDF of the number of Dow Jones article counts for theCEO of firm j as of year t:The motivation for this specification is twofold. First, by normalizing DJ Hits
to the unit interval, the importance of extreme outliers in this empirical proxyfor CEO reputation is diminished. Second, the estimated coefficients b1 and b2 canreadily be interpreted in an economically meaningful way for the manner inwhich CEO reputation, as proxied in this example by DJ Hits, affects the stock-based pay sensitivities at any level of reputation. The estimated pay sensitivity isgiven by b1+b2F(DJ Hitsjt) for a CEO of firm j in year t with a given number ofarticle counts DJ Hitsjt. The range of pay sensitivities is given by b1 for a CEO withthe lowest number of DJ Hits, b1 þ
12b2 for a CEO with the median number of DJ
Hits, and b1 þ b2 for a CEO with the largest number of DJ Hits. Other proxies forCEO reputation, as well as other any other control variables that might affectestimated pay sensitivities, can be incorporated directly into equation (17) andinterpreted in an additive manner. Observe that there are no qualitative differencesin the results I show in the next section if I simply use the raw empirical proxies forCEO reputation in a median regression. That is, one can readily replace the CDF ofproxies such as DJ Hits with the raw number of articles and interact this numberwith dollar returns to obtain the same interpretation. The only drawback to thisapproach is the lack of an immediate economic interpretation of the estimatedcoefficients.In the regressions that follow, I also control for four other empirically relevant
variables including CEO age, firm size, the variability of dollar returns, and thefirm’s two-digit industry. CEO age is shown to be significantly related to paysensitivities in Gibbons and Murphy (1992). Baker and Hall (2000) point out that itis necessary to control for the interaction of firm size and dollar returns in regressionspecifications such as equation (16) because of the simple fact that it is difficult for aCEO to acquire a large percentage of shares (either directly or through stockoptions) in a larger firm. Aggarwal and Samwick (1999) show that the variability ofdollar returns plays a key role in explaining some of the heterogeneity in stock-basedpay sensitivities. Lastly, many studies show the presence of industry effects (seeMurphy, 1999).The effects of these four controls are estimated in Table 5 to highlight their
continued relevance in this ExecuComp sample, and as an example of how to
T.T. Milbourn / Journal of Financial Economics 68 (2003) 233–262 253
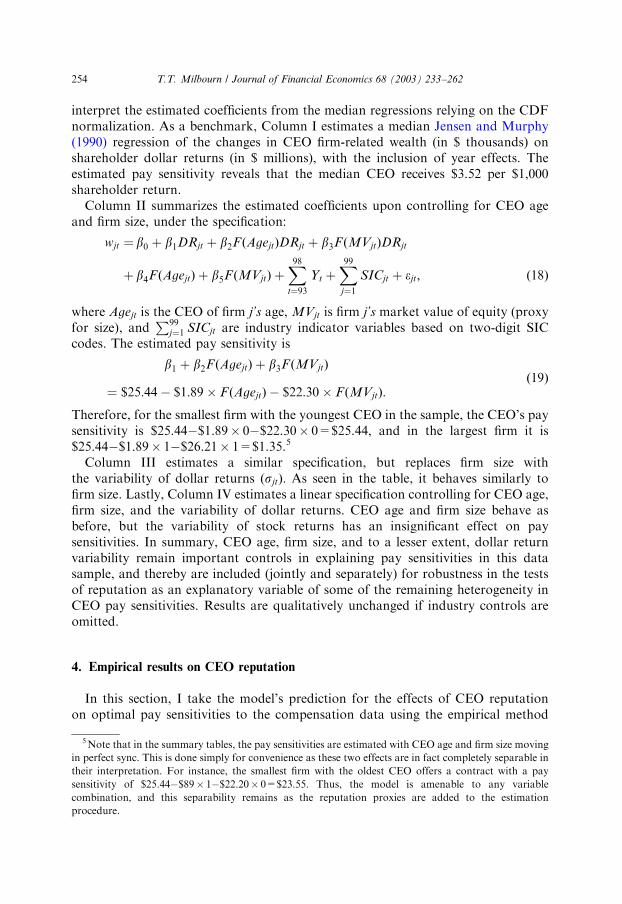
interpret the estimated coefficients from the median regressions relying on the CDFnormalization. As a benchmark, Column I estimates a median Jensen and Murphy(1990) regression of the changes in CEO firm-related wealth (in $ thousands) onshareholder dollar returns (in $ millions), with the inclusion of year effects. Theestimated pay sensitivity reveals that the median CEO receives $3.52 per $1,000shareholder return.Column II summarizes the estimated coefficients upon controlling for CEO age
and firm size, under the specification:
wjt ¼ b0 þ b1DRjt þ b2F ðAgejtÞDRjt þ b3F ðMVjtÞDRjt
þ b4F ðAgejtÞ þ b5F ðMVjtÞ þX98t¼93
Yt þX99j¼1
SICjt þ ejt; ð18Þ
where Agejt is the CEO of firm j’s age, MVjt is firm j’s market value of equity (proxyfor size), and
P99j¼1 SICjt are industry indicator variables based on two-digit SIC
codes. The estimated pay sensitivity is
b1 þ b2F ðAgejtÞ þ b3F ðMVjtÞ
¼ $25:44� $1:89 F ðAgejtÞ � $22:30 F ðMVjtÞ:ð19Þ
Therefore, for the smallest firm with the youngest CEO in the sample, the CEO’s paysensitivity is $25.44�$1.89 0�$22.30 0=$25.44, and in the largest firm it is$25.44�$1.89 1�$26.21 1=$1.35.5
Column III estimates a similar specification, but replaces firm size withthe variability of dollar returns ðsjtÞ: As seen in the table, it behaves similarly tofirm size. Lastly, Column IV estimates a linear specification controlling for CEO age,firm size, and the variability of dollar returns. CEO age and firm size behave asbefore, but the variability of stock returns has an insignificant effect on paysensitivities. In summary, CEO age, firm size, and to a lesser extent, dollar returnvariability remain important controls in explaining pay sensitivities in this datasample, and thereby are included (jointly and separately) for robustness in the testsof reputation as an explanatory variable of some of the remaining heterogeneity inCEO pay sensitivities. Results are qualitatively unchanged if industry controls areomitted.
4. Empirical results on CEO reputation
In this section, I take the model’s prediction for the effects of CEO reputationon optimal pay sensitivities to the compensation data using the empirical method
5Note that in the summary tables, the pay sensitivities are estimated with CEO age and firm size moving
in perfect sync. This is done simply for convenience as these two effects are in fact completely separable in
their interpretation. For instance, the smallest firm with the oldest CEO offers a contract with a pay
sensitivity of $25.44�$89 1�$22.20 0=$23.55. Thus, the model is amenable to any variable
combination, and this separability remains as the reputation proxies are added to the estimation
procedure.
T.T. Milbourn / Journal of Financial Economics 68 (2003) 233–262254
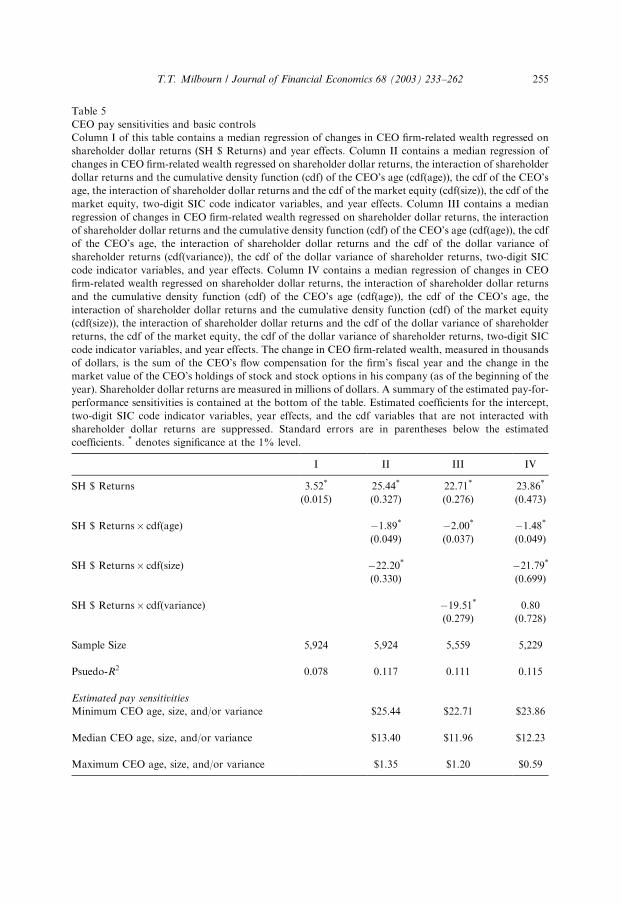
Table 5
CEO pay sensitivities and basic controls
Column I of this table contains a median regression of changes in CEO firm-related wealth regressed on
shareholder dollar returns (SH $ Returns) and year effects. Column II contains a median regression of
changes in CEO firm-related wealth regressed on shareholder dollar returns, the interaction of shareholder
dollar returns and the cumulative density function (cdf) of the CEO’s age (cdf(age)), the cdf of the CEO’s
age, the interaction of shareholder dollar returns and the cdf of the market equity (cdf(size)), the cdf of the
market equity, two-digit SIC code indicator variables, and year effects. Column III contains a median
regression of changes in CEO firm-related wealth regressed on shareholder dollar returns, the interaction
of shareholder dollar returns and the cumulative density function (cdf) of the CEO’s age (cdf(age)), the cdf
of the CEO’s age, the interaction of shareholder dollar returns and the cdf of the dollar variance of
shareholder returns (cdf(variance)), the cdf of the dollar variance of shareholder returns, two-digit SIC
code indicator variables, and year effects. Column IV contains a median regression of changes in CEO
firm-related wealth regressed on shareholder dollar returns, the interaction of shareholder dollar returns
and the cumulative density function (cdf) of the CEO’s age (cdf(age)), the cdf of the CEO’s age, the
interaction of shareholder dollar returns and the cumulative density function (cdf) of the market equity
(cdf(size)), the interaction of shareholder dollar returns and the cdf of the dollar variance of shareholder
returns, the cdf of the market equity, the cdf of the dollar variance of shareholder returns, two-digit SIC
code indicator variables, and year effects. The change in CEO firm-related wealth, measured in thousands
of dollars, is the sum of the CEO’s flow compensation for the firm’s fiscal year and the change in the
market value of the CEO’s holdings of stock and stock options in his company (as of the beginning of the
year). Shareholder dollar returns are measured in millions of dollars. A summary of the estimated pay-for-
performance sensitivities is contained at the bottom of the table. Estimated coefficients for the intercept,
two-digit SIC code indicator variables, year effects, and the cdf variables that are not interacted with
shareholder dollar returns are suppressed. Standard errors are in parentheses below the estimated
coefficients. * denotes significance at the 1% level.
I II III IV
SH $ Returns 3.52* 25.44* 22.71* 23.86*
(0.015) (0.327) (0.276) (0.473)
SH $ Returns cdf(age) �1.89* �2.00* �1.48*
(0.049) (0.037) (0.049)
SH $ Returns cdf(size) �22.20* �21.79*
(0.330) (0.699)
SH $ Returns cdf(variance) �19.51* 0.80
(0.279) (0.728)
Sample Size 5,924 5,924 5,559 5,229
Psuedo-R2 0.078 0.117 0.111 0.115
Estimated pay sensitivities
Minimum CEO age, size, and/or variance $25.44 $22.71 $23.86
Median CEO age, size, and/or variance $13.40 $11.96 $12.23
Maximum CEO age, size, and/or variance $1.35 $1.20 $0.59
T.T. Milbourn / Journal of Financial Economics 68 (2003) 233–262 255
and the various empirical proxies described above. Of the four empirical proxies forCEO reputation, I focus initially on the non-performance- based measures of CEO
tenure, DJ Hits, and outsider. The model predicts that pay sensitivities are increasingin CEO reputation. To test this using an augmented specification of equation (17), Icalculate the CDF of CEO Tenure and DJ Hits and interact each of these withshareholder dollar returns. Outsider is already normalized to the unit interval, and soshareholder dollar returns are interacted with outsider directly.Table 6 contains the results of the first test of the model’s prediction using non-
performance-based proxies. To maximize the sample size, I begin with CEO Tenure
and DJ Hits as the only empirical proxies for CEO reputation since nearly one-thirdof the sample couldn’t be classified as either an outside or inside CEO appointmentowing to empty ‘‘Joined Company’’ fields for many CEOs. The empirical test,controlling for CEO age, firm size, and industry effects, is to estimate the following:
wjt ¼ b0 þ b1DRjt þ b2F ðCEO TenurejtÞDRjt þ b3F ðDJ HitsjtÞDRjt
þ b4F ðAgejtÞDRjt þ b5F ðMVjtÞDRjt þ b6F ðCEO TenurejtÞ
þ b7F ðDJ HitsjtÞ
þ b8F ðAgejtÞ þ b9F ðMVjtÞ
þX98t¼93
Yt þX99j¼1
SICjt þ ejt: ð20Þ
Estimating positive coefficients for both b2 and b3 would be consistent with themodel’s prediction that higher CEO reputation leads to greater stock-based paysensitivity.Column I of Table 6 highlights that both coefficients are significantly positive at
the 1% level. Moreover, both reputation coefficients are economically meaningful aswell. For instance, in the case of CEO tenure, the interpretation of the b2 coefficientis that as a CEO moves from having the shortest tenure to the longest one, theexecutive is awarded an increased pay sensitivity of $7.82 per $1,000 shareholderreturn. Similarly, in the case of DJ article counts, a move from having the fewest tothe most implies an increased pay sensitivity of $1.21 per $1,000 shareholder return.At the bottom of Column I, the estimated pay sensitivity is summarized for bothreputation effects jointly. Holding CEO age and firm size to their median samplevalues, stock-based pay sensitivities range from $8.76 to $13.28 to $17.79 as a CEOmoves from the lowest to the median to the highest (joint CEO Tenure/DJ Hits)reputation, respectively. Therefore, these data are strongly consistent with theprediction of Theorem 1 that CEO reputation (as proxied by tenure and articlecount) positively affects the stock-based pay sensitivities of CEOs.The results of this first test are robust to other specifications. Columns II and III
provide alternative tests of Eq. (20), where in Column II firm size is replaced by thevariance of dollar returns, and Column III includes both the firm size and dollar-return variability controls in addition to CEO age and industry effects. In both cases,the estimated coefficients for the reputation proxies are positive, statistically
T.T. Milbourn / Journal of Financial Economics 68 (2003) 233–262256
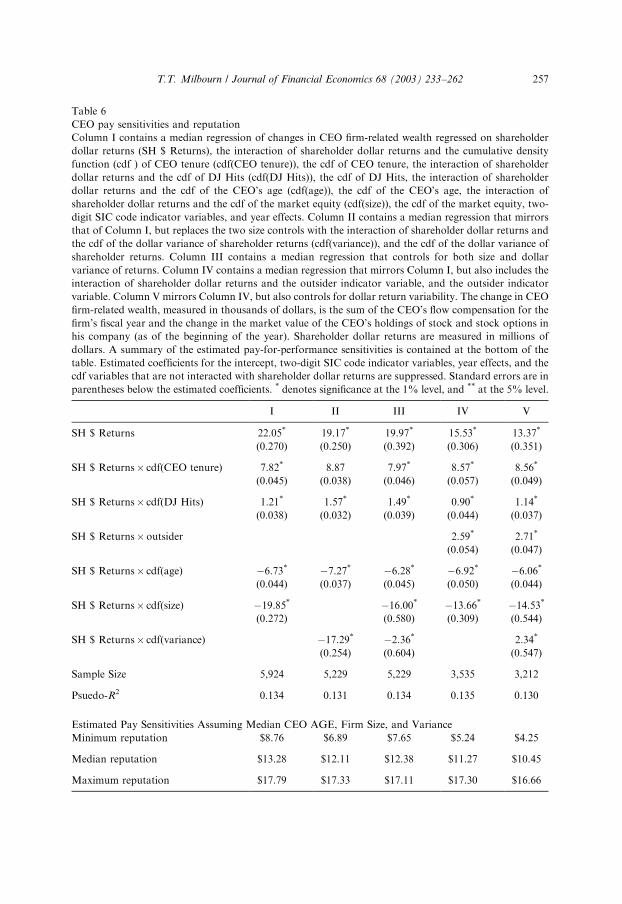
Table 6
CEO pay sensitivities and reputation
Column I contains a median regression of changes in CEO firm-related wealth regressed on shareholder
dollar returns (SH $ Returns), the interaction of shareholder dollar returns and the cumulative density
function (cdf ) of CEO tenure (cdf(CEO tenure)), the cdf of CEO tenure, the interaction of shareholder
dollar returns and the cdf of DJ Hits (cdf(DJ Hits)), the cdf of DJ Hits, the interaction of shareholder
dollar returns and the cdf of the CEO’s age (cdf(age)), the cdf of the CEO’s age, the interaction of
shareholder dollar returns and the cdf of the market equity (cdf(size)), the cdf of the market equity, two-
digit SIC code indicator variables, and year effects. Column II contains a median regression that mirrors
that of Column I, but replaces the two size controls with the interaction of shareholder dollar returns and
the cdf of the dollar variance of shareholder returns (cdf(variance)), and the cdf of the dollar variance of
shareholder returns. Column III contains a median regression that controls for both size and dollar
variance of returns. Column IV contains a median regression that mirrors Column I, but also includes the
interaction of shareholder dollar returns and the outsider indicator variable, and the outsider indicator
variable. Column V mirrors Column IV, but also controls for dollar return variability. The change in CEO
firm-related wealth, measured in thousands of dollars, is the sum of the CEO’s flow compensation for the
firm’s fiscal year and the change in the market value of the CEO’s holdings of stock and stock options in
his company (as of the beginning of the year). Shareholder dollar returns are measured in millions of
dollars. A summary of the estimated pay-for-performance sensitivities is contained at the bottom of the
table. Estimated coefficients for the intercept, two-digit SIC code indicator variables, year effects, and the
cdf variables that are not interacted with shareholder dollar returns are suppressed. Standard errors are in
parentheses below the estimated coefficients. * denotes significance at the 1% level, and ** at the 5% level.
I II III IV V
SH $ Returns 22.05* 19.17* 19.97* 15.53* 13.37*
(0.270) (0.250) (0.392) (0.306) (0.351)
SH $ Returns cdf(CEO tenure) 7.82* 8.87 7.97* 8.57* 8.56*
(0.045) (0.038) (0.046) (0.057) (0.049)
SH $ Returns cdf(DJ Hits) 1.21* 1.57* 1.49* 0.90* 1.14*
(0.038) (0.032) (0.039) (0.044) (0.037)
SH $ Returnsoutsider 2.59* 2.71*
(0.054) (0.047)
SH $ Returns cdf(age) �6.73* �7.27* �6.28* �6.92* �6.06*
(0.044) (0.037) (0.045) (0.050) (0.044)
SH $ Returns cdf(size) �19.85* �16.00* �13.66* �14.53*
(0.272) (0.580) (0.309) (0.544)
SH $ Returns cdf(variance) �17.29* �2.36* 2.34*
(0.254) (0.604) (0.547)
Sample Size 5,924 5,229 5,229 3,535 3,212
Psuedo-R2 0.134 0.131 0.134 0.135 0.130
Estimated Pay Sensitivities Assuming Median CEO AGE, Firm Size, and Variance
Minimum reputation $8.76 $6.89 $7.65 $5.24 $4.25
Median reputation $13.28 $12.11 $12.38 $11.27 $10.45
Maximum reputation $17.79 $17.33 $17.11 $17.30 $16.66
T.T. Milbourn / Journal of Financial Economics 68 (2003) 233–262 257
significant, and economically meaningful as the estimated joint effects of reputationexceed a spread of $9.6
Broadening the set of reputation proxies, Column IV reports the estimatedcoefficients when the third non-performance-based proxy outsider is included.7
Again, each estimated coefficient on the reputation proxies is positive andstatistically significant at the 1% level. Moreover, the economic importance ofthese reputation proxies remains quite large, both jointly and independently.Holding CEO age and firm size fixed at the median levels, pay sensitivities range herefrom $5.24 to $11.27 to $17.30 as a CEO moves from the lowest to the median andthen from the median to the highest joint (CEO tenure/DJ Hits/outsider) reputation,respectively. The estimated coefficients in Column V show that this result is robust tocontrols for the dollar variability of shareholder returns in addition to CEO age andfirm size.The lesson from Table 6 is straightforward, using a variety of proxies for CEO
reputation, pay sensitivities offered to CEOs in practice are strictly increasing inCEO reputation. This is strong empirical evidence in support of the theory thatpredicts just such a relationship.Table 7 summarizes the estimated effects of CEO reputation on pay sensitivities
using industry-adjusted firm performance in addition to the non-performance-basedproxies. I estimate the model using industry-adjusted performance over one year,three years, and five years. Since sample size is reduced as the performance windowincreases, I estimate the model with and without the outsider proxy to maximize thenumber of observations in the samples whenever possible. In all cases, the estimatedcoefficients for the reputation proxies are positive and significantly different fromzero. Column I estimates coefficients for the model where CEO reputation is proxiedby CEO tenure, DJ Hits, and the one-year industry-adjusted performance of thefirm’s stock. Observe that the coefficients on CEO tenure and DJ Hits are onlymarginally affected (in an upward manner), and that the coefficient on Ind-adj Perf 1
Year is $2.57. Thus, to the extent that a CEO’s reputation is positively affected byhow well his firm did relative to the industry while he was CEO, an increase in thismeasure also results in a higher pay sensitivity.A very similar picture emerges when the outsider reputation proxy is added
(Column II), and in addition, when the industry-adjusted performance measure isestimated over longer time periods (Columns III to VI). In all, the empirical controlsof CEO tenure, DJ Hits, outsider, and industry-adjusted stock return performance
6The sample size reported in Columns II and III falls (relative to Column I) from 5,924 observations to
5,229 owing to the data restriction imposed that five years of monthly stock returns are used to estimate
the variance of returns. Note that every time the sample size changes, every variable is renormalized to the
unit interval according to its empirical CDF.7Sample size also varies as different reputation proxies are included. It is maximized when only CEO
tenure and the number of referencing business articles are included. Roughly one-third of the sample is lost
when the insider-outsider proxy is included. When reputation is proxied by past performance, the sample
size is further affected by the length of the time interval over which firm performance is measured relative
to the industry as the CEO must have a tenure with this firm at least as long for the proxy to be
meaningful.
T.T. Milbourn / Journal of Financial Economics 68 (2003) 233–262258
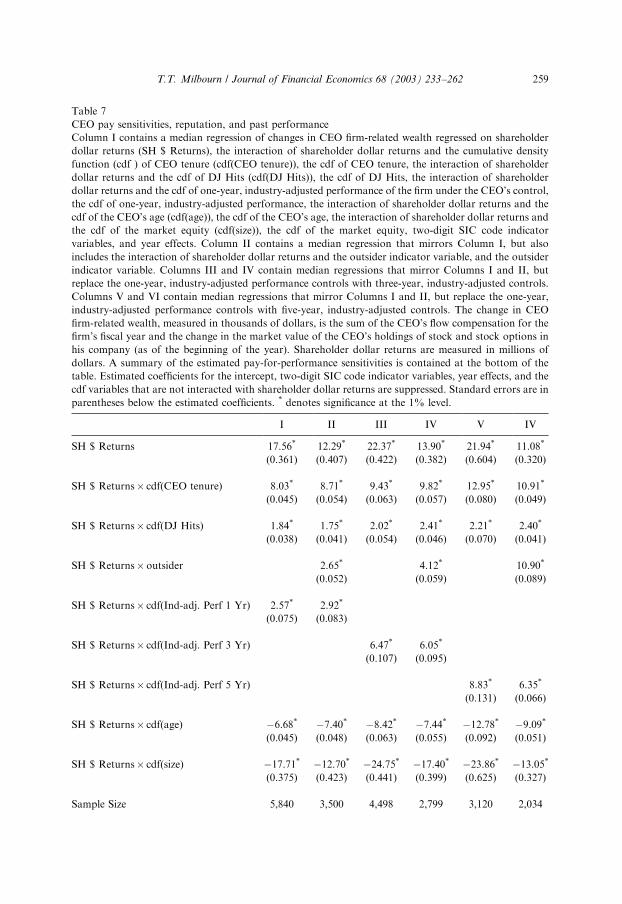
Table 7
CEO pay sensitivities, reputation, and past performance
Column I contains a median regression of changes in CEO firm-related wealth regressed on shareholder
dollar returns (SH $ Returns), the interaction of shareholder dollar returns and the cumulative density
function (cdf ) of CEO tenure (cdf(CEO tenure)), the cdf of CEO tenure, the interaction of shareholder
dollar returns and the cdf of DJ Hits (cdf(DJ Hits)), the cdf of DJ Hits, the interaction of shareholder
dollar returns and the cdf of one-year, industry-adjusted performance of the firm under the CEO’s control,
the cdf of one-year, industry-adjusted performance, the interaction of shareholder dollar returns and the
cdf of the CEO’s age (cdf(age)), the cdf of the CEO’s age, the interaction of shareholder dollar returns and
the cdf of the market equity (cdf(size)), the cdf of the market equity, two-digit SIC code indicator
variables, and year effects. Column II contains a median regression that mirrors Column I, but also
includes the interaction of shareholder dollar returns and the outsider indicator variable, and the outsider
indicator variable. Columns III and IV contain median regressions that mirror Columns I and II, but
replace the one-year, industry-adjusted performance controls with three-year, industry-adjusted controls.
Columns V and VI contain median regressions that mirror Columns I and II, but replace the one-year,
industry-adjusted performance controls with five-year, industry-adjusted controls. The change in CEO
firm-related wealth, measured in thousands of dollars, is the sum of the CEO’s flow compensation for the
firm’s fiscal year and the change in the market value of the CEO’s holdings of stock and stock options in
his company (as of the beginning of the year). Shareholder dollar returns are measured in millions of
dollars. A summary of the estimated pay-for-performance sensitivities is contained at the bottom of the
table. Estimated coefficients for the intercept, two-digit SIC code indicator variables, year effects, and the
cdf variables that are not interacted with shareholder dollar returns are suppressed. Standard errors are in
parentheses below the estimated coefficients. * denotes significance at the 1% level.
I II III IV V IV
SH $ Returns 17.56* 12.29* 22.37* 13.90* 21.94* 11.08*
(0.361) (0.407) (0.422) (0.382) (0.604) (0.320)
SH $ Returns cdf(CEO tenure) 8.03* 8.71* 9.43* 9.82* 12.95* 10.91*
(0.045) (0.054) (0.063) (0.057) (0.080) (0.049)
SH $ Returns cdf(DJ Hits) 1.84* 1.75* 2.02* 2.41* 2.21* 2.40*
(0.038) (0.041) (0.054) (0.046) (0.070) (0.041)
SH $ Returnsoutsider 2.65* 4.12* 10.90*
(0.052) (0.059) (0.089)
SH $ Returns cdf(Ind-adj. Perf 1 Yr) 2.57* 2.92*
(0.075) (0.083)
SH $ Returns cdf(Ind-adj. Perf 3 Yr) 6.47* 6.05*
(0.107) (0.095)
SH $ Returns cdf(Ind-adj. Perf 5 Yr) 8.83* 6.35*
(0.131) (0.066)
SH $ Returns cdf(age) �6.68* �7.40* �8.42* �7.44* �12.78* �9.09*
(0.045) (0.048) (0.063) (0.055) (0.092) (0.051)
SH $ Returns cdf(size) �17.71* �12.70* �24.75* �17.40* �23.86* �13.05*
(0.375) (0.423) (0.441) (0.399) (0.625) (0.327)
Sample Size 5,840 3,500 4,498 2,799 3,120 2,034
T.T. Milbourn / Journal of Financial Economics 68 (2003) 233–262 259
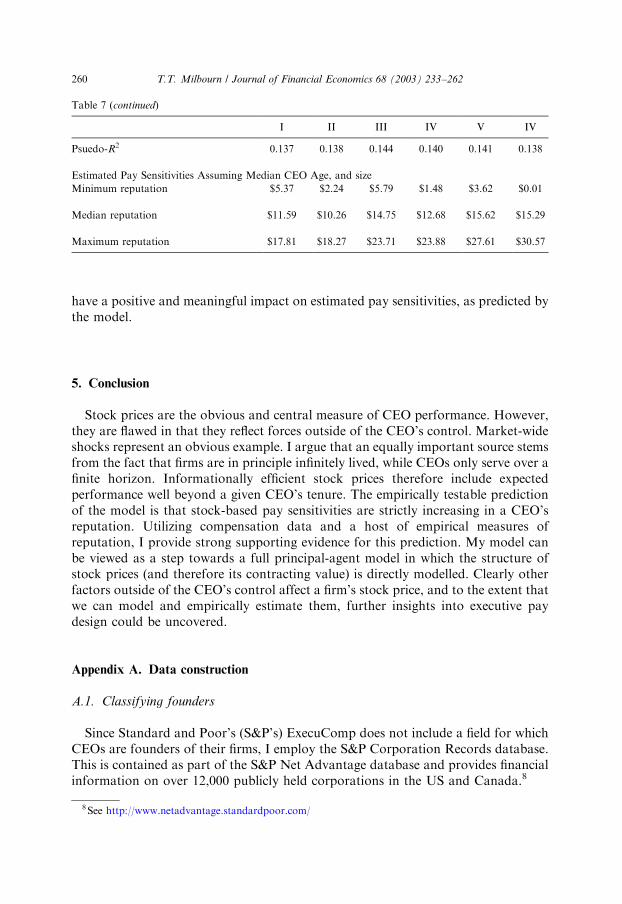
have a positive and meaningful impact on estimated pay sensitivities, as predicted bythe model.
5. Conclusion
Stock prices are the obvious and central measure of CEO performance. However,they are flawed in that they reflect forces outside of the CEO’s control. Market-wideshocks represent an obvious example. I argue that an equally important source stemsfrom the fact that firms are in principle infinitely lived, while CEOs only serve over afinite horizon. Informationally efficient stock prices therefore include expectedperformance well beyond a given CEO’s tenure. The empirically testable predictionof the model is that stock-based pay sensitivities are strictly increasing in a CEO’sreputation. Utilizing compensation data and a host of empirical measures ofreputation, I provide strong supporting evidence for this prediction. My model canbe viewed as a step towards a full principal-agent model in which the structure ofstock prices (and therefore its contracting value) is directly modelled. Clearly otherfactors outside of the CEO’s control affect a firm’s stock price, and to the extent thatwe can model and empirically estimate them, further insights into executive paydesign could be uncovered.
Appendix A. Data construction
A.1. Classifying founders
Since Standard and Poor’s (S&P’s) ExecuComp does not include a field for whichCEOs are founders of their firms, I employ the S&P Corporation Records database.This is contained as part of the S&P Net Advantage database and provides financialinformation on over 12,000 publicly held corporations in the US and Canada.8
Table 7 (continued)
I II III IV V IV
Psuedo-R2 0.137 0.138 0.144 0.140 0.141 0.138
Estimated Pay Sensitivities Assuming Median CEO Age, and size
Minimum reputation $5.37 $2.24 $5.79 $1.48 $3.62 $0.01
Median reputation $11.59 $10.26 $14.75 $12.68 $15.62 $15.29
Maximum reputation $17.81 $18.27 $23.71 $23.88 $27.61 $30.57
8See http://www.netadvantage.standardpoor.com/
T.T. Milbourn / Journal of Financial Economics 68 (2003) 233–262260
As a menu-driven, web-based database, large searches are tedious. However, thewhole sample need not be checked as part of the sample of CEOs is most likelydisqualified if these executives had joined the company prior to becoming CEO. Ieliminate those for further search when the Joined Company date precedes theBecame CEO date in ExecuComp (i.e., those CEOs initially identified as insiderappointments and outsider� 0). The subsample of CEOs who certainly qualify aspotential founders consists of those CEOs for which the Became CEO field matchesthe Joined Company field. Recall that these are the CEOs initially defined as outsideappointments to the CEO post and outsider� 1.I then search the Corporation Records database for all firms employing CEOs for
which outsider� 1 for their Incorporation Year. If the year these executives becameCEO matches the incorporation year, I identify them as founders and let founder �1. Every other CEO is then assigned founder � 0. This yields 65 corporate founders.One additional founder was identified upon a simple examination of CEO tenure.The CEO with the longest tenure, Charles H. Kaman of Kaman Corporation, alsobecame CEO in the year in which the company was incorporated. This was not thecase for the next 10 CEOs that topped the tenure list.
A.2. Identifying Dow Jones Article Counts
In any executive year, the reputation proxy DJ Hits represents the total number ofarticles returned by the Dow Jones Retrieval Service that mention the CEO’s nameat least once over the preceding five-year period.9 That is, if the executive data year is1993, DJ Hits is the total number of articles in which the CEO’s name appears overthe January 1988 to December 1992 time period. To be clear, only the total numberof articles that are identified by the Dow Jones search are recorded in the full sample,and these articles are not individually read to insure that the correct CEO has alwaysbeen identified.10 To minimize some potential errors in the identification process,only the ‘‘Dow Jones—Selected Publications’’ list was searched. This list includes:
* Major News and Business Publications (112 International Publications)* Top 50 US Newspapers (several, such as The New York Times, are alreadyincluded in the first group)
* Wires: Press Release Wires (six newswires)
Invariably, article counts for executives could be understated. For example, thereexists possible misspellings in ExecuComp’s name fields, shortened names (e.g., Billfor William), and so on, which would return an empty or lower count. Or the countcould be overstated due to very common names (e.g., Johnson), names combinedwith Jr. or III, and so on which would return a higher count. However, there seemsno obvious direction that this bias would occur across the large sample of CEOs. In
9See http://www.djinteractive.com/10See Table 2, Panel B for a summary of articles that were read and classified according to their ‘‘tone’’
for a subsample of CEOs.
T.T. Milbourn / Journal of Financial Economics 68 (2003) 233–262 261

addition, the empirical methods employed in the tests of model’s hypotheses,including the use of median regressions and the normalization of the reputationproxies to the unit interval, should alleviate much of the concern for outliers.11
References
Aggarwal, R., Samwick, A., 1999. The other side of the trade-off: the impact of risk on executive
compensation. Journal of Political Economy 107, 65–105.
Baker, G., Hall, B., 2000. CEO incentives and firm size. Unpublished working paper. Harvard Business
School.
Berkovitch, E., Israel, R., Spiegel, Y., 2000. Managerial compensation and capital structure. Unpublished
working paper. Tel Aviv University.
Gibbons, R., Murphy, K.J., 1992. Optimal incentive contracts in the presence of career concerns: theory
and evidence. Journal of Political Economy 100, 468–505.
Hall, B., Liebman, J.B., 1998. Are CEOs really paid like bureaucrats? Quarterly Journal of Economics
111, 653–691.
Hermalin, B., Weisbach, M., 1998. Endogenously-chosen boards of directors and their monitoring of the
CEO. American Economic Review 88, 96–118.
Himmelberg, C., Hubbard, R.G., 2000. Incentive pay and the market for CEOs: an analysis of pay-for-
performance sensitivity. Unpublished working paper. Columbia University.
Holmstrom, B., 1979. Moral hazard and observability. The Bell Journal of Economics 10, 74–91.
Jensen, M., Murphy, K.J., 1990. Performance pay and top-management incentives. Journal of Political
Economy 98, 225–262.
Jewitt, I., 1988. Justifying the first-order approach to principal-agent problems. Econometrica 56-5,
1177–1190.
Murphy, K.J., 1999. Executive compensation. In: Ashenfelter, O., Card, D. (Eds.), Handbook of Labor
Economics. North Holland, Amsterdam, pp. 2485–2563.
Rogerson, W., 1985. Repeated moral hazard. Econometrica 53, 69–76.
Warner, J., Watts, R., Wruck, K., 1988. Stock prices and top management changes. Journal of Financial
Economics 20, 461–492.
11 I would like to thank Jacob Lin, Adam Peiper, Justin Barry, Michael Chandra, Jonathan Cohn,
Rajeev Darolia, Alaina Griswold, Zafar Khan, Jon Lutinski, Cathleen Tsui, and Julie Wilhelm for their
research assistance on this arduous data-collection process.
T.T. Milbourn / Journal of Financial Economics 68 (2003) 233–262262