cereals and feeding stuff production, consumption and
TRANSCRIPT

CRL for Cereals and Feeding Stuff
National Food Institute
Danish Technical University
Cereals and feeding stuff – production, consumption and pesticides
(Version 3)
Karen Hjorth Susan Strange Herrmann, Hanne Bjerre Christensen and Mette Erecius Poulsen
27 February 2009

National Food Institute, The Danish Technical University
2
Table of content 1. Introduction .............................................................................................................. 32. Cereals ...................................................................................................................... 4
2.1. Consumption of cereals in the EU-member states ........................................... 52.2. Pesticides authorised for use in cereals ............................................................ 72.3. Intake of pesticides from cereals .................................................................... 11
3. Feeding stuff ........................................................................................................... 133.1. Consumption of feeding stuff in EU ............................................................... 133.2. Composition of feed ....................................................................................... 163.3. Pesticides authorised for use in feeding stuff ................................................. 18
4. MRLs for pesticide residues in feeding stuff and toxicological data on widely authorised pesticide ........................................................................................................ 225. Feasibility to include the pesticide in multiresidue methods .................................. 236. References .............................................................................................................. 24

National Food Institute, The Danish Technical University
3
1. Introduction One of the most important tasks of the Community Reference Laboratory (CRL) for Pesticides in Cereals and Feeding stuff (CRL-CF) is to give advice to the Commission concerning the prioritisation of the work on method development. To enable the prioritization, various information has been collected and evaluated. The information concerns the following subjects within the Member States (MS):
- Production - Consumption - Pesticides authorised for use in cereal production - MRLs for pesticide in cereal and toxicological data on the authorised pesticides,
e.g. ADI and ARfD - Intake of pesticides from cereals - Feasibility to include the pesticide in multi residue method
This document (version 3) is an update of the document prepared in 2007 (version 1). The analysis of undesirable contaminants in various food and feed samples is nowadays a problem of primary concern for quality control laboratories due to human and animal health risks associated with the accumulation of these substances. Contaminants of animal feed can cause harmful health effects in the animals and may be harmful to people through secondary exposure of consumers to contaminants deriving from these animals. In the European Union (EU), feeding stuffs are subject to legislation covering their composition, manufacture, storage, transport and usage1. Because of the above listed this 3rd version is extended with a chapter on feeding stuff including sections on consumption of feeding stuff and import of feeding stuff in regard to a future monitoring program on feeding stuff.

National Food Institute, The Danish Technical University
4
2. Cereals The MS with the largest production of cereals in 2006 were France, Germany, Poland, United Kingdom and Italy. The total cereal production in these countries amounted to 62, 44, 22, 21 and 19 million ton, respectively and the main producers of wheat were France, Germany, UK, Poland and Romania. The production figures for cereals in 2006 are presented in more detail in Table 2.1 (the figures are from “Agriculture in the European Union – Statistical and economic information 2007”2
Table 2.1. Production figures for EU-25a and the six largest producers of cereals in total, wheat, barley, oat, rye, rice, and maize in the European Union in 2006
). The production figures are presented for the five largest producers of cereal in total, wheat, barley, oat, rye, maize and rice.
2. Cereal
in total b
Common Wheat
Durum wheat
Barley Oat d Rye c Maize Rice
EU-25a 245.2 108.6 8.9 54.8 11.1 6.7 44.8 2.6 Austria 0.8 Czech Rep.
Denmark 3.3 0.1 Finland 1.1 France 61.6 33.3 2.1 10.4 0.1 12.9 0.1 Germany 43.5 22.4 12.0 0.9 2.7 4.1 Greece 1.1 0.2 Hungary 8.3 Italy 18.7 3.9 9.7 1.4 Poland 21.8 7.1 4.2 2.8 Portugal 0.2 Romania 5.5 Spain 1.6 8.3 0.9 0.2 3.5 0.8 Sweden UK 20.9 14.7 5.3 0.7 a: EU-25: Including 25 member states. b: Total cereal production not including rice. c: including meslin. d: including mixed cereals.
National Food Institute, The Danish Technical University
5
2.1. Consumption of cereals in the EU-member states
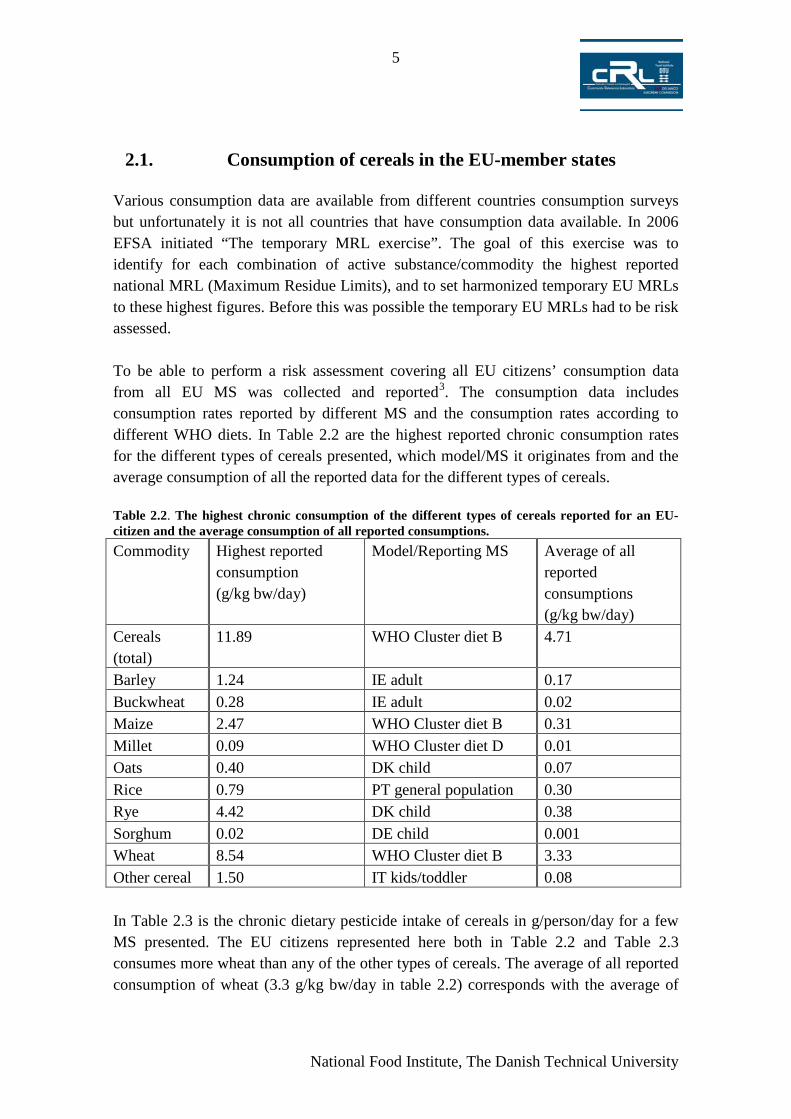
Various consumption data are available from different countries consumption surveys but unfortunately it is not all countries that have consumption data available. In 2006 EFSA initiated “The temporary MRL exercise”. The goal of this exercise was to identify for each combination of active substance/commodity the highest reported national MRL (Maximum Residue Limits), and to set harmonized temporary EU MRLs to these highest figures. Before this was possible the temporary EU MRLs had to be risk assessed. To be able to perform a risk assessment covering all EU citizens’ consumption data from all EU MS was collected and reported3
Table 2.2
. The consumption data includes consumption rates reported by different MS and the consumption rates according to different WHO diets. In are the highest reported chronic consumption rates for the different types of cereals presented, which model/MS it originates from and the average consumption of all the reported data for the different types of cereals. Table 2.2. The highest chronic consumption of the different types of cereals reported for an EU-citizen and the average consumption of all reported consumptions. Commodity Highest reported
consumption (g/kg bw/day)
Model/Reporting MS Average of all reported consumptions (g/kg bw/day)
Cereals (total)
11.89 WHO Cluster diet B 4.71
Barley 1.24 IE adult 0.17 Buckwheat 0.28 IE adult 0.02 Maize 2.47 WHO Cluster diet B 0.31 Millet 0.09 WHO Cluster diet D 0.01 Oats 0.40 DK child 0.07 Rice 0.79 PT general population 0.30 Rye 4.42 DK child 0.38 Sorghum 0.02 DE child 0.001 Wheat 8.54 WHO Cluster diet B 3.33 Other cereal 1.50 IT kids/toddler 0.08 In Table 2.3 is the chronic dietary pesticide intake of cereals in g/person/day for a few MS presented. The EU citizens represented here both in Table 2.2 and Table 2.3 consumes more wheat than any of the other types of cereals. The average of all reported consumption of wheat (3.3 g/kg bw/day in table 2.2) corresponds with the average of

National Food Institute, The Danish Technical University
6
the chronic intakes reported by the different MS (table 2.3). According to the Danish and German consumption data, rye accounts for the second largest fraction of the total daily cereal consumption. Rice accounts for the second largest fraction of the total daily cereal consumption when referring to the data covering France and UK. Table 2.3. The chronic dietary intake of cereals in g/person/day according to models often used for risk assessment of the dietary intake.
Consumption (g/kg bw/day) Cereals
in total Barley Buck-
wheat Maize Oat Rice Rye Wheat
Denmark4
Adult (74 kg bw)
2.89 0.11 0.086 0.68 2.0
Children (22 kg bw)
10.41 0.40 0.10 4.42 5.51
France5
General population (60 kg bw)
3.52 0.01 0.11 3.28
Toddler (10.6 kg bw)
2.98 0.36 2.62a
Germany6
Children Age 2-5 (16.5 kg bw)
5.45 0.01 0.01 0.15 0.2 0.26 0.78 4.04
UK7
Adults (76 kg bw)
2.09 0.003 L/C 0.003 0.02 0.37 0.01 1.67
Young chil-dren/Toddler (14.5 kg bw)
4.55 0.01 L/C 0.01 0.05 0.58 0.01 3.94
a: The type of commodity stated in the reference is ”bread” and it is assumed that all the bread is wheat bread. Thus, since the cereal consumed in largest amounts is wheat, wheat could also be the type of cereal contributing most to the human exposure to pesticide residue. This is though depending on the frequency and amounts with which residues are found in wheat compared to the other types.
National Food Institute, The Danish Technical University
7
2.2. Pesticides authorised for use in cereals
When prioritising the work on method development it is relevant to consider which pesticides are authorised for use on cereal commodities since residues of these pesticides could be expected. A complete list of all authorised uses in the different MS would be a helpful tool. However, such a list is not available. Lists of which pesticides are authorised for use in the MS are available on the EU CIRCA Database. Unfortunately, this list does not include information on which crops the pesticides are authorised for and it is therefore not possible to evaluate which pesticides are authorised for which types of cereals in which MS. Additionally, no information is given on how frequently the pesticides in fact are used on cereals. Information on authorisations are however available but these are non-exclusive since they only include information about some MS or for a part of the pesticides available on the European marked. The Faculty of Agricultural Sciences, Aarhus University, Denmark has as part of a project financed by the Danish EPA compiled lists of pesticides authorised for use in wheat and four other commodities in the different northern and central EU MS. The report in Danish was published by the Danish EPA in 20078 Table 2.4. In a list of pesticides authorised for use in wheat in 1) more than 14 MS and 2) more than 9 but less than 14 of the 17 MS evaluated is shown. Data on the frequency or which amounts of the pesticides have been used is not available. From Table 2.4 it can be seen that the triazoles are an often authorised type of fungicide in the northern and central European MS. In the group of herbicides the sulfonyl urea type are widely represented. The list of authorised insecticides vary from MS to MS which results in only one insecticide authorised in 14 or more of the 17 MS. The most frequently authorised type of insecticide was the pyrethroids. In the 17 MS were only seven different plant growth regulator authorised for use on wheat. The plant growth regulators authorised in most MS were chlormequat, trinexapac and ethephon. These plant growth regulators were authorised for use on wheat in 15, 14 and 12 of the 17 MS, respectively. Only two types of insecticides are authorised for use in wheat in France. These are not represented by the active substances authorised for use in more than 9 other MS.

National Food Institute, The Danish Technical University
8
Table 2.4. A summary of data8 on which fungicides, herbicides, insecticides and plant growth regulators are authorised for use in wheat in 1) 14 or more and 2) more than 9 but less than 14 of 17 northern and central European member states + France. Pesticide authorised for use in wheat ≥14 MS 14 > MS > 9 Fungicides Azoxystrobin Carbendazim Epoxiconazole Carboxin Fenpropidin Chlorothanlonil Fenpropimorph Cyproconazole Kresoxim-methyl Difenoconazole Prochloraz Fludioxonyl Propioconazole Fluoxastrobin Spiroxamine Flutriafol Tebuconazole Guazatine Trifloxystrobin Mancozeb Metconazole Picozystrobin Prothioconazole Pyraclostrobin Triadimenol Triticonazole Herbicides 2,4-D Bentazone Amidosulfuron Carfentrazone-ethyl Dichlorprop-P Dicamba Fenoxaprop-P Diflufenican Florasulam Flupyrsulfuron methyl Fluroxypyr Isoproturon Glyphosate Metsulfuron Iodosulfuron-methyl-sodium Propoxycarbazone MCPA Thifensulfuron Mecoprop-p Triasulfuron Pendimethalin Tribenuron Sulfosulfuron Insecticides Lambda-Cyhalothrin Alpha-cypermethrin Deltamethrin Esfenvalerate Pirimicarb Plant growth regulators Chlormequat Ethephon Trinexapac In connection with the work performed by EFSA with setting TMRLs, information on authorised uses of 77 pending substances from 20 MS have been collected. Authorised uses have been collected for e.g. wheat (including spelt and triticale), oat, rye, rice, maize and barley. The collected data include information on authorised uses from 13 northern European MS and 7 southern European MS. The complete lists are available on the CIRCA database9 Table 2.5. In and table 2.6 are listed the top three most often authorised pesticides for each of the cereals types; wheat, oat, rye, rice, maize and

National Food Institute, The Danish Technical University
9
barley. In many cases more than one pesticide is authorised in equal number of MS. More than one pesticide can therefore in Table 2.5 occur as e.g. the second most often authorised pesticide. The number of MS in which the top three pesticides are authorised is presented in brackets in the tables. Table 2.5. The group of most often authorised pesticides for use in cereals in 13 northern European member states. In brackets is the number of MS the pesticide(s) are authorised for use in cereals in presented9. List of authorised pesticides in NORTHERNa European MS. 1 2 3 Wheat Fenpropidin
(11)
Metconazole Tebuconazole (10)
Cyproconazole Epoxiconazole Fludioxonyl (9)
Oat Tebuconazole (7)
Carboxin Fludioxonyl Pirimicarb (6)
Epoxiconazole Zeta-cypermethrin (5)
Rye Fludioxonyl (9)
Epoxiconazole Tebuconazole (8)
Cyproconazole Flusilazole (7)
Riceb Maize Fludioxonyl
Terbuthylazine (5)
Carboxin (4)
Glufosinate (3)
Barley Fenpropidin Tebuconazole (10)
Cyproconazole Epoxiconazole Fludioxonyl Metconazole (9)
Flusilazole Flutriafol (8)
a Including Austria, Belgium, Czech republic, Denmark, Estonia, Germany, Latvia, Luxembourg, Poland, Slovak Republic, Sweden, The Netherlands and United Kingdom. b Only few pesticides authorised for use in UK. No pesticides are authorised for use in the other northern member states. Table 2.6. The group of most often authorised pesticides fore use in cereals in 7 southern European member states. In brackets is the number of MS the pesticide(s) are authorised for use in cereals in presented9. List of authorised pesticides in SOUTHERNa European MS.

National Food Institute, The Danish Technical University
10
1 2 3 Wheat Tebuconazole
(6) Diclofop Epoxiconazole Flusilazole Pirimicarb (4)
Cyproconazole Diniconazole Fenbuconazole (3)
Oat Pirimicarb (4)
Cyproconazole Epoxiconazole Tebuconazole (3)
Carboxin Metconazole (2)
Rye Cyproconazole Epoxiconazole Pirimicarb Tebuconazole (3)
Metconazole (2)
Rice Oxadiazon (5)
Propanil (4)
Tebufenozide (2)
Maize Tefluthrin Terbuthylazine (5)
Ethoprophos Fludioxonyl Zeta-cypermethrin (3)
Carboxin Malathion Trichlorfon (2)
Barley Tebuconazole (5)
Diclofop Epoxiconazole Flusilazole Pirimicarb (4)
Cyproconazole Diniconazole Tetraconazole (3)
a Including Greece, France, Hungary, Italy, Portugal, Slovenia and Spain. b Other authorised pesticides only authorised in one MS. Table 2.5 and table 2.6 show that the triazole type pesticides are often authorised for use in cereals. This is especially true for wheat, oat, rye and barley. Many of the pesticides are authorised for use both in the northern and southern EU. Even though a pesticide is authorised for use it is not given that residues will be found. The participating states in the EU monitoring program have reported the ten most frequently found pesticides10. The most frequently found pesticides in wheat were mainly insecticides in 2006, and this is in line with the findings of previous years. More specifically the most often found compounds using multi residue method were: Primiphos-methyl, chlorpyrifos-methyl, deltamethrin, malathion, dichlorvos, chlormequat, piperonyl butoxide, chlorpyrifos and permethrin. Most often found compounds for single residue methods were: Chlormequat, hydrogen phosphide, mepiquat, glyphosate, bromide, benomyl group, spiroxamine, maneb group, trinexapac ethyl, and phosphine.

National Food Institute, The Danish Technical University
11
The majority of these pesticides often found in the EU monitoring program are also represented in the table of often authorised pesticides (Table 2.4 –table 2.6). 3 compounds are identical concerning most frequently findings and authorised for use: spiroxamin, glyphosate, and chlormequat. A reason for the lack of connection could be that not all authorised pesticides are included in the monitoring programs. Another reason could be that monitoring programs often are made up based on the fruit and vegetables programs and in this way important pesticides are left out in the monitoring program for cereals. Finally the list of authorised pesticides may include pesticides that are induced early in the season and therefore are not found at the time of harvesting. Each year the EU monitoring program contains one kind of crop which is renewed each year. In 2004 it was rye/oat and in 2006 it was wheat which represented the cereals11
Table 2.7.
presents in percent the results obtained for these two commodities in the EU monitoring program, in regard to samples without, with residues below or at MRL and with residues exceeding the MRL. Table 2.7. Residues found in wheat and rye/oat analysed by the EU co-ordinated monitoring program11. Without detectable
residue % With residues below or at MRL
With residues above MRL
Wheat (2006) 73 27 0.1 Rye/oat (2004) 81 19 0.6 More wheat samples are found to contain residues below or at MRL compared to rye/oat. However on the other hand exceeding of the MRLs were more often found for rye/oat compared to wheat. Since rye and oat also often is used as feed material and residues are found in quantity similar to wheat a monitoring of this crops would be interesting for a future monitoring program for feed.
2.3. Intake of pesticides from cereals
Intake calculations are not available for many European Countries and if they are available they are often not easily digested down to the intake of pesticides from cereals. The focus is often on the intake from fruit and vegetables since the primary intake is from these food items. The intake of pesticide residues from cereals has been evaluated on the basis of Danish consumption data and on the results of the Danish monitoring program12. The total intake of pesticide residues from cereals was estimated to 18 µg/day/person in 2007. The intake from wheat alone was estimated to 15.4 µg/day/person. The estimated intake

National Food Institute, The Danish Technical University
12
from cereals accounted for 21% of the estimated total intake of pesticide residues from food and beverages which was 83 µg/day. Intake calculations from cereals based on cereal consumption data and monitoring data from European countries besides Denmark is a challenge and have been lacking in previous versions of the paper. The reason for this is that results from the EU coordinated monitoring program and the MS national programs are reported by the individual MS in intervals and intake calculations can not be calculated on such intervals. Earlier in this document it has been concluded that EU citizens in general consume more wheat than any of the other types of cereals. It has also been concluded that the consumption of wheat for an average EU citizen is in the same order as for a Danish citizen. So if it also could be documented that the residues found in Denmark and other EU member states are similar (quantitatively and qualitatively) the intake of pesticides from cereals by EU citizens could be estimated to be similar to the estimated Danish intake. The studies available in the literature are cases studies reporting the intake of a certain group of pesticide13, e.g. organochlorine pesticides or dithiocarbonates. We have therefore looked at the results in the EU monitoring report from 200614
In comparison, data from the Danish monitoring program revealed that chlormequat and pirimiphos-methyl were found in 33% and 17.5% of the wheat samples. This should be hold up against the average consumption of wheat for an EU-citizen, 3.3 g/kg bw/day and a Danish citizen, 2.0 g/kg bw/day
and will compare with the monitoring data used for estimating of the Danish intake. In 2006 were 1531 samples of wheat analysed, 1112 samples were without detectable residues (73%), 417 samples were with residues below or at MRL (40.8%), and 2 were with residues above MRL (0.1%). The main pesticide-commodity where detectable residues were found most frequently in wheat was chlormequat and pirimiphos-methyl, in 36.41% and 10.27% of wheat samples, respectively (all other pesticides occurred in ≤ 5% of the samples).
Table 2.3. Danish people have in many years eaten less wheat than an average EU-citizen instead they eat more rye and oat. But in 2007 wheat was the second most important crop concerning the residues of pesticide in Denmark and rye bread was only number 20 on that list which means that in this perspective the Danish diet are more similar to the European diet than ever before. And because the most frequently found pesticides are the same and found with same frequency and because the consumption of wheat is also in the same order (Danish versus EU) it would be expected that the estimated intake for Danish citizens is similar to the average intake of the EU citizens.

National Food Institute, The Danish Technical University
13
3. Feeding stuff Within the EU-25 about 450 million tons of feeding stuffs are consumed by livestock each year. Of this quantity 215 million tons mostly are roughages grown and used on the farm of origin. The balance, i.e. 235 million tons of feed, includes cereals or other feeding stuff grown and used on the farm of origin (51 million tons) and feed purchased by livestock producers to supplement their own feed resources (either feed materials or compound feed)15. The market for feeding stuffs depends on the market for livestock products and vice versus. In 2006, the EU-25 livestock population produced 45 million tons of meat (thereof 8 million tons of beef, 21 million tons of pork and 11 million tons of poultry meat), 131 million tons of milk and 6 million tons of eggs. Average per capita consumption of meat in 2006 was 93.4 kg, compared to only 50 kg in the EC-6 during the late 1950s. The value of livestock production - amounting to €130 billion - accounts for 42% of the overall EU-25 agricultural output amounting to €309 billion in 2006. Germany is the leading cattle meat producer, Spain is now the leader for pig meat and France clearly breaks away from the other countries for poultry meat production16
3.1. Consumption of feeding stuff in EU
. The primary producers of milk in the EU are Germany and France. The countries having a large production of meat, milk or other animal products must also have a high production/import of fodder.
Feeding stuff may be comprised of a wide range of ingredients. In council directive 92/25/EC of 29 April 1996 is presented a non-exclusive list of the main feed materials. This list include cereal grains, a wide range of by products from different cereal processing’s, e.g. cereal bran and middling, a wide range of different by-products of the manufacturing of oil (e.g. rapeseed, palm kernel, soybeans, cotton seed, sunflower seeds, linseeds, cocoa bean), sugar (e.g. sugar beet pulp and molasses), different potato products (e.g. pulp, starch, protein, flakes), fruit juice (e.g. citrus pulp, tomato pulp). The list also includes legume seeds, alfalfa, clover, grass and cereal straw17
Some of the information and illustrations in the following are from a presentation by Finn Vestergaard from DLG given at CRL workshop in Copenhagen in 2008. The presentation is available at http://www.crl-pesticides.eu.
.
National Food Institute, The Danish Technical University
14
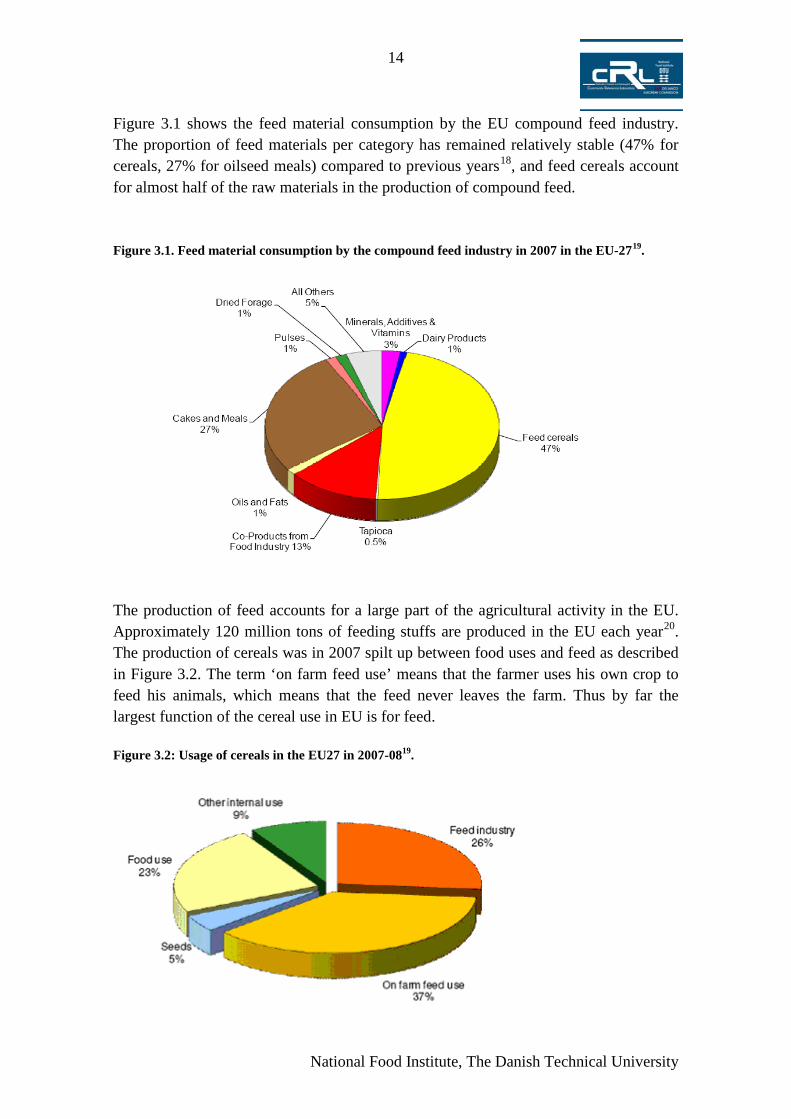
Figure 3.1 shows the feed material consumption by the EU compound feed industry. The proportion of feed materials per category has remained relatively stable (47% for cereals, 27% for oilseed meals) compared to previous years18
, and feed cereals account for almost half of the raw materials in the production of compound feed.
Figure 3.1. Feed material consumption by the compound feed industry in 2007 in the EU-2719
.
The production of feed accounts for a large part of the agricultural activity in the EU. Approximately 120 million tons of feeding stuffs are produced in the EU each year20
Figure 3.2
. The production of cereals was in 2007 spilt up between food uses and feed as described in . The term ‘on farm feed use’ means that the farmer uses his own crop to feed his animals, which means that the feed never leaves the farm. Thus by far the largest function of the cereal use in EU is for feed. Figure 3.2: Usage of cereals in the EU27 in 2007-0819.
National Food Institute, The Danish Technical University
15
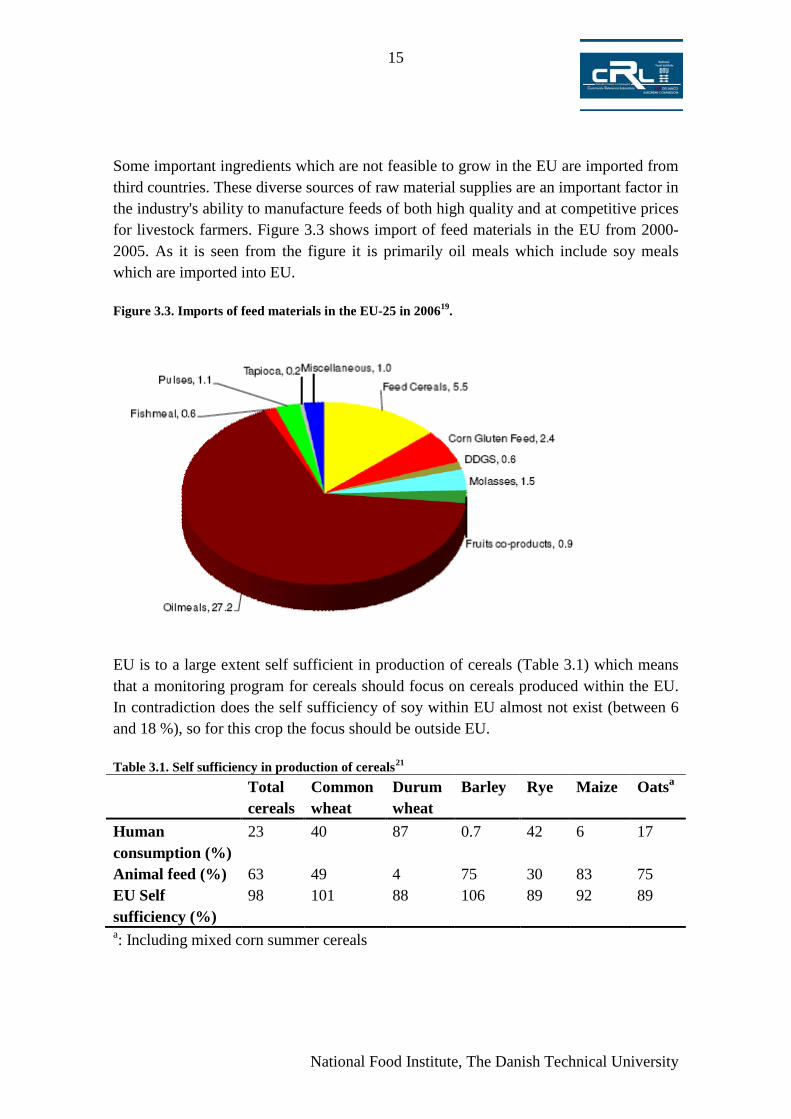
Some important ingredients which are not feasible to grow in the EU are imported from third countries. These diverse sources of raw material supplies are an important factor in the industry's ability to manufacture feeds of both high quality and at competitive prices for livestock farmers. Figure 3.3 shows import of feed materials in the EU from 2000-2005. As it is seen from the figure it is primarily oil meals which include soy meals which are imported into EU. Figure 3.3. Imports of feed materials in the EU-25 in 200619.
EU is to a large extent self sufficient in production of cereals (Table 3.1) which means that a monitoring program for cereals should focus on cereals produced within the EU. In contradiction does the self sufficiency of soy within EU almost not exist (between 6 and 18 %), so for this crop the focus should be outside EU. Table 3.1. Self sufficiency in production of cereals21
Total cereals
Common wheat
Durum wheat
Barley Rye Maize Oatsa
Human consumption (%)
23 40 87 0.7 42 6 17
Animal feed (%) 63 49 4 75 30 83 75 EU Self sufficiency (%)
98 101 88 106 89 92 89
a: Including mixed corn summer cereals

National Food Institute, The Danish Technical University
16
As the fourth most produced grain in the world, after maize, wheat and rice, soybean has the highest content of proteins. Besides its potential as a nutrient for both humans and animals, this legume also enriches the soil with nitrogen through biological processes. Only four countries, the USA, Brazil, Argentina and China, are responsible for approximately 90% of the world production and these countries are also nearly EU’s exclusive trading partners for soybeans and soy meal imports. Over recent years, there has been an increase in worldwide soybean production, as well as in the import/export and processing of soybeans. Brazil is the second largest producer of soybeans in the world. Much of the soybean production in Brazil, around 19 million tons of the 2004/2005 crops, is exported to several countries on different continents22. The degree of self-sufficiency in EU varies between 6% (soy meal) and 18% (soy oil) in 1998/9923
3.2. Composition of feed
.
When establishing a pesticide control for feed an evaluation of the division between human consumption/animal feed versus the daily feed ration for animal is needed to estimate which feeding stuff to attach importance in the control. A starting point could be to focus on the crop/products which make up the largest fraction of an average feed ration for a given type of livestock. An important crop for animal feed is maize. Table 3.1 show Europe is almost self sufficient and that animals consume 83 % of the production of maize. An example is given in Table 3.2 where almost half of the daily feed ration for a Danish dairy cow is maize silage. Besides maize half of the wheat production in EU is consumed by animals and 75 % of barley and oat production. But the production of barley and oat is smaller than the production of maize, wheat, and rice. Table 3.2. Daily ration for a Danish dairy cow19.
Kg Dry matter
Clover grass silage 3.5
Maize silage 9
Straw 0.5
Minerals 0.2
Compound feed 7
Total 20.2
According to Table 3.3 the proportion of soy in animal feed can be 10-30% of the dry matter depending on the livestock species which is in the same order of magnitude as what can be estimated from the information in Table 3.2. Since about 30% of the 7 kg drymatter in a daily portion for a dairy cow is accounted for by cakes and meals.

National Food Institute, The Danish Technical University
17
Exceedings found in soy products from the UK monitoring are listed in an Annual Report of the Pesticide residues committee 2006 of samples collected throughout 2006. The main findings were: - Out of 60 samples of soy milk, five samples contained endosulfan. - Out of 60 samples of soy pieces and tofu, 11 contained residues of glyphosate, five contained residues of endosulfan and one contained residues of diazinon24
In Guidance document for Directive 91/414, Appendix G a table give examples of how a feed for pig, beef cattle, diary cattle and hens can be comprised. The table is included in this document as
.
Table 3.3 According to this table beef and diary cattle can be feed on a 100% grass, silage or hay. A major constituent in feed for pigs can be grains (up to 80%) and root and tuber vegetables (e.g. sugar beet)(up to 60%). Table 3.3. Maximum feed intakes expressed in percentages terms for certain feeding stuffs frequently used in the nutrition of the four indicator livestock species. The table is from the Guidance document for Directive 91/414, Appendix G: Livestock feeding studies. From the information presented here it can be agued that residues occurring in feed materials as grass, silages, hay and cereals are at great relevance if the residues in feed are to be monitored.

National Food Institute, The Danish Technical University
18
3.3. Pesticides authorised for use in feeding stuff
The difficulties with pesticide residue analysis of animal feed samples are caused by the fact that these matrices are burdened with large quantities of interfering matrixes after extraction. Animal feeds can be complex mixtures that include constituents such as grains, milling by-products, added vitamins, minerals, fats, and other nutritional and energy sources. Even simpler cereal matrices contain much more co-extractants than typical matrices of high water content such as fruits and vegetables. Additionally, the exact composition of the sample is often unknown to the testing laboratory. The report published by the Danish EPA in 2007 mentioned in section 2.2 also includes information on pesticides authorised for use in rape and maize25
Table 3.4
. Rapeseed and maize are potential feeding stuff constituents. Meal cake of rapeseed and other by products from the rapeseed oil production is also used as fodder. The information on pesticides authorised for use on rapeseed and maize is summarised in and Table 3.5. Barley is also a potential feeding stuff constituent and from Table 2.5 it is indicated that the analysis of e.g. several triazoles could be of relevance when analyzing barley. The pesticides included in the top 3 list of pesticides authorised for use in maize (Table 3.5) is not all included in the list of most often authorised pesticides in Table 2.5. This indicates that several of the most often authorised pesticides for use in maize are not included in the list of the 77 substances pending in the EU authorisations system. Table 3.4. Pesticides authorised for use in rapeseed in ten or more of 17 member states and in less than 10 but more than 5 member states.
Pesticide authorised for use in rapeseed ≥10 MS 10 > MS > 5 Fungicides Iprodione Azoxystrobin Metconazole Carbendazim Prochloraz Fludioxonyl Tebuconazole Metalaxyl-M Procymidone Thiram Vinclozolin Herbicides Clomazone Dimethachlor Clopyralid Cycloxydim Diquat (dibromide)

National Food Institute, The Danish Technical University
19
Fluazifop-P Glufosinate
Glyphosate (incl trimesium aka sulfosate)
Haloxyfop-R Metazachlor Napropamide Propaquizafop Propyzamide Quinmerac Quizalofop-P Trifluralin Insecticides alpha-Cypermethrin (aka
alphamethrin) Esfenvalerate
beta-Cyfluthrin
Methiocarb (aka mercaptodimethur)
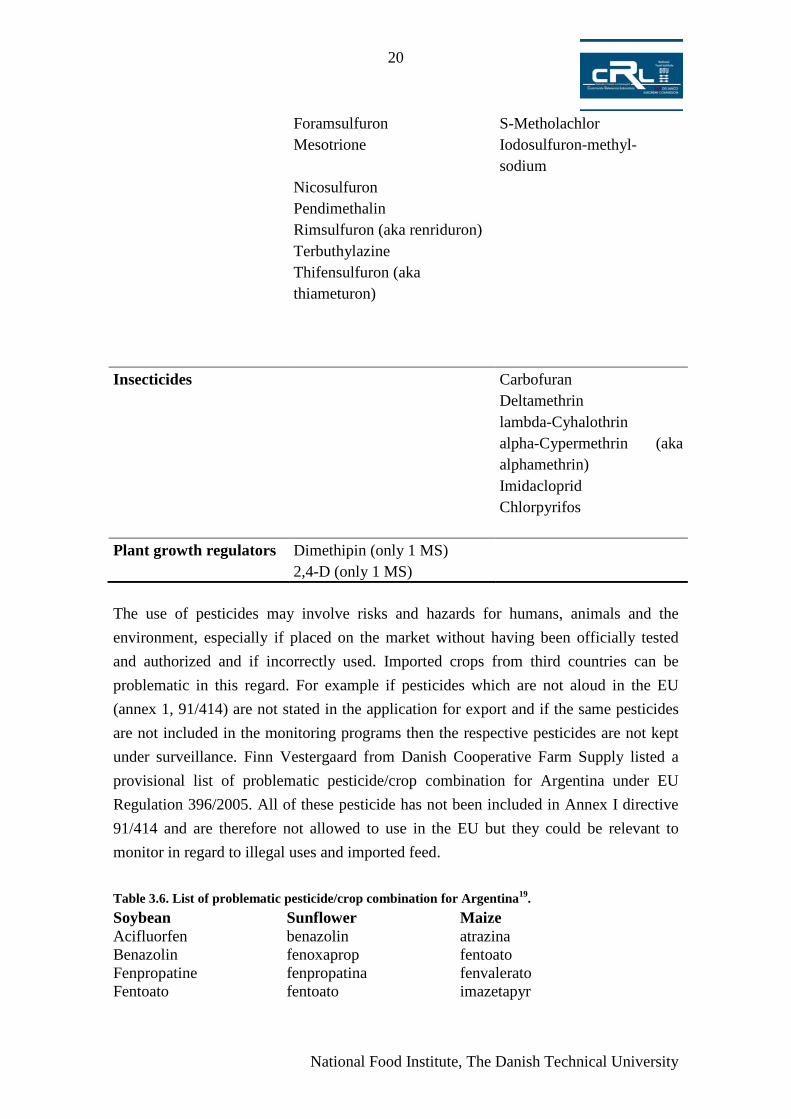
Cypermethrin Phosalone Deltamethrin Pirimicarb Imidacloprid tau-Fluvalinate lambda-Cyhalothrin Thiacloprid zeta-Cypermethrin Thiamethoxam Plant growth regulators Chlorpropham (only 3 MS) Trinexapac (only 3 MS) Table 3.5. Pesticides authorised for use in maize in ten or more of 17 member states and in less than 10 but more than 5 member states.
Pesticide authorised for use in Maize ≥10 MS 10 > MS > 5 Fungicides Fludioxonyl Metalaxyl-M Thiram Herbicides Bentazone 2,4-D
Bromoxynil Glyphosate (incl trimesium aka sulfosate)
Clopyralid Dimethenamide Dicamba Linuron Fluroxypyr Isoxaflutole
National Food Institute, The Danish Technical University
20
Foramsulfuron S-Metholachlor Mesotrione Iodosulfuron-methyl-
sodium Nicosulfuron Pendimethalin Rimsulfuron (aka renriduron) Terbuthylazine
Thifensulfuron (aka thiameturon)
Insecticides Carbofuran Deltamethrin lambda-Cyhalothrin
alpha-Cypermethrin (aka alphamethrin)
Imidacloprid Chlorpyrifos Plant growth regulators Dimethipin (only 1 MS) 2,4-D (only 1 MS) The use of pesticides may involve risks and hazards for humans, animals and the environment, especially if placed on the market without having been officially tested and authorized and if incorrectly used. Imported crops from third countries can be problematic in this regard. For example if pesticides which are not aloud in the EU (annex 1, 91/414) are not stated in the application for export and if the same pesticides are not included in the monitoring programs then the respective pesticides are not kept under surveillance. Finn Vestergaard from Danish Cooperative Farm Supply listed a provisional list of problematic pesticide/crop combination for Argentina under EU Regulation 396/2005. All of these pesticide has not been included in Annex I directive 91/414 and are therefore not allowed to use in the EU but they could be relevant to monitor in regard to illegal uses and imported feed. Table 3.6. List of problematic pesticide/crop combination for Argentina19. Soybean Sunflower Maize Acifluorfen benazolin atrazina Benazolin fenoxaprop fentoato Fenpropatine fenpropatina fenvalerato Fentoato fentoato imazetapyr

National Food Institute, The Danish Technical University
21
Fenvalerato fenvalorato metolacloro Fluazifop Fluazifop permetrina Fluoroglicofen haloxyfop primisulfuron Haloxyfop metolacloro setoxydim Imazetapyr permetrina dalapon Metolacloro profenofos simazina Naptalan prometrina endosulfan Permetrina setoxydim Profenofos endosulfan Prometrina Setoxydim Endosulfan

National Food Institute, The Danish Technical University
22
4. MRLs and toxicological data
In the EU, as from 1 September 2008, a new legislative framework (Regulation (EC) No 396/2005 of the European Parliament and of the Council) on pesticide residues is applicable. This Regulation completes the harmonisation and simplification of pesticide MRLs, whilst ensuring better consumer protection throughout the EU.
All national MRLs will thereby no longer apply. The regulation will include all “old” EU-MRLs as well as many new EU-MRLs which have been agreed on based on all of the member states national MRLs. If there is a combination of a commodity and pesticide for which there is no MRL specified in the regulation then a default MRL of 0.01 mg/kg will apply. The MRL in force from the 1st of September are listed in the regulation no. 149/2008 of 2926. So far the focus of the work in EU in regard to safety evaluations of pesticide residues has been focused on residues in food. However the Regulation (EC) NO 396/2005 of 23 February 2005 on maximum levels also relate to MRLs in feed. So far however the group of “Products intended for animal feed” has not been defined further (Directive 202/32/EC of 7 May 2002). Feeding stuff is defined by crops solely intended for feeding stuff, grass, straw, green forage for ensilage, fodder peas etc. Residues should not be present at levels presenting an unacceptable risk to humans and, where relevant, to animals (Regulation (EC) NO 396/2005). Maximum contents for some persistent pesticides have been laid down in Council Directive 1999/29/EC of 22 April 1999 on the undesirable substances and products in animal nutrition27. These pesticides include aldrin, dieldrin, camphechlor, DDT, endosulfan, endrin, heptachlor, hexachlorbenzene and hexachorocyclo-hexane (HCH). For these pesticides a maximum content in mg/kg relative to a feedingstuff with a moisture content of 12% have been defined. No MRLs have so fare been set for feedingstuff. Toxicological data as ADI and ARfD could also be taken into account when considering which pesticide to include in monitoring programs. It could be argued that pesticides for which low ADI and/or ARfD has been set are more relevant to monitor for than pesticides with higher values. A combination of high MRLs and low ADI and/or ARfD could increase the importance of monitoring for residues of this particular pesticide28.

National Food Institute, The Danish Technical University
23
5. Feasibility to include the pesticide in multiresidue methods
Multiresidue methods are cost effective and are therefore when ever possible preferable over single residue methods. The majority of the pesticides authorised for use on wheat in more than 9 of 16 northern and central European MS (listed in Table 2.4) are possible to include in a multi method. The exceptions are glyphosate and perhaps chlormequat. Both LC- and GC-compounds are represented in Table 2.4. The sulfonylurea type is in general possible to include in LC-methods. Though, these types of pesticides can be difficult to detect, because the sulfonylurea compounds are very potent and only spread in very low amounts per hectare, resulting in low residue levels. The triazole and pyrethroid types are possible to include in GC-methods, whereas it varies for the strobilurin type whether GC- or LC-methods are most applicable. It is difficult to give general recommendations on which pesticides are of greater or less relevance when analysing feeding stuff, since feed can be composed of a wide range of products and by-products.

National Food Institute, The Danish Technical University
24
6. References 1 Development of a multi-residue method for the determination of pesticides in cereals and dry animal feed using gas chromatography–tandem quadrupole mass spectrometry II. Improvement and extension to new analytes. StanisławWalorczyk. Journal of Chromatography A, 1208 (2008) 202–214. Institute of Plant Protection-National Research Institute, Władysława W˛egorka 20, 60-318 Pozna´n, Poland 2 http://ec.europa.eu/agriculture/agrista/2007/table_en/index.htm 3 http://www.efsa.europa.eu/EFSA/DocumentSet/EFSA_acute_chronic_RA_model_rev2_0.xls 4 Danish data from 2000-2002. The data are available at www.dfvf.dk. 5 Consumption of fruit, vegetables and other foodstuffs. Update of diets enabling the setting of MRLs for pesticides. Technical notes OCA/JM/2000-118 and OCA/JM/2001-180, 182 and 258. 6http://www.bfr.bund.de/cm/289/bfr_develops_new_dietary_intake_model_for_children.pdf 7 Coordinated program 2002-2005 available at http://www.pesticides.gov.uk/approvals.asp?id=1687 8 http://www2.mst.dk/Udgiv/publikationer/2007/978-87-7052-471-1/pdf/978-87-7052-472-8.pdf 9 http://circa.europa.eu/Members/irc/sanco/pest/library?l=/pesticide_residues/preparationsofstemporary /tmrls_documents/authorised_substances&vm=detailed&sb=Title 10 http://ec.europa.eu/food/fvo/specialreports/pesticides_index_en.htm 11 http://ec.europa.eu/food/fvo/specialreports/pesticides_index_en.htm 12 Poulsen, M.E. et al., Pesticides – Food monitoring, 1998-2003. Part 2. 1st Edition, 2005. Available at http://www.dfvf.dk 13 Assessment of the daily intake of pesticide residues through the diet in Italy from survey data of the year 2004. Camoni, I; Di Muccio, A; Cecere, E; Fragomeni, G; Fabbrini, R. Rivista di Scienza dell’Alimentazione, vol. 26, issue. 3-4, p. 109-116. 14 http://ec.europa.eu/food/fvo/specialreports/pesticide_residues/report_2006_en.pdf 15 http://www.fefac.org/statistics.aspx?EntryID=629 16http://epp.eurostat.ec.europa.eu/portal/page?_pageid=1996,45323734&_dad=portal&_schema=PORTAL&screen=welcomeref&open=/E/E1/E12&language=en&product=Yearlies_new_agriculture&root=Yearlies_new_agriculture&scrollto=213 17 Council Directive 96/25/EC of April 1996 on the circulation and use of feed materials (OJ L 125, 23.5.1996, p. 35). Available at: http://ec.europa.eu/food/food/controls/feedfood/index_en.htm 18 http://www.fefac.org/statistics.aspx?EntryID=1103 19 http://www.crl- pesticides.eu/docs/public/tmplt_article.asp?LabID=400&CntID=652&Theme _ID=1&Pdf=False&Lang=EN 20 http://ec.europa.eu/food/food/controls/feedfood/index_en.htm 21 http://ec.europa.eu/agriculture/agrista/tradestats/index_sem.htm. 22 Method validation for the analysis of 169 pesticides in soy grain, without clean up, by liquid chromatography-tandem mass spectrometry using positive and negative electrospray ionization, Pizzutti, Ionara R.; de Kok, André; Zanella, Renato; Adaime, Martha B.; Hiemstra, Maurice; Wickert, Cristine; Prestes, Osmar D., Journal of Chromatography A, 1142 (2007) 123–136 23 http://ec.europa.eu/agriculture/publi/gmo/ch5.htm
National Food Institute, The Danish Technical University
25
24 http://www.pesticides.gov.uk/prc.asp?id=1937. 25 http://www2.mst.dk/Udgiv/publikationer/2007/978-87-7052-471-1/pdf/978-87-7052-472-8.pdf 26 http://ec.europa.eu/food/plant/protection/pesticides/database_pesticide_en.htm 27 http://europa.eu/eur-lex/en/consleg/pdf/1999/en_1999L0029_do_001.pdf 28 SANCO 3010 rev 17 December 2008, available on http://www.CIRCA.eurapa.eu/members/ire/sanco/pest/library.