certification of a refillable pet bottle material with …...certification of a refillable pet...
TRANSCRIPT
Certification of a refillable PET bottle material with respect to chemical
inertness behaviour according to a pr-CEN standard method
BCR-712
R. Franz, G. Palzer, B.M. Gawlik, A. Bernreuther, A. Lamberty, D. Bennink
Report EUR 21075
The mission of IRMM is to promote a common European measurement system in support of EU policies.
European Commission Directorate-General Joint Research Centre Institute for Reference Materials and Measurements Contact information European Commission Directorate-General Joint Research Centre Institute for Reference Materials and Measurements Retieseweg 111 B-2440 Geel • Belgium Tel.: +32 (0)14 571 211 Fax: +32 (0)14 590 406 http://www.irmm.jrc.be http://www.jrc.cec.eu.int Legal Notice Neither the European Commission nor any person acting on behalf of the Commission is responsible for the use which might be made of the following information. A great deal of additional information on the European Union is available on the Internet. It can be accessed through the Europa server http://europa.eu.int EUR Report 21075 Luxembourg: Office for Official Publications of the European Communities ISBN 92-894-7220-0 © European Communities, 2004 Reproduction is authorised provided the source is acknowledged Printed in Belgium
European Commission
BCR information REFERENCE MATERIALS
Certification of a refillable PET bottle material with respect to chemical
inertness behaviour according to a pr-CEN standard method
BCR-712
R. Franz, G. Palzer
Fraunhofer Institute for Process Engineering and Packaging (Fraunhofer IVV) Department of Product Safety and Analysis
D-85354 FREISING (Germany)
B.M. Gawlik, A. Bernreuther, A. Lamberty
European Commission DG Joint Research Centre
Institute for Reference Materials and Measurements B-2440 GEEL (Belgium)
D. Bennink
European Commission, DG RTD
Standards, Measurements and Testing, CEC B-1049 BRUSSELS (Belgium)
Repo
rt E
UR
21075 E
N

1
ABSTRACT
A standardised and easy-to-apply method for general chemical inertness testing of refillable
PET bottles was developed. It is applicable not only for the industry but also suitable for
enforcement laboratories having for the first time a systematic control possibility to check the
food safety of refilled PET bottles taken from the market. This chemical inertness test covers
the sum of possible mechanical stress influences on the inertness behaviour of a PET material
and, in case of complaint, allows the conclusion to the enforcement authority that something
in the bottle manufacture process or in the wash/refill system went wrong or the recycle
number might be too high.
In addition, a food grade reference PET material was prepared which fulfils the principle
requirement of article 2 of the Framework Directive 89/109/EEC (1). This reference material
was certified with respect to its interactivity values as shown below. Certified values were
accompanied by an expanded uncertainty according to the requirements laid down in the
Guide for the Expression of Uncertainty in Measurement (GUM) (2).
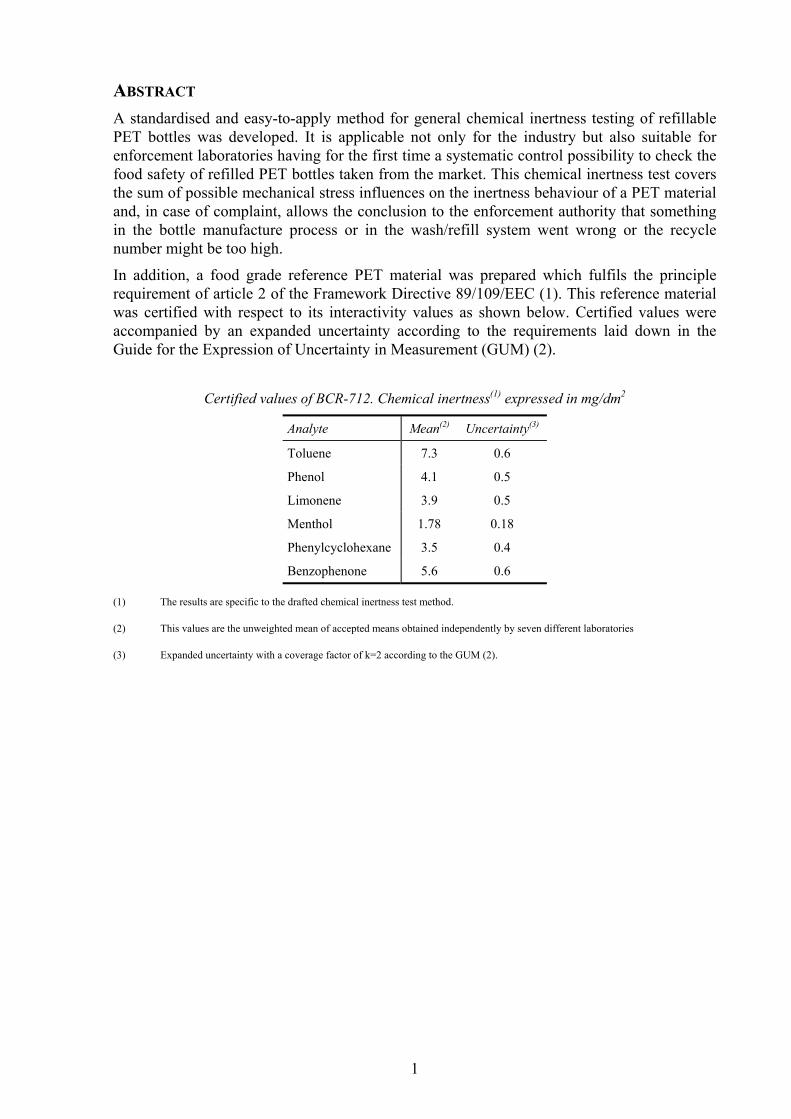
Certified values of BCR-712. Chemical inertness(1) expressed in mg/dm2
Analyte Mean(2) Uncertainty(3)
Toluene 7.3 0.6
Phenol 4.1 0.5
Limonene 3.9 0.5
Menthol 1.78 0.18
Phenylcyclohexane 3.5 0.4
Benzophenone 5.6 0.6
(1) The results are specific to the drafted chemical inertness test method.
(2) This values are the unweighted mean of accepted means obtained independently by seven different laboratories
(3) Expanded uncertainty with a coverage factor of k=2 according to the GUM (2).
2
LIST OF ABBREVIATIONS AND SYMBOLS
ae after extraction
Aeff effective area
ANOVA Analysis of variance
BCR Community bureau of reference
CRM Certified reference material
CV Coefficient of variation
CV % Coefficient of variation in per cent
ES Extraction solvent
FDA US Food and Drug Administration
FID Flame Ionisation Detector
GC Gas chromatography
H.W. half-width
ILSI International Life Sciences Institute
k coverage factor
L Laboratory
mc model compound
mce mass with cut edges
mS mass after sorption
n number of replicates
PEG Polyethylene glycol
PET Polyethylene terephthalate
RM reference material
RT room temperature (+20 °C)
SD Standard deviation
Sw Standard deviation within units
Sb Standard deviation between units
TB Test batch
ubb uncertainty contribution for the
inhomogeneity included in UCRM
uchar uncertainty contribution for the batch
characterisation included in UCRM
usts uncertainty contribution for the short-
term stability of the material
(transportation, not included in UCRM)
ults uncertainty contribution for the long-
term stability of the material (storage)
included in UCRM
UCRM expanded uncertainty of the certified
value
v/v volume per volume
x mean

3
TABLE OF CONTENTS
1. INTRODUCTION ___________________________________________________________________ 5
1.1 BACKGROUND AND NEED FOR BCR-712 _________________________________________________ 5
1.2 CHOICE OF THE MATERIAL FOR BCR-712 ________________________________________________ 5
1.3 DESIGN OF THE PROJECT AND THE CERTIFICATION PROCEDURE ________________________________ 6
1.4 EXPRESSION OF RESULTS _____________________________________________________________ 7
2. PARTICIPANTS ____________________________________________________________________ 8
2.1 PREPARATION OF THE REFERENCE MATERIAL _____________________________________________ 8
2.2 HOMOGENEITY AND STABILITY STUDIES _________________________________________________ 8
2.3 ANALYSES WITHIN THE PRELIMINARY INTERLABORATORY STUDIES ____________________________ 8
2.4 ANALYSES WITHIN THE CERTIFICATION EXERCISE __________________________________________ 8
2.5 STATISTICAL ANALYSIS ______________________________________________________________ 8
3. FEASIBILITY STUDY OF CHEMICAL INERTNESS TESTING ___________________________ 9
3.1 PRELIMINARY STABILITY TESTS ________________________________________________________ 9
3.1.1 Parameters affecting chemical inertness test results of stability studies___________________ 10
3.1.2 Conclusions _________________________________________________________________ 16
3.2 PRELIMINARY INTERLABORATORY TESTING______________________________________________ 17
3.2.1 Test results of the preliminary interlaboratory testing ________________________________ 18
3.2.2 Conclusions _________________________________________________________________ 20
4. PREPARATION OF THE MATERIAL ________________________________________________ 21
5. HOMOGENEITY TESTING _________________________________________________________ 23
5.1 HOMOGENEITY TESTING [I] OF CONTROL BATCH SAMPLES 1 TO 10 DURING THE PRODUCTION________ 23
5.1.1 Measurement of homogeneity concerning the mass of a PET bottle______________________ 23
5.1.2 Measurement of homogeneity concerning material thicknesses _________________________ 24
5.1.3 Conclusions _________________________________________________________________ 25
6. STABILITY TESTING______________________________________________________________ 26
6.1 DESIGN OF THE STABILITY STUDY _____________________________________________________ 26
6.2 RESULTS OF THE STABILITY STUDY ____________________________________________________ 26
6.3 CONCLUSION _____________________________________________________________________ 29
7. THE CERTIFICATION EXERCISE __________________________________________________ 31
7.1 DESIGN OF THE CERTIFICATION EXERCISE _______________________________________________ 31
7.1.1 Materials provided ___________________________________________________________ 31
7.1.2 Design of PET BCR-712 units measured within the certification exercise _________________ 31
7.1.3 Analytical method used ________________________________________________________ 32
7.2 EVALUATION OF TEST RESULTS _______________________________________________________ 32
7.3 STATISTICAL EVALUATION OF RESULTS _________________________________________________ 33
8. CERTIFIED VALUES AND THEIR UNCERTAINTIES _________________________________ 36
8.1.1 Uncertainty evaluation ________________________________________________________ 36
8.1.2 Uncertainty source “homogeneity”_______________________________________________ 36
8.1.3 Uncertainty source “stability” __________________________________________________ 36
8.1.4 Uncertainty source “batch characterisation”_______________________________________ 37
8.1.5 Uncertainty budget ___________________________________________________________ 37
8.2 CERTIFIED VALUES_________________________________________________________________ 37
9. INSTRUCTIONS FOR USE__________________________________________________________ 38
9.1 STORAGE, HANDLING AND TRANSPORTATION ____________________________________________ 38
9.2 USE OF THE CERTIFIED VALUES _______________________________________________________ 38
10. REFERENCES ____________________________________________________________________ 39
11. ANNEX I - DESCRIPTION OF THE PET INERTNESS TEST METHOD ___________________ 40
12. ANNEX II – STABILITY DATA______________________________________________________ 54

4
12.1 OUTPUT FOR TOLUENE ____________________________________________________________54
12.2 OUTPUT FOR PHENOL _____________________________________________________________55
12.3 OUTPUT FOR LIMONENE ___________________________________________________________56
12.4 OUTPUT FOR MENTHOL____________________________________________________________57
12.5 OUTPUT FOR PHENYL CYCLOHEXANE _________________________________________________58
12.6 OUTPUT FOR BENZOPHENONE_______________________________________________________59
12.7 RATIO-OF-MEANS TABLES FOR MODEL COMPOUNDS _____________________________________60
13. ANNEX III – HOMOGENEITY DATA_________________________________________________62

5
1. INTRODUCTION
1.1 Background and need for BCR-712
The world food markets are nowadays glutted by a high variety of plastic packaging
materials for just as many varied sorts of food products. Only to name a few - Polyethylene,
Polypropylene, Polystyrene and Polycarbonate are commonly used in form of foils, bags,
boxes and containers. With the introduction of a 2 litre bottle in 1976 Polyethylene
terephthalate (PET) steadily conquered the market and emerged as a material of choice for
beverage bottles. The characteristic properties of PET like stability, transparency and lower
weight have led to the fact that glass bottles are more and more replaced. Therefore the
increasing demand for bottles of PET inevitably led to the optimisation of existing production
processes.
Due to the stability of the material the multi-use system of PET bottles is common in many
countries. The robustness of PET material is one reason that beverage bottles can achieve
high circulation rates between the bottler and the consumer. The use of a rugged material,
however, cannot rule out the fact that material changes may occur during the life time of a
bottle. On the account of a direct contact between the PET bottle and the beverage
interactions e.g. migration processes can occur during the often long storage time. Plastics
have for example the ability to absorb organic compounds easily. For this reason the aspect
that a number of refillable PET bottles may be misused by the consumer is very important for
the quality assurance and safety-in-use of refillable bottles. Consumer may "misuse" the
bottles for example by filling them with beverages with strong flavour, household chemicals
or even pesticides. Compounds absorbed in this way will not be fully removed during the
washing and cleaning procedure of a refillable bottle. Therefore these substances may be able
to re-migrate into a refilled foodstuff or beverage which in turn can result in an off-flavour.
Due to the intrinsic interactivity of a refillable plastic bottle with contacting chemicals the
question of testing compliance with food regulations arises. To this day there was neither any
specific national or EU regulation nor a standard test available which could be applied by
industry and enforcement laboratories to cover this problem. One of the main purposes of this
project (3) was to establish a standardised and easy-to-apply method for general chemical
inertness testing in conjunction with the production of a certified reference material of PET
applicable not only for the industry but also suitable for enforcement laboratories and
therefore having a systematic control possibility to check the food safety of refilled PET
bottles taken from the market. This report describes the development and application of a
chemical inertness test procedure, to be implemented as CEN-Standard (4) as well as the
production of a Certified Reference Material (BCR-712) with which the inertness of a PET
material can be established. On the basis of this chemical inertness test method and the use of
a CRM PET as a control of analysis performance, the quality of industrially developed new
PET materials can be tested on the one hand, whereas foodstuffs-legislation compliance of
refillable PET plastic packaging on the market may be warranted on the other hand.
1.2 Choice of the material for BCR-712
The material should be a food grade reference PET material which already fulfils the
principal requirement of article 2 of the Framework Directive 89/109/EEC (1) and certifiable
as a reference with respect to its interactivity values. The most common form of PET bottles
on the market is the refillable 1.5 litre bottle. For the production of a certified reference PET
material a commonly used 1.5 litre refillable bottle for soft drinks was chosen which has been
generally accepted from a health risk point of view (i.e. which has already been investigated
in misuse studies and which was found to be safe provided that the usual precautions like
electronic and visual inspections of returned bottles were applied). The shape of the bottle

6
was chosen in such a manner that the brand of the BCR-712 PET couldn’t be detected after
the production and preparation of the CRM.
1.3 Design of the project and the certification procedure
The following Scheme 1-1 shows the design and structure of the certification procedure
applied.
Work phase I
Method Optimisation,Ruggedness Testing,
Method Drafting
Work phase IIPreliminary
IntercomparisonMethod Validation
Work phase IIIPreparation of
Reference Material
Work phase IVa
Homogeneity Testing
of Reference Material
Work Phase VCertification
measurements on
Reference Material
Work phase VI
Preparation ofCertification Report
Work phase IVb
Stability
Testing ofReference
Material
Delivery of
CRM to IRMM
Scheme 1-1 - Flow chart of the work phase sequence of the certification procedure
The main activities in work phase I were the modification, optimisation and simplification of
the chemical inertness test method already developed in a previous EU project (5) and
therefore to establish a practical and easy-to-apply test procedure for refillable PET bottles
with respect to the chemical inertness interactivity. On the basis of the drafted method a first
ruggedness testing was carried out. Producing a first test batch of reference PET bottles and
carrying out a preliminary intercomparison between six laboratories a feasibility study was
performed in work phase II. According to test results obtained within work phase II the
chemical inertness test procedure was further optimised and validated. Scheme 1-2 describes
the process of the finalised chemical inertness test procedure.
The PET inertness test simulates the misuse of a plastic bottle by loading the PET material
with 6 model substances. The amount of these re-migrating model substances into a food
simulant correlates with the inertness and therefore the functionality of the PET bottle
material. The principal idea of a chemical inertness test was to simulate the possible real life
interaction of refillable PET bottles with chemical compounds by using one ”cocktail”
solution of model compounds with different chemical and physical properties. Interactivity
processes between the PET material and the chemical model compounds can be achieved by
contacting PET bottle wall strips with a mixture of model compounds under defined standard
conditions, thus ”loading” PET test material. After a defined sorption phase of 2 days at 60 °C
a re-migration phase with immersion of loaded PET strips into a food simulant was carried

7
out. The concentrations of the model compounds are finally determined by gas
chromatography.
Loading of PET strips with model compoundsby total immersion in a cocktail solutionfor 2 days at 60 °C
Washing of loaded test strips
and cutting of strip edges
Re-migration of model compounds
into 95 % ethanol for 2 days at 60 °C
Gas chromatography
Scheme 1-2 - Chemical inertness test
In the following work phase III the certified reference material batch was produced. During
work phase IV a homogeneity as well as a stability study was carried out with the reference
material batch to be certified. After performing the homogeneity study in work phase IVa a
certification exercise within 10 laboratories was carried out. Based on the test results obtained
in work phase IV and V a statistical evaluation led to certified values of the BCR-712 in work
phase VI.
1.4 Expression of results
The chemical inertness test results for all six model compounds of the test procedure
are expressed in (mg/dm2) as specified in the chemical inertness method as shown in
Appendix I.
For each model compound the interactivity value is expressed as extracted amount (in mg)
per square decimetre of test specimen taking both sides of the PET strip into account. The
final interactivity values for the model compounds in mg/dm2 are calculated from:
eff
ES
aemcmc
A
mxityInteractiv
⋅=
where
Interactivitymc [mg/dm2] extracted amount of model compound in mg per square decimetre of a PET test strip taking both sides into
account;
xmc [mg/g] mass fraction of model compound (mc) in mg/g in 95 % Ethanol (extraction solvent) evaluated by GC
analysis;
Aeff [dm2] effective area of a PET strip after cutting the edges (taking both sides of the test specimen into account) in dm2;
ES
aem [g] mass of extraction solvent (ES) 95 % Ethanol in g after the extraction phase of PET strips after extraction (ae).
8
2. PARTICIPANTS
2.1 Preparation of the reference material
- Fraunhofer Institute for Process Engineering and Packaging, Freising DE
- Schmalbach Lubeca PET Container Deutschland GmbH, Mendig DE
2.2 Homogeneity and stability studies
- Fraunhofer Institute for Process Engineering and Packaging, Freising DE
- University of Ioannina, Department of Chemistry, Section of Industrial
and Food Chemistry, Ioannina GR
2.3 Analyses within the preliminary interlaboratory studies
- Fraunhofer Institute for Process Engineering and Packaging, Freising DE
- Ministry of Agriculture, Fisheries and Food, Central Science Laboratory
Food Science Laboratory, Norwich UK
- Pira International, Leatherhead, UK
- Swedish Institute for Food Research - SIK, Gothenburg SE
- The Netherlands Organisation of Nutrition and Food Research,
TNO, Zeist NL
- University of Ioannina, Department of Chemistry, Section of Industrial
and Food Chemistry, Ioannina GR
2.4 Analyses within the certification exercise
- Fraunhofer Institute for Process Engineering and Packaging, Freising DE
- Swedish Institute for Food Research - SIK, Gothenburg SE
- University of Ioannina, Department of Chemistry, Section of Industrial
and Food Chemistry, Ioannina GR
- The Netherlands Organisation of Nutrition and Food Research,
TNO, Zeist NL
- FABES, Munich DE
- Pira International, Leatherhead
UK
- Istituto Superiore di Sanità, Laboratorio di Tossicologia Applicata
Reparto Materiali di Interesse Sanitario, Rome IT
- VTT Biotechnology and Food Research, Espoo FI
- Danish Veterinary and Food Administration, Institute of Food Research
and Nutrition, Division of Chemical Contaminants, Søborg DK
- Wageningen Agricultural University, Department of Food Technology
& Nutritional Sciences, Wageningen NL
2.5 Statistical analysis
- Fraunhofer Institute for Process Engineering and Packaging, Freising DE
- European Commission, DG RTD, SM&T Programme (SMT), Brussels BE
- European Commission, DG JRC, IRMM, Geel BE

9
3. FEASIBILITY STUDY OF CHEMICAL INERTNESS TESTING
3.1 Preliminary stability tests
In the beginning, two test batches of PET bottles were produced to establish the stability
of the PET bottle material as well as to study the feasibility of producing a PET bottle
material as reference material itself. For the better understanding of test results as well as
distinguishing of preliminary exercises before the stability testing of the BCR-712 the
following Table 3-1 summarises the codes of different test batches of PET bottles produced
within the project.
Table 3–1 - PET batches produced within the Project
Code of test batch (TB)
TB [1] Test batch of approx. 150 PET bottles produced in January 1998
TB [2] Test batch of approx. 100 middle parts of PET bottles produced and cut out
in June 1998
BCR-712 Reference material batch of 2300 PET bottles produced on 13th of July 1999
for certification.
The chemical inertness test procedure is carried out with six model compounds by exposing
the material to a mixed cocktail solution (toluene, phenol, limonene, menthol,
phenylcyclohexane and benzophenone) and measuring of the re-migration into a food
simulant. The CAS numbers as well as the purity of model compounds used within the
chemical inertness test procedure are listed in Table 3-2.
Table 3–2 - Model compounds used within the chemical inertness test
Model compound CAS No. Purity
Toluene 108-88-3 > 99.5 %
Phenol 108-95-2 > 99 %
Limonene 5989-27-5 98 %
Menthol 89-78-1 99 %
Phenylcyclohexane 827-52-1 98 %
Benzophenone 119-61-9 > 99 %
The model compounds applied as one cocktail solution in the final chemical inertness test
method were selected under the following aspects:
- Variation of chemical structures and polarities;
- Variation of molecular weights;
- Comparison of aromatic versus non-aromatic structures;
- Comparison of strongly interactive compounds;
- Consideration of surrogates proposed by the FDA;
- Availability of chemicals to consumer households;
10
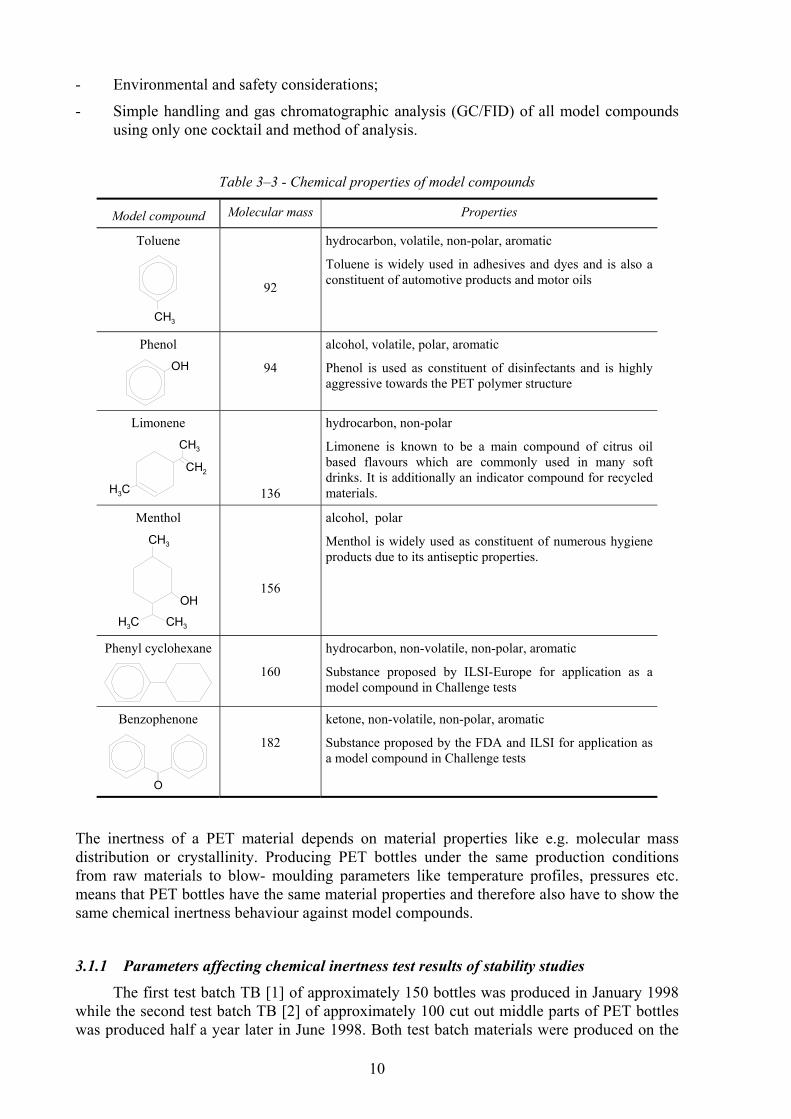
- Environmental and safety considerations;
- Simple handling and gas chromatographic analysis (GC/FID) of all model compounds
using only one cocktail and method of analysis.
Table 3–3 - Chemical properties of model compounds
Model compound Molecular mass Properties
Toluene
CH3
92
hydrocarbon, volatile, non-polar, aromatic
Toluene is widely used in adhesives and dyes and is also a
constituent of automotive products and motor oils
Phenol
OH
94
alcohol, volatile, polar, aromatic
Phenol is used as constituent of disinfectants and is highly
aggressive towards the PET polymer structure
Limonene
H3C
CH3
CH2
136
hydrocarbon, non-polar
Limonene is known to be a main compound of citrus oil
based flavours which are commonly used in many soft
drinks. It is additionally an indicator compound for recycled
materials.
Menthol
CH3
OH
H3C CH3
156
alcohol, polar
Menthol is widely used as constituent of numerous hygiene
products due to its antiseptic properties.
Phenyl cyclohexane
160
hydrocarbon, non-volatile, non-polar, aromatic
Substance proposed by ILSI-Europe for application as a
model compound in Challenge tests
Benzophenone
O
182
ketone, non-volatile, non-polar, aromatic
Substance proposed by the FDA and ILSI for application as
a model compound in Challenge tests
The inertness of a PET material depends on material properties like e.g. molecular mass
distribution or crystallinity. Producing PET bottles under the same production conditions
from raw materials to blow- moulding parameters like temperature profiles, pressures etc.
means that PET bottles have the same material properties and therefore also have to show the
same chemical inertness behaviour against model compounds.
3.1.1 Parameters affecting chemical inertness test results of stability studies
The first test batch TB [1] of approximately 150 bottles was produced in January 1998
while the second test batch TB [2] of approximately 100 cut out middle parts of PET bottles
was produced half a year later in June 1998. Both test batch materials were produced on the
11
same production line under same production parameters with the same source of PET preform
material. Both test batches were about the same design of 1.5 L multi-use PET bottles which
already were on the market. On the basis of same production conditions it was therefore
presumed that the PET bottles of the two different test batches also must show the same
chemical inertness behaviour.
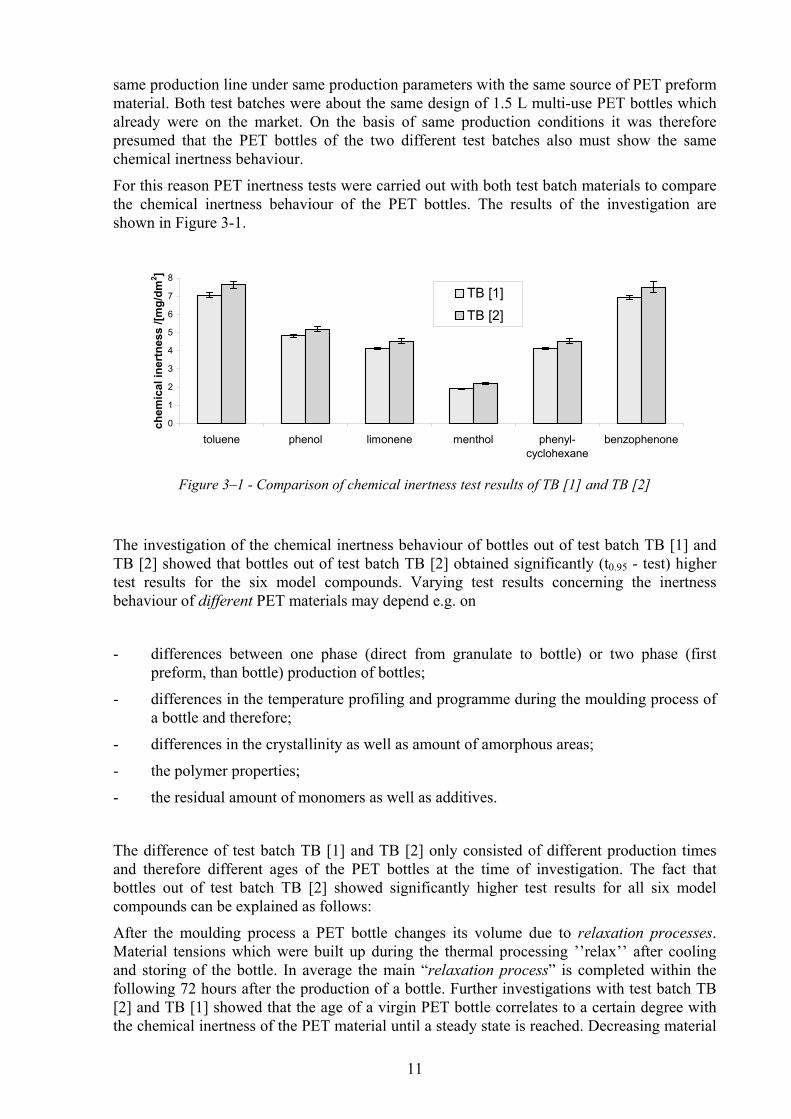
For this reason PET inertness tests were carried out with both test batch materials to compare
the chemical inertness behaviour of the PET bottles. The results of the investigation are
shown in Figure 3-1.
0
1
2
3
4
5
6
7
8
toluene phenol limonene menthol phenyl-
cyclohexane
benzophenone
ch
em
ica
l in
ert
ne
ss
/[m
g/d
m2]
TB [1]
TB [2]
Figure 3–1 - Comparison of chemical inertness test results of TB [1] and TB [2]
The investigation of the chemical inertness behaviour of bottles out of test batch TB [1] and
TB [2] showed that bottles out of test batch TB [2] obtained significantly (t0.95 - test) higher
test results for the six model compounds. Varying test results concerning the inertness
behaviour of different PET materials may depend e.g. on
- differences between one phase (direct from granulate to bottle) or two phase (first
preform, than bottle) production of bottles;
- differences in the temperature profiling and programme during the moulding process of
a bottle and therefore;
- differences in the crystallinity as well as amount of amorphous areas;
- the polymer properties;
- the residual amount of monomers as well as additives.
The difference of test batch TB [1] and TB [2] only consisted of different production times
and therefore different ages of the PET bottles at the time of investigation. The fact that
bottles out of test batch TB [2] showed significantly higher test results for all six model
compounds can be explained as follows:
After the moulding process a PET bottle changes its volume due to relaxation processes.
Material tensions which were built up during the thermal processing ’’relax’’ after cooling
and storing of the bottle. In average the main “relaxation process” is completed within the
following 72 hours after the production of a bottle. Further investigations with test batch TB
[2] and TB [1] showed that the age of a virgin PET bottle correlates to a certain degree with
the chemical inertness of the PET material until a steady state is reached. Decreasing material

12
tensions in form of relaxation processes means increasing the chemical inertness of a PET
material until a steady state.
The steady state of a newly produced PET bottle concerning relaxation appears either after a
long-term storage at ambient temperature or, to accelerate the process, applying higher
storage temperatures after the production of the PET bottles. Determining the influence of
higher temperatures on the stability of a PET material it could be shown that the PET material
of test batch TB [2] reached a steady state concerning the chemical inertness behaviour after a
storage of at least two weeks at 60 °C. In practice PET bottles are only exposed to this
temperature conditions during the washing procedures for an essentially shorter time (for
minutes only).
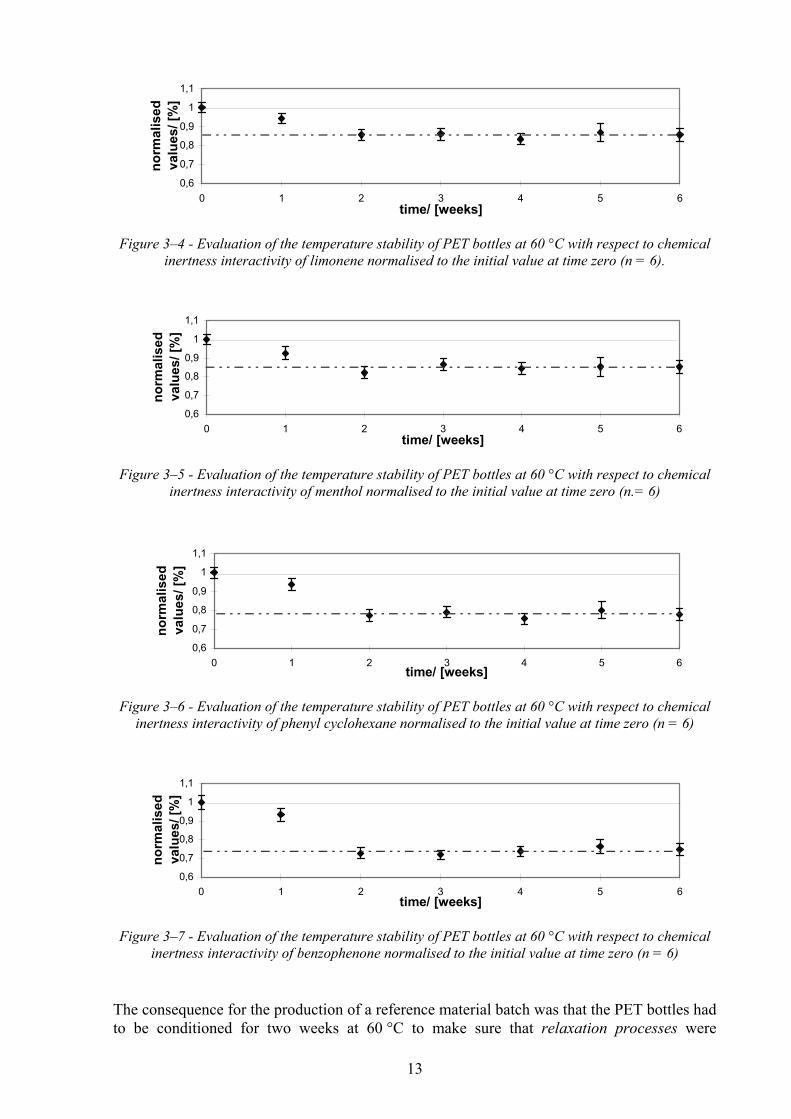
The changes of chemical test results after storage at 60 °C can therefore be understood on the
basis of further “relaxation processes” as well as morphological changes of the PET material
accelerated at higher temperatures. After a storage of two weeks at 60 °C these effects were
completed so that chemical test results of test batch TB [2] reached constancy as clearly
shown in Figures 3-2 to 3-7. The results presented are normalised to chemical inertness test
results obtained for freshly produced bottles of TB [2] without storage at 60 °C. The
continued line at 1.0 represents by definition the initial interactivity, the dotted line shows the
mean value after equilibration.
0,8
0,9
1
1,1
0 1 2 3 4 5 6
time/ [weeks]
no
rma
lis
ed
va
lue
s/
[%]
Figure 3–2 - Evaluation of the temperature stability of PET bottles at 60 °C with respect to chemical
inertness interactivity of toluene normalised to the initial value at time zero (n = 6)
0,7
0,8
0,9
1
1,1
0 1 2 3 4 5 6
time/ [weeks]
no
rma
lis
ed
va
lue
s/
[%]
Figure 3–3 - Evaluation of the temperature stability of PET bottles at 60 °C with respect to chemical
inertness interactivity of phenol normalised to the initial value at time zero (n = 6).
13
0,6
0,7
0,8
0,9
1
1,1
0 1 2 3 4 5 6time/ [weeks]
no
rma
lis
ed
va
lue
s/ [%
]
Figure 3–4 - Evaluation of the temperature stability of PET bottles at 60 °C with respect to chemical
inertness interactivity of limonene normalised to the initial value at time zero (n = 6).
0,6
0,7
0,8
0,9
1
1,1
0 1 2 3 4 5 6time/ [weeks]
no
rma
lis
ed
va
lue
s/
[%]
Figure 3–5 - Evaluation of the temperature stability of PET bottles at 60 °C with respect to chemical
inertness interactivity of menthol normalised to the initial value at time zero (n.= 6)
0,6
0,7
0,8
0,9
1
1,1
0 1 2 3 4 5 6time/ [weeks]
no
rma
lis
ed
va
lue
s/
[%]
Figure 3–6 - Evaluation of the temperature stability of PET bottles at 60 °C with respect to chemical
inertness interactivity of phenyl cyclohexane normalised to the initial value at time zero (n = 6)
0,6
0,7
0,8
0,9
1
1,1
0 1 2 3 4 5 6time/ [weeks]
no
rma
lis
ed
va
lue
s/
[%]
Figure 3–7 - Evaluation of the temperature stability of PET bottles at 60 °C with respect to chemical
inertness interactivity of benzophenone normalised to the initial value at time zero (n = 6)
The consequence for the production of a reference material batch was that the PET bottles had
to be conditioned for two weeks at 60 °C to make sure that relaxation processes were

14
accelerated and therefore the chemical inertness behaviour of the material reached a steady
state.
The stability testing of test batches TB [1] was furthermore carried out in a way that bottles
out of TB [1] which were already stored at room temperature (23 °C) for nearly one year were
additionally stored at 60 °C for several weeks.
The consideration was if PET bottles really reached constancy after a long-term storage of
one year at room temperature then an additional storage at 60 °C would not influence the
chemical inertness behaviour at all.
The following Table 3-4 summarises the storage conditions of PET bottles out of test batch
TB [1]
Table 3–4 - Structure of the stability testing of PET bottles out of test batch TB [1] carried out in the
course of investigations of work phase II
No. Date of analysis storage condition
TB [1] 1 Sept. 1998 room temperature
2 January 1999 room temperature + 7d/60 °C
3 January 1999 room temperature + 7d/60 °C
4 January 1999 room temperature + 14d/60 °C
5 January 1999 room temperature + 14d/60 °C
6 January 1999 room temperature + 21d/60 °C
7 January 1999 room temperature + 21d/60 °C
8 January 1999 room temperature + 28d/60 °C
9 January 1999 room temperature + 28d/60 °C
10 March 1999 room temperature
11 February 1999 room temperature + 7d/60 °C
12 March 1999 room temperature + 14d/60 °C
13 March 1999 room temperature + 21d/60 °C
14 March 1999 room temperature + 28d/60 °C
15 March 1999 room temperature + 35d/60 °C
16 March 1999 room temperature + 42d/60 °C
17 April 1999 42d/60 °C + 28d at room temperature
18 April 1999 42d/60 °C + 56d at room temperature
The following Figures 3-8 to 3-11 show the chemical inertness test results of PET bottles out
of TB [1] after different storage conditions and times normalised to test results obtained from
bottles of TB [1] in September 1998. TB [1] was produced in January 1998 so that the PET
bottles were already nine months old.
It should be noted here that at analysis numbers 12, 17 and 18 slight technical deviations from
the described procedure were made which explain the outlying values for the substance
menthol. Test results of the preliminary stability testing were accepted when test results
achieved comparable results to those of the preliminary intercomparison with a maximum
reproducibility range (on a 95 % probability level) of 20 to 25 %.

15
0,6
0,8
1,0
1,2
1 2 3 4 5 6 7 8 9 10 11 12 13 14 15 16 17 18analysis number of stability testing
no
rma
lis
ed
va
lue
s/
[%]
Figure 3–8 - Results of toluene obtained during the preliminary stability study of the PET bottle
material normalised to values of PET bottle no. 1.
0,6
0,7
0,8
0,9
1,0
1,1
1,2
1 2 3 4 5 6 7 8 9 10 11 12 13 14 15 16 17 18analysis number of stability testing
no
rma
lis
ed
va
lue
s/
[%]
Figure 3–9 - Results of phenol obtained during the preliminary stability study of the PET bottle
material normalised to values of PET bottle no. 1.
0,6
0,7
0,8
0,9
1,0
1,1
1,2
1 2 3 4 5 6 7 8 9 10 11 12 13 14 15 16 17 18analysis number of stability testing
no
rmalised
valu
es/ [%
]
Figure 3–10 - Results of limonene obtained during the preliminary stability study of the PET bottle
material normalised to values of PET bottle no. 1.
0,6
0,7
0,8
0,9
1,0
1,1
1,2
1 2 3 4 5 6 7 8 9 10 11 12 13 14 15 16 17 18analysis number of stability testing
no
rma
lis
ed
va
lue
s/
[%]
Figure 3–11 - Results of menthol obtained during the preliminary stability study of the PET bottle
material normalised to values of PET bottle no. 1.
16
0,6
0,7
0,8
0,9
1,0
1,1
1,2
1 2 3 4 5 6 7 8 9 10 11 12 13 14 15 16 17 18analysis number of stability testing
no
rma
lis
ed
va
lue
s/
[%]
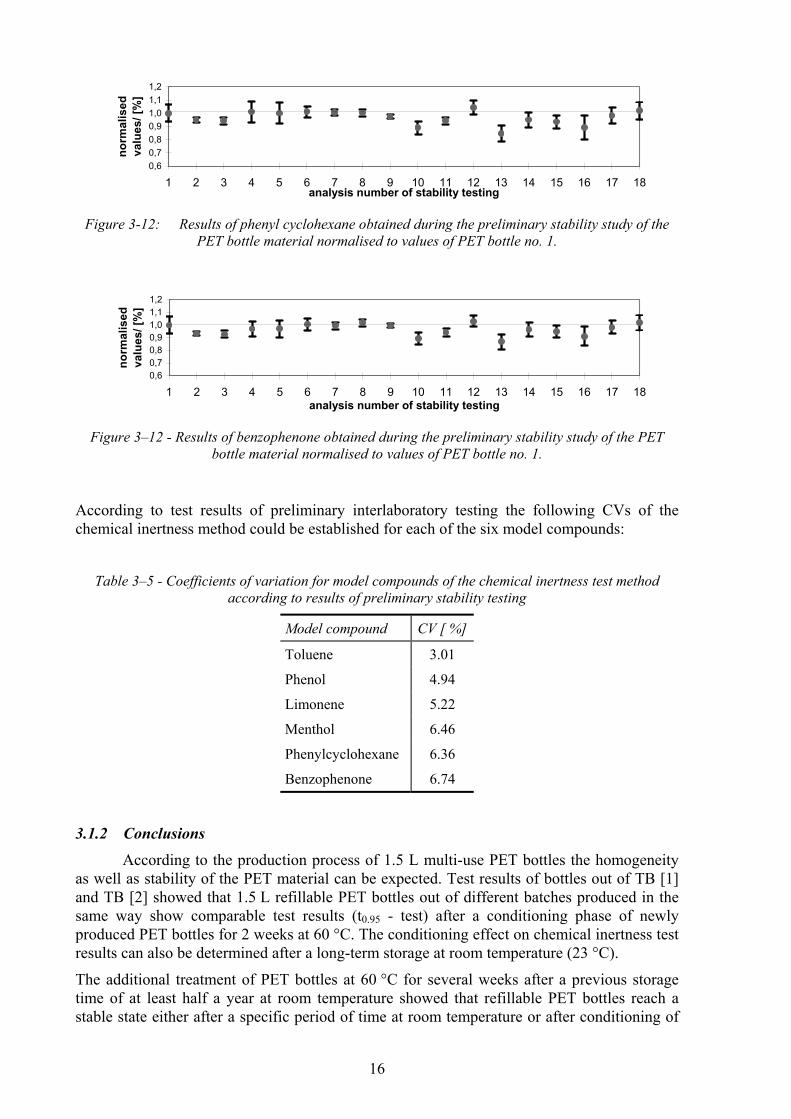
Figure 3-12: Results of phenyl cyclohexane obtained during the preliminary stability study of the
PET bottle material normalised to values of PET bottle no. 1.
0,6
0,7
0,8
0,9
1,0
1,1
1,2
1 2 3 4 5 6 7 8 9 10 11 12 13 14 15 16 17 18analysis number of stability testing
no
rma
lis
ed
va
lue
s/
[%]
Figure 3–12 - Results of benzophenone obtained during the preliminary stability study of the PET
bottle material normalised to values of PET bottle no. 1.
According to test results of preliminary interlaboratory testing the following CVs of the
chemical inertness method could be established for each of the six model compounds:
Table 3–5 - Coefficients of variation for model compounds of the chemical inertness test method
according to results of preliminary stability testing
Model compound CV [ %]
Toluene 3.01
Phenol 4.94
Limonene 5.22
Menthol 6.46
Phenylcyclohexane 6.36
Benzophenone 6.74
3.1.2 Conclusions
According to the production process of 1.5 L multi-use PET bottles the homogeneity
as well as stability of the PET material can be expected. Test results of bottles out of TB [1]
and TB [2] showed that 1.5 L refillable PET bottles out of different batches produced in the
same way show comparable test results (t0.95 - test) after a conditioning phase of newly
produced PET bottles for 2 weeks at 60 °C. The conditioning effect on chemical inertness test
results can also be determined after a long-term storage at room temperature (23 °C).
The additional treatment of PET bottles at 60 °C for several weeks after a previous storage
time of at least half a year at room temperature showed that refillable PET bottles reach a
stable state either after a specific period of time at room temperature or after conditioning of
17
newly produced bottles at 60 °C for at least two weeks.
Due to the same production technique of refillable PET bottles out of TB [1] and TB [2] it can
be assumed that the reference material to be certified also reaches a homogenous as well as
stable state after conditioning of the material.
3.2 Preliminary interlaboratory testing
The objective of the preliminary intercomparison which included six laboratories (L1 –
L6) was to achieve a further method validation and also to obtain acceptance criteria which
could be applied in the certification exercise. Prior to the preliminary intercomparison study
the drafted method and reporting sheets were made available to each of the participants L1 to
L6.
For this exercise, PET bottles were chosen at random out of test batch TB [1]. From the
chosen PET bottles top and bottom parts were cut off to obtain the cylindric middle parts
which then were cut vertically into two half-cylinders. The two half-cylinders from one bottle
were stacked into one another and packed into aluminium foil. Each of the six participating
project partners L1 to L6 obtained four of these sample packages. Each sample was labelled
identifying test batch and sample number.
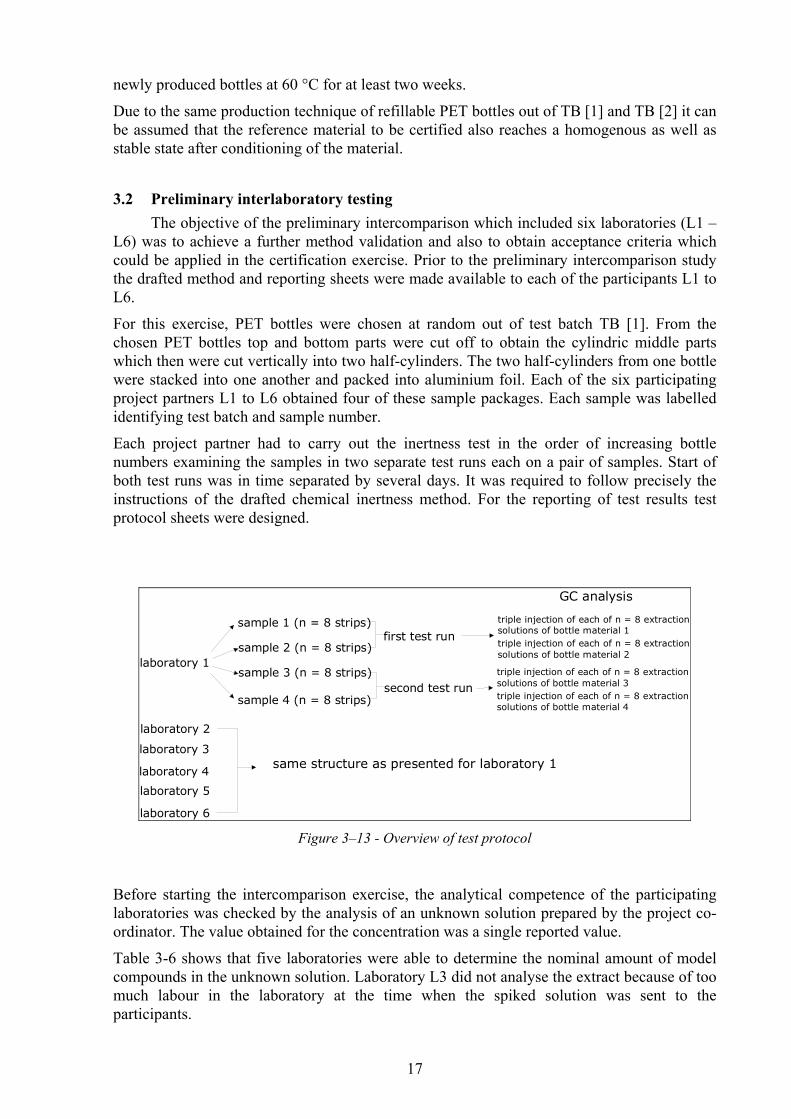
Each project partner had to carry out the inertness test in the order of increasing bottle
numbers examining the samples in two separate test runs each on a pair of samples. Start of
both test runs was in time separated by several days. It was required to follow precisely the
instructions of the drafted chemical inertness method. For the reporting of test results test
protocol sheets were designed.
laboratory 1
laboratory 6
laboratory 5
laboratory 4
laboratory 3
laboratory 2
sample 2 (n = 8 strips)
sample 4 (n = 8 strips)
sample 3 (n = 8 strips)
sample 1 (n = 8 strips)first test run
second test run
triple injection of each of n = 8 extractionsolutions of bottle material 1
triple injection of each of n = 8 extraction
solutions of bottle material 2
triple injection of each of n = 8 extraction
solutions of bottle material 3
triple injection of each of n = 8 extraction
solutions of bottle material 4
GC analysis
same structure as presented for laboratory 1
Figure 3–13 - Overview of test protocol
Before starting the intercomparison exercise, the analytical competence of the participating
laboratories was checked by the analysis of an unknown solution prepared by the project co-
ordinator. The value obtained for the concentration was a single reported value.
Table 3-6 shows that five laboratories were able to determine the nominal amount of model
compounds in the unknown solution. Laboratory L3 did not analyse the extract because of too
much labour in the laboratory at the time when the spiked solution was sent to the
participants.

18
Table 3–6 - Results of the analysis of an unknown solution of model compounds before the preliminary
interlaboratory testing
Extract mass fraction/ [µg/g] nominal L1 L2 L6 L4 L5
Toluene 239 235 244 240 236 239
Phenol 139 142 142 146 149 147
Limonene 144 143 147 146 147 147
Menthol 134 136 140 133 143 140
Phenylcyclohexane 90 87 88 92 89 90
Benzophenone 183 180 182 189 189 189
3.2.1 Test results of the preliminary interlaboratory testing
The following Figures 3-14 to 3-19 present normalised means of 10 data sets consisting
each of 8 individual test results (8 strips from one bottle) with their standard deviation. The
results are normalised to the statistically evaluated overall mean of the 10 data sets.
Within the project [2] it was defined that the participants should achieve comparable results
with a maximum reproducibility (between laboratories) range of 20 to 25 % on a 95 %
probability level as well as a maximum repeatability (within laboratory) range of 15 % to 20
%. This precondition was achieved for each of the six model compounds.
0,6
0,7
0,8
0,9
1
1,1
1,2
L1_1 L1_2 L1_3 L1_4 L2_1 L2_2 L3_1 L3_2 L5_1 L5_2
number of laboratories
no
rmalised
valu
e
Figure 3–14 - Results of preliminary interlaboratory testing for the model compound toluene
normalised to the statistically evaluated overall mean of the 10 data sets (Lab x_sample y).
0,6
0,7
0,8
0,9
1
1,1
1,2
L1_1 L1_2 L1_3 L1_4 L2_1 L2_2 L3_1 L3_2 L5_1 L5_2
number of laboratories
no
rmali
sed
valu
e
Figure 3–15 - Results of preliminary interlaboratory testing for the model compound phenol
normalised to the statistically evaluated overall mean of the 10 data sets (Lab x_sample y).

19
0,6
0,7
0,8
0,9
1
1,1
1,2
L1_1 L1_2 L1_3 L1_4 L2_1 L2_2 L3_1 L3_2 L5_1 L5_2number of laboratories
no
rmali
sed
valu
e
Figure 3-16: Results of preliminary interlaboratory testing for the model compound limonene
normalised to the statistically evaluated overall mean of the 10 data sets (Lab x_sample y).
0,6
0,7
0,8
0,9
1
1,1
1,2
L1_1 L1_2 L1_3 L1_4 L2_1 L2_2 L3_1 L3_2 L5_1 L5_2number of laboratories
no
rmali
sed
valu
e
Figure 3–16 - Results of preliminary interlaboratory testing for the model compound menthol
normalised to the statistically evaluated overall mean of the 10 data sets (Lab x_sample y).
0,6
0,7
0,8
0,9
1
1,1
1,2
L1_1 L1_2 L1_3 L1_4 L2_1 L2_2 L3_1 L3_2 L5_1 L5_2number of laboratories
no
rmalised
valu
e
Figure 3-18: Results of preliminary interlaboratory testing for the model compound phenyl
cyclohexane normalised to the statistically evaluated overall mean of the 10 data sets (Lab x_sample
y).
0,6
0,7
0,8
0,9
1
1,1
1,2
L1_1 L1_2 L1_3 L1_4 L2_1 L2_2 L3_1 L3_2 L5_1 L5_2
number of laboratories
no
rma
lis
ed
va
lue
Figure 3–17 - Results of preliminary interlaboratory testing for the model compound benzophenone
normalised to the statistically evaluated overall mean of the 10 data sets (Lab x_sample y).

20
Results from laboratories with deviations from the prescribed procedure were discarded for
technical reasons not on statistical considerations.
For the statistical evaluation 10 acceptable data sets were available with 79 replicates
altogether for each model compound. For all six model compounds both variances and mean
values did not show any outliers. Variances of all model compounds were homogeneous and
test results normal distributed.
3.2.2 Conclusions
According to test results of the preliminary interlaboratory testing the method was fit
for purpose and could be further validated.

21
4. PREPARATION OF THE MATERIAL
The Polyethylene terephthalate (PET) 1.5 L multi-use bottles from which the reference
material was obtained were manufactured under the supervision of the project co-ordinator on
13th
of July 1999 at Schmalbach Lubeca PET Container GmbH Germany. For the production
of the 1.5 L PET multi-use bottles the blow moulding machine No. 6 with 128 cavities was
used producing 8500 bottles per hour. The PET resin for the production of the PET preforms
was made of Dimethyl terephthalate (DMT) as basic product of the polymerisation process.
The production of the PET bottles used as reference material was carried out within the usual
day production of 1.5 L PET multi-use bottles for the beverage market. With a machine
capacity of 8500 bottles per hour the 2300 PET bottles as reference material were produced
within less than 20 minutes. For the provision of 2000 reference bottles as well as
approximately 300 additional bottles for homogeneity, stability and certification
measurements it was necessary to produce three pallets à 1008 PET bottles due to fixed
machinery adjustments.
The sampling for the homogeneity as well as stability testing was carried out in a way that
every 2 minutes 16 PET bottles were taken from the production line (see Figure 4-1). At the
end of the sampling 10 control batches of 16 bottles each were available.
At the end of the production line the bottles were stored on pallets and numbered in the order
of their production. In that way 3 pallets of 7 stages of 144 bottles were produced. The pallets
were numbered according to their production number of the day with 48, 49 and 50.
Respectively, the stages on the pallets were numbered from 1 to 7 and the bottles on each
stage from 1 to 144. In that way each bottle was coded as follows xx_y_zzz where zzz is the
number of the bottle on the stage y of the pallet number xx with zzz from 001 to 144, y from 1
to 7 and xx from 48 to 50.
Production of 1.5 L PET multi-use bottlesnumbered as follows:
48_1_1 to 14448_2_1 to 144
48_3_1 to 14448_4_1 to 144
48_5_1 to 14448_6_1 to 144
48_7_1 to 144
pallet no. 48 pallet no. 49
49_1_1 to 14449_2_1 to 144
49_3_1 to 14449_4_1 to 144
49_5_1 to 14449_6_1 to 144
49_7_1 to 144
pallet no. 50
50_1_1 to 14450_2_1 to 144
stage 1 - 2 - 3 - 4 - 5 - 6 - 7 stage 1 - 2 - 3 - 4 - 5 - 6 - 7 stage 1 - 2
bottle 1 to 144 each stage bottle 1 to 144 each stage bottle 1 to 144 each stage
Figure 4–1 - Overview of BCR-712 batch production
The bottles were stored until end of July 1999 at ambient temperatures (from 16 °C to 25 °C)
and then conditioned (the whole pallet 48, 49 as well as stages 50_1 and 50_2) in a horizontal
position in a climate chamber for two weeks at 60 °C to accelerate relaxation processes of the
PET material as described in detail under chapter 6 Stability testing. During the conditioning
phase of the PET bottles at 60 °C the temperature was measured every hour and recorded.
After conditioning the PET bottles were stored again at ambient temperature (19 °C to 25 °C).
22
In September 1999, the project co-ordinator developed a cutting implement with which the
middle part cylinder of the 1.5 L PET bottle was cut out mechanically in order to make the
bottle design and brand anonymous as well as to save space.
The bottle wall cylinders as the final shape of the reference material were canned into tin cans
of 800 ml volume under nitrogen flow in September/ October 1999. The reference material
samples as well as the cans were labelled with the production number of the PET bottle.
Afterwards the cans with the reference material were stored at ambient temperatures (15 °C to
25 °C).
The PET bottles of stages 50_3 to 50_7, which were not needed, were kept on stock in case
that something went wrong during the production of the reference material until packaging
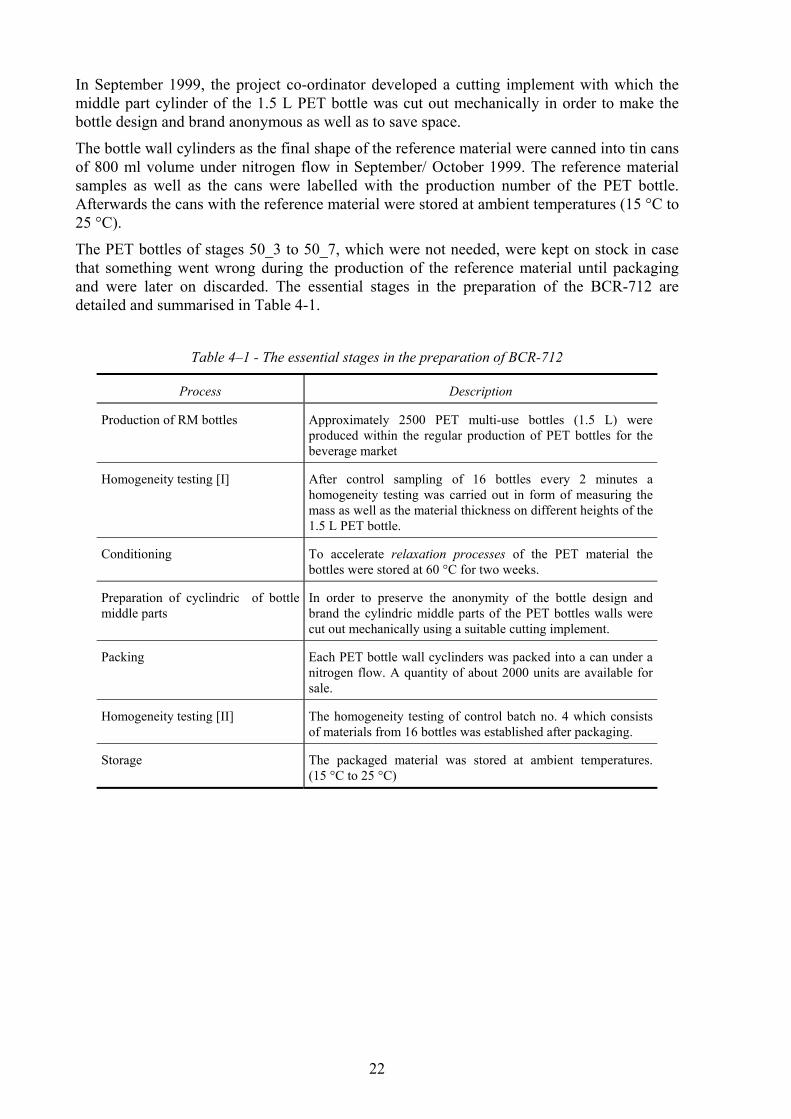
and were later on discarded. The essential stages in the preparation of the BCR-712 are
detailed and summarised in Table 4-1.
Table 4–1 - The essential stages in the preparation of BCR-712
Process Description
Production of RM bottles Approximately 2500 PET multi-use bottles (1.5 L) were
produced within the regular production of PET bottles for the
beverage market
Homogeneity testing [I] After control sampling of 16 bottles every 2 minutes a
homogeneity testing was carried out in form of measuring the
mass as well as the material thickness on different heights of the
1.5 L PET bottle.
Conditioning To accelerate relaxation processes of the PET material the
bottles were stored at 60 °C for two weeks.
Preparation of cyclindric of bottle
middle parts
In order to preserve the anonymity of the bottle design and
brand the cylindric middle parts of the PET bottles walls were
cut out mechanically using a suitable cutting implement.
Packing Each PET bottle wall cyclinders was packed into a can under a
nitrogen flow. A quantity of about 2000 units are available for
sale.
Homogeneity testing [II] The homogeneity testing of control batch no. 4 which consists
of materials from 16 bottles was established after packaging.
Storage The packaged material was stored at ambient temperatures.
(15 °C to 25 °C)
23
5. HOMOGENEITY TESTING
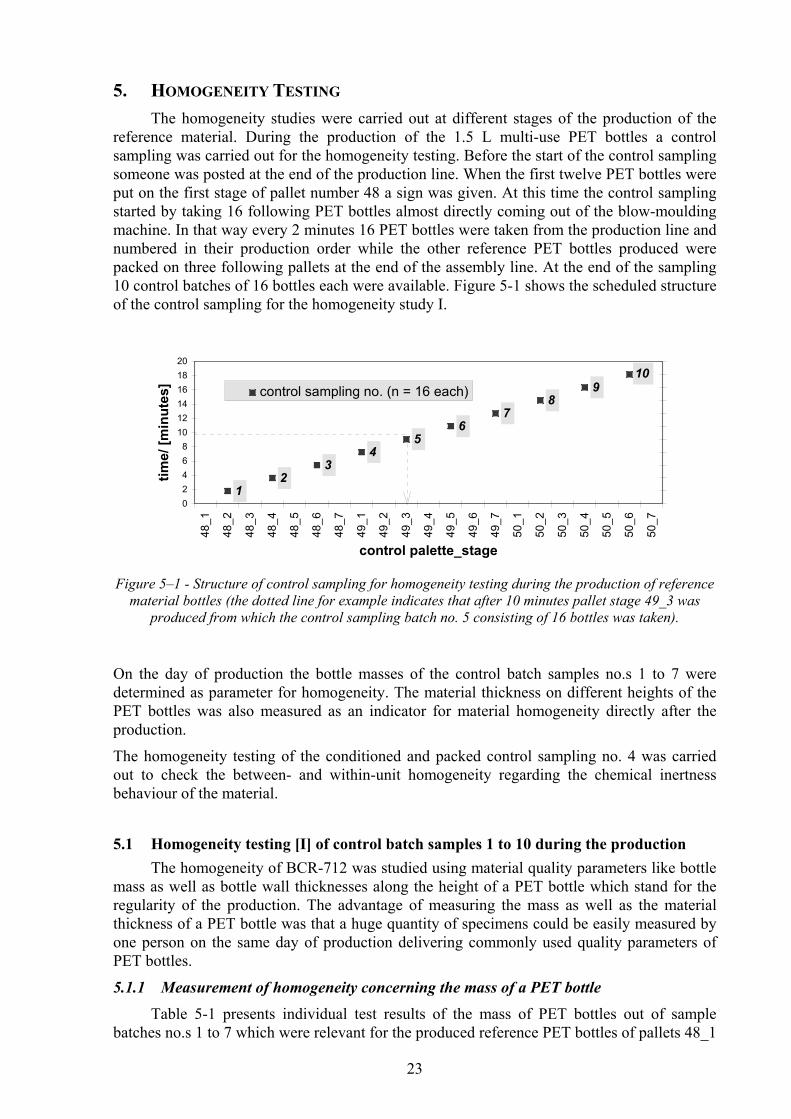
The homogeneity studies were carried out at different stages of the production of the
reference material. During the production of the 1.5 L multi-use PET bottles a control
sampling was carried out for the homogeneity testing. Before the start of the control sampling
someone was posted at the end of the production line. When the first twelve PET bottles were
put on the first stage of pallet number 48 a sign was given. At this time the control sampling
started by taking 16 following PET bottles almost directly coming out of the blow-moulding
machine. In that way every 2 minutes 16 PET bottles were taken from the production line and
numbered in their production order while the other reference PET bottles produced were
packed on three following pallets at the end of the assembly line. At the end of the sampling
10 control batches of 16 bottles each were available. Figure 5-1 shows the scheduled structure
of the control sampling for the homogeneity study I.
1
2
4
5
6
7
8
9
3
10
0
2
4
6
8
10
12
14
16
18
20
48_1
48_2
48_3
48_4
48_5
48_6
48_7
49_1
49_2
49_3
49_4
49_5
49_6
49_7
50_1
50_2
50_3
50_4
50_5
50_6
50_7
control palette_stage
tim
e/
[min
ute
s]
01234567891011
control sampling no. (n = 16 each)
Figure 5–1 - Structure of control sampling for homogeneity testing during the production of reference
material bottles (the dotted line for example indicates that after 10 minutes pallet stage 49_3 was
produced from which the control sampling batch no. 5 consisting of 16 bottles was taken).
On the day of production the bottle masses of the control batch samples no.s 1 to 7 were
determined as parameter for homogeneity. The material thickness on different heights of the
PET bottles was also measured as an indicator for material homogeneity directly after the
production.
The homogeneity testing of the conditioned and packed control sampling no. 4 was carried
out to check the between- and within-unit homogeneity regarding the chemical inertness
behaviour of the material.
5.1 Homogeneity testing [I] of control batch samples 1 to 10 during the production
The homogeneity of BCR-712 was studied using material quality parameters like bottle
mass as well as bottle wall thicknesses along the height of a PET bottle which stand for the
regularity of the production. The advantage of measuring the mass as well as the material
thickness of a PET bottle was that a huge quantity of specimens could be easily measured by
one person on the same day of production delivering commonly used quality parameters of
PET bottles.
5.1.1 Measurement of homogeneity concerning the mass of a PET bottle
Table 5-1 presents individual test results of the mass of PET bottles out of sample
batches no.s 1 to 7 which were relevant for the produced reference PET bottles of pallets 48_1
24
to 50_2 of the production. The above presented Figure 5-1 describes the sampling structure of
sampling 1 to 7 each consisting of 16 PET bottles. Samples were analysed in the order of
sample 1 to sample 7. Within a given sample batch the mass of individual bottles was
determined in the order of bottle 1 to bottle 16.
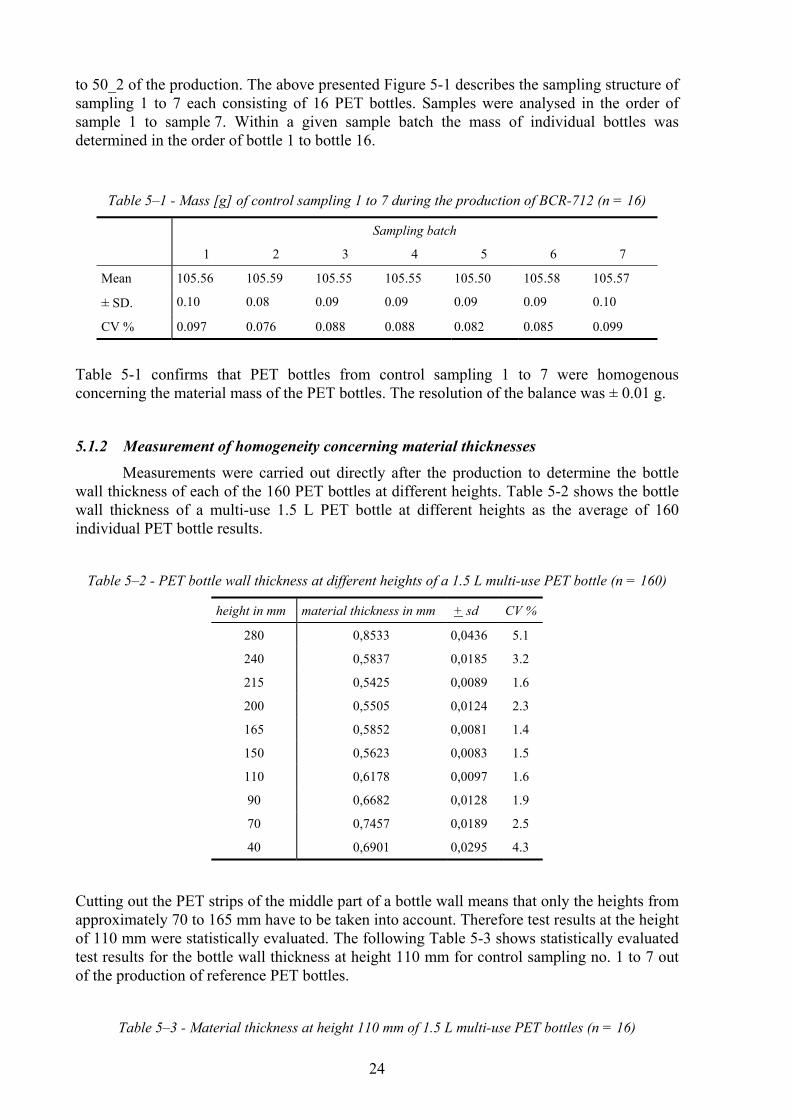
Table 5–1 - Mass [g] of control sampling 1 to 7 during the production of BCR-712 (n = 16)
Sampling batch
1 2 3 4 5 6 7
Mean 105.56 105.59 105.55 105.55 105.50 105.58 105.57
± SD. 0.10 0.08 0.09 0.09 0.09 0.09 0.10
CV % 0.097 0.076 0.088 0.088 0.082 0.085 0.099
Table 5-1 confirms that PET bottles from control sampling 1 to 7 were homogenous
concerning the material mass of the PET bottles. The resolution of the balance was ± 0.01 g.
5.1.2 Measurement of homogeneity concerning material thicknesses
Measurements were carried out directly after the production to determine the bottle
wall thickness of each of the 160 PET bottles at different heights. Table 5-2 shows the bottle
wall thickness of a multi-use 1.5 L PET bottle at different heights as the average of 160
individual PET bottle results.
Table 5–2 - PET bottle wall thickness at different heights of a 1.5 L multi-use PET bottle (n = 160)
height in mm material thickness in mm + sd CV %
280 0,8533 0,0436 5.1
240 0,5837 0,0185 3.2
215 0,5425 0,0089 1.6
200 0,5505 0,0124 2.3
165 0,5852 0,0081 1.4
150 0,5623 0,0083 1.5
110 0,6178 0,0097 1.6
90 0,6682 0,0128 1.9
70 0,7457 0,0189 2.5
40 0,6901 0,0295 4.3
Cutting out the PET strips of the middle part of a bottle wall means that only the heights from
approximately 70 to 165 mm have to be taken into account. Therefore test results at the height
of 110 mm were statistically evaluated. The following Table 5-3 shows statistically evaluated
test results for the bottle wall thickness at height 110 mm for control sampling no. 1 to 7 out
of the production of reference PET bottles.
Table 5–3 - Material thickness at height 110 mm of 1.5 L multi-use PET bottles (n = 16)

25
control sample
batch no.
mean in mm + sd CV %
1 0.61875 0.00602 0.97
2 0.61825 0.00468 0.76
3 0.61725 0.00613 0.99
4 0.61538 0.00729 1.18
5 0.61431 0.00763 1.24
6 0.61744 0.00708 1.15
7 0.61969 0.00627 1.01
5.1.3 Conclusions
No significant difference (F-Test) at the 95 % confidence level was found between
mass as well as material thickness results at height 70 mm to height 165 mm. Therefore the
BCR-712 PET shows no significant (F0.95 - test) material inhomogeneity between units.
The raw data of the homogeneity study, which are compiled in Annex III were used to derive
at an estimate of the uncertainty source “material homogeneity”. This estimate was included
in the expanded uncertainty of the certified values. For the statistical background of this
operation refer to Chapter 8.

26
6. STABILITY TESTING
Plastic reference materials normally are used as calibrants or reference matrices for the
analysis and determination of contained additives, monomers or other chemical substances.
For these plastic RMs it is necessary to establish the stability of already included substances
and not only to determine the stability of the plastic material itself.
In the present case, unlike other plastic RMs, not the value of an already contained substance
was certified but the property of the PET material to show a certified value of model
compounds after applying the chemical inertness test procedure. In other words not the
stability of a characteristic additive of a plastic material had to be tested but the constant and
stable inertness behaviour of the BCR-712 PET material itself towards the sorption and re-
migration of six model compounds.
6.1 Design of the stability study
According to physical properties of the blow-moulded PET material, the 1.5 L multi-use
bottles are not suitable for storing at temperatures of less than 0 °C. At freezing temperatures
of e.g. - 18 °C physical/chemical material properties are changed as well as mechanical
polymer characteristics are destroyed. For this reason the stability testing of the PET material
was not performed under freezing conditions.
In reality a PET bottle material is only exposed to refrigerator or ambient temperatures
concerning long-term storage as well as periodically to washing temperatures of 60 °C for
several minutes.
The stability study of a PET BCR-712 was therefore carried out for twelve months at 3
different temperatures, i.e. 10 °C, 23 °C and 60 °C.
Storing a PET bottle at 60 °C which presents the ’’glass temperature’’ of a PET material for
up to twelve months definitely simulates worst case storage conditions.
In the stability testing on packaged BCR-712 units, the units were selected from the
production of the reference material. The selected units were stored at 10 °C, 23 °C and 60 °C
for periods of 0, 2, 4, 8 and 12 months. At each time point, one unit was removed per
temperature from the storage and tested with six replicates using the chemical inertness test
procedure described in Appendix I.
6.2 Results of the stability study
The results obtained in the stability study are based on the chemical inertness values for
the six model compounds according to the procedure described in Appendix I. Six replicate
measurements were obtained for each unit of PET material at each time point and for each
storage temperature. The individual stability data are presented in Appendix II.
It should be noted that the values at time zero were obtained by measuring three different
units, again with 6 replicates each, at three different days. Each of the three time zero data
sets was then used as the starting point result for one of the three different temperatures.
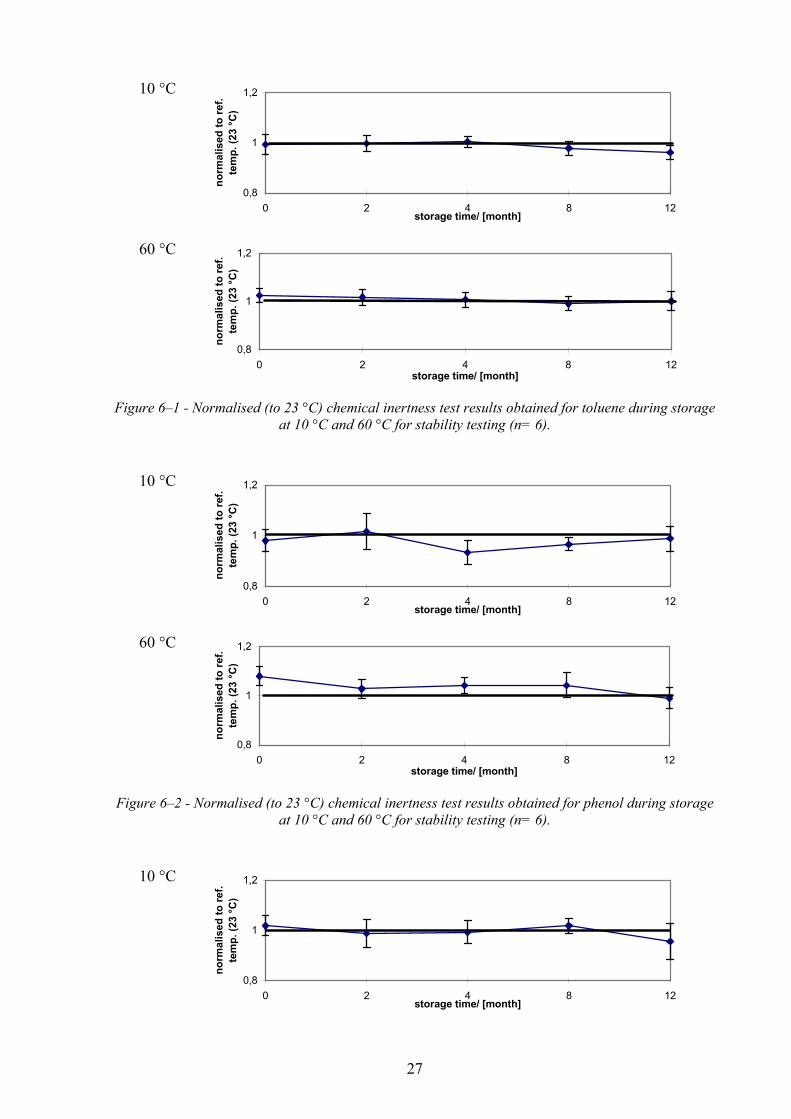
The results of the stability studies are presented below in Figures 6-1 to 6-6 such that the
results for the borderline storage temperatures 10 °C and 60 °C are given for each model
compound as data normalised to stability results obtained at 23 °C (reference temperature) at
the respective time point.
27
10 °C
0,8
1
1,2
0 2 4 8 12storage time/ [month]
no
rmali
sed
to
ref.
tem
p.
(23 °
C)
60 °C
0,8
1
1,2
0 2 4 8 12storage time/ [month]
no
rmali
sed
to
ref.
tem
p.
(23 °
C)
Figure 6–1 - Normalised (to 23 °C) chemical inertness test results obtained for toluene during storage
at 10 °C and 60 °C for stability testing (n= 6).
10 °C
0,8
1
1,2
0 2 4 8 12storage time/ [month]
no
rmali
sed
to
ref.
tem
p.
(23 °
C)
60 °C
0,8
1
1,2
0 2 4 8 12storage time/ [month]
no
rmali
sed
to
ref.
tem
p.
(23 °
C)
Figure 6–2 - Normalised (to 23 °C) chemical inertness test results obtained for phenol during storage
at 10 °C and 60 °C for stability testing (n= 6).
10 °C
0,8
1
1,2
0 2 4 8 12storage time/ [month]
no
rmali
sed
to
ref.
tem
p.
(23 °
C)

28
60 °C
0,8
1
1,2
0 2 4 8 12storage time/ [month]
no
rmali
sed
to
ref.
tem
p.
(23 °
C)
Figure 6–3 - Normalised (to 23 °C) chemical inertness test results obtained for limonene during
storage at 10 °C and 60 °C for stability testing (n= 6).
10 °C
0,8
1
1,2
0 2 4 8 12storage time/ [month]
no
rmali
sed
to
ref.
tem
p.
(23 °
C)
60 °C
0,8
1
1,2
0 2 4 8 12storage time/ [month]
no
rmali
sed
to
ref.
tem
p.
(23 °
C)
Figure 6–4 - Normalised (to 23 °C) chemical inertness test results obtained for menthol during
storage at 10 °C and 60 °C for stability testing (n= 6).
29
10 °C
0,8
1
1,2
0 2 4 8 12storage time/ [month]
no
rmali
sed
to
ref.
tem
p.
(23 °
C)
60 °C
0,8
1
1,2
0 2 4 8 12storage time/ [month]
no
rmali
sed
to
ref.
tem
p.
(23 °
C)
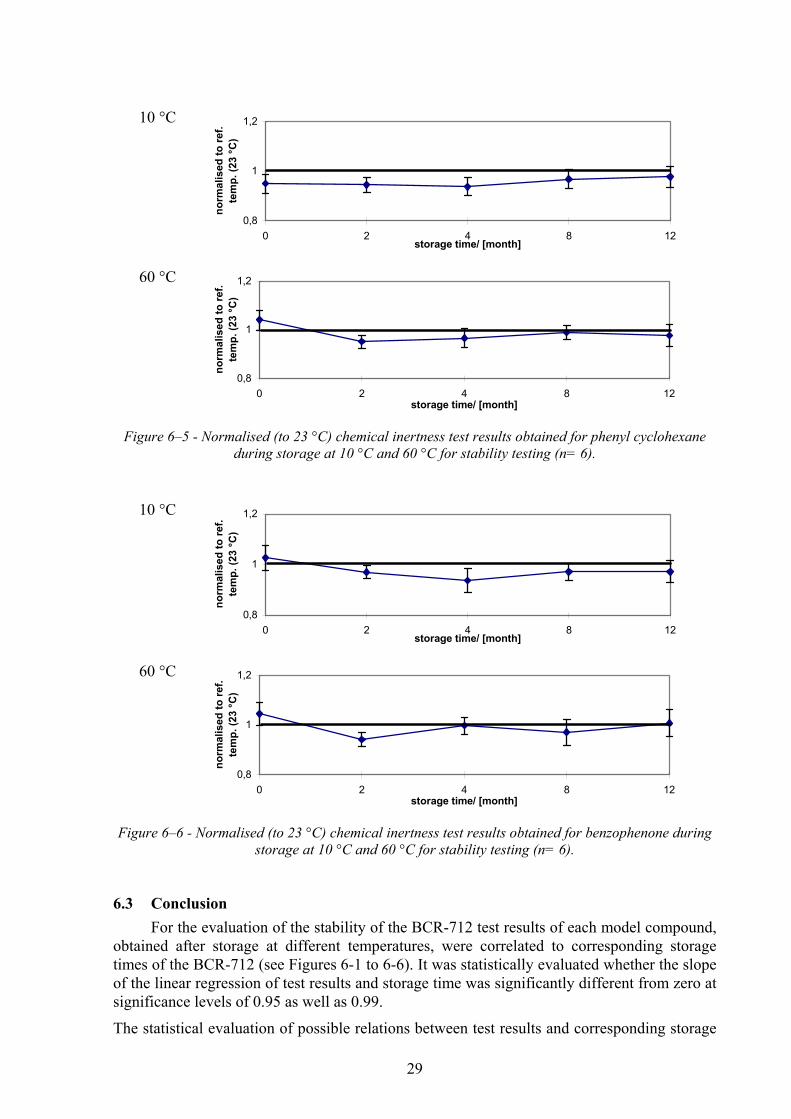
Figure 6–5 - Normalised (to 23 °C) chemical inertness test results obtained for phenyl cyclohexane
during storage at 10 °C and 60 °C for stability testing (n= 6).
10 °C
0,8
1
1,2
0 2 4 8 12storage time/ [month]
no
rmali
sed
to
ref.
tem
p.
(23 °
C)
60 °C
0,8
1
1,2
0 2 4 8 12storage time/ [month]
no
rmali
sed
to
ref.
tem
p.
(23 °
C)
Figure 6–6 - Normalised (to 23 °C) chemical inertness test results obtained for benzophenone during
storage at 10 °C and 60 °C for stability testing (n= 6).
6.3 Conclusion
For the evaluation of the stability of the BCR-712 test results of each model compound,
obtained after storage at different temperatures, were correlated to corresponding storage
times of the BCR-712 (see Figures 6-1 to 6-6). It was statistically evaluated whether the slope
of the linear regression of test results and storage time was significantly different from zero at
significance levels of 0.95 as well as 0.99.
The statistical evaluation of possible relations between test results and corresponding storage
30
times showed that there was no correlation detectable in other words that test results for all
model compounds did not significantly change during the time of storage at 10 °C, 23 °C as
well as at 60 °C. However, it should be noted that in case of toluene at 23 °C and menthol at
10 °C a significant difference of the slope of the linear regression from zero could be
observed for the significance level of 0.95 only. Since these two singular observations cannot
be reasonably explained from a physico-chemical point of view and even appear to be
physically impossible it can be justifyingly assumed that no real effects have been detected in
these two case by the applied statistical means.
Therefore, in addition the statistical evaluation of ratios of test results obtained at 10 °C and
60 °C, respectively, with test results obtained at 23 °C as a reference temperature were carried
out and indeed showed that there was no significant difference of test results detectable at
significance levels of 0.95 and 0.99, respectively.
The stability study of the BCR-712 stored at different temperatures up to 12 months showed
that chemical inertness test results did not significantly change at least at a level of
significance of 0.99 as well as 0.95 or that is rather to say the material properties of the BCR-
712 concerning the chemical inertness behaviour were kept stable at storing temperatures of
10 °C, 23 °C and 60 °C. Therefore the uncertainty for long-term stability has not been
detected.
As a practical conclusion no special precautions concerning long-term storage and shipment
of BCR-712 will be necessary. The raw data of the stability study, which are compiled in
Annex II were used to derive at an estimate of the uncertainty source “material long-term
satbility”. This estimate was included in the expanded uncertainty of the certified values. For
the statistical background of this operation refer to Chapter 8.
31
7. THE CERTIFICATION EXERCISE
7.1 Design of the certification exercise
At the end of February 2000 the project co-ordinator sent 9 packaged BCR-712 units to
each of the participants. The certification exercise started in March/April 2000. The
acceptance criteria for data applied for the certification exercise were as following:
- certification exercise instructions were fully complied with
- no deviations were made from the described chemical inertness test procedure.
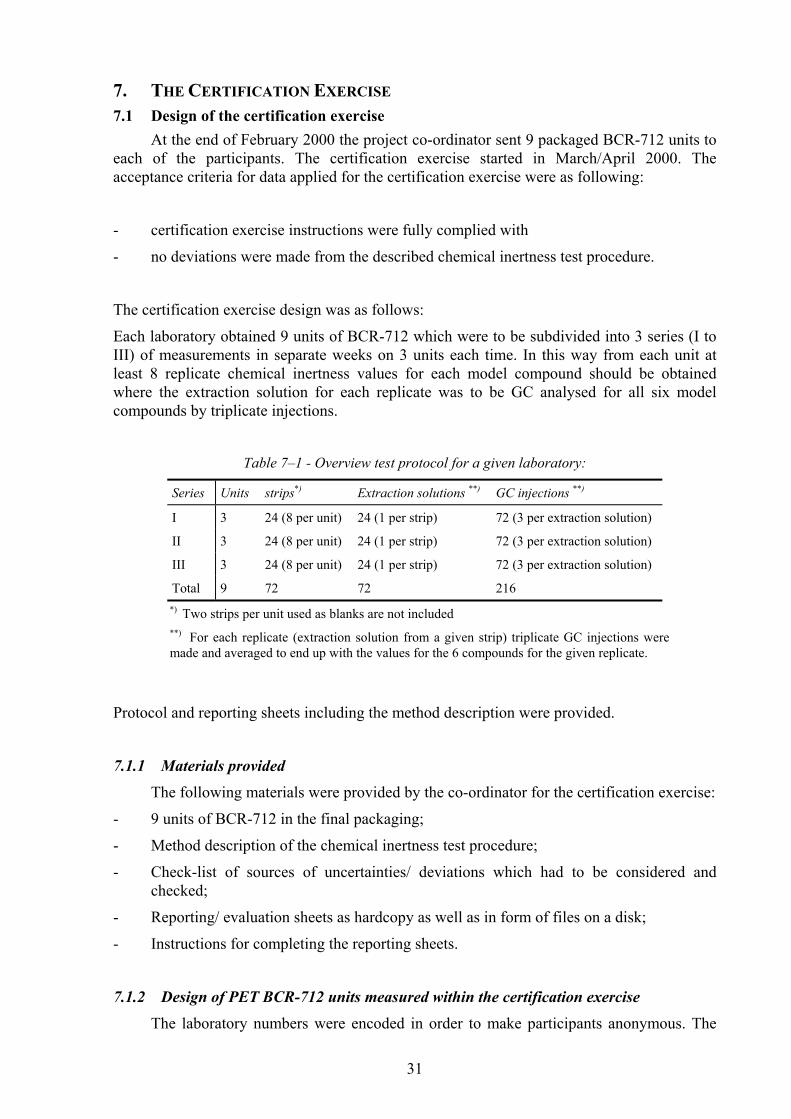
The certification exercise design was as follows:
Each laboratory obtained 9 units of BCR-712 which were to be subdivided into 3 series (I to
III) of measurements in separate weeks on 3 units each time. In this way from each unit at
least 8 replicate chemical inertness values for each model compound should be obtained
where the extraction solution for each replicate was to be GC analysed for all six model
compounds by triplicate injections.
Table 7–1 - Overview test protocol for a given laboratory:
Series Units strips*) Extraction solutions **) GC injections **)
I 3 24 (8 per unit) 24 (1 per strip) 72 (3 per extraction solution)
II 3 24 (8 per unit) 24 (1 per strip) 72 (3 per extraction solution)
III 3 24 (8 per unit) 24 (1 per strip) 72 (3 per extraction solution)
Total 9 72 72 216
*) Two strips per unit used as blanks are not included
**) For each replicate (extraction solution from a given strip) triplicate GC injections were
made and averaged to end up with the values for the 6 compounds for the given replicate.
Protocol and reporting sheets including the method description were provided.
7.1.1 Materials provided
The following materials were provided by the co-ordinator for the certification exercise:
- 9 units of BCR-712 in the final packaging;
- Method description of the chemical inertness test procedure;
- Check-list of sources of uncertainties/ deviations which had to be considered and
checked;
- Reporting/ evaluation sheets as hardcopy as well as in form of files on a disk;
- Instructions for completing the reporting sheets.
7.1.2 Design of PET BCR-712 units measured within the certification exercise
The laboratory numbers were encoded in order to make participants anonymous. The
32
unit numbers were chosen in such a way that carrying out the chemical inertness test within
one laboratory would allow to detect any possible trends. The unit numbers were chosen and
examined under the following aspects:
- Nine following numbers of one stage of one palette in increasing order
- Nine following numbers of one stage of one palette in decreasing order
- Nine units of the same number of 9 different stages of the palettes
- Every 16th
bottle of one stage of a palette in increasing order
- Every 16th
bottle of one stage of a palette in decreasing order.
- Nine unit numbers were chosen by chance.
7.1.3 Analytical method used
The analytical method used in the certification exercise was the chemical inertness test
method described in Appendix I. This method is in alignment with the respective Draft CEN-
Technical Specification on Chemical Inertness Testing (4).
7.2 Evaluation of test results
Laboratories L1, L2, L3, L5, L6, L7, L8, L9, L10 and L11 took part in the certification
exercise. L4 withdraw and did not take part due to an internal work overload.
All the participants were invited to attend a meeting to evaluate the outcome of the
certification exercise. This meeting was held in Brussels on 4th
of December 2000. All the
data were carefully evaluated. The participants at the meeting examined the reliability of the
individual sets of data from each laboratory. No data were rejected on statistical grounds, only
on technical grounds. The set of acceptance criteria of section 7.1 above was employed. If the
results were not acceptable according to these criteria then results were not accepted for
certification.
As a result of this evaluation meeting, the data of L2, L6 and L9 were agreeably rejected
because of technical reasons or not following the protocol. Also, for the other laboratories
some results could either not be provided or were rejected.
- Laboratory 1: All data of the 3 series of the chemical inertness procedure were accepted
(9 units).
- Laboratory 3: Data of series I and III were accepted. Data of series II were rejected due
to deviations from the chemical inertness method (the extraction of test specimens was
not carried out immediately after the sorption phase).
- Laboratory 5: For organisational reasons in the lab L5 carried out only 2 series of
chemical inertness tests. Series I was discarded due to deviations of given technical
requirements of the method as well as due to missing reported basic data.
- Laboratory 7: Data of series I and II were accepted. Data of series III were rejected due
to deviations from the chemical inertness method (the extraction of test specimens was
not carried out immediately after the sorption phase).
- Laboratory 8: All data were accepted (9 units). Although L8 was detected as an outlier
no technical reasons could be found so that all test results are included in the statistical
evaluation of the certified chemical inertness values.
33
- Laboratory 10: All data were accepted (9 units).
- Laboratory 11: All data except one unit were accepted (8 units). The reason was that in
the rejected case the mass increase of the test specimens was significantly higher due to
another position in the oven than of the other two units analysed at the same time.
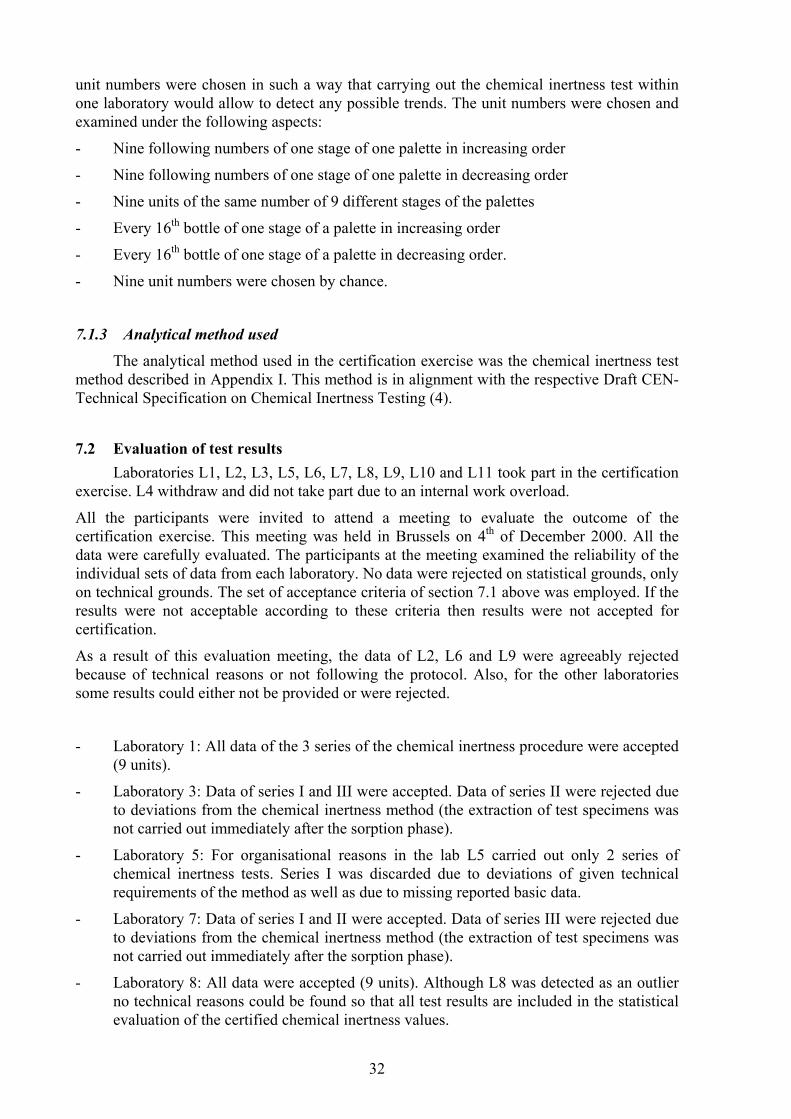
7.3 Statistical evaluation of results
Statistical analysis was carried out on the results, which passed the technical discussion
and the acceptance criteria, using the software provided by the Standards, Measurements and
Testing Programme (6). No data was rejected on statistical grounds alone.
The following statistical tests were carried out with accepted certification data. The statistical
test are described in a brief summary as written in the statistic programme SoftCRM (6). The
number of accepted data sets (7) corresponds to the number of labs finally accepted in the
certification exercise. The number of individual data (50) corresponds to the number of BCR-
712 sample units analysed by all labs. In case of replicate measurements on a sample only the
mean of these measurements is taken into account. The following Table 7-2 presents the
certified properties of the six model compounds used within the certification exercise. Figures
7-1 to 7-6 show the corresponding bar-graphs of the certified values of model compounds.
Outliers were included in the statistical evaluation in case no technical reasons could be
found.
Table 7–2 - Summary of statistical Data for BCR-712 for the six model compounds of the chemical
inertness test
Certified Property Re-migration value [mg/dm2]
Toluene Phenol Limonene Menthol Phenyl
cyclohexane
Benzo-
phenone
Number of data sets 7 7 7 7 7 7
Number of individual data 50 50 50 50 50 50
All data sets compatible two by two
(Scheffe’s multiple t-test)
no no no no no no
Dixon’s test no no no no no no
Outlying data sets Nalimov t-test L8 at 0.05 no L8 L11 no no
Grubbs test no no L8 at 0.05 no no no
Outlying variances (Cochran’s test) L8 L7 L10 L10 L10 L10
Mean of data set means 7.284 4.146 3.872 1.775 3.487 5.575
Within data sets SD 1.330 0.589 0.546 0.152 0.493 1.080
Between-data sets SD 0.339 0.390 0.275 0.319 0.286 0.452
Between-data sets SD significant
different
(Snedecor F-test)
yes yes yes yes yes yes
Variances homogeneous (Bartlett-test) yes no yes no yes yes
SD of data set means 0.470 0.209 0.186 0.067 0.187 0.388
Data set means normally distributed
(Kolmogorov-Smirnov-Lilliefors-test)
yes yes yes not normal yes yes
Half width of the 95 % confidence
interval of the mean of means
0.435 0.194 0.172 0.062 0.173 0.359
Half width of the 95 % tolerance interval
of the data set means
1.884 0.839 0.747 0.268 0.751 1.556

34
4 5 6 7 8 9 10
L1
L3
L5
L7
L8
L10
L11
95% CI
Chemical inertness/ [mg/dm2]
Figure 7–1 - Bar-graph for the toluene value for accepted laboratory means and 95 % confidence
interval for BCR-712
3 3,5 4 4,5 5 5,5
L1
L3
L5
L7
L8
L10
L11
95% CI
Chemical inertness/ [mg/dm2]
Figure 7–2 - Bar-graph for the phenol value for accepted laboratory means and 95 % confidence
interval for BCR-712
2,5 3 3,5 4 4,5 5 5,5
L1
L3
L5
L7
L8
L10
L11
95% CI
Chemical inertness/ [mg/dm2]
Figure 7–3 - Bar-graph for the limonene value for accepted laboratory means and 95 % confidence
interval for BCR-712
35
0 0,5 1 1,5 2 2,5 3 3,5
L1
L3
L5
L7
L8
L10
L11
95% CI
Chemical inertness/ [mg/dm2]
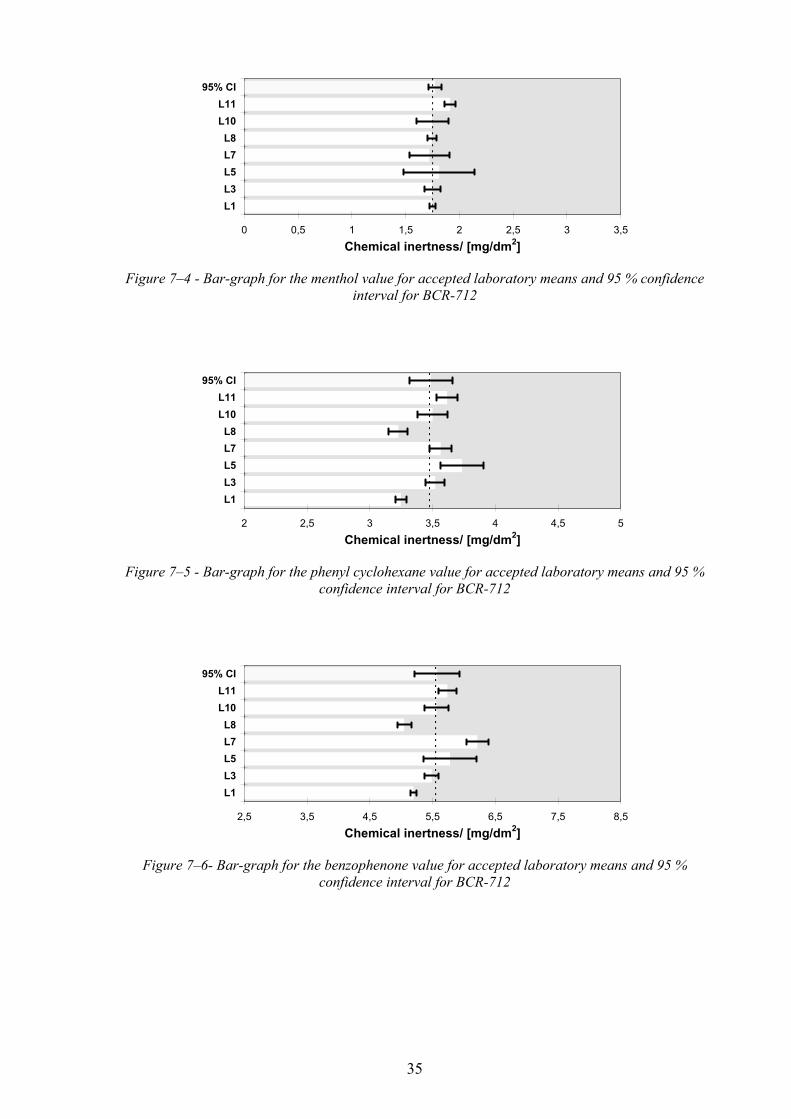
Figure 7–4 - Bar-graph for the menthol value for accepted laboratory means and 95 % confidence
interval for BCR-712
2 2,5 3 3,5 4 4,5 5
L1
L3
L5
L7
L8
L10
L11
95% CI
Chemical inertness/ [mg/dm2]
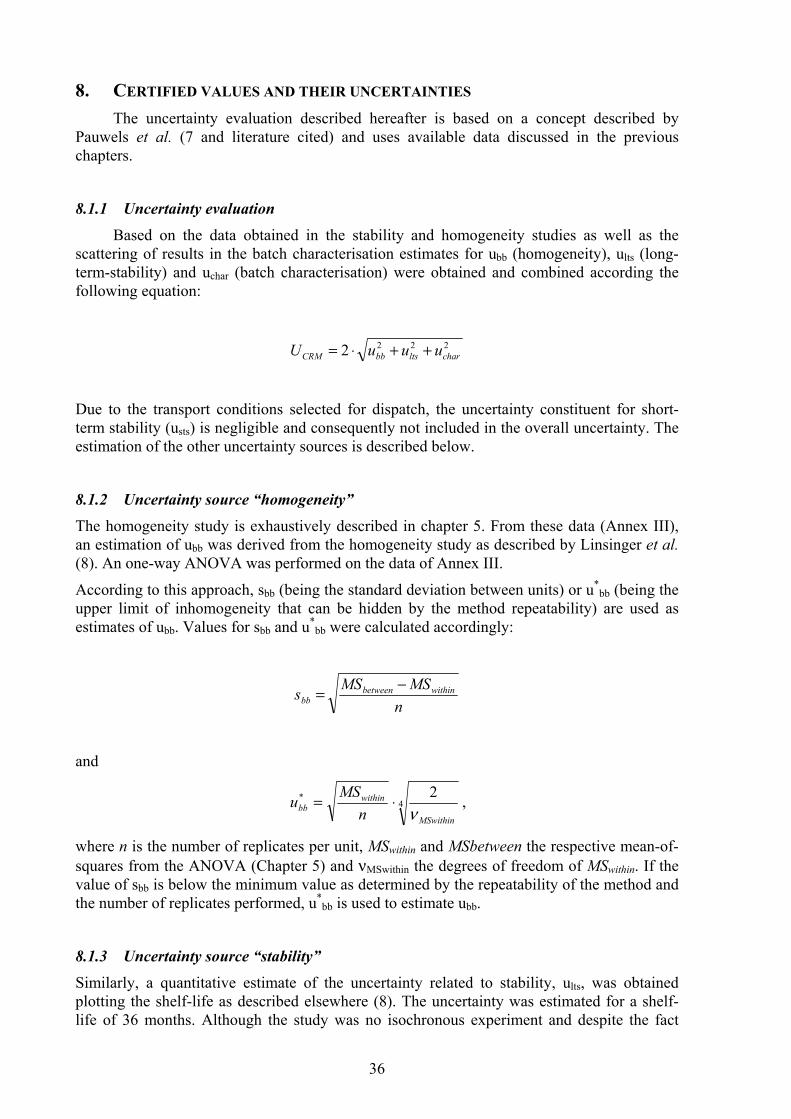
Figure 7–5 - Bar-graph for the phenyl cyclohexane value for accepted laboratory means and 95 %
confidence interval for BCR-712
2,5 3,5 4,5 5,5 6,5 7,5 8,5
L1
L3
L5
L7
L8
L10
L11
95% CI
Chemical inertness/ [mg/dm2]
Figure 7–6- Bar-graph for the benzophenone value for accepted laboratory means and 95 %
confidence interval for BCR-712
36
8. CERTIFIED VALUES AND THEIR UNCERTAINTIES
The uncertainty evaluation described hereafter is based on a concept described by
Pauwels et al. (7 and literature cited) and uses available data discussed in the previous
chapters.
8.1.1 Uncertainty evaluation
Based on the data obtained in the stability and homogeneity studies as well as the
scattering of results in the batch characterisation estimates for ubb (homogeneity), ults (long-
term-stability) and uchar (batch characterisation) were obtained and combined according the
following equation:
2222 charltsbbCRM uuuU ++⋅=
Due to the transport conditions selected for dispatch, the uncertainty constituent for short-
term stability (usts) is negligible and consequently not included in the overall uncertainty. The
estimation of the other uncertainty sources is described below.
8.1.2 Uncertainty source “homogeneity”
The homogeneity study is exhaustively described in chapter 5. From these data (Annex III),
an estimation of ubb was derived from the homogeneity study as described by Linsinger et al.
(8). An one-way ANOVA was performed on the data of Annex III.
According to this approach, sbb (being the standard deviation between units) or u*
bb (being the
upper limit of inhomogeneity that can be hidden by the method repeatability) are used as
estimates of ubb. Values for sbb and u*
bb were calculated accordingly:
n
MSMSs withinbetween
bb
−=
and
4* 2
MSwithin
withinbb
n
MSu
ν⋅= ,
where n is the number of replicates per unit, MSwithin and MSbetween the respective mean-of-
squares from the ANOVA (Chapter 5) and νMSwithin the degrees of freedom of MSwithin. If the
value of sbb is below the minimum value as determined by the repeatability of the method and
the number of replicates performed, u*
bb is used to estimate ubb.
8.1.3 Uncertainty source “stability”
Similarly, a quantitative estimate of the uncertainty related to stability, ults, was obtained
plotting the shelf-life as described elsewhere (8). The uncertainty was estimated for a shelf-
life of 36 months. Although the study was no isochronous experiment and despite the fact
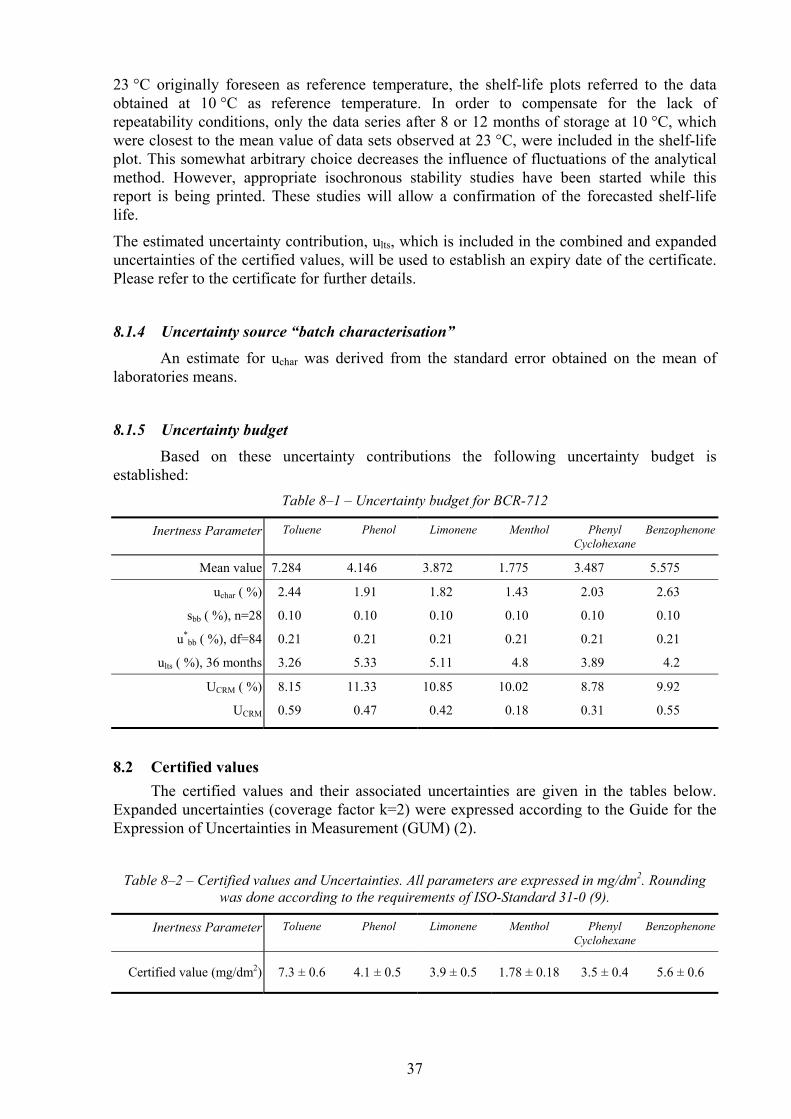
37
23 °C originally foreseen as reference temperature, the shelf-life plots referred to the data
obtained at 10 °C as reference temperature. In order to compensate for the lack of
repeatability conditions, only the data series after 8 or 12 months of storage at 10 °C, which
were closest to the mean value of data sets observed at 23 °C, were included in the shelf-life
plot. This somewhat arbitrary choice decreases the influence of fluctuations of the analytical
method. However, appropriate isochronous stability studies have been started while this
report is being printed. These studies will allow a confirmation of the forecasted shelf-life
life.
The estimated uncertainty contribution, ults, which is included in the combined and expanded
uncertainties of the certified values, will be used to establish an expiry date of the certificate.
Please refer to the certificate for further details.
8.1.4 Uncertainty source “batch characterisation”
An estimate for uchar was derived from the standard error obtained on the mean of
laboratories means.
8.1.5 Uncertainty budget
Based on these uncertainty contributions the following uncertainty budget is
established:
Table 8–1 – Uncertainty budget for BCR-712
Inertness Parameter Toluene Phenol Limonene Menthol Phenyl
Cyclohexane
Benzophenone
Mean value 7.284 4.146 3.872 1.775 3.487 5.575
uchar ( %) 2.44 1.91 1.82 1.43 2.03 2.63
sbb ( %), n=28 0.10 0.10 0.10 0.10 0.10 0.10
u*bb ( %), df=84 0.21 0.21 0.21 0.21 0.21 0.21
ults ( %), 36 months 3.26 5.33 5.11 4.8 3.89 4.2
UCRM ( %) 8.15 11.33 10.85 10.02 8.78 9.92
UCRM 0.59 0.47 0.42 0.18 0.31 0.55
8.2 Certified values
The certified values and their associated uncertainties are given in the tables below.
Expanded uncertainties (coverage factor k=2) were expressed according to the Guide for the
Expression of Uncertainties in Measurement (GUM) (2).
Table 8–2 – Certified values and Uncertainties. All parameters are expressed in mg/dm2. Rounding
was done according to the requirements of ISO-Standard 31-0 (9).
Inertness Parameter Toluene Phenol Limonene Menthol Phenyl
Cyclohexane
Benzophenone
Certified value (mg/dm2) 7.3 ± 0.6 4.1 ± 0.5 3.9 ± 0.5 1.78 ± 0.18 3.5 ± 0.4 5.6 ± 0.6
38
9. INSTRUCTIONS FOR USE
9.1 Storage, handling and transportation
The PET BCR material should be stored at room temperature. As long as originally
packed, no special precautions concerning long-term storage and shipment are required. The
chemical inertness test procedure must be strictly followed without deviation. Strict
adherence to all parts of the test procedure is absolutely essential.
It should be noted that variations in the temperature of the sorption as well as extraction phase
may lead to chemical inertness values which differ significantly from the certified values. As
a performance check of the sorption phase the mass increase of a PET CRM test specimen can
be used which lies normally within the range of 2.0 to 4.0 mg.
9.2 Use of the certified values
The certified values are specific to the described chemical inertness test procedure
(Appendix I). If the CRM is used for the verification of the performance , the user can refer
to results of the certification exercise. The user may assess the laboratory bias from the
difference between the mean value of the replicate laboratory measurements (X) and the
certified value (µ): X - µ.
The criterion for acceptance is given in ISO Guide 33 (10) as follows:
-a2 - 2 σL < X-µ < a1 + 2 σL
in which a1 and a2 are the adjusted values, chosen by the user according to economic or
technical limitations or stipulations and σL is the long-term within-laboratory standard
deviation.
39
10. REFERENCES
[1] European Council (1988). Council Directive 89/109/EEC of 21 December 1988 on the
approximation of the laws of the Member States relating to materials and articles intended to
come into contact with foodstuffs. Official Journal L 040 (11/02/1989), 38 – 44.
[2] ISO-IEC-BIPM-IFCC-IUPAC-IUPAP-OIML. Guide to the Expression of Uncertainties in
Measurement (GUM), Geneva, Switzerland (ISBN 92-67-10188-9).
[3] European Project SMT4-CT96-2129: Establishment of a standard test procedure for
refillable PET bottles with respect to chemical inertness behaviour as well as sensory
interactivity including preparation of a certified reference PET material. Project duration
January 1997 – December 2000.
[4] CEN (2002). Draft CEN Technical Specification: “Method of Test for refillable PET bottles
with respect to their chemical inertness behaviour”, as of October 2002, CEN Doc. No. CEN
TC194/SC1/WG1 N234.
[5] European Project AIR2-CT93-1014: Programm to establish criteria to ensure the quality and
safety in use of recycled and re-used plastics for food packaging. Project duration January
1994 – December 1997. Working Group Refillables, Final Report. September 1997.
[6] Soft CRM: a new software for the development of certified reference materials.
www.weblab.gr/softcrm/softcrm.htm.
[7] A.M.H. Van der Veen, T.P.J. Linsinger, H. Schimmel, A. Lamberty, J. Pauwels (2001).
Uncertainty calculations in the certification of reference materials. 4. Characterisation and
certification. Accred. Qual. Assur. 6, 290-294.
[8] T.P.J Linsinger, J. Pauwels, A.M.H. van der Veen, H. Schimmel, A. Lamberty (2001).
Homogeneity and stability of reference materials. Accred. Qual. Assur. 6, 20-25.
[9] ISO-Standard 31 (1992). Quantities – part 0: General principles. International Organization
for Standardization, Geneva, Switzerland.
[10] ISO Guide 33 (1989). Uses of certified reference materials. International Organization for
Standardization, Geneva, Switzerland.
[11] P. G. Demertzis, F. Johansson, C. Lievens and R. Franz (1997). Studies on the development
of a quick inertness test procedure for multi-use PET containers. Packaging Technology and
Science 10, 45 - 58.
[12] P. G. Demertzis and R. Franz (1998). Studies on the development of a quick test for
predicting the sorption properties of refillable polycarbonate bottles. Presented at the 9th
International Flavor Conference ‘Gerorge Charalambous Memorial Symposium, July 1-4,
1997, Island of Limnos, Greece. Published in: Contis E.T. et al. (editors.): Developments in
Food Science 40: Food Flavors: Formation, analysis and packaging influences. Elsevier
Science B.V., Amsterdam 1998, pp 719 – 733.
[13] G. Palzer and R. Franz (1998). Chemical Inertness of Multi-trip PET Beverage Bottles – Test
method for determining the inertness and therefore the functionality of PET bottle material.
Kunststoffe plast europe 88 (6), 20 - 21.
[14] R. Franz (200): ‘Migration of plastic constituents’. Chapter 10, pp. 287 – 357. In: Piringer,
O.-G. and Baner, A.L. (editors): Plastic Packaging Materials for Food - Barrier Function,
Mass Transport, Quality Assurance and Legislation. Wiley-VCH Verlag GmbH Weinheim,
2000.
40
11. ANNEX I - DESCRIPTION OF THE PET INERTNESS TEST METHOD
The method description was prepared by Fraunhofer Institut für Verfahrenstechnik und
Verpackung (IVV) within the EU Project SMT4 - CT96 – 2129.
Contents
Foreword
0 Introduction
1 Scope
2 Principle
3 Reagents
4 Apparatus
5 Preparation of test specimens
6 Procedure
7 Expression of results
8 Precision
9 Test report
Annex A: Schematic figure of a refillable PET bottle
Annex B: Bibliography
Foreword
This analytical test method has been established within the EU project SMT4-CT96-2129
"Establishment of a standard test procedure for refillable PET bottles with respect to chemical
inertness behaviour as well as sensory interactivity including preparation of a certified reference
PET material" co-ordinated by Fraunhofer Institute of Process Engineering and Packaging, Freising,
Germany, in co-operation with Schmalbach Lubeca PET Containers and further 10 European
laboratories.
In addition, the project has developed a certified reference PET material which will become
available from EC-JRC-IRMM identified as BCR 712 (5).
41
0 Introduction
Plastic materials can interact with chemicals by absorptive uptake of substances. Due to the
underlying principle of circulation of a refillable PET bottle between the bottler and the consumer
and due to the intrinsic interactivity of plastics with contacting chemicals a special situation arises
concerning the question of chemical inertness of refillable PET bottle materials. Food constituents
or chemical substances which may have been absorbed by the bottle material may time-
dependently re-migrate into the refilled foodstuff. Although statistical evaluation of considerable
R&D work in this field has scientifically proven that refillable PET bottles can be re-used safely
under certain circumstances, an appropriate, generally accepted test method is required to define
the bottles interactivity thus ensuring its quality and compliance with food regulations.
1 Scope
This method describes a test procedure for the determination of the interactivity of a PET bottle
material with a set of 6 chemical model compounds under given sorption conditions. The measured
interactivity is understood as the extent of sorption of model chemicals by the PET material and
given quantitatively in mass [mg] absorbed per surface area [dm2]. The method is proposed to be
used as a comparative method, i.e. comparing two or more different PET materials with respect to
their interactivity. In this way the method is capable to test the chemical inertness behaviour of
different PET formulations or batches or to investigate the influence of stress parameters such as
number of wash cycles or other, applied to a given PET material. The method can also be used to
demonstrate food regulatory compliance of a PET material for returnable packaging applications
when compared directly to the certified PET bottle material [BCR 712] and provided that the
certified interactivity values for each model compound are met according to ISO guide 33 (1989) as
follows:
-a2 - 2σL < ( x - µ) < a1 + 2 σL
where x: mean value of replicate measurements
µ: certified value
a1;a2: adjusted values chosen by the user according toeconomic or technical limitations
or stipulations
and σL is the long-term within-lab standard deviation.
2 Principle
The principal idea of this interactivity test is to simulate the possible real life interaction of refillable
PET bottles with chemical compounds by using a „cocktail“ of 6 selected model chemicals with
different chemical and physical properties. The interactivity between the PET material and the
chemical model substances is measured as the sorption of substance by the PET material.
Experimentally, this is achieved by contacting PET bottle wall strips with a mixture of the model
compounds under standard conditions (2 days/60 °C) thus loading the PET test material. This
sorption phase is followed by an exhaustive re-migration phase with immersion of the loaded PET
strips into 95 % ethanol for 2 days at 60 °C thus extracting the absorbed amounts of model
compounds into the ethanol solution. Finally, the concentrations of the model compounds in the
ethanolic solution are determined by gas chromatography.
NOTES: The sorption conditions, i.e. concentration of model compounds and time/temperature
have been chosen such that the PET material shows only a slight swelling effect which
cannot be recognised visually. This situation is believed to be the most critical one with

42
refillable PET bottles since electronic and visual inspection systems may fail in these
cases. The time-temperature conditions for the sorption phase (2 days/60 °C) have been
found to correlate with the generally applied contamination conditions of 14 days at 40 °C
as applied so far in testing of returnable PET bottles. Exhaustive extraction under the
applied re-migration conditions was confirmed by comparison with results obtained from
complete extractions using hexafluoroisopropanol as an aggressive swelling and
dissolution solvent.
Further experiments and measurements in the SMT project SMT4-CT96-2129 have
shown that interactivity results obtained from whole bottles do compare to the strip test
interactivity. From these findings, strip test results may be used to estimate the whole
bottle behaviour.
If differences in morphology could be expected then the users must satisfy themselves
that this condition holds - e.g. by testing specimens from different locations of the bottle.
3 Reagents
All reagents and solvents shall be of analytical quality, unless otherwise specified.
3.1 Chemicals
3.1.1 Benzophenone (C13H10O), purity > 99 % (GC); alternative name: diphenyl ketone; CAS No. 119-
61-9; BRN 1238185; EG No. 2043376
3.1.2 (R)-(+)-Limonene (C10H16), purity 98 %; alternative name: (R)-(+)-4-isopropenyl-1-methyl-
cyclohexene CAS No. 5989-27-5
3.1.3 Menthol (C10H20O), purity 99 %; alternative name: 2-isopropyl-5-methyl-cyclohexanol, CAS No.
89-78-1
3.1.4 Phenol (C6H6O), purity > 99 %; alternative names: hydroxybenzene, carbolic acid, CAS No. 108-
95-2; BRN 969616; EG No. 2036327
Caution: Phenol is a toxic substance !
3.1.5 Phenyl cyclohexane (C12H16), purity 98 %; alternative name: cyclohexyl benzene, CAS No. 827-
52-1
3.1.6 Toluene (C7H8), purity > 99,5 %; alternative name: methyl benzene, CAS No. 108-88-3; BRN
635760; EG No. 601-021-00-3; EINECS No. 2036259
3.1.7 p-Xylene (C8H10), purity > 99,0 %.; alternative name: 1,4-dimethyl-benzene; CAS No. 106-42-3;
BRN 1901563; EG No. 2033965
3.2 Solvents
3.2.1 Ethanol (ethyl alcohol); purity > 99,8 %

43
3.2.2 Polyethyleneglycol 400 for synthesis; OH-number 267-295; WGK 1; EG-number: 2034733
(1.13 kg/L) middle-mol-mass: 380-420
3.3 Solutions
3.3.1 95 % aqueous ethanol
Place 50 mL of distilled water into a 1 L flask and fill up to the mark with ethanol (3.2.1).
3.3.2 Stock solution of model compounds in 95 % ethanol at a defined concentration of approx. 1.25
mg/g.
Sequentially, weigh with a balance accuracy of +0.5 mg to the nearest approximately 100 mg of
each of the model compounds
- benzophenone (3.1.1)
- - limonene (3.1.2)
- - menthol (3.1.3)
- - phenol (3.1.4)
- - phenyl cyclohexane (3.1.5)
- - toluene (3.1.6),
starting with 3.1.1 and ending with 3.1.6, into one 100 mL volumetric flask. Dissolve the six analytes
by adding 50 mL 95 % ethanol (3.3.1) and shaking. Make sure that solids are totally dissolved.
Then fill up to the mark with 95 % ethanol (3.3.1), note down the mass of totally filled-up 95 %
ethanol and mix thoroughly.
Calculate the nominal concentration of each model compound in the stock solution in mg/g.
NOTE: This stock solution must be stored in tightly closeable glassware (100 mL volume vials).
The stock solution of model compounds may be stored for a maximum period of 2
months in a refrigerator at approximately +4 °C.
3.3.3 Diluted standard solutions of model compounds in 95 % ethanol
Pipette into a series of 20 mL volumetric flasks 0, 0.1, 0.2, 1, 2, and 10 mL of the stock solution
(3.3.2) and note down the mass of stock solution in g for each dilution. For the volume 0.1 mL and
0.2mL please use a glass syringe. It is important not to use plastic but glass pipettes. Fill the
volumetric flasks up to the mark with analyte-free 95 % ethanol (3.3.1), note down the mass of
filled-up 95 % ethanol in g and mix thoroughly.
NOTE: The obtained diluted standard solutions of model compounds contain approx. 0, 5, 10,
50, 100 and 500 µg of model compound per mL 95 % ethanol.
Calculate the nominal concentration of each model compound in the diluted standard solution in
mg/g.
NOTE: The diluted standard solutions may be stored far up to one week at + 4 °C in tightly
closed glassware.
3.3.4 Internal standard solution in 95 % ethanol at a defined concentration of approx. 2.5 mg/g
Weigh with a balance accuracy of +0.5 mg to the nearest approximately 100 mg of the internal
44
standard p-xylene (3.1.7) into a 50 mL volumetric flask. Dissolve the p-xylene in approx. 20 mL
95 % ethanol (3.3.1). Then fill up to the mark with 95 % ethanol, note down the mass of totally filled-
up 95 % ethanol and mix thoroughly.
NOTE: The internal standard solution must be stored in tightly closeable glassware (50 mL
volume vials). This solution may be stored for a maximum period of 2 months in a
refrigerator at approximately +4 °C.
3.3.5 Preparation of the model compound ‘cocktail’ for the sorption phase
NOTE: The ‘cocktail’ of model compounds is used for the contact with the PET strips in order to
load the plastic with the substances. Dilution with polyethylene glycol 400 (PEG 400) is
necessary in order to diminish the aggressiveness of the cocktail and to achieve just
such an interaction with the PET which does not lead to too exaggerated swelling effects
(see also NOTE in 2. Principle).
Weigh equal parts, with an accuracy of ±1 % (same mass unit), of the model compounds (3.1.1 to
3.1.6) into a glass bottle with screw cap (of max. 300 ml volume). Dilute the obtained mixture of
model compounds in the bottle by addition of four further equal parts (four times the mass unit used
for one model compound) of polyethylene glycol (PEG) 400 (3.2.2). Close the bottle and mix the
cocktail solution for at least 45 minutes using a magnetic stirrer to ensure that all solid particles of
model compounds are dissolved.
The so prepared cocktail solution should be colourless and clear and has relative model compound
concentrations of 1:10 (by mass).
NOTES: It is useful to produce not too large cocktail quantities because of possible chemical
decomposition after a long storage time. The suggestion is to take as a maximum mass
unit not more than 25g ±1 % of each model compound. The resulting total volume of the
cocktail solution amounts then to approximately 260 mL. With this volume, 7 inertness
tests can be carried out.
The solid model compounds, benzophenone (3.1.1), menthol (3.1.3) and phenol (3.1.4)
are soluble in the other liquid compounds which serve as a solvent mixture.
The cocktail solution may be stored tightly closed for a maximum period of 2 months in a
refrigerator at approximately + 4 °C in the dark.
4 Apparatus
4.1 Analytical balance capable of determining a change in mass of 0.5 mg
4.2 Magnetic stirrer
4.3 Tightly closeable 20 mL glass vials with crimp closures, lined with septa (diameter 20 mm; height 75
mm; neck size 13 mm)
4.4 Volumetric flasks of volumes 100 mL, 50 mL and 20 mL, complying with the minimum requirements of
ISO 4787
4.5 Tightly closeable glass tubes of volume 50 mL and 100 mL, with crimp closures, lined with Butyl/PTFE

45
septa
4.6 Closeable glass bottles of volume approx. 300 mL
4.7 Pipettes of volumes 1 mL, 2 mL, 4 mL, 5 mL, 10 mL, 20 mL and 50 mL as well as glass syringes for 0.1
and 0.2 mL and complying with the minimum requirements of ISO 685
4.8 Sealable glass vials for GC autosampler, e.g. 2 mL
4.9 Glass petri dishes
4.10 Gloves, lint free cloth, paper wipes
4.11 Cutting slab: clean smooth glass, metal or plastic slab of suitable area to prepare test specimens
4.12 Cutting implement: scalpel, scissors or sharp knife or other suitable device
4.13 Rule, graduated in millimetres; metal templates for preparing test specimens, 11 mm x 60 mm
4.14 Blunt-nosed tweezers, stainless steel,
4.15 Thermostatically controlled oven capable of maintaining a temperature of (60 ± 1) °C
4.16 Gas chromatograph (GC), with flame ionisation detector (FID) equipped with an appropriate column and
with an automated injection sampler.
NOTES: Depending on the type of gas chromatograph and separation column used for the
determination, establish the appropriate GC parameters.
The GC column must be capable to separate fully the model compounds and from the
internal standard as well as from solvent peaks.
5 Test specimens
5.1 General
It is essential that test specimens are clean and free from surface contamination (plastics can attract dust
due to static charges). Any surface contamination should be removed from the test specimens by gently
wiping with a lint free cloth, or by brushing with a soft brush. Under no circumstances should test
specimens be washed using a solvent. Minimise handling of the test specimens and wear cotton gloves
during test specimen preparation.
5.2 Number of test specimens
The whole inertness test of one bottle involves 10 PET strips. 8 strips are required for the contact with
46
model compounds and 2 strips are needed for the blank test.
NOTE: This relatively high initial number of test strips is necessary to ensure finally at least 5
valid results in case that samples may need to be discarded from technical reasons as
described in 6.2. However, it should be aimed to carry all of the 8 test strips through the
whole procedure and build the test result on the maximum 8 data sets.
5.3 Preparation of PET strips from PET bottles
NOTES: The test strips with dimensions 60 mm length and 11 mm width must be cut in a vertical
direction of the bottle wall from the middle part as indicated in the figure of Annex A.
PET bottles on the market will have either plain bottle wall shapes or an uneven structure
with a wavy shape or contain a profile. Plain walled bottles as depicted in the figure of
Annex A should here be treated as described after. The test specimen obtained here will
have a homogenous or almost homogenous thickness distribution which allows to
correlate the strip weight with its area. In the case of unevenly walled bottles, test
specimens must be carefully selected with respect to their thickness distribution to fulfill
the above mentioned correlation between mass and area. If this is not feasible, then the
strips must be defined by determination of the area only.
First of all, cut off the top and bottom of the bottle applying the 1st and 2
nd cutting lines as depicted in
figure of Annex A to obtain in this way the middle part of the bottle. Then apply cutting line 3, preferably
along the visible moulding seams, to obtain two equal sectors of the middle part. Each of these two
sectors is further shortened by cutting along line 4 and 5. The distance between cutting line 1 and 4
must be approximately the same as the distance between cutting line 2 and 5. In this way two equal
area compartments are obtained from the middle of the bottle wall.
The PET test strips are prepared from these two compartments in the following way:
Lay one of the compartments on a cutting slab and reduce the width to approx. 65 mm by cutting
parallel to cutting line 5. From this width-reduced compartment cut off subsequently the test strips each
with a width of 11 mm using a template or a rule. The resulting PET strips have a length of approx. 65
mm and an exact width of (11 +1) mm . With the aid of a rule shorten the strips to the final length of
exactly (60 +1) mm. Finally, use the rule to determine the exact dimensions of the prepared test strips
and weigh each test strip. Select from each of the four compartments the most suitable strips and note
both the initial area, Ai in cm2 , taking both sides into account, as well as the initial mass, mi, in grams of
each of the 10 test strips. Place the test strips into a series of 10 glass vials (4.3).
NOTES: It is important to achieve representativeness for the bottle wall area with the test strip preparation.
This can be satisfyingly ensured by the above described procedure of taking 10 test specimen from
the different bottle wall compartments. [Since in this way up to 30 strips can be isolated there are
numerous strips left over. These strips may be used to increase the number of test samples if large
variations in the results are obtained.]
Normally, following these cutting instructions, the area Ai will be 2x (6 x 1.1) cm2 = 13.2 cm
2.
Strips which are not needed for the test may be stored in closed glassware at ambient temperature
(20 + 5 ) °C.
6 PROCEDURES
6.1 Sorption phase
6.1.1 Exposure of test specimens to the cocktail
47
Take eight of the glass vials (4.3) containing each a weighed PET strip as prepared in 5.3 and mark the
vials to allow clear identification of the respective test specimen. Pipette 4 mL of the model compound
cocktail solution (3.3.5) into each of the eight vials and close the vials tightly. Store the glass vials in a
horizontal position in a thermostatically controlled oven at a temperature of (60 + 1) °C and leave the
vials in the oven for a time period of (48 + 0.5) h.
NOTE: It is important that the strips are totally in contact with the cocktail solution (3.3.5) during
the whole storage time. Therefore, and in order to economise the cocktail solution a
horizontal storage position is essential.
6.1.2 Preparation of loaded test specimens for the extraction phase
NOTE: Prepare 3 glass petri-dishes each containing approx. 50 mL 95 % ethanol for the
washing procedure of the loaded PET strips after the exposure conditions
Take the glass vials (6.1.1) out of the oven and let them cool down for 5 min. to achieve approx.
ambient temperature. Pull out the loaded strips from the vials and remove the remaining cocktail
solution from the surface of each strip with a lint free cloth. Immerse each strip using tweezers under
gentle agitation of 10 seconds and sequentially into each of the 3 petri-dishes containing 95 % ethanol
in the same order to remove completely any residual cocktail solution from the surface. Afterwards wipe
the strips clean and dry, using paper wipes. The 95 % ethanol for cleaning should be replaced after
each PET inertness test.
Re-weigh the test specimens and note the mass after sorption, ms.
NOTE: It was found that when extracting the loaded PET strips just after this washing procedure,
edge sorption effects do negatively influence the results. Therefore, to eliminate edge
sorption effects it is necessary to cut off the edges as described below.
Cut off the edges of the cleaned and re-weighed strips applying approx. 1 mm around the whole strip
using a suitable cutting implement (4.12).
Specimens with homogenous thickness distributions:
After cutting, re-weigh each strip and note the mass as the mass with cut edges, mce.
NOTE: A correlation between mass and effective area, Aeff , to be considered for the area-
related sorption can be made (see NOTES in 5.3):
The effective surface area, Aeff in dm2, of the cut-edge strips is calculated as follows:
Aeff = [Ai x (mce/ms)] / 100 [dm2]
Specimens with inhomogenous thickness distributions: After cutting, measure the reduced length
and width dimensions using a rule and calculate the effective surface area, Aeff , in cm2.
NOTE: It is essential that the strips prepared in this way for the extraction phase are immediately
treated as described below in 6.2.
6.1.3 Treatment of blank strips
Take 2 of the glass vials (4.3) containing each a weighed PET strip as prepared in 5.3 and mark the
vials to allow clear identification of the respective test specimen. Proceed with these two strips in the
same way as described under 6.1.1 and 6.1.2, but omit the addition of cocktail solution (strips are
stored in air during the sorption phase).
NOTE: Wash the blank strips in the three ethanol baths before washing the loaded strips, to
avoid carry-over.

48
6.2 Exposure to 95 % ethanol (extraction phase)
Place the eight loaded PET strips (prepared in 6.1.2) and two blank strips (prepared in 6.1.3) each into
a separate 20 mL glass vial (4.3) and mark the vials to allow clear identification of the respective test
specimen. Pipette 4g (~ 5mL) 95 % ethanol (3.3.1) in each of the eight glass vials and note down the
mass of the extraction solvent 95 % ethanol (ES_mbe) before the extraction phase. Close the vials
tightly using crimp closures. Weigh the closed vials again to the nearest ±1 mg and record the mass as
the total mass of the vial before exposure mbe.
NOTE: It has been observed occasionally that there may be loss of liquid from the vials due to
vaporisation or leakage through the closures. Therefore, before starting the exposure
conditions, the level of liquid in the vial in the upright position should be marked and
compared with the level obtained after the exposure to make sure that significant losses
of solvent will be recognised. A significant loss can and must be determined by weighing
the capsuled vial containing the strip and 4g (~ 5 mL) 95 % ethanol before exposure to
60 °C and after the exposure.
It is essential that the strips are totally in contact with the 95 % ethanol during the whole storage time.
Therefore, store the glass vial in a horizontal position in a thermostatically controlled oven set at the
exposure temperature of (60 ± 1) °C. Leave the glass vials for a time period of (48 + 0.5) h in the oven.
After exposure, re-weigh the capsuled vial in total and note the mass as the mass after exposure, mae.
Remove the strips from the glass vials and close the vial again to obtain with the remaining liquid in the
vial the extraction solution in which the model compounds will be quantified by gas chromatography as
described below.
Note: If the analysis of the obtained extraction solution is not carried out immediately, then the
glass vials may be stored well closed and in the dark for a maximum period of one week
in a refrigerator at approx.+4 °C.
Calculate the loss of extraction solution as follows:
ES_mae* = ES_mbe - (mbe - mae ) in g
* mass of extraction solvent 95 % ethanol after the extraction phase
[(mbe - mae) / ES_mbe ] x 100 % = Loss of extraction solution in %
NOTE: A significant loss must be considered in case of a solvent loss higher than 2 % of initial
volume (80 mg). If the solvent loss exceeds 2 % then that test specimen must be
discarded for the further evaluation. As a minimum sample number for evaluation 5 test
specimen without significant loss must be finally available. If this requirement is not
fulfilled then one must start again the sorption phase (6.1.2) with a new complete set of
test specimen.
6.3 Gas chromatograph determination of model compounds
6.3.1 Preparation of samples for GC injection
6.3.1.1 Calibration samples
Pipette 4 g ( ≅ 5 mL) of each of the diluted standard solutions (3.3.3) as well as 0.5 mL internal
standard solution (3.3.4) into a 10 mL glass vial. Close and mix thoroughly. Transfer from each of
the obtained 5.5 mL volume calibration solutions 1 mL portions into 3 glass vials of e.g. 2 mL
volume (4.8) for GC auto samplers.
49
In this way a set of calibration solutions is obtained which allows triplicate determination per
calibration concentration.
6.3.1.2 Test and blank samples
Pipette 0.5 mL internal standard solution (3.3.4) to each of the extraction solutions (6.2) and note
down the mass IS. Close the vials and mix thoroughly. Transfer from each of the so obtained 5.5
mL volume extraction solutions 1 mL portions into 3 e.g. 2 mL glass vials for GC auto samplers.
In this way a set of test sample solutions (8 x 3) and blank sample solutions (2 x 3) is obtained
which allows triplicate determination per extraction solution.
6.3.2 Gas chromatographic analysis
The test samples, blanks as well as calibration samples prepared in 6.3.1.1 and 6.3.1.2 are
analysed as they are without any further treatment.
Three 1 mL replicates are analysed for each of the samples and blanks. Each of these three
replicates is GC analysed (injected) once.
NOTE: When starting measurements, baseline stability and response linearity of the detector
should be examined.
Gas chromatographic parameters:
For guidance, the parameters established for the selected column are given below:
COLUMN: 30 M LENGTH X 0.32 MM INTERNAL DIAMETER FUSED SILICA CAPILLARY E.G. DB-1
WITH A FILM THICKNESS OF 5 µM
Detector temperature: 280 °C
Injector temperature: 250 °C
Injection volume: 2 µL
Carrier gas: H2
Column pressure: 66 kPa
Injection mode: split flow 20 mL/min
Oven programme: initial temperature 80 °C
initial time 2 min
heating rate 15 °C/min
final temperature 280 °C
final time 0 min
NOTE: The same GC conditions should be maintained throughout the measurements of all
sample and calibration solutions.
Under these conditions a full separation of the model compounds was achieved with the following
retention times (in minutes):
Toluene 9.6

50
Phenol 14.1
Limonene 16.2
Menthol 18.9
Phenyl cyclohexane 21.9
Benzophenone 26.6
p-Xylene (int.stand.) 12.3
6.3.3 Calibration
Inject each of the three replicates of calibration samples as prepared in clause 6.3.1.1 one time into
the GC column (one injection per vial). Measure the peak area of each model compound and the
internal standard p-xylene. Divide the peak area of each model compound by the peak area of p-
xylene. Calculate for each model substance the average of peak area ratio obtained from the three
replicates of one calibration concentration as calculated in 3.3.3 and graphically plot peak ratios
(PR) against the concentration of model compounds in the calibration samples in mg/g.
In this way six calibration curves, one for each model compound are obtained.
NOTE: The calibration curves must be rectilinear with a correlation coefficient of at least 0.996.
6.3.4 Evaluation of data
NOTE: The following calculations assume that for all measurements exactly in the same
volumes of 95 % ethanol solutions have been used for sample preparation.
6.3.4.1 GC interferences
Following the method described, no interferences have been detected.
NOTE: In case that the gas chromatogram obtained from blank samples shows an interference
at the retention time of a model compound then following should be considered:
A correction for the blank value should be made in case that the interference does not
exceed 10 % of the area of the analyte peak and remains constant within +/- 20 % in
absolute size in the triplicate injections.
In case that the interference exceeds the above requirement then the particular model
compound should be taken out of the evaluation and the result be based on the
remaining interference-free model substances.
6.3.4.2 Calculation of model compound concentration in the test sample solutions (6.2)
NOTE: The following calculations do not take account of the dilution of the test samples
achieved by the addition of 0.5 ml internal standard solution as prepared in 6.3.1.2. The
calculated concentrations refer directly to the extraction solution obtained in 6.2.
Graphical determination
Calculate the average of peak area ratio (PR) values obtained from the test sample replicates
according to 6.3.1.2 and read the model compound concentration of the test samples from the
individual calibration graph of each model compound as obtained from 6.3.3.
Calculation from the regression parameters
51
If the regression equation of each model compound (mc) is
ymc [PR] = amc * xmc [mg/g] + bmc
then the concentration of each model compound in 95 % ethanol is
Cmc [mg/g] = (ymc-bmc) / amc
7 Expression of results
Express for each model compound the interactivity value as extracted amount (in mg) per contact
area (in dm2) of test specimen taking both sides of the PET strip into account:
Calculation of the final interactivity values for the model compounds in mg/dm2
is achieved as
follows:
NOTE: The effective surface area, Aeff , is normally around 0.11 dm2 (compare NOTES
under 5.3).
8 Precision
The method was evaluated in a collaborative trial with 7 laboratories where to each laboratory 9
samples were made available. Statistical evaluation (ISO 5725) at the 95 % probability level of 50
valid data sets (out of 63) yielded the following repeatability (r) and reproducibility (R) values at the
certified interactivity values obtained for the individual model compounds
Model compound Certified interactivity value
[mg/dm2]
r [mg/dm2] R [mg/dm
2]
Toluene 7.28 0.35 1.32
Phenol 4.15 0.36 0.59
Limonene 3.87 0.27 0.52
Menthol 1.78 0.29 0.19
Phenyl cyclohexane 3.49 0.26 0.52
Benzophenone 5.58 0.43 1.09
9 Test report
The test report shall include the following:
- reference to this method [standard];
- all information necessary for complete identification of the sample;
- departures from the specified procedure, and reasons for these;
- individual test results for each sample and model compound (mc), and the mean of these,
[ ][ ] [ ]
[ ]Interactivity
C ES m g
A dmmc
mg
dm
mcmg
g ae
eff
22
=⋅ _
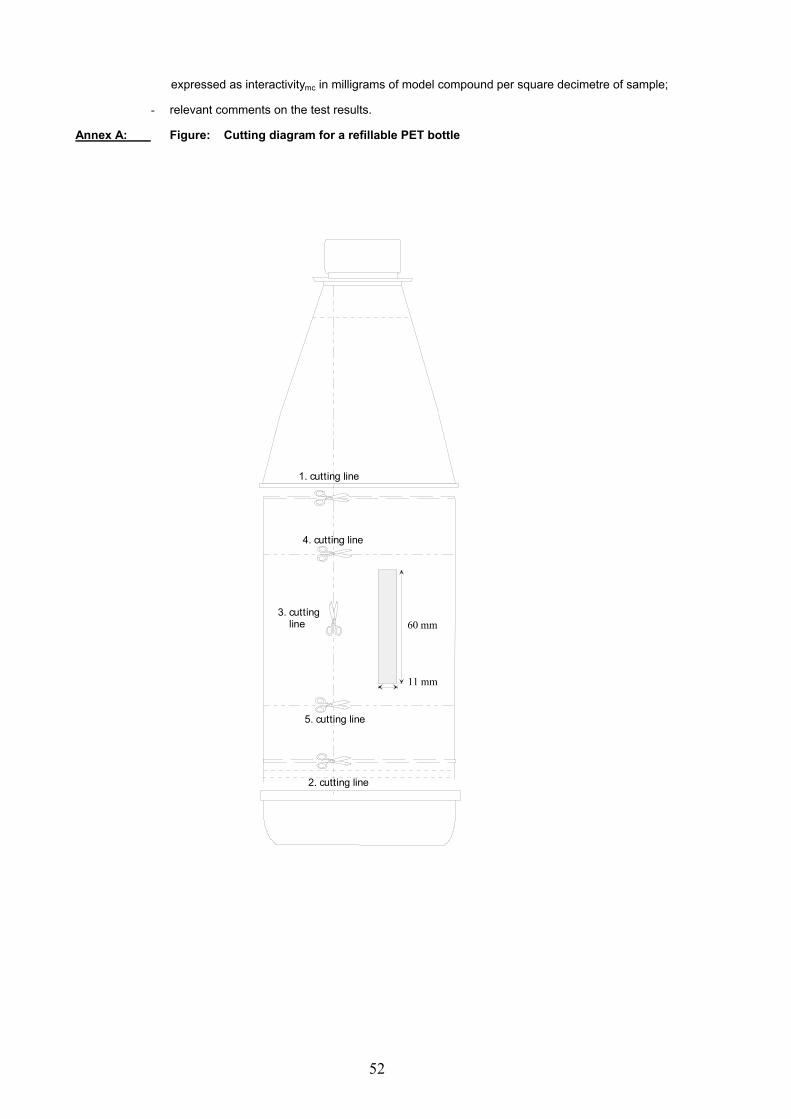
52
expressed as interactivitymc in milligrams of model compound per square decimetre of sample;
- relevant comments on the test results.
Annex A: Figure: Cutting diagram for a refillable PET bottle
60 mm
11 mm
1. cutting line
2. cutting line
3. cutting line
4. cutting line
5. cutting line

53
Annex B: Bibliography
[1] Feron, V., Jetten, J., De Kruijf, N. and van den Burg, F., 1994, Polyethylene terephthalate returnable
bottles (PRBs): a health and safety assessment. . Food Additives and Contaminants Vol. 11, 571-594.
[2] EU Project AIR2-CT93-1014: Working Group Refillables, Final Report, September 1997.
[3] Demertzis, P.G., Johansson, F. and Franz, R., 1997, Studies on the Development of a Quick Inertness
Test Procedure for Multi-use PET Containers - Sorption Behaviour of Bottle Wall Strips. Packaging
Technology and Science Vol 10, 45-58.
[4] Nielsen, T., Damant, A.P. and Castle L., 1997, Validation studies of a quick inertness test for predicting
the sorption and washing properties of refillable plastic bottles. Food Additives and Contaminants Vol.
14, 685-693.
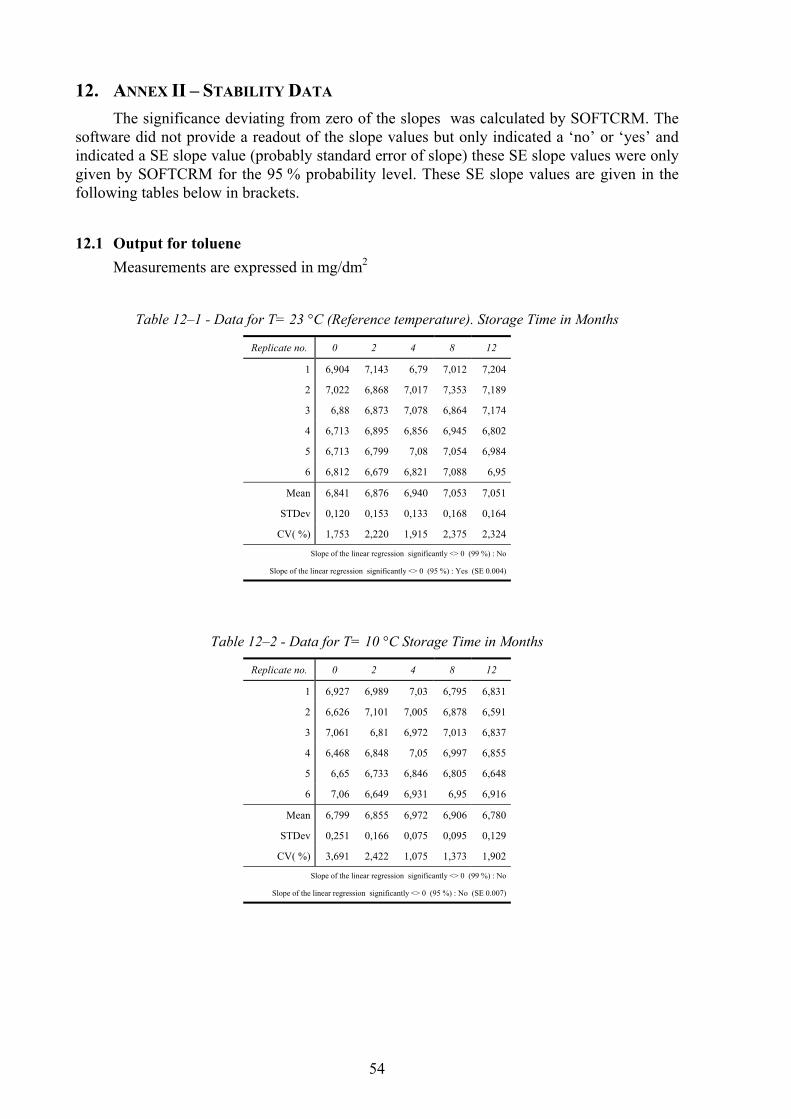
54
12. ANNEX II – STABILITY DATA
The significance deviating from zero of the slopes was calculated by SOFTCRM. The
software did not provide a readout of the slope values but only indicated a ‘no’ or ‘yes’ and
indicated a SE slope value (probably standard error of slope) these SE slope values were only
given by SOFTCRM for the 95 % probability level. These SE slope values are given in the
following tables below in brackets.
12.1 Output for toluene
Measurements are expressed in mg/dm2
Table 12–1 - Data for T= 23 °C (Reference temperature). Storage Time in Months
Replicate no. 0 2 4 8 12
1 6,904 7,143 6,79 7,012 7,204
2 7,022 6,868 7,017 7,353 7,189
3 6,88 6,873 7,078 6,864 7,174
4 6,713 6,895 6,856 6,945 6,802
5 6,713 6,799 7,08 7,054 6,984
6 6,812 6,679 6,821 7,088 6,95
Mean 6,841 6,876 6,940 7,053 7,051
STDev 0,120 0,153 0,133 0,168 0,164
CV( %) 1,753 2,220 1,915 2,375 2,324
Slope of the linear regression significantly <> 0 (99 %) : No
Slope of the linear regression significantly <> 0 (95 %) : Yes (SE 0.004)
Table 12–2 - Data for T= 10 °C Storage Time in Months
Replicate no. 0 2 4 8 12
1 6,927 6,989 7,03 6,795 6,831
2 6,626 7,101 7,005 6,878 6,591
3 7,061 6,81 6,972 7,013 6,837
4 6,468 6,848 7,05 6,997 6,855
5 6,65 6,733 6,846 6,805 6,648
6 7,06 6,649 6,931 6,95 6,916
Mean 6,799 6,855 6,972 6,906 6,780
STDev 0,251 0,166 0,075 0,095 0,129
CV( %) 3,691 2,422 1,075 1,373 1,902
Slope of the linear regression significantly <> 0 (99 %) : No
Slope of the linear regression significantly <> 0 (95 %) : No (SE 0.007)

55
Table 12–3 - Data for T= 60 °C Storage Time in Months
Replicate no. 0 2 4 8 12
1 6,996 6,944 7,025 7,068 6,739
2 7,142 7,171 6,961 7,121 7,082
3 7,154 6,815 7,306 7,09 7,331
4 7,131 6,943 6,986 6,847 6,853
5 6,858 7,252 6,821 6,877 7,317
6 6,823 6,892 6,918 6,927 7,067
Mean 7,017 7,003 7,003 6,988 7,065
STDev 0,149 0,170 0,164 0,119 0,239
CV( %) 2,121 2,432 2,344 1,698 3,384
Slope of the linear regression significantly <> 0 (99 %) : No
Slope of the linear regression significantly <> 0 (95 %) : No (SE 0.005)
12.2 Output for phenol
Measurements are expressed in mg/dm2
Table 12–4 - Data for T= 23 °C (Reference temperature). Storage Time in Months
Replicate no. 0 2 4 8 12
1 3,813 3,974 3,88 3,828 4,172
2 3,845 3,876 4,109 4,069 4,215
3 3,942 3,838 4,043 3,97 4,335
4 3,941 3,928 4,005 4,077 3,933
5 3,945 3,997 4,149 3,953 4,068
6 4,053 3,725 4,054 4,063 4,089
Mean 3,923 3,890 4,040 3,993 4,135
STDev 0,085 0,100 0,093 0,097 0,138
CV( %) 2,170 2,573 2,313 2,430 3,336
Slope of the linear regression significantly <> 0 (99 %) : No
Slope of the linear regression significantly <> 0 (95 %) : No (SE 0.008)
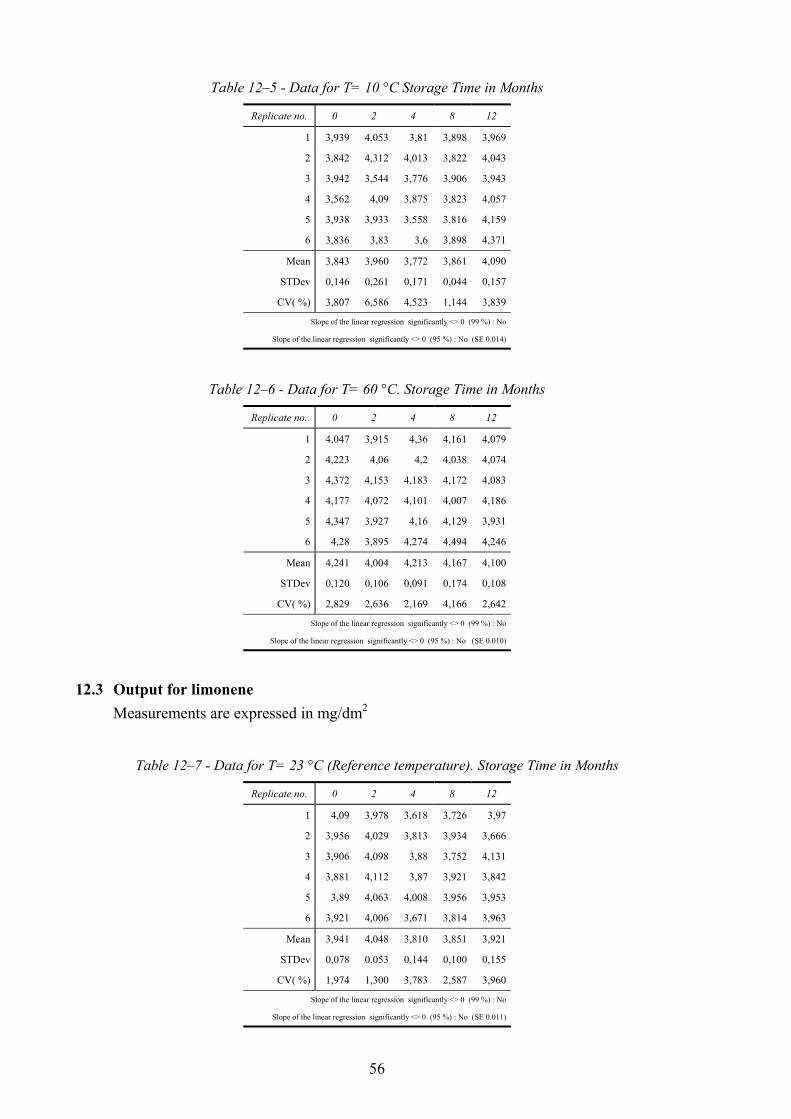
56
Table 12–5 - Data for T= 10 °C Storage Time in Months
Replicate no. 0 2 4 8 12
1 3,939 4,053 3,81 3,898 3,969
2 3,842 4,312 4,013 3,822 4,043
3 3,942 3,544 3,776 3,906 3,943
4 3,562 4,09 3,875 3,823 4,057
5 3,938 3,933 3,558 3,816 4,159
6 3,836 3,83 3,6 3,898 4,371
Mean 3,843 3,960 3,772 3,861 4,090
STDev 0,146 0,261 0,171 0,044 0,157
CV( %) 3,807 6,586 4,523 1,144 3,839
Slope of the linear regression significantly <> 0 (99 %) : No
Slope of the linear regression significantly <> 0 (95 %) : No (SE 0.014)
Table 12–6 - Data for T= 60 °C. Storage Time in Months
Replicate no. 0 2 4 8 12
1 4,047 3,915 4,36 4,161 4,079
2 4,223 4,06 4,2 4,038 4,074
3 4,372 4,153 4,183 4,172 4,083
4 4,177 4,072 4,101 4,007 4,186
5 4,347 3,927 4,16 4,129 3,931
6 4,28 3,895 4,274 4,494 4,246
Mean 4,241 4,004 4,213 4,167 4,100
STDev 0,120 0,106 0,091 0,174 0,108
CV( %) 2,829 2,636 2,169 4,166 2,642
Slope of the linear regression significantly <> 0 (99 %) : No
Slope of the linear regression significantly <> 0 (95 %) : No (SE 0.010)
12.3 Output for limonene
Measurements are expressed in mg/dm2
Table 12–7 - Data for T= 23 °C (Reference temperature). Storage Time in Months
Replicate no. 0 2 4 8 12
1 4,09 3,978 3,618 3,726 3,97
2 3,956 4,029 3,813 3,934 3,666
3 3,906 4,098 3,88 3,752 4,131
4 3,881 4,112 3,87 3,921 3,842
5 3,89 4,063 4,008 3,956 3,953
6 3,921 4,006 3,671 3,814 3,963
Mean 3,941 4,048 3,810 3,851 3,921
STDev 0,078 0,053 0,144 0,100 0,155
CV( %) 1,974 1,300 3,783 2,587 3,960
Slope of the linear regression significantly <> 0 (99 %) : No
Slope of the linear regression significantly <> 0 (95 %) : No (SE 0.011)
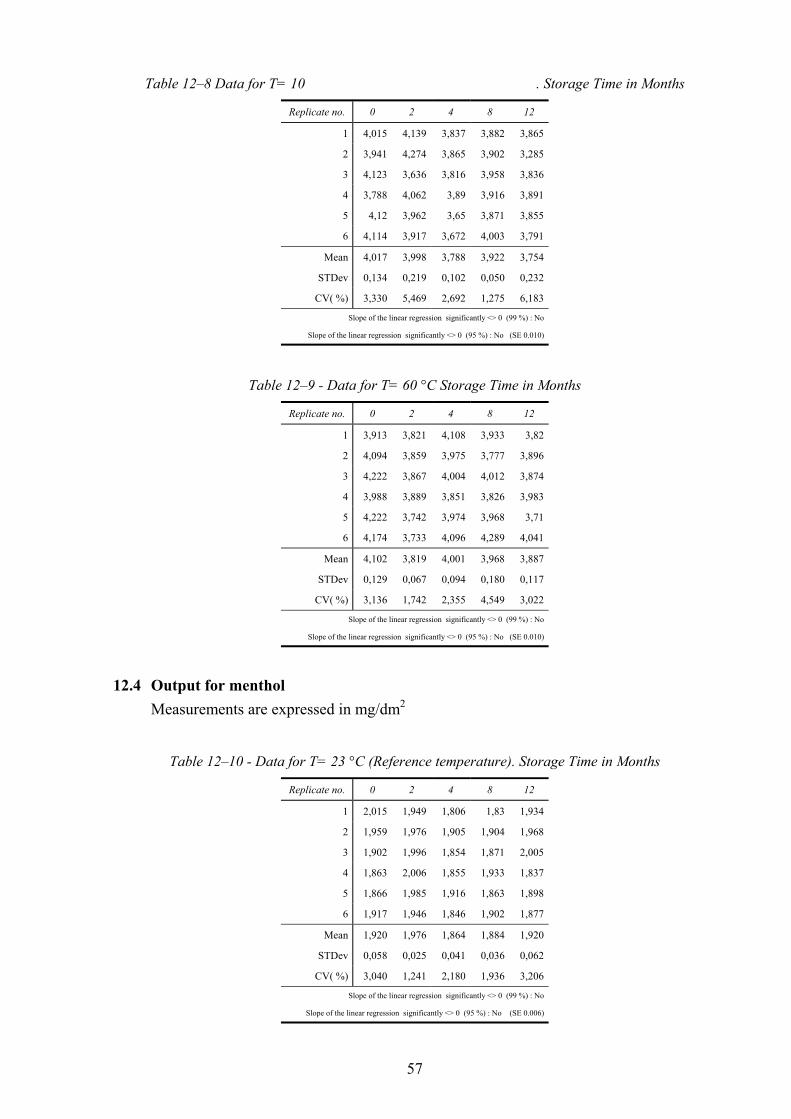
57
Table 12–8 Data for T= 10 . Storage Time in Months
Replicate no. 0 2 4 8 12
1 4,015 4,139 3,837 3,882 3,865
2 3,941 4,274 3,865 3,902 3,285
3 4,123 3,636 3,816 3,958 3,836
4 3,788 4,062 3,89 3,916 3,891
5 4,12 3,962 3,65 3,871 3,855
6 4,114 3,917 3,672 4,003 3,791
Mean 4,017 3,998 3,788 3,922 3,754
STDev 0,134 0,219 0,102 0,050 0,232
CV( %) 3,330 5,469 2,692 1,275 6,183
Slope of the linear regression significantly <> 0 (99 %) : No
Slope of the linear regression significantly <> 0 (95 %) : No (SE 0.010)
Table 12–9 - Data for T= 60 °C Storage Time in Months
Replicate no. 0 2 4 8 12
1 3,913 3,821 4,108 3,933 3,82
2 4,094 3,859 3,975 3,777 3,896
3 4,222 3,867 4,004 4,012 3,874
4 3,988 3,889 3,851 3,826 3,983
5 4,222 3,742 3,974 3,968 3,71
6 4,174 3,733 4,096 4,289 4,041
Mean 4,102 3,819 4,001 3,968 3,887
STDev 0,129 0,067 0,094 0,180 0,117
CV( %) 3,136 1,742 2,355 4,549 3,022
Slope of the linear regression significantly <> 0 (99 %) : No
Slope of the linear regression significantly <> 0 (95 %) : No (SE 0.010)
12.4 Output for menthol
Measurements are expressed in mg/dm2
Table 12–10 - Data for T= 23 °C (Reference temperature). Storage Time in Months
Replicate no. 0 2 4 8 12
1 2,015 1,949 1,806 1,83 1,934
2 1,959 1,976 1,905 1,904 1,968
3 1,902 1,996 1,854 1,871 2,005
4 1,863 2,006 1,855 1,933 1,837
5 1,866 1,985 1,916 1,863 1,898
6 1,917 1,946 1,846 1,902 1,877
Mean 1,920 1,976 1,864 1,884 1,920
STDev 0,058 0,025 0,041 0,036 0,062
CV( %) 3,040 1,241 2,180 1,936 3,206
Slope of the linear regression significantly <> 0 (99 %) : No
Slope of the linear regression significantly <> 0 (95 %) : No (SE 0.006)

58
Table 12–11 - Data for T= 10 °C Storage Time in Months
Replicate no. 0 2 4 8 12
1 1,772 1,79 1,754 1,873 1,858
2 1,704 1,848 1,796 1,786 1,85
3 1,757 1,758 1,826 1,857 1,812
4 1,602 1,824 1,726 1,773 1,878
5 1,75 1,831 1,851 1,857 1,899
6 1,756 1,83 1,848 1,865 1,993
Mean 1,724 1,814 1,800 1,835 1,882
STDev 0,064 0,033 0,051 0,044 0,062
CV( %) 3,704 1,831 2,853 2,382 3,287
Slope of the linear regression significantly <> 0 (99 %) : No
Slope of the linear regression significantly <> 0 (95 %) : Yes (SE 0.004)
Table 12–12- Data for T= 60 °C. Storage Time in Months
Replicate no. 0 2 4 8 12
1 1,879 1,704 1,85 1,863 1,857
2 1,98 1,781 1,886 1,778 1,819
3 2,033 1,814 1,797 1,769 1,827
4 1,926 1,692 1,823 1,898 1,642
5 2,007 1,853 1,822 1,729 1,67
6 2,003 1,806 1,827 1,634 1,797
Mean 1,971 1,775 1,834 1,779 1,769
STDev 0,058 0,064 0,030 0,095 0,090
CV( %) 2,935 3,610 1,661 5,325 5,077
Slope of the linear regression significantly <> 0 (99 %) : No
Slope of the linear regression significantly <> 0 (95 %) : No (SE 0.004)
12.5 Output for phenyl cyclohexane
Measurements are expressed in mg/dm2
Table 12–13 - Data for T= 23 °C (Reference temperature). Storage Time in Months
Replicate no. 0 2 4 8 12
1 3,572 3,626 3,388 3,39 3,597
2 3,572 3,616 3,555 3,557 3,638
3 3,627 3,584 3,475 3,475 3,715
4 3,442 3,445 3,452 3,569 3,394
5 3,389 3,58 3,596 3,481 3,499
6 3,588 3,544 3,473 3,557 3,495
Mean 3,532 3,566 3,490 3,505 3,556
STDev 0,094 0,066 0,075 0,070 0,116
CV( %) 2,653 1,849 2,138 1,985 3,253
Slope of the linear regression significantly <> 0 (99 %) : No
Slope of the linear regression significantly <> 0 (95 %) : No (SE 0.004)
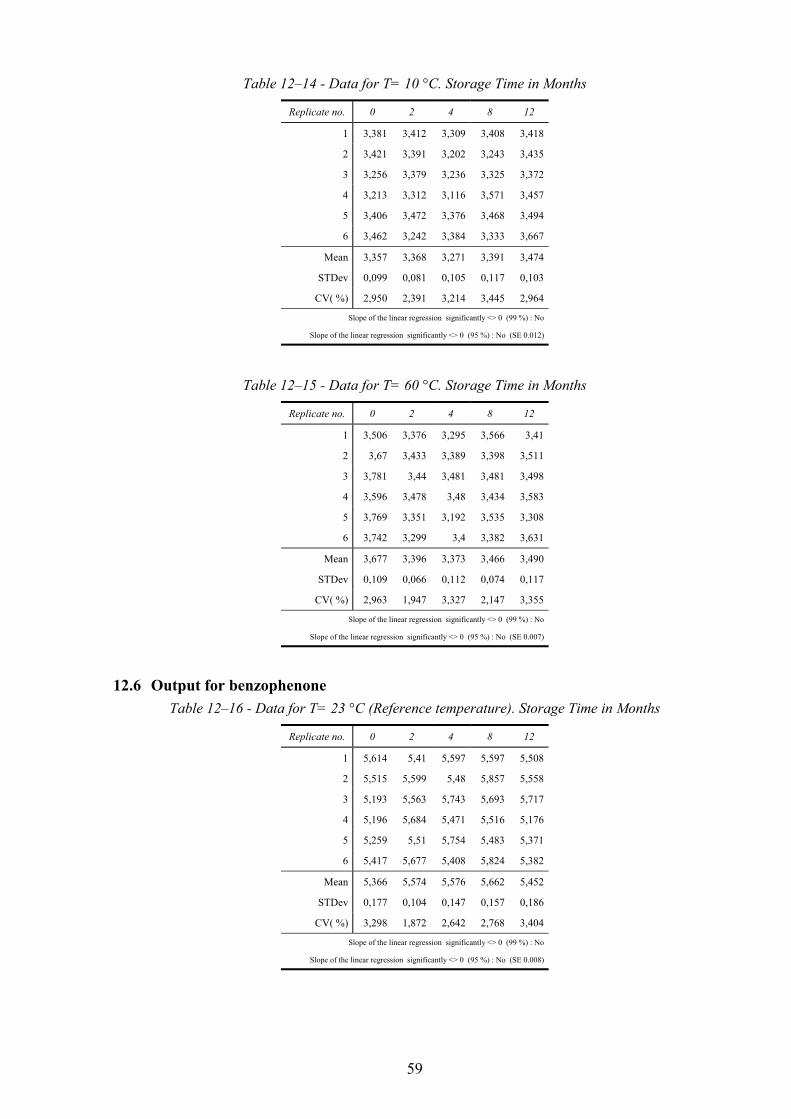
59
Table 12–14 - Data for T= 10 °C. Storage Time in Months
Replicate no. 0 2 4 8 12
1 3,381 3,412 3,309 3,408 3,418
2 3,421 3,391 3,202 3,243 3,435
3 3,256 3,379 3,236 3,325 3,372
4 3,213 3,312 3,116 3,571 3,457
5 3,406 3,472 3,376 3,468 3,494
6 3,462 3,242 3,384 3,333 3,667
Mean 3,357 3,368 3,271 3,391 3,474
STDev 0,099 0,081 0,105 0,117 0,103
CV( %) 2,950 2,391 3,214 3,445 2,964
Slope of the linear regression significantly <> 0 (99 %) : No
Slope of the linear regression significantly <> 0 (95 %) : No (SE 0.012)
Table 12–15 - Data for T= 60 °C. Storage Time in Months
Replicate no. 0 2 4 8 12
1 3,506 3,376 3,295 3,566 3,41
2 3,67 3,433 3,389 3,398 3,511
3 3,781 3,44 3,481 3,481 3,498
4 3,596 3,478 3,48 3,434 3,583
5 3,769 3,351 3,192 3,535 3,308
6 3,742 3,299 3,4 3,382 3,631
Mean 3,677 3,396 3,373 3,466 3,490
STDev 0,109 0,066 0,112 0,074 0,117
CV( %) 2,963 1,947 3,327 2,147 3,355
Slope of the linear regression significantly <> 0 (99 %) : No
Slope of the linear regression significantly <> 0 (95 %) : No (SE 0.007)
12.6 Output for benzophenone
Table 12–16 - Data for T= 23 °C (Reference temperature). Storage Time in Months
Replicate no. 0 2 4 8 12
1 5,614 5,41 5,597 5,597 5,508
2 5,515 5,599 5,48 5,857 5,558
3 5,193 5,563 5,743 5,693 5,717
4 5,196 5,684 5,471 5,516 5,176
5 5,259 5,51 5,754 5,483 5,371
6 5,417 5,677 5,408 5,824 5,382
Mean 5,366 5,574 5,576 5,662 5,452
STDev 0,177 0,104 0,147 0,157 0,186
CV( %) 3,298 1,872 2,642 2,768 3,404
Slope of the linear regression significantly <> 0 (99 %) : No
Slope of the linear regression significantly <> 0 (95 %) : No (SE 0.008)
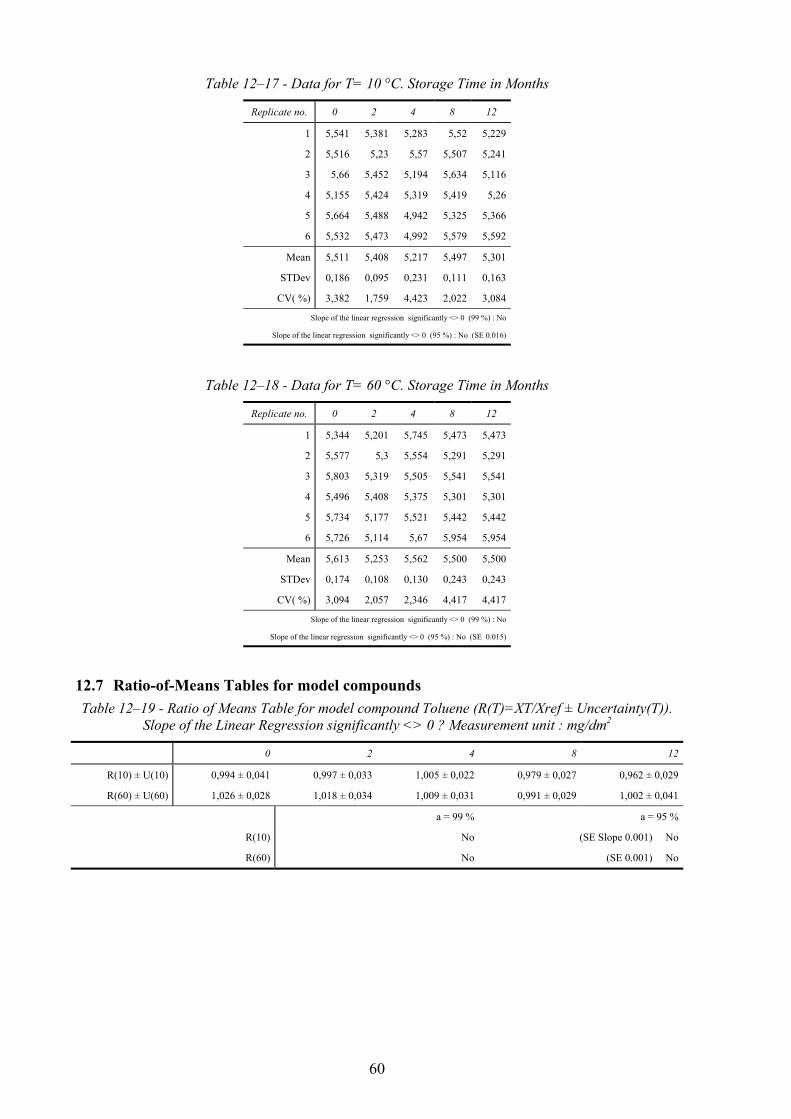
60
Table 12–17 - Data for T= 10 °C. Storage Time in Months
Replicate no. 0 2 4 8 12
1 5,541 5,381 5,283 5,52 5,229
2 5,516 5,23 5,57 5,507 5,241
3 5,66 5,452 5,194 5,634 5,116
4 5,155 5,424 5,319 5,419 5,26
5 5,664 5,488 4,942 5,325 5,366
6 5,532 5,473 4,992 5,579 5,592
Mean 5,511 5,408 5,217 5,497 5,301
STDev 0,186 0,095 0,231 0,111 0,163
CV( %) 3,382 1,759 4,423 2,022 3,084
Slope of the linear regression significantly <> 0 (99 %) : No
Slope of the linear regression significantly <> 0 (95 %) : No (SE 0.016)
Table 12–18 - Data for T= 60 °C. Storage Time in Months
Replicate no. 0 2 4 8 12
1 5,344 5,201 5,745 5,473 5,473
2 5,577 5,3 5,554 5,291 5,291
3 5,803 5,319 5,505 5,541 5,541
4 5,496 5,408 5,375 5,301 5,301
5 5,734 5,177 5,521 5,442 5,442
6 5,726 5,114 5,67 5,954 5,954
Mean 5,613 5,253 5,562 5,500 5,500
STDev 0,174 0,108 0,130 0,243 0,243
CV( %) 3,094 2,057 2,346 4,417 4,417
Slope of the linear regression significantly <> 0 (99 %) : No
Slope of the linear regression significantly <> 0 (95 %) : No (SE 0.015)
12.7 Ratio-of-Means Tables for model compounds
Table 12–19 - Ratio of Means Table for model compound Toluene (R(T)=XT/Xref ± Uncertainty(T)).
Slope of the Linear Regression significantly <> 0 ? Measurement unit : mg/dm2
0 2 4 8 12
R(10) ± U(10) 0,994 ± 0,041 0,997 ± 0,033 1,005 ± 0,022 0,979 ± 0,027 0,962 ± 0,029
R(60) ± U(60) 1,026 ± 0,028 1,018 ± 0,034 1,009 ± 0,031 0,991 ± 0,029 1,002 ± 0,041
a = 99 % a = 95 %
R(10) No (SE Slope 0.001) No
R(60) No (SE 0.001) No
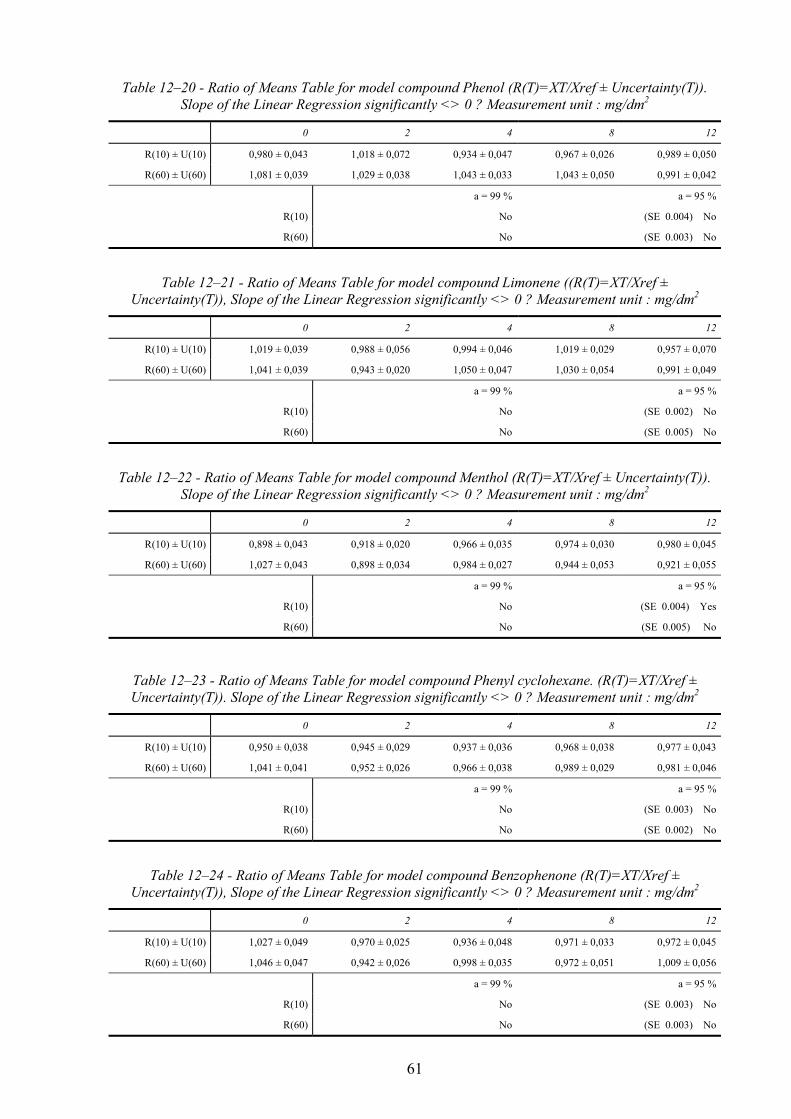
61
Table 12–20 - Ratio of Means Table for model compound Phenol (R(T)=XT/Xref ± Uncertainty(T)).
Slope of the Linear Regression significantly <> 0 ? Measurement unit : mg/dm2
0 2 4 8 12
R(10) ± U(10) 0,980 ± 0,043 1,018 ± 0,072 0,934 ± 0,047 0,967 ± 0,026 0,989 ± 0,050
R(60) ± U(60) 1,081 ± 0,039 1,029 ± 0,038 1,043 ± 0,033 1,043 ± 0,050 0,991 ± 0,042
a = 99 % a = 95 %
R(10) No (SE 0.004) No
R(60) No (SE 0.003) No
Table 12–21 - Ratio of Means Table for model compound Limonene ((R(T)=XT/Xref ±
Uncertainty(T)), Slope of the Linear Regression significantly <> 0 ? Measurement unit : mg/dm2
0 2 4 8 12
R(10) ± U(10) 1,019 ± 0,039 0,988 ± 0,056 0,994 ± 0,046 1,019 ± 0,029 0,957 ± 0,070
R(60) ± U(60) 1,041 ± 0,039 0,943 ± 0,020 1,050 ± 0,047 1,030 ± 0,054 0,991 ± 0,049
a = 99 % a = 95 %
R(10) No (SE 0.002) No
R(60) No (SE 0.005) No
Table 12–22 - Ratio of Means Table for model compound Menthol (R(T)=XT/Xref ± Uncertainty(T)).
Slope of the Linear Regression significantly <> 0 ? Measurement unit : mg/dm2
0 2 4 8 12
R(10) ± U(10) 0,898 ± 0,043 0,918 ± 0,020 0,966 ± 0,035 0,974 ± 0,030 0,980 ± 0,045
R(60) ± U(60) 1,027 ± 0,043 0,898 ± 0,034 0,984 ± 0,027 0,944 ± 0,053 0,921 ± 0,055
a = 99 % a = 95 %
R(10) No (SE 0.004) Yes
R(60) No (SE 0.005) No
Table 12–23 - Ratio of Means Table for model compound Phenyl cyclohexane. (R(T)=XT/Xref ±
Uncertainty(T)). Slope of the Linear Regression significantly <> 0 ? Measurement unit : mg/dm2
0 2 4 8 12
R(10) ± U(10) 0,950 ± 0,038 0,945 ± 0,029 0,937 ± 0,036 0,968 ± 0,038 0,977 ± 0,043
R(60) ± U(60) 1,041 ± 0,041 0,952 ± 0,026 0,966 ± 0,038 0,989 ± 0,029 0,981 ± 0,046
a = 99 % a = 95 %
R(10) No (SE 0.003) No
R(60) No (SE 0.002) No
Table 12–24 - Ratio of Means Table for model compound Benzophenone (R(T)=XT/Xref ±
Uncertainty(T)), Slope of the Linear Regression significantly <> 0 ? Measurement unit : mg/dm2
0 2 4 8 12
R(10) ± U(10) 1,027 ± 0,049 0,970 ± 0,025 0,936 ± 0,048 0,971 ± 0,033 0,972 ± 0,045
R(60) ± U(60) 1,046 ± 0,047 0,942 ± 0,026 0,998 ± 0,035 0,972 ± 0,051 1,009 ± 0,056
a = 99 % a = 95 %
R(10) No (SE 0.003) No
R(60) No (SE 0.003) No

62
13. ANNEX III – HOMOGENEITY DATA
Table 13–1 - Individual test results of bottle material thickness at height 110 mm
Sampling batch Individual test results
0.624 0.626 0.618 0.614
1 0.621 0.627 0.612 0.621
0.626 0.607 0.623 0.610
0.621 0.619 0.617 0.614
0.616 0.617 0.624 0.622
2 0.616 0.620 0.622 0.614
0.623 0.626 0.614 0.608
0.621 0.619 0.615 0.615
0.623 0.622 0.622 0.616
3 0.617 0.623 0.602 0.611
0.618 0.615 0.620 0.623
0.619 0.623 0.608 0.614
0.621 0.616 0.622 0.628
4 0.607 0.615 0.604 0.607
0.622 0.609 0.616 0.616
0.618 0.605 0.615 0.625
0.623 0.613 0.616 0.621
5 0.609 0.617 0.623 0.611
0.626 0.613 0.600 0.605
0.612 0.605 0.611 0.624
0.614 0.634 0.620 0.619
6 0.621 0.621 0.602 0.612
0.624 0.610 0.614 0.618
0.622 0.615 0.613 0.620
0.626 0.621 0.608 0.625
7 0.618 0.622 0.627 0.618
0.613 0.621 0.612 0.620
0.624 0.628 0.609 0.623

European Commission
EUR 21075 – DG Joint Research Centre, Institute for Reference Materials and Measurements – Certification of a refillable PET bottle material with respect to chemical inertness behaviour according to a pr-CEN standard method, BCR-712 Authors: R. Franz, G. Palzer, B.M. Gawlik, A. Bernreuther, A. Lamberty, D. Bennink Luxembourg: Office for Official Publications of the European Communities 2004 – 62 pp. –21.0 x 29.7 cm Scientific and Technical Research series ISBN 92-894-7220-0
Abstract
A standardised and easy-to-apply method for general chemical inertness testing of refillable PET bottles was developed. It is applicable not only for the industry but also suitable for enforcement laboratories having for the first time a systematic control possibility to check the food safety of refilled PET bottles taken from the market. This chemical inertness test covers the sum of possible mechanical stress influences on the inertness behaviour of a PET material and, in case of complaint, allows the conclusion to the enforcement authority that something in the bottle manufacture process or in the wash/refill system went wrong or the recycle number might be too high. In addition, a food grade reference PET material was prepared which fulfils the principle requirement of article 2 of the Framework Directive 89/109/EEC (1). This reference material was certified with respect to its interactivity values as shown below. Certified values were accompanied by an expanded uncertainty according to the requirements laid down in the Guide for the Expression of Uncertainty in Measurement (GUM) (2).

The mission of the Joint Research Centre is to provide customer-driven scientific and technical support for the conception, development, implementation and monitoring of European Union policies. As a service of the European Commission, the JRC functions as a reference centre of science and technology for the Community. Close to the policy-making process, it serves the common interest of the Member States, while being independent of commercial and national interests.
15
L
A-N
A-2
10
75
-EN
-C