certification project template -...
TRANSCRIPT
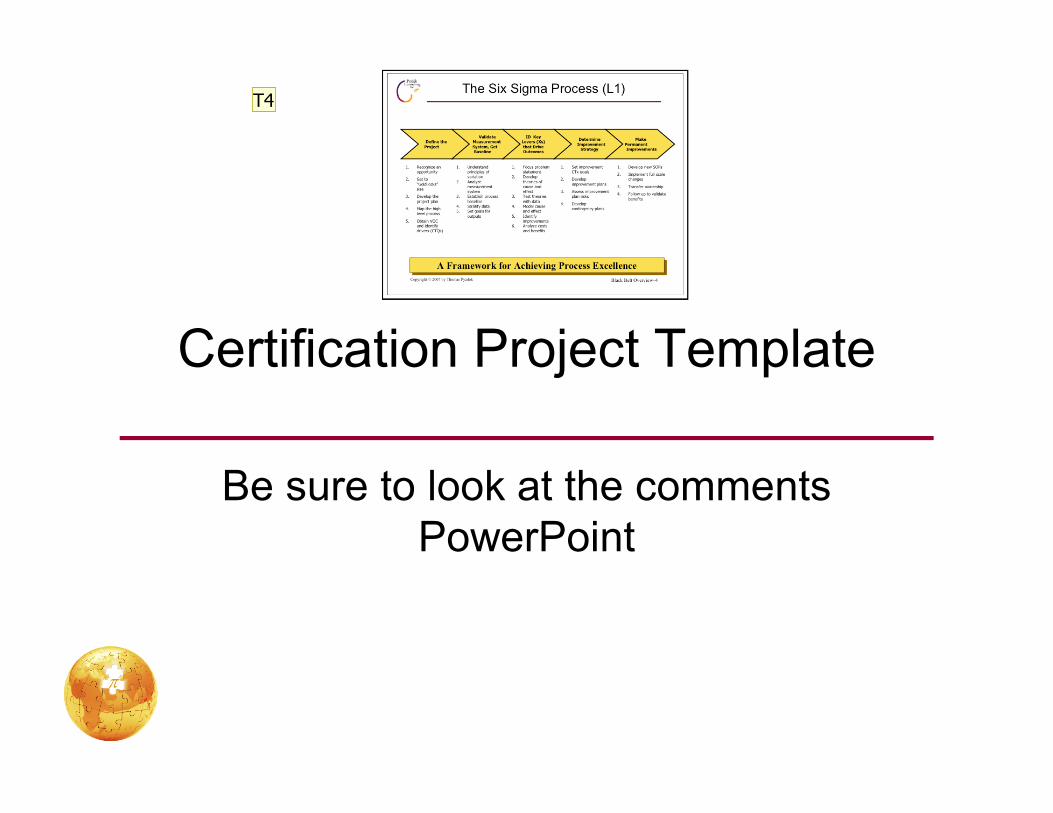
Certification Project Template
Be sure to look at the comments PowerPoint
T4
Slide 1
T4 This slide is from the Overview lesson for your course. You may wish to watch the entire overview video lesson before completing your projectTom, 2/11/2012
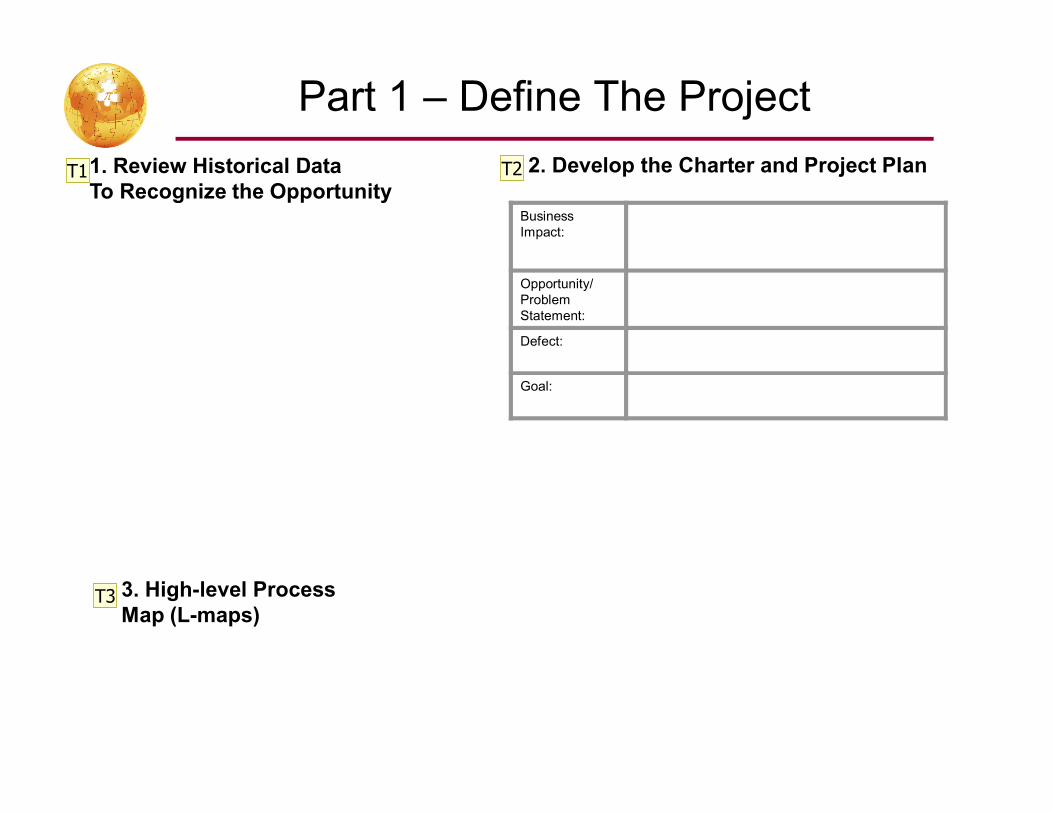
Part 1 – Define The Project
Business Impact:
Opportunity/ Problem Statement:
Defect:
Goal:
2. Develop the Charter and Project Plan1. Review Historical Data To Recognize the Opportunity
3. High-level Process Map (L-maps)
T1 T2
T3
Slide 2
T1 Pareto diagram showing that the opportunity addressed by this project is one of the top drivers of an important organizational goal.Tom, 2/11/2012
T2 Excerpts from the project charter previously approved by The Pyzdek Institute.Tom, 2/11/2012
T3 L-maps going from L1 to an actionable process step that includes the area addressed by your project. Tom, 2/11/2012
Part 1 – Define The Project
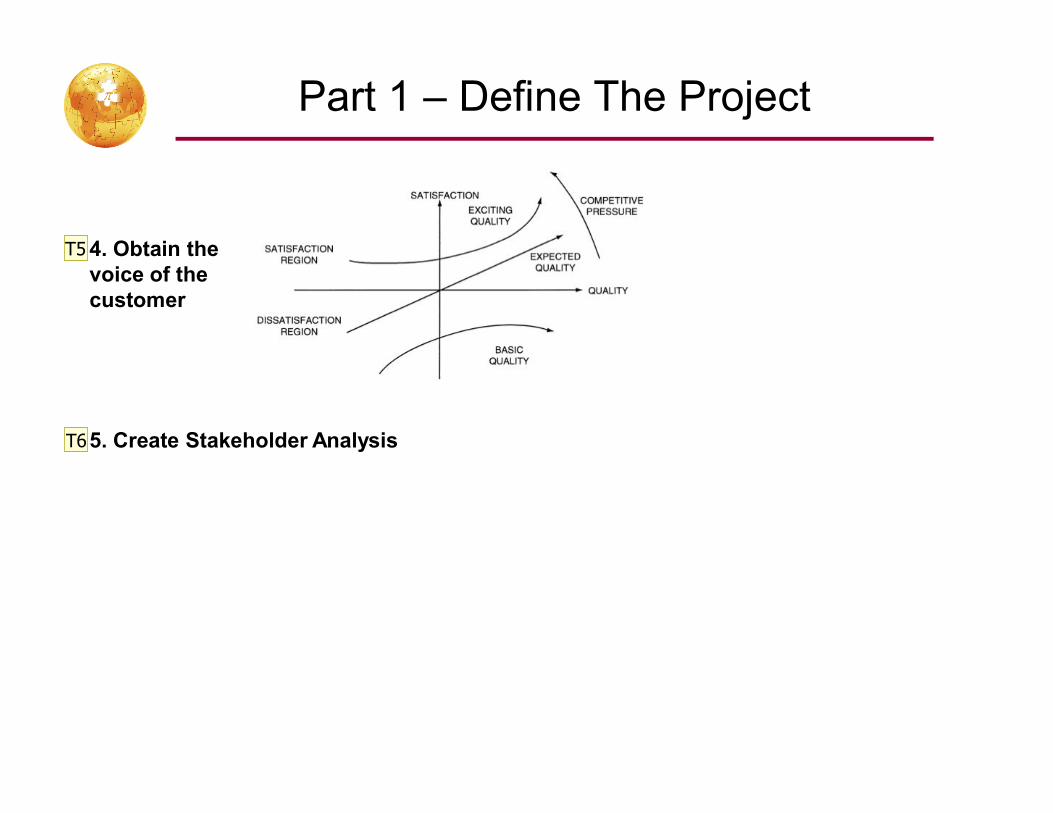
4. Obtain the voice of the customer
5. Create Stakeholder Analysis
T5
T6
Slide 3
T5 Show VOC results. A Kano diagram can be used to classify the customer demands as Basic, Expected or Exciting. Things that are exciting to customers are generally not obtained by asking customers directly. Instead they are inferred from observing what customers actually do.
You may also wish to show analyses of historical data on VOC.Tom, 2/19/2012
T6 Complete a stakeholder support worksheet for the situation that existed at the outset of the project. Be prepared to explain how you obtained the support you needed.Tom, 2/11/2012
Part 2 – Validate Measurement System
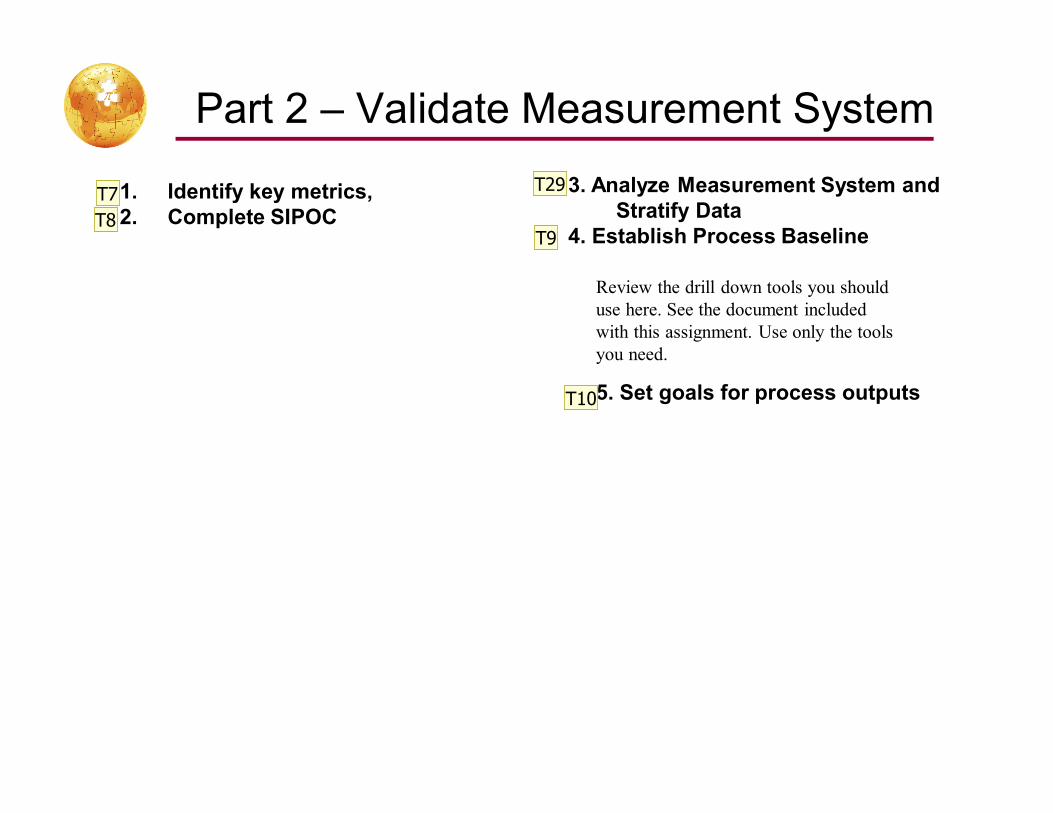
1. Identify key metrics, 2. Complete SIPOC
3. Analyze Measurement System and Stratify Data
4. Establish Process Baseline
5. Set goals for process outputs
Review the drill down tools you should use here. See the document included with this assignment. Use only the tools you need.
T7
T8T9
T10
T29
Slide 4
T7 Show how you drilled down from your project goal to the CTQs that your project addressed. Use a Tree diagram.Tom, 2/11/2012
T8 Self-explanitory.Tom, 2/11/2012
T9 Using control charts show how the process performed before your project. Tom, 2/19/2012
T10 Self-explanitory. Use benchmarking if feasible.Tom, 2/11/2012
T29 Using tools such as stratified frequency plots, histograms, tables, etc. show data that confirms your drill-down analysis.
Show the results of your measurement systems analysis.Tom, 2/19/2012
Part 3 – ID Key Levers
1. Model Detailed “As-Is” Process
2. Summarize what you’ve learned based on observations, data and analysis up to this point.
3. Develop theories of cause and effect
T13
T14
T15
Slide 5
T13 Activity mapTom, 2/11/2012
T14 Cause-and-effect diagram or equivalent. The "Effect" being analyzed should be based on the problem statement for the project. The causes should include everything of relevance learned up to this point in the project. Based on what has been observed and discovered through data analysis, highlight the most likely problem causes.Tom, 2/11/2012
T15 List the 3 to 5 most important things you have learned from your work up to this point. These should be things that will help guide you as you move forward.Tom, 2/11/2012
Part 3 – ID Key Levers
4. Perform Failure Mode Effects AnalysisT16
Slide 6
T16 Using the Cause-and-effect diagram identify the ways in which the process fails, thereby contributing to the problem being addressed by your project. Then use the FMEA tool to analyze each failure mode and determine its RPN. Your improvement plan will address the failure modes with the highest RPNs.Tom, 2/11/2012
Part 4 – Determine Improvement Strategy
2. Improvement plan
3. Assessed improvement plan risk and developed contingencies by updating the FMEA
1. Set improvement goals and Map the To-be Process
T17
T18
T19
Slide 7
T17 Create an opportunity map for the process. Be prepared to explain how your team acted on the opportunities.Tom, 2/11/2012
T18 List the major points of the improvement plan here. Be prepared to discuss one or more of the points.Tom, 2/11/2012
T19 Show how your improvement plan addressed the top failure modes and changed the worst RPNs.Tom, 2/11/2012
Part 4 – Determine Improvement Strategy
3. Execute Pilot
Revenue
(one time)
Cost Avoidance/FYItem
4. Improvement Results
5. Improvement Benefits
T20
T21
T22
Slide 8
T20 Describe how you tested the improvements prior to full-scale implementation.Tom, 2/11/2012
T21 List the major improvements in the process which were caused by your project. I.e., show how your project made the CTQs better.Tom, 2/11/2012
T22 List the improvements which occurred as a result of your project. I.e., show the improvements in the project Y, financial benefits, impact on the problem addressed by the project, or other important outcome.Tom, 2/11/2012
Part 5 – Make Permanent Improvements
1. Implement full scale changes
2. Institute Control Metrics
T23
T24
Slide 9
T23 Discuss how you implemented full-scale process changes.
Show the before versus after results using a tool such as a control chart.Tom, 2/11/2012
T24 Discuss the process control metrics you created for the owner of the new process and which SPC tool or tools you put into place.Tom, 2/11/2012
Part 5 – Make Permanent Improvements
4. Validate new measurement system 5. Transfer Ownership
6. Validate Benefits
T25
T26
T27
Slide 10
T25 Provide data showing that the new process control metrics and SPC tools were properly implemented and used.Tom, 2/11/2012
T26 Provide data showing that the improvements produced the expected benefits.Tom, 2/11/2012
T27 Provide evidence that the process owner has accepted his or her responsiblity for operating and improving the new process. E.g., dashboard review meetings, Kaizen events, etc..Tom, 2/11/2012
Project Tollgate & Tools Checklist
AnalyzeAnalyze ControlControlImproveImproveMeasureMeasureDefineDefine
T28
Slide 11
T28 Show a completed project tollgate. The tollgate checklist should show which tools were used in this project.Tom, 2/11/2012