certification report the certification of the cold filter...
TRANSCRIPT

CERTIFICATION REPORT
The certification of the cold filter plugging point (CFPP) and
the cloud point (CP) in biodiesel from rapeseed:
ERM®- EF002
EU
R 2
75
77
EN
- 20
16
JRC-IRMM promotes a common and reliable European measurement provides reference measurements. European Commission
Joint Research Centre
Institute for Reference Materials and Measurements (IRMM)
Contact information
Reference materials sales
Address: Institute for Reference Materials and Measurements, Retieseweg 111, 2440 Geel, Belgium
E-mail: [email protected]
Tel.: +32 (0)14 571 705
JRC Science Hub
https://ec.europa.eu/jrc
Legal Notice
This publication is a Reference Materials Report by the Joint Research Centre, the European Commission’s in-house science service. It aims to provide
evidence-based scientific support to the European policy-making process. The scientific output expressed does not imply a policy position of the
European Commission. Neither the European Commission nor any person acting on behalf of the Commission is responsible for the use which might
be made of this publication.
All images © European Union 2016
JRC98560
EUR 27577 EN
ISBN 978-92-79-53882-7 (PDF)
ISSN 1831-9424 (online)
doi: 10.2787/434305
Luxembourg: Publications Office of the European Union, 2016
© European Union, 2016
Reproduction is authorised provided the source is acknowledged.
Printed in Belgium
Abstract
This report describes the production of ERM-EF002, which is a 100 % rapeseed oil based fatty acid methyl ester (biodiesel) material certified for cold
filter plugging point (CFPP) and cloud point (CP). The material was produced following ISO Guide 34:2009 and is certified in accordance with ISO Guide
35:2006.
A mixture of fatty acid methyl esters (FAME) derived from rapeseed oil with the addition of 1 g/kg of butylhydroxytoluene (BHT) as an antioxidant was
purchased. The material was mixed ampouled in amber glass ampoules.
Between-unit homogeneity was quantified, and stability during dispatch and storage were assessed following ISO Guide 35:2006 [ ]. Within-unit
homogeneity was not quantified as the minimum sample intake is defined by the methods used and comprises almost the whole volume of the two
ampoules of every unit.
The material was characterised by an inter-comparison among laboratories of demonstrated competence and adhering to ISO/IEC 17025. Technically
invalid results were removed, but no outlier was eliminated on statistical grounds.
Uncertainties of the certified values were calculated in compliance with the Guide to the Expression of Uncertainty in Measurement (GUM), including
uncertainties related to possible inhomogeneity, instability and characterisation.
The material is intended for the quality control and assessment of method performance. As any reference material, it can also be used for control
charts or validation studies. The certified reference material (CRM) is available in sets of two glass ampoules containing each 27 mL of biodiesel
closed under argon atmosphere. The contents of the two ampoules shall be pooled to obtain one sample of 50 mL.
The CRM was accepted as European Reference Material (ERM®) after peer evaluation by the partners of the European Reference Materials consortium.

CERTIFICATION REPORT
The certification of the cold filter plugging point (CFPP) and the cloud point (CP) in biodiesel from rapeseed :
ERM®-EF002
A. Perez, T.P.J. Linsinger
European Commission, Joint Research Centre Institute for Reference Materials and Measurements (IRMM)
Geel, Belgium

Disclaimer Certain commercial equipment, instruments, and materials are identified in this paper to specify adequately the experimental procedure. In no case does such identification imply recommendation or endorsement by the European Commission, nor does it imply that the material or equipment is necessarily the best available for the purpose.

European Commission
EUR 27577 EN – Joint Research Centre – Institute for Reference Materials and Measurements
Title: CERTIFICATION REPORT The certification of the cold filter plugging point (CFPP) and the cloud point (CP)
in biodiesel from rapeseed: ERM®- EF002
Author(s): A. Perez, T.P.J. Linsinger
Luxembourg: Publications Office of the European Union
2016 – 36 pp. – 21.0 x 29.7 cm
EUR – Scientific and Technical Research series – ISSN 1831-9424
ISBN 978-92-79-53882-7
doi: 10.2787/434305

1
Summary This report describes the production of ERM-EF002, which is a 100 % rapeseed oil based fatty acid methyl ester (biodiesel) material certified for cold filter plugging point (CFPP) and cloud point (CP). The material was produced following ISO Guide 34:2009 [1] and is certified in accordance with ISO Guide 35:2006 [2].
A mixture of fatty acid methyl esters (FAME) derived from rapeseed oil with the addition of 1 g/kg of butylhydroxytoluene (BHT) as an antioxidant was purchased. The material was mixed ampouled in amber glass ampoules.
Between-unit homogeneity was quantified, and stability during dispatch and storage were assessed following ISO Guide 35:2006 [2]. Within-unit homogeneity was not quantified as the minimum sample intake is defined by the methods used and comprises almost the whole volume of the two ampoules of every unit.
The material was characterised by an inter-comparison among laboratories of demonstrated competence and adhering to ISO/IEC 17025 [3]. Technically invalid results were removed, but no outlier was eliminated on statistical grounds.
Uncertainties of the certified values were calculated in compliance with the Guide to the Expression of Uncertainty in Measurement (GUM) [4], including uncertainties related to possible inhomogeneity, instability and characterisation.
The material is intended for the quality control and assessment of method performance. As any reference material, it can also be used for control charts or validation studies. The certified reference material (CRM) is available in sets of two glass ampoules containing each 27 mL of biodiesel closed under argon atmosphere. The contents of the two ampoules shall be pooled to obtain one sample of 50 mL.
The CRM was accepted as European Reference Material (ERM®) after peer evaluation by the partners of the European Reference Materials consortium.
The following certified values were assigned:
Certified value 3) [°C]
Uncertainty 4)
[°C]
Cold filter plugging point (CFPP) 1) -15.2 1.3
Cloud point (CP) 2) -4.5 1.0 1) As defined by EN 116:1997 or ASTM D6371-05:2010 using the automatic procedure.
2) As defined by EN 23015:1994, ISO 3015:1992 or ASTM D2500-09:2011 using the automatic or manual procedure.
3) Unweighted mean value of the means of accepted sets of data, each set being obtained in a different laboratory and/or with a different method of determination. The certified value and its uncertainty are traceable to the International System of Units (SI).
4) Expanded uncertainty with a coverage factor k = 2 corresponding to a level of confidence of about 95 % estimated following ISO/IEC Guide 98-3, Guide to the Expression of Uncertainty in Measurement (GUM:1995), ISO, 2008.
Disclaimer
In this paper, certain commercial equipment, instruments, and materials are identified to specify the experimental procedure adequately. In no case does such identification imply recommendation or endorsement by the European Commission nor does it imply that the material or equipment is necessarily the best available for the purpose.

2

3
Table of Contents Summary ........................................... ................................................................................... 1
Table of contents ................................. ................................................................................ 3
Glossary .......................................... ..................................................................................... 4
1 Introduction ...................................... ........................................................................ 7
1.1 Background ............................................................................................................... 7
1.2 Choice of the material ................................................................................................ 8
1.3 Design of the CRM project ......................................................................................... 9
1.4 Accuracy of the measurements .................................................................................. 9
2 Participants ...................................... .......................................................................10
2.1 Project management and evaluation .........................................................................10
2.2 Processing ................................................................................................................10
2.3 Homogeneity study ...................................................................................................10
2.4 Stability study ...........................................................................................................10
2.5 Characterisation ........................................................................................................10
3 Material processing and process control ........... ..................................................11
3.1 Origin of the starting material ....................................................................................11
3.2 Processing ................................................................................................................11
3.3 Process control .........................................................................................................11
3.4 Packaging .................................................................................................................11
4 Homogeneity ....................................... ....................................................................11
4.1 Between-unit homogeneity........................................................................................12
4.2 Within-unit homogeneity and minimum sample intake...............................................14
5 Stability.......................................... ..........................................................................14
5.1 Short-term stability study ..........................................................................................15
5.2 Long-term stability study ...........................................................................................16
5.3 Estimation of uncertainties ........................................................................................16
5.4 Test for repeated use ................................................................................................17
6 Characterisation .................................. ...................................................................17
6.1 Selection of participants ............................................................................................18
6.2 Study setup ...............................................................................................................18
6.3 Methods used ...........................................................................................................18
6.4 Evaluation of results .................................................................................................18
7 Value Assignment .................................. .................................................................20
7.1 Certified values and their uncertainties .....................................................................20
7.2 Additional material information ..................................................................................21
8 Metrological traceability and commutability ....... ..................................................22
8.1 Metrological traceability ............................................................................................22
8.2 Commutability ...........................................................................................................22
9 Instructions for use .............................. ..................................................................23
10 Acknowledgments ................................... ...............................................................25
11 References ........................................ ......................................................................26
Annexes ........................................... ...................................................................................29

4
Glossary
ASTM International
ASTM International (formerly American Society for Testing and Materials)
ANOVA Analysis of variance
BCR® One of the trademarks of CRMs owned by the European Commission; formerly Community Bureau of Reference
BHT Butylhydroxytoluene
CFPP Cold filter plugging point
CI Confidence interval
CP Cloud point
CRM Certified reference material
EC European Commission
EN European norm (standard)
ERM® Trademark of the European Reference Materials Initiative
EU European Union
FA Fatty acids
FAME Fatty acid methyl esters
IRMM Institute for Reference Materials and Measurements of the JRC
ISO International Organization for Standardization
JRC Joint Research Centre of the European Commission
k Coverage factor
n Number of replicates per unit
N Number of samples (units) analysed
n.a. Not applicable
p Number of valid datasets in characterization study
QC Quality control
RM Reference material
RSD Relative standard deviation
s Standard deviation
sbb Between-unit standard deviation
sbetween Standard deviation between groups as obtained from ANOVA
SI International System of Units
SID Unit Standards for Innovation and sustainable Development Unit of JRC-IRMM
smeas Standard deviation of measurement data
sns Standard deviation of results of normal stock samples
swithin Standard deviation within groups as obtained from ANOVA;

5
Sr Repeatability standard deviation
SR Reproducibility standard deviation
T Temperature
t Time
ti Time point for each replicate
tα, df Critical t-value for a t-test, with a level of confidence of 1-α and df degrees of freedom
tsl Proposed shelf life
u standard uncertainty
U expanded uncertainty
u*bb Standard uncertainty related to a maximum between-unit inhomogeneity
that could be hidden by method repeatability
ubb Standard uncertainty related to a possible between-unit inhomogeneity
uc combined standard uncertainty
uchar Standard uncertainty of the material characterisation
uCRM Combined standard uncertainty of the certified value
UCRM Expanded uncertainty of the certified value
u∆ Combined standard uncertainty of measurement result and certified value
ults Standard uncertainty of the long-term stability umeas Standard measurement uncertainty
Umeas Expanded measurement uncertainty
usts Standard uncertainty of the short-term stability
UWL Upper warning limit
V-KFT Volumetric Karl Fischer titration
x Arithmetic mean
α significance level

6

7
1 Introduction
1.1 Background Directive 2003/30/EC, Directive on the promotion of the use of biofuels or other renewable fuels for transport, entered into force in May 2003. One of its aims was to replace 5.75% of all transport fossil fuels with biofuels by 2010. [5]. In April 2009, Directive 2009/28/EC replaced Directive 2003/30/EC. This new directive includes a mandatory target of a 20 % share of energy from renewable sources in overall Community energy consumption by 2020 and a mandatory 10% minimum target for the share of biofuels in transport petrol and diesel consumption by 2020 [6].
In fulfilling this directive, conventional diesel is mixed with biodiesel. In this context, "B5" means diesel with 5% of biodiesel, "B20" diesel means 20% of biodiesel. However, the commodities market trades biodiesel at the highest purity, B100. In some countries, such B100 is also sold at selected petrol stations.
Consequently, there is an increasing demand to measure the quality of biofuels products by technical standards accurately. The fuel quality requirements in Europe are described in [7] and the European Standard EN14214 [8], developed by the European Committee for Standardization (CEN), was released in August 2003 and revised in 2012. Comparable standards are the ASTM D6751 and the Canadian standard CAN/CSGB-3.524.
Among the important properties of biodiesel are the cold flow properties, including CP, CFPP and the pour point (PP). European standards refer to CFPP and CP, but not to PP, mostly used in the US for diesel and biodiesel fuels.
CFPP is the lowest temperature at which a given volume of (bio) diesel can pass through a filter. This gives an estimate of the lowest temperature limit for the use of a (bio)diesel.
CP is the temperature at which the least soluble component of the (bio)diesel begins to precipitate, thus causing lower transmittance of light.
The formation of solids causes both CFPP and CP at low temperatures. Naturally, a certain biodiesel will first develop some precipitates, which reduce transmittance of light. Upon further cooling, the precipitates will be numerous and large enough to block the filter. Therefore, the CP is always higher (less negative) than the CFPP.
Blocking of a filter depends on a multitude of parameters, such as the pore size of the filter, the amount of volume to be filtered, the pressure applied to push the liquid through the filter, etc. Similarly, the formation of precipitates depends – amongst other factors - on the cooling rate. Therefore, neither CP nor CFPP are absolute values, but strongly depend on the experimental conditions applied, i.e. they are method-defined properties. Standardisation is the method of choice to ensure comparability of such measurements. Some standards have been developed for the measurement of CFPP and CP.
The main current standards used are EN 116:1997 [9] and ASTM D6371-05:2010 [10] for CFPP and ASTM D2500-09:2011 [11]and ISO 3015:1992 [12] (also named EN 23015:1994 [13]) for CP. Each of these methods describes a "manual method", i.e. a method where one sample after the other is filtered, but also gives specifications for "automated methods", which require minimal interaction performed by the operator. Currently, both manual and automated methods are used. The latest version of EN 116, released in 2015, does not include manual method anymore.
A closer look at the methods for CFPP and CP reveals that the methods for each parameter differ only slightly in some specifications of thermometers, but that the specifications for the

8
main steps are the same. The methods are therefore equivalent. ASTM-05:2010 explicitly states that the method is technically equivalent to EN 116:1997 for CFPP.
A problem for biodiesels is their propensity to form insoluble precipitates upon storage at low temperature. This problem is believed to be due to the presence of trace impurities, particularly sterol glucosides and saturated monoglycerides. Conversely, these impurities impart favourable lubricity properties to biodiesel. As there is no method to detect these components, an interim solution is to set CP and CFPP limitations in the standard.
The standard EN14214 specifies limits for CFPP and CP in diesel and biodiesel. It also defines limits for these parameters when biodiesel is used as a blend component in diesel fuel and goes even further since it specifies climate-related requirements for these parameters.
While standard methods go a long way to support comparability of results, they cannot guarantee that each laboratory applies the standard correctly. Certified reference materials (CRMs) are needed to give laboratories the possibility to demonstrate their method proficiency and proper working of their instruments.
The Institute for Reference Materials and Measurements, one of the institutes of European Commission's Joint Research Centre (JRC-IRMM) has already released ERM-EF001 [14], a rapeseed-based biodiesel material, which is certified for selected parameters specified in the European Standard EN 14214 for the mass fractions of the ester, linolenic acid methyl ester, monoglyceride, diglyceride, In the frame of the ERM-EF001 project, it was decided not to certify cloud point (CP), and cold filter plugging point (CFPP), as the required sample intakes (50 mL) are much higher than for the other parameters. In filling this gap, a new project was started for the development of ERM-EF002, a CRM for CFPP and CP.
1.2 Choice of the material The goal of this project was to produce a biodiesel CRM, with a similar raw material as used for ERM-EF001, as this allows using experience gained from the stability of the previous material. Therefore, a rapeseed-based biodiesel without flow improving additives was chosen as raw material. Additionally, BHT as an antioxidant was chosen after proving that it has no influence on the CFPP and the CP.
Generally speaking, the two most important factors to explain cold flow properties are FA chain length and degree of unsaturation. The relationship between carbon chain length and low temperatures properties is quite strong for pure FAMEs but is more subtle when considering mixtures of FAMEs as in biodiesel [15].
The most used source of biodiesel in Europe is rapeseed oil, which is derived from low-erucic acid rapeseed oil and is often termed canola oil in America (Canola = Canadian oil low acid). The fatty acid profile according to the producer analysis is shown in Table 1.

9
Table 1: Fatty acid pattern of the FAME used as raw material for ERM-EF002
Fatty acid Result Unit
C12:0 Lauric <0.1 % (m/m) C14:0 Myristic 0.1 % (m/m) C16:0 Palmitic 4.2 % (m/m) C16:1 Palmitoleic 0.3 % (m/m) C18:0 Stearic 1.7 % (m/m) C18:1 Oleic 61.9 % (m/m) C18:2 Linolic 18.7 % (m/m) C18:3 Linolenic 9.9-12.0 % (m/m) C20:0 Arachidic 0.6 % (m/m) C20:1 Gadoleic 1.4 % (m/m) C22:0 Behenic 0.3 % (m/m) C22:1 Erucic 0.6 % (m/m) C24:0 Lignoceric 0.1 % (m/m) C24:1 Nervonic 0.1 % (m/m)
1.3 Design of the CRM project Both CFPP and CP are method-defined properties, which makes it very difficult to demonstrate the absence of bias in a single laboratory. Characterisation by inter-comparison was, therefore, chosen as the certification approach.
Also, to make the material as widely applicable as possible, laboratories adhering to the various equivalent standard methods were selected. The assigned values are therefore applicable to the most commonly used standard methods and equipment.
1.4 Accuracy of the measurements According to all the methods used in this project (EN 116:1997 or ASTM D6371-05:2010 for CFPP and EN 116:1997 and ISO 3015:1992 for CP), the results should be expressed as integer numbers. As quality control of the results, all the standards used describe the maximum dispersion of the data for measurements under repeatability and reproducibility conditions.
• For CFPP, EN 116:1997 states that the difference between two measurements under repeatability conditions will not exceed 1 °C in one case out of 20 and that the difference between two measurements performed under reproducibility conditions will not exceed 0.103*(25-x) °C (x being the measured temperature; for -15.2 °C the result is equal to 4.1°C) in one case out of 20.
• For CP, ASTM D2500-09:2011 states that the difference between two measurements under repeatability conditions will not exceed 2 °C in one case out of 20 and that the difference between two measurements performed under reproducibility conditions will not exceed 4 °C in one case out of 20.
• ASTM D6371-05:2010 for CFPP and ISO 3015 for CP also establish limits for repeatability and reproducibility but they are equal or less restrictive than the standards mentioned earlier, thus ISO 3015:1992 and ASTM D250-90:2011 were selected as quality limits in all measurements.
These limits become the quality criteria to accept the results as valid. On top of that, a quality control sample is analysed together with ERM-EF002 samples to verify the absence of bias in the laboratory measurements.

10
2 Participants 2.1 Project management and evaluation European Commission, Joint Research Centre, Institute for Reference Materials and Measurements (JRC-IRMM), Geel, BE (accredited for ISO Guide 34 for production of certified reference materials, BELAC No. 268-RM)
2.2 Processing European Commission, Joint Research Centre, Institute for Reference Materials and Measurements (JRC-IRMM), Geel, BE
2.3 Homogeneity study Laboratorio de Combustibles. Universidad de A Coruña, Ferrol, ES (measurements under the scope of ISO/IEC 17025 accreditation ENAC No 814/LE1688)
2.4 Stability study Laboratorio de Combustibles, Universidad de A Coruña, Ferrol, ES (measurements under the scope of ISO/IEC 17025 accreditation ENAC No 814/LE1688)
Intertek Spain, Bilbao, ES (measurements under the scope of ISO/IEC 17025 accreditation DAC-Nº 40/LE911)
2.5 Characterisation Participants are listed in alphabetical order.
Azienda Speciale INNOVHUB - Stazione Sperimentale per l'Industria– Divisione Stazione Sperimentale per Combustibili, San Donato Milanese, IT (measurements under the scope of ISO/IEC 17025 accreditation ACCREDIA No 0173-2)
Fundacíon Cetena, Noain, ES (measurements under the scope of ISO/IEC 17025 accreditation ENAC No 69/LE814)
Hansa Group AG, Duisburg, DE (measurements under the scope of ISO/IEC 17025 accreditation DAC-PL-0607-09)
Inspectorate, Antwerpen, BE (measurements under the scope of ISO/IEC 17025 accreditation BELAC No 486-TEST)
Intertek Belgium NV, Antwerpen, BE (measurements under the scope of ISO/IEC 17025 accreditation BELAC No 105-TEST)
Intertek Iberica Spain, Bilbao, ES (measurements under the scope of ISO/IEC 17025 accreditation DAC-Nº 40/LE911)
Intertek OCA France, Donges, FR (measurements under the scope of ISO/IEC 17025 accreditation Cofrac No 1-2158)
ITS Testing Services (UK) Ltd (West Thurrock Laboratory), West Thurrock, UK (measurements under the scope of ISO/IEC 17025 accreditation UKAS No 0102)
Laboratorio de Combustibles, Universidad de A Coruña, Ferrol, ES (measurements under the scope of ISO/IEC 17025 accreditation ENAC No 814/LE1688)
SGS Española de Control, S.A.U., Barcelona, ES (measurements under the scope of ISO/IEC 17025 accreditation ENAC No 14/LE249)
OÜ Eesti Keskkonnauuringute Keskuse, Tallinn, EE (measurements under the scope of ISO/IEC 17025 accreditation EAK L008)
Vúrup, a.s., Bratislava, SK (measurements under the scope of ISO/IEC 17025 accreditation SNAS No. S-119)

11
3 Material processing and process control 3.1 Origin of the starting material The biodiesel material obtained from ASG Analytik-Service Gesellschaft mbH, Neusäss (DE). The biodiesel was produced at laboratory scale mimicking a refinery production process. BHT was added immediately as an antioxidant at a mass fraction of 1 g/kg.
Measurements at the company indicated a CFPP of about -14 °C and a CP of -5 °C. Other parameters included in EN14214 are listed in Annex E. Two drums of 60 L were delivered to JRC-IRMM. After a visual inspection of the liquid, the material was accepted for processing.
3.2 Processing The contents of the drums were combined in one 200 L plastic drum and filtered through a nylon filter to remove residual dust or metal particles. The material was stirred using a stainless steel propeller installed on an IKA Turbotron mixer for 15 minutes at 260 rpm to homogenize the product. Ampouling was performed on a ROTA ampouling machine R 910 PA (Rota, Wehr, DE). The machine was set to fill 27 mL of biodiesel in 30 mL amber glass ampoules. During ampouling, a stream of nitrogen was bubbled through the bulk of the biodiesel for continuous homogenization. The tubing and pump were rinsed with 500 mL of the biodiesel before filling. The ampoules were flushed with argon after filling and finally flame sealed.
3.3 Process control Water content was measured on 20 samples selected using a random stratified sampling scheme covering the whole batch. No trend over the filling sequence was found in the water content. The water content was 274 ± 9 mg/kg (mean ± standard deviation)
3.4 Packaging Each unit of reference material consists of a set of two amber glass ampoules, each containing 27 mL of biodiesel. Two ampoules of 27 m were chosen instead of one of around 50mL, as less stringent transport requirements apply for amounts below 30 mL. Sets were combined as follows: Set number 1, labelled ERM-EF002-1 consists in first filled ampoule + last filled ampoule, set number 2 consists in second filled ampoule + second last filled ampoule and so on. In this way, the effect of potential trends in filling on the between-unit homogeneity is minimised.
The content of the two ampoules must be pooled together before performing the measurement. In this report, the term "unit" refers to such a set of two ampoules that are pooled for analysis.
4 Homogeneity A key requirement for any reference material aliquoted into units is the equivalence between those units. In this respect, it is relevant to determine whether the variation between units is significant compared to the uncertainty of the certified value, but it is not relevant if this variation between units is significant compared to the analytical variation. Consequently, ISO Guide 34 [1] requires RM producers to quantify the between unit variation. This aspect is covered in between-unit homogeneity studies.
Within-unit homogeneity is not relevant in this case, as the two ampoules need to be pooled and are used as a whole to allow for one single measurement.

12
4.1 Between-unit homogeneity The between-unit homogeneity was evaluated to ensure that the certified values of the CRM are within the stated uncertainties, valid for all units of the material.
Homogeneity was assessed using EN 116:1997 (automated method) for the CFPP and using ISO 3015:1992 (automated method) for the CP.
The number of units selected corresponds to approximately the cube root of the total number of units produced (15 in this case). The number units were selected using a random stratified sampling scheme covering the whole batch for the between-unit homogeneity test. For this, the batch was divided into a number of groups (with a similar number of units), and one unit was selected randomly from each group.
The variation among units contains both repeatability and real between-unit variation, as every unit may be measured only once. In obtaining an assessment of the repeatability standard deviation of the laboratory, it was decided to perform individual tests, and to additionally pool ten units, mix them and perform replicate measurements. The principle of the scheme is shown in Figure 1.
Figure 1: Setup of the between-unit homogeneity study
For each parameter, 25 units were therefore selected. Of the 25 units, 10 were pooled, and the content subsequently aliquoted and every aliquot measured once. The other 15 units were measured once each.
Because the duration of every measurement is around 30-45 min, it is impracticable to perform all the 50 measurements in a day under repeatability conditions. Even the 25 measurements of each parameter were not possible to measure in one. Consequently, a scheme of four days was designed; on the first day, 15 measurements of CFPP on individual units were performed, on the second day, 10 measurements of CFPP on the 10 pooled samples, on the third day, 15 measurements of CP on individual units were performed and on the fourth day, 10 measurements of CP on the 10 pooled samples were performed.
13
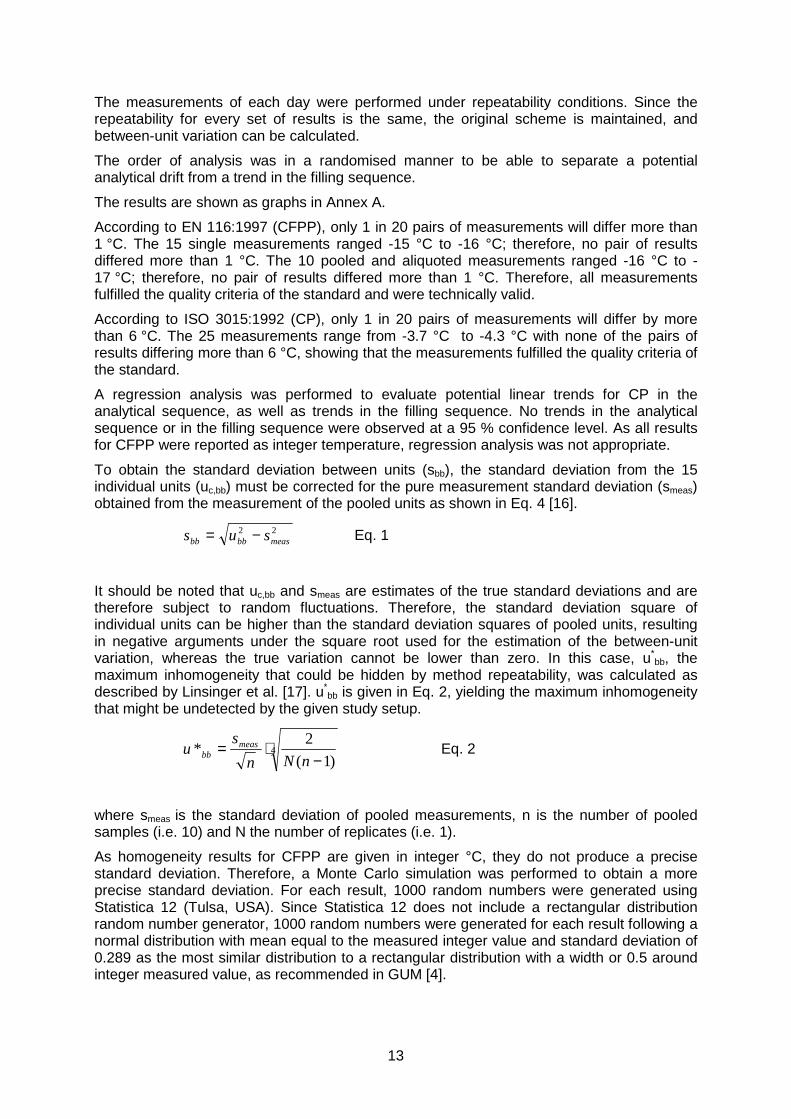
The measurements of each day were performed under repeatability conditions. Since the repeatability for every set of results is the same, the original scheme is maintained, and between-unit variation can be calculated.
The order of analysis was in a randomised manner to be able to separate a potential analytical drift from a trend in the filling sequence.
The results are shown as graphs in Annex A.
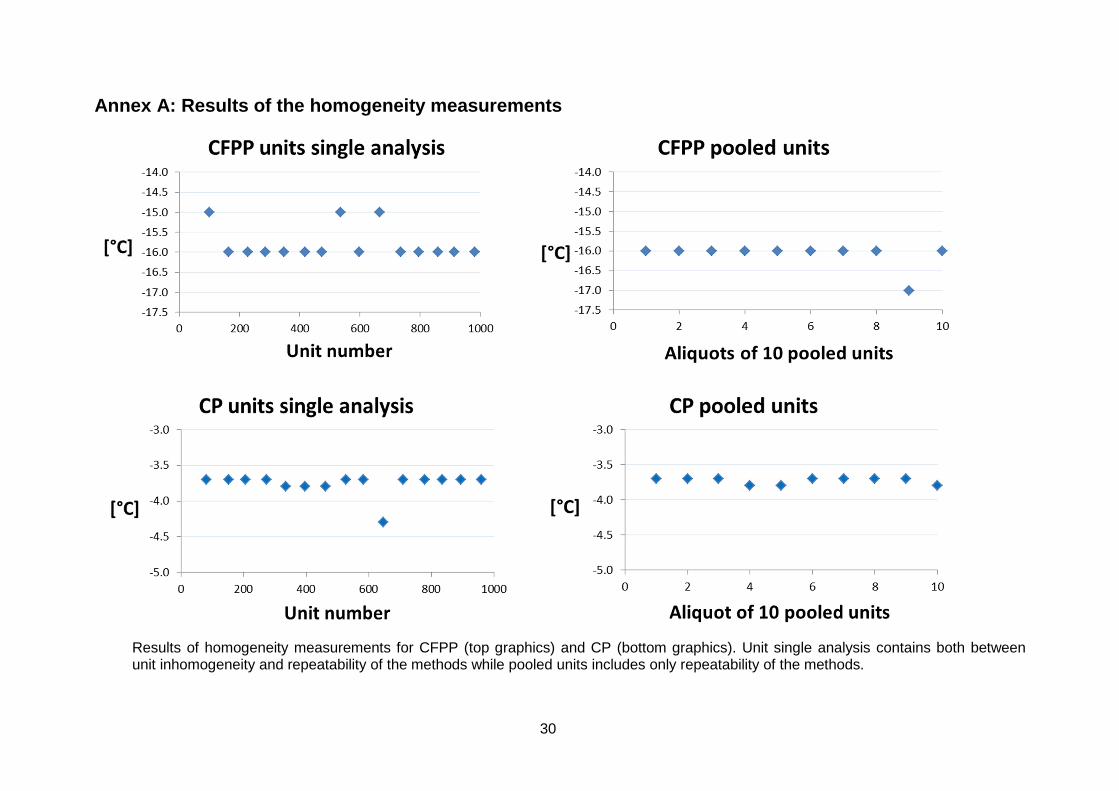
According to EN 116:1997 (CFPP), only 1 in 20 pairs of measurements will differ more than 1 °C. The 15 single measurements ranged -15 °C to -16 °C; therefore, no pair of results differed more than 1 °C. The 10 pooled and aliquoted measurements ranged -16 °C to -17 °C; therefore, no pair of results differed more than 1 °C. Therefore, all measurements fulfilled the quality criteria of the standard and were technically valid.
According to ISO 3015:1992 (CP), only 1 in 20 pairs of measurements will differ by more than 6 °C. The 25 measurements range from -3.7 °C to -4.3 °C with none of the pairs of results differing more than 6 °C, showing that the measurements fulfilled the quality criteria of the standard.
A regression analysis was performed to evaluate potential linear trends for CP in the analytical sequence, as well as trends in the filling sequence. No trends in the analytical sequence or in the filling sequence were observed at a 95 % confidence level. As all results for CFPP were reported as integer temperature, regression analysis was not appropriate.
To obtain the standard deviation between units (sbb), the standard deviation from the 15 individual units (uc,bb) must be corrected for the pure measurement standard deviation (smeas) obtained from the measurement of the pooled units as shown in Eq. 4 [16].
22measbbbb sus −= Eq. 1
It should be noted that uc,bb and smeas are estimates of the true standard deviations and are therefore subject to random fluctuations. Therefore, the standard deviation square of individual units can be higher than the standard deviation squares of pooled units, resulting in negative arguments under the square root used for the estimation of the between-unit variation, whereas the true variation cannot be lower than zero. In this case, u*
bb, the maximum inhomogeneity that could be hidden by method repeatability, was calculated as described by Linsinger et al. [17]. u*
bb is given in Eq. 2, yielding the maximum inhomogeneity that might be undetected by the given study setup.
4
)1(
2*
−⋅=
nNn
su meas
bb Eq. 2
where smeas is the standard deviation of pooled measurements, n is the number of pooled samples (i.e. 10) and N the number of replicates (i.e. 1).
As homogeneity results for CFPP are given in integer °C, they do not produce a precise standard deviation. Therefore, a Monte Carlo simulation was performed to obtain a more precise standard deviation. For each result, 1000 random numbers were generated using Statistica 12 (Tulsa, USA). Since Statistica 12 does not include a rectangular distribution random number generator, 1000 random numbers were generated for each result following a normal distribution with mean equal to the measured integer value and standard deviation of 0.289 as the most similar distribution to a rectangular distribution with a width or 0.5 around integer measured value, as recommended in GUM [4].
14
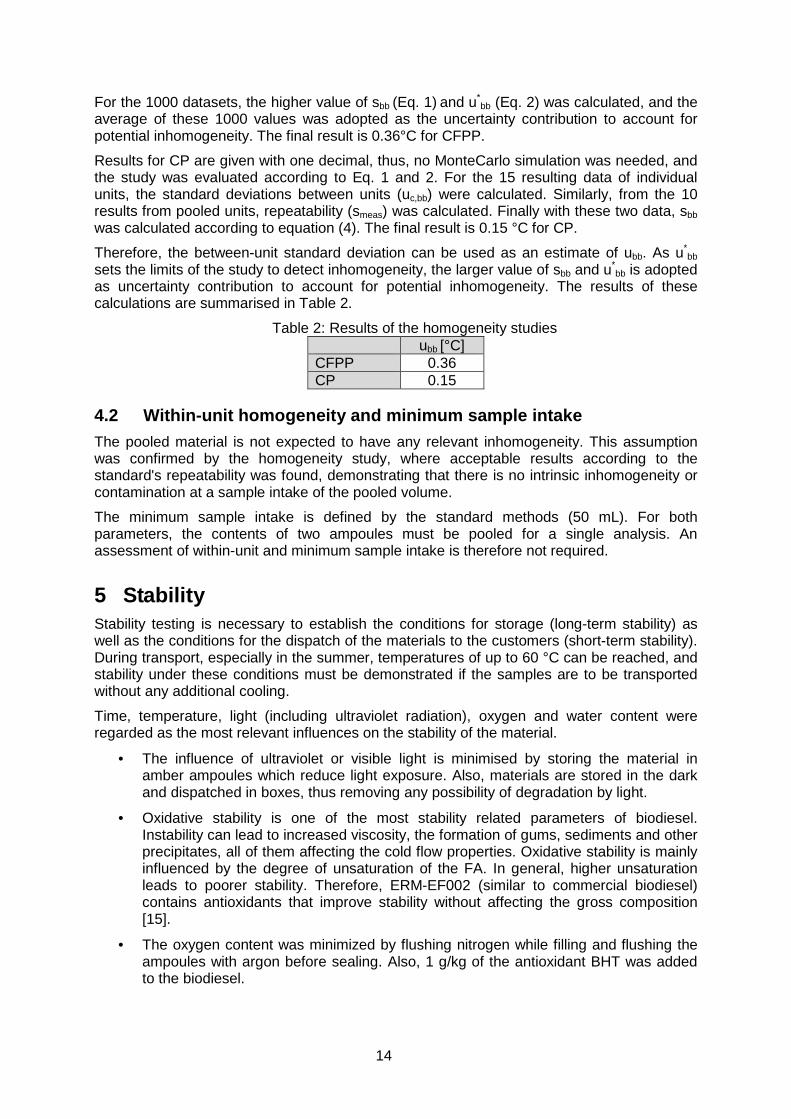
For the 1000 datasets, the higher value of sbb (Eq. 1) and u*bb (Eq. 2) was calculated, and the
average of these 1000 values was adopted as the uncertainty contribution to account for potential inhomogeneity. The final result is 0.36°C for CFPP.
Results for CP are given with one decimal, thus, no MonteCarlo simulation was needed, and the study was evaluated according to Eq. 1 and 2. For the 15 resulting data of individual units, the standard deviations between units (uc,bb) were calculated. Similarly, from the 10 results from pooled units, repeatability (smeas) was calculated. Finally with these two data, sbb was calculated according to equation (4). The final result is 0.15 °C for CP.
Therefore, the between-unit standard deviation can be used as an estimate of ubb. As u*bb
sets the limits of the study to detect inhomogeneity, the larger value of sbb and u*bb is adopted
as uncertainty contribution to account for potential inhomogeneity. The results of these calculations are summarised in Table 2.
Table 2: Results of the homogeneity studies ubb [°C]
CFPP 0.36 CP 0.15
4.2 Within-unit homogeneity and minimum sample inta ke The pooled material is not expected to have any relevant inhomogeneity. This assumption was confirmed by the homogeneity study, where acceptable results according to the standard's repeatability was found, demonstrating that there is no intrinsic inhomogeneity or contamination at a sample intake of the pooled volume.
The minimum sample intake is defined by the standard methods (50 mL). For both parameters, the contents of two ampoules must be pooled for a single analysis. An assessment of within-unit and minimum sample intake is therefore not required.
5 Stability Stability testing is necessary to establish the conditions for storage (long-term stability) as well as the conditions for the dispatch of the materials to the customers (short-term stability). During transport, especially in the summer, temperatures of up to 60 °C can be reached, and stability under these conditions must be demonstrated if the samples are to be transported without any additional cooling.
Time, temperature, light (including ultraviolet radiation), oxygen and water content were regarded as the most relevant influences on the stability of the material.
• The influence of ultraviolet or visible light is minimised by storing the material in amber ampoules which reduce light exposure. Also, materials are stored in the dark and dispatched in boxes, thus removing any possibility of degradation by light.
• Oxidative stability is one of the most stability related parameters of biodiesel. Instability can lead to increased viscosity, the formation of gums, sediments and other precipitates, all of them affecting the cold flow properties. Oxidative stability is mainly influenced by the degree of unsaturation of the FA. In general, higher unsaturation leads to poorer stability. Therefore, ERM-EF002 (similar to commercial biodiesel) contains antioxidants that improve stability without affecting the gross composition [15].
• The oxygen content was minimized by flushing nitrogen while filling and flushing the ampoules with argon before sealing. Also, 1 g/kg of the antioxidant BHT was added to the biodiesel.

15
• The water content in biodiesel is low (see section 3.3) but water is an intrinsic component of the traded biodiesel. Since biodegradation of the material is unlikely and removal of the water would not mimic commercial biodiesel, we decided not to modify the water content. Sealed Ampoules prevent further uptake of water.
Therefore, only the influences of time and temperature are needed to be investigated.
The stability studies were carried out using an isochronous design [18]. In this approach, samples are stored for a particular length of time at different temperature conditions. Afterwards, the samples are moved to conditions where further degradation can be assumed to be negligible (reference conditions). At the end of the isochronous storage, the samples are analysed simultaneously under repeatability conditions. Analysis of the material (after various exposure times and temperatures) under repeatability conditions significantly improves the sensitivity of the stability tests.
JRC-IRMM three years ago produced another CRM from a similar raw material, biodiesel from rapeseed: ERM-EF001, certified for several parameters described in EN 14214. The stability of the material is followed up in the JRC-IRMM's post-certification monitoring program.
5.1 Short-term stability study For the short-term stability study, samples were stored at -20 °C, 18 °C and 60 °C for 0, 1, 2 and 4 weeks at each temperature. Storage at +60 °C mimics worst-case conditions for transport during hot conditions, whereas storage below the CFPP (e.g. -20 °C) of the material checks whether the solidified biodiesel can be completely re-melted. The 18 °C study acted as backup for the unlikely case that the material would degrade at 60 °C, necessitating cooled dispatch. The reference temperature was set to +4 °C. Four units per storage time were selected using a random stratified sampling scheme. From each unit, a single measurement was performed. The measurements were performed under repeatability conditions, and a randomised sequence was used to differentiate any potential analytical drift from a trend over storage time.
The data were evaluated individually for each temperature. The results for CP were screened for outliers using the single and double Grubbs test with a confidence level of 99 %. As results for CFPP are reported as single integers, outlier testing is not appropriate for CFPP.
The values obtained for CP ranged from -3.6 to -3.9 °C and for CFPP, ranged between -15 °C and -16 °C, clearly fulfilling the requirement for the methods (described in section 1.2). Therefore, all data were retained for statistical analysis.
Also, the influence of storage time was investigated by calculating regression lines of CP and CFPP versus time. The slopes of the regression lines were tested for statistical significance. None of the trends was statistically significant at a 95 % confidence level for any of the temperatures.
The results of the measurements are shown in Annex B. The results of the statistical evaluation of the short-term stability in are summarised in Table 3
Table 3: Results of the short-term stability tests
Number of individual outlying results
Significance of the trend
-20 °C 18 ºC 60 ºC -20 °C 18 ºC 60 ºC CFPP not applicable no no no
CP none none none no no no

16
None of the trends was statistically significant at a 95 % confidence level for any of the temperatures. Therefore, the material can be dispatched without further precautions under ambient conditions.
5.2 Long-term stability study For the long-term stability study, samples were stored at 18 °C and 60 °C for 0, 4, 8 and 12 months at each temperature. The 18 °C study simulated real storage conditions, whereas the 60 °C acted as an accelerated ageing test to indicate future problems. For both studies, the reference temperature was set at 4 °C. Three to five units per storage time were selected using a random stratified sampling scheme. From each unit, a single measurement was performed. The measurements were performed under repeatability conditions, and a randomised sequence was used to differentiate any potential analytical drift from a trend over storage time.
The long-term stability data were evaluated individually for each temperature. No outlier tests were performed and for this study, results for CP and CFPP were given as single integers.
The results of the long-term stability measurements at 18 are shown in Annex C. The results obtained for CP, ranged from -3 to -5 °C and for CFPP, ranged between -16 °C and -17 °C, apparently fulfilling the requirement for the method (described in section 1.2). Therefore, all data were retained for subsequent statistical analysis.
Subsequently, the influence of storage time was investigated by calculating and regression lines of CP and CFPP versus time. The slopes of the regression lines were tested for statistical significance. None of the trends was statistically significant at a 95 % confidence level for any of the temperatures. The material can, therefore, be stored at 18 °C.
5.3 Estimation of uncertainties Due to the intrinsic variation of measurement results, no study can entirely rule out degradation of materials, even in the absence of statistically significant trends. It is, therefore, necessary to quantify the potential degradation that could be hidden by the method repeatability, i.e. to estimate the uncertainty of stability. This means that, even under ideal conditions, the outcome of a stability study can only be that there is no detectable degradation within an uncertainty to be estimated.
The uncertainties of stability during dispatch and storage were estimated, as described in [19] for CP and CFPP. In this approach, the uncertainty of the linear regression line with a slope of zero was calculated. The uncertainty contributions usts and ults were calculated as the product of the chosen transport time/shelf life and the uncertainty of the regression lines as:
( ) tt
i
sts ttt
su ⋅−
=∑
2 Eq. 3
( ) sl
i
lts ttt
su ⋅−
=∑
2 Eq. 4
srel relative standard deviation of all results of the stability study ti time elapsed at time point i
t mean of all ti ttt chosen transport time (1 week at 60 ºC) tsl chosen shelf life (12 months at 18 ºC)

17
The following uncertainties were estimated:
- usts, the uncertainty of degradation during dispatch. This was estimated from the 60 °C study. The uncertainty describes the possible change during a dispatch at 60 °C lasting one week.
- ults, the stability during storage. This uncertainty contribution was estimated from the +18 °C study. The uncertainty contribution describes the possible degradation during 12 months storage at +18 °C.
As was the case with CFPP in the homogeneity study (section 4.1), CP results in long-term stability study and CFPP results in long-term, as well as short-term studies are given as single integers. Thus Monte Carlo simulations were performed to obtain a more precise standard deviation. 1000 datasets were generated and uncertainties were estimated using Eq. 3 and Eq. 4.
The results of these evaluations are summarised in Table 4.
Table 4: Uncertainties of stability during dispatch and storage. usts was calculated for a temperature of +60 °C and 1 week; ults was calculated for a storage temperature of 12
months.
Measurand usts
[°C] ults for 12 months
[°C] at 18 °C at 60 °C
CFPP 0.08 0.45 0.51 CP 0.02 0.41 0.08
No significant degradation, even at 12 months at 60 °C was observed. Therefore, the material can be transported in ambient conditions without special precautions.
After the certification study, the material will be included in the JRC-IRMM's regular stability monitoring programme to control its post-certification stability.
5.4 Test for repeated use The possibility of re-using samples was tested. 10 replicate analyses of CP and CFPP were performed on the same sample on ten consecutive days, i.e. the sample was reheated after each CFPP/CP test and stored in a sealed vial in the dark at 4 °C until the next replicate was performed on the following day. Measurements were performed by EN 116:1997 for CFPP and ISO 3015:1992 for CP.
All 10 results for each parameter were within 1 °C difference and hence below the repeatability limits. This indicates that a sample can be used at least, up to 10 times for a period of 10 days if stored immediately after measuring in a sealed vial in the dark at 4 °C.
6 Characterisation The material characterisation is the process of determining the property values of a reference material.
This was based on an inter-laboratory comparison of expert laboratories, i.e. the properties of the material were determined in different laboratories that applied different standards to demonstrate the absence of a measurement bias. In addition, randomisation of laboratory bias reduces the combined uncertainty.
All participants used EN 116:1997 [20] or ASTM D6371-05:2010 [21] for CFPP and ASTM D2500-09:2011 [22] or ISO 3015:1992 [23] (also named EN 23015:1994 [24]) for CP for the measurements.

18
6.1 Selection of participants Laboratories could submit more than one dataset (e.g. for manual and automated methods and/or ISO/ASTM standards). For CFPP, 12 laboratories were selected that delivered 13 datasets whereas for CP, 11 laboratories delivering 14 datasets were selected . The selection of laboratories was based on criteria that comprised both technical competence and quality management aspects. Each participant was required to operate a quality system and to deliver documented evidence of its laboratory proficiency in the field. Having a formal accreditation was not mandatory, but meeting the requirements of ISO/IEC 17025 was obligatory. Where the scope of accreditation covers measurements,, the accreditation number is stated in the list of participants (Section 2).
6.2 Study setup Each laboratory received six units of ERM-EF002 per standard method and was requested to provide six independent results, one per unit. The units for material characterisation were selected using a random stratified sampling scheme and covered the whole batch. The measurements had to be spread over two days to ensure intermediate precision conditions. An independent calibration was performed for each result
Each participant received a sample of ERM-FC395k (CP and CFPP of conventional diesel) as a blinded quality control (QC) sample. The results for this sample were used to support the evaluation of the characterisation results.
Laboratories were also requested to give estimations of the expanded uncertainties of the mean value of the six results. No approach for the estimation was prescribed, i.e. top-down and bottom-up were regarded as equally valid procedures.
6.3 Methods used All laboratories used one of the equivalent methods (see Annex D for details) for CP and CFPP:
CFPP:
• EN116: 11 automated; 0 manual
• ASTM-05:2010: 2 automated; 0 manual
During the period of selection, the standard EN 116:1997 was under revision. Since the new version, EN116:2015, does not include a manual procedure, no manual measurements of CFPP were selected.
CP:
• ISO 3015:1992/EN 23015:1994: 4 automated; 4 manual
• ASTM D2500-09:2011: 3 automated; 3 manual
6.4 Evaluation of results The characterisation study resulted in 13 datasets for CFPP and 14 datasets for CP. All individual results of the participants, grouped per parameter are displayed in graphical form in Annex F.

19
6.4.1 Technical evaluation The data obtained were first checked for compliance with the requested analysis protocol and their validity based on technical reasons. The following criteria were considered during the evaluation:
- appropriate validation of the measurement procedure;
- compliance with the analysis protocol: sample preparations and measurements performed on two days, and the analytical sequence;
- method performance, i.e. agreement of the measurement results with the assigned value of the QC sample according to Application Note 1 [26].
Based on the above criteria, one dataset for CP was rejected as not technically valid. The laboratory reported a value of the QC sample of -2 ± 2.2 °C (measured value ± U) when the certified value is -7.2 ± 3.0 °C. The laboratory could not find any explanation for this deviation. All the other datasets for both parameters were accepted as technically valid.
6.4.2 Statistical evaluation The datasets accepted, based on technical reasons described in 6.4.1, were additionally tested for normality of dataset means using kurtosis/skewness tests and normal probability plots and were tested for outlying means using the Grubbs test at a 99 % confidence level. The overall mean and the standard deviations of the laboratory means were calculated. The results of these evaluations are shown in Table 5. The uncertainty related to the characterisation is estimated as the standard error of the mean of laboratory means (Table 5).
Table 5: Statistical evaluation of the technically accepted datasets for ERM-EF002. p: number of technically valid datasets
Parameter
p Outliers Normally distributed
Statistical parameter of the distribution of laboratory means
uchar
Means Grand mean [°C]
s [°C]
[°C]
CFPP 13 none yes -15.18 0.82 0.23 CP 13 none yes -4.49 0.59 0.16

20
7 Value Assignment Certified values were assigned, and informative values are given.
Certified values are values that fulfil the highest standards of accuracy. Procedures at JRC-IRMM require pooling of not less than 6 datasets to assign certified values. Full uncertainty budgets following the 'Guide to the Expression of Uncertainty in Measurement' [4] were established.
Additional material information refers to values that were obtained in the course of the study. They were derived from few measurements and are stated without uncertainty, and they give merely information about other material properties that may be of interest for the user.
7.1 Certified values and their uncertainties The unweighted mean of the means of the accepted datasets as shown in Table 5 was assigned as certified value for each parameter.
The assigned uncertainty consists of uncertainties relating to characterisation, uchar (Section 6.4), potential between-unit inhomogeneity, ubb (Section 4.1), and potential degradation during transport, usts, and long-term storage, ults (Section 5.3). The uncertainty related to degradation during transport was found to be negligible. These different contributions were combined to estimate the relative expanded uncertainty of the certified value (UCRM, rel) with a coverage factor k given as:
2char
2lts
2bbCRM uuukU ++⋅= Equation 1
- uchar was estimated as described in Section 6.4
- ubb was estimated as described in Section 4.1
- usts and ults were estimated as described in section 5.3
Because of the sufficient numbers of the degrees of freedom of the different uncertainty contributions, a coverage factor k of 2 was applied to obtain the expanded uncertainties.
The certified values and their uncertainties are summarised in Table 6.
Table 6: Certified values and their uncertainties for ERM-EF002
Certified value [°C]
uchar
[°C] ubb
[°C] usts
[°C] ults
[°C] UCRM
1) [°C]
CFPP -15.2 0.23 0.36 0.08 0.45 1.3 CP -4.5 0.16 0.15 0.02 0.41 1.0
1) Expanded (k = 2) and rounded uncertainty.
21
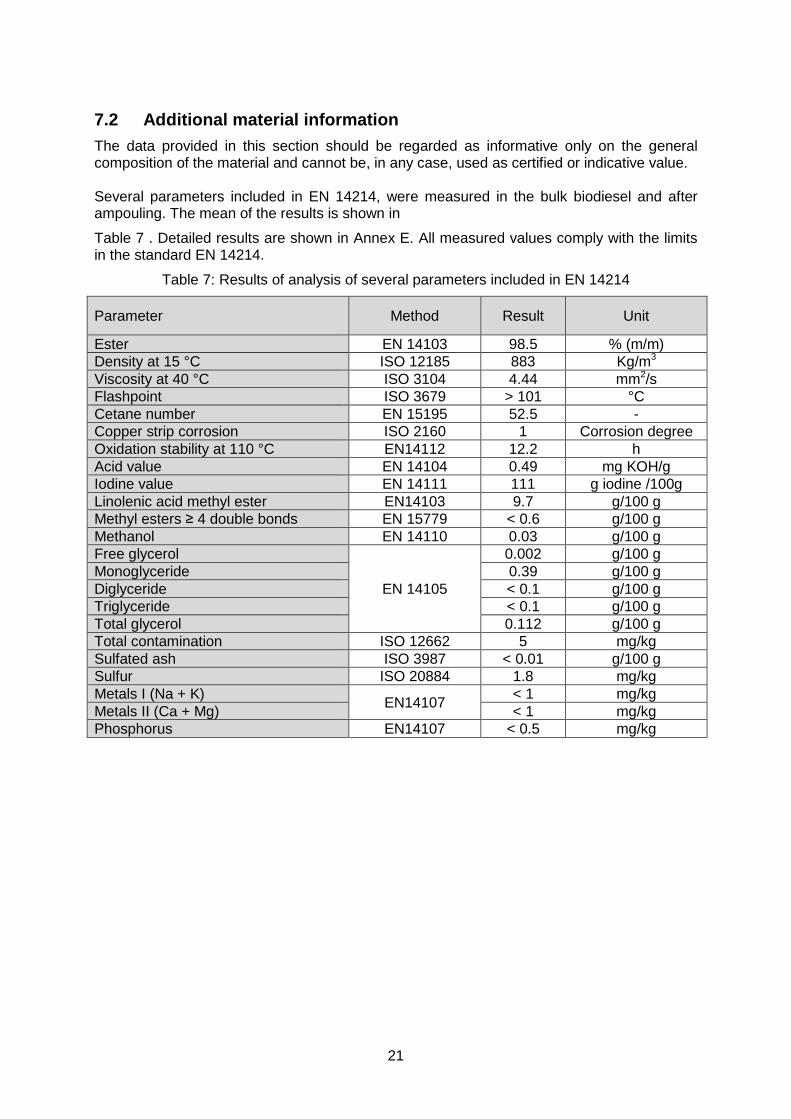
7.2 Additional material information The data provided in this section should be regarded as informative only on the general composition of the material and cannot be, in any case, used as certified or indicative value. Several parameters included in EN 14214, were measured in the bulk biodiesel and after ampouling. The mean of the results is shown in
Table 7 . Detailed results are shown in Annex E. All measured values comply with the limits in the standard EN 14214.
Table 7: Results of analysis of several parameters included in EN 14214
Parameter Method Result Unit
Ester EN 14103 98.5 % (m/m) Density at 15 °C ISO 12185 883 Kg/m3
Viscosity at 40 °C ISO 3104 4.44 mm2/s Flashpoint ISO 3679 > 101 °C Cetane number EN 15195 52.5 - Copper strip corrosion ISO 2160 1 Corrosion degree Oxidation stability at 110 °C EN14112 12.2 h Acid value EN 14104 0.49 mg KOH/g Iodine value EN 14111 111 g iodine /100g Linolenic acid methyl ester EN14103 9.7 g/100 g Methyl esters ≥ 4 double bonds EN 15779 < 0.6 g/100 g Methanol EN 14110 0.03 g/100 g Free glycerol
EN 14105
0.002 g/100 g Monoglyceride 0.39 g/100 g Diglyceride < 0.1 g/100 g Triglyceride < 0.1 g/100 g Total glycerol 0.112 g/100 g Total contamination ISO 12662 5 mg/kg Sulfated ash ISO 3987 < 0.01 g/100 g Sulfur ISO 20884 1.8 mg/kg Metals I (Na + K)
EN14107 < 1 mg/kg
Metals II (Ca + Mg) < 1 mg/kg Phosphorus EN14107 < 0.5 mg/kg

22
8 Metrological traceability and commutability
8.1 Metrological traceability CFPP is a method-defined measurand and can only be obtained by following the procedures specified in EN 116:1997 or ASTM D6371-05:2010.
CP is a method-defined measurand and can only be obtained by following the procedures specified in by EN 23015:1994, ISO 3015:1992 or ASTM D2500-09:2011.
Adherence to these procedures was confirmed by the agreement of the laboratories' results with the assigned value for the CRM that was used as a quality control sample. The used standard operationally defines the measurands.
Quantity value
Traceability of the obtained results is based on the traceability of all relevant input factors. Instruments in individual laboratories were verified and calibrated with tools ensuring traceability to the International System of Units (SI). Consistency in the interlaboratory comparison demonstrates that all relevant input factors were covered. As the assigned values are combinations of agreeing results individually traceable to the SI, the assigned quantity values themselves are traceable to the SI as well.
8.2 Commutability Many measurement procedures include one or more steps which select specific (or specific groups of) analytes from the sample for the subsequent whole measurement process. Often, the complete identity of these 'intermediate analytes' is not fully known or taken into account. Therefore, it is difficult to mimic all analytically relevant properties of real samples within a CRM. The degree of equivalence in the analytical behaviour of real samples and a CRM for various measurement procedures (methods) is summarised in a concept called 'commutability of a reference material'. Various definitions define this concept. For instance, the CLSI Guideline C53-A [25] recommends the use of the following definition for the term commutability:
"The equivalence of the mathematical relationships among the results of different measurement procedures for an RM and for representative samples of the type intended to be measured."
The commutability of a CRM defines its fitness for use and is, therefore, a crucial characteristic when applying different measurement methods. When the commutability of a CRM is not established, the results from routinely used methods cannot be legitimately compared with the certified value to determine whether a bias does not exist in calibration, nor can the CRM be used as a calibrant.
As the material has the same composition than commercial biodiesel, based on rapeseed oil, it is representative for other biodiesel samples.

23
9 Instructions for use
9.1 Safety information This CRM is neither classified as hazardous under EC Regulation 1272/2008 (CLP) nor under 1999/45/EC. The usual laboratory safety measures apply.
9.2 Storage conditions The materials should be stored at (18 ± 5) °C in the dark. Care should be taken to avoid any change of the moisture content once the units are open, as the material is hygroscopic. The user should store in closed bottles immediately after use.
Please note that the European Commission cannot be held responsible for changes that happen during storage of the material at the customer's premises, especially for opened ampoules.
9.3 Preparation and use of the material/Reconstitut ion The contents of the two ampoules shall be pooled and mixed to obtain one sample of 50 mL. No further sample treatment is necessary.
9.4 Minimum sample intake The minimum sample intake is defined in the applicable standards, usually 50 mL.
9.5 Use of the certified value The main purpose of this material is to assess method performance, i.e. for checking the accuracy of analytical results/calibration. As any reference material, it can also be used for control charts or validation studies.
Use as a calibrant
It is not recommended to use this matrix material as calibrant. If used nevertheless, the uncertainty of the certified value shall be taken into account in the estimation of the measurement uncertainty.
Comparing an analytical result with the certified value
A result is unbiased if the combined standard uncertainty of measurement and certified value covers the difference between the certified value and the measurement result (see also ERM Application Note 1, www.erm-crm.org [26].
When assessing the method performance, the measured values of the CRMs are compared with the certified values. The procedure is summarised here:
- Calculate the absolute difference between mean measured value and the certified value (∆meas).
- Combine the measurement uncertainty (umeas) with the uncertainty of the certified value (uCRM): 22
CRMmeas uuu +=∆
- Calculate the expanded uncertainty (U∆) from the combined uncertainty (u∆,) using an appropriate coverage factor, corresponding to a level of confidence of approximately 95 %

24
- If ∆meas ≤ U∆ then no significant difference exists between the measurement result and the certified value, at a confidence level of approximately 95 %.
Use in quality control charts
The materials can be used for quality control charts. Using CRMs for quality control charts has the added value that a trueness assessment is built into the chart.

25
10 Acknowledgments The authors would like to acknowledge the support of Ann Goris and Hilde de Schrijver of JRC-IRMM for processing this CRM and Maria Concepción Contreras for the set-up of the required isochronous studies.
Also, the authors are thankful to Manuela Ulberth-Buchgraber and Philippe Corbisier (JRC-IRMM) for reviewing the certification report, as well as the experts of the Certification Advisory Panel "Physicochemical-physical properties", Mark Gee (NPL, Teddington , UK), Jan Mast (CODA-CERVA, Brussels, BE) and Ludwig Niewöhner (Bundeskriminalamt, Wiesbaden, DE) for their constructive comments.

26
11 References
1 ISO Guide 34:2009, General requirements for the competence of reference materials producers, International Organization for Standardization, Geneva, Switzerland
2 ISO Guide 35:2006, Reference materials – General and statistical principles for certification, International Organization for Standardization, Geneva, Switzerland
3 ISO/IEC 17025:2005, General Requirements for the Competence of Calibration and Testing Laboratories, International Organization for Standardization, Geneva, Switzerland
4 ISO/IEC Guide 98-3:2008, Guide to the Expression of Uncertainty in Measurement, (GUM 1995), International Organization for Standardization, Geneva, Switzerland
5 Directive 2003/30/EC on the promotion of the use of biofuels or other renewable fuels for transport
6 Directive 2009/28/EC on the promotion of the use of energy from renewable sources
7 Directive 2009/30/EC amending Directive 98/70/EC as regards the specification of petrol, diesel and gas-oil and introducing a mechanism to monitor and reduce greenhouse gas emissions and amending Council Directive 1999/32/EC as regards the specification of fuel used by inland waterway vessels and repealing Directive 93/12/EEC
8 EN 14214:2012 Liquid petroleum products - Fatty acid methyl esters (FAME) for use in diesel engines and heating applications - Requirements and test methods. European Committee for Standardization, Brussels, Belgium
9 EN 116:1997 Diesel and domestic heating fuels - Determination of cold filter plugging point, European Committee for Standardization, Brussles, Belgium
10 ASTM D6371 – 05 (2010), Standard Test Method for Cold Filter Plugging Point of Diesel and Heating Fuels, ASTM International, West Conshohocken, USA
11 ASTM D2500-09:2011, Standard Test Method for Cloud Point of Petroleum Products, ASTM International, West Conshohocken, USA
12 ISO 3015:1992, Petroleum products -- Determination of cloud point, International Organization for Standardization, Geneva, Switzerland
13 EN 23015:1994 Petroleum products - Determination of cloud point (ISO 3015:1992), European Committee for Standardization, Brussels, Belgium
14 M. Ulberth-Buchgraber, V. Morales, J. Charoud-Got, H. Emteborg, A. Held. The certification of the mass fraction of the ester, linolenic acid methyl ester, onoglyceride, diglyceride, triglyceride, total glycerol and water content, density, viscosity, oxidation stability, acid value, iodine value and flash point of biodiesel: ERM-EF001, EUR 26711, European Commission, Luxemburg, 2014
15 S.K. Hoekman, A. Broch, C. Robbins, E. Ceniceros, M. Natarajan, Review of biodiesel composition, properties, and specifications, Renew. Sust. Ener. Rev. 16 (2012) 143-169
16 J. Pauwels, A. Lamberty, H. Schimmel,, Homogeneity testing of reference materials, Accred Qual Assur 3 (1998) 51–55
17 T.P.J. Linsinger, J. Pauwels, A.M.H. van der Veen, H. Schimmel, A. Lamberty, Homogeneity and stability of reference materials, Accred. Qual. Assur. 6 (2001) 20-25
18 A. Lamberty, H. Schimmel, J. Pauwels, The study of the stability of reference materials by isochronous measurements, Fres. J. Anal. Chem. 360 (1998) 359-361

27
19 T.P.J. Linsinger, J. Pauwels, A. Lamberty, H. Schimmel, A.M.H. van der Veen, L. Siekmann, Estimating the uncertainty of stability for matrix CRMs, Fres. J. Anal. Chem. 370 (2001) 183-188
20 EN 116:1997 Diesel and domestic heating fuels - Determination of cold filter plugging point, European Committee for Standardization, Brussles, Belgium
21 ASTM D6371 – 05 (2010), Standard Test Method for Cold Filter Plugging Point of Diesel and Heating Fuels, ASTM International, West Conshohocken, USA
22 ASTM D2500-09:2011, Standard Test Method for Cloud Point of Petroleum Products, ASTM International, West Conshohocken, USA
23 ISO 3015:1992, Petroleum products - Determination of cloud point, International Organization for Standardization, Geneva, Switzerland
24 EN 23015:1994 Petroleum products - Determination of cloud point (ISO 3015:1992), European Committee for Standardization, Brussels, Belgium
25 H. Vesper, H. Emons, M. Gnezda, C. P. Jain, W. G. Miller, R. Rej, G. Schumann, J. Tate, L. Thienpont, J. E. Vaks, Characterization and qualification of commutable reference materials for laboratory medicine; approved guideline, CLSI document C53-A, Clinical and Laboratory Standards Institute, Wayne, PA, USA, 2010
26 T.P.J. Linsinger, ERM Application Note 1: Comparison of a measurement result with the certified value, www.erm-crm.org (last accessed on 6-11-2015)

28

29
Annexes Annex A: Results of the homogeneity measurements
Annex B: Results of the short-term stability measurements
Annex C: Results of the long-term stability measurements
Annex D: Summary of methods used and results in the characterisation measurements
Annex E: Additional values: several parameters included in EN 14214:2012
30
Annex A: Results of the homogeneity measurements
Results of homogeneity measurements for CFPP (top graphics) and CP (bottom graphics). Unit single analysis contains both between unit inhomogeneity and repeatability of the methods while pooled units includes only repeatability of the methods.

31
Annex B: Results of the short-term stability measur ements
Datapoints represent the mean value for CFPP and CP means measured at each time-point. Errors bars represent the 95 % confidence interval (CI) of the mean, based on the within-group standard deviation as obtained by single-factor ANOVA

32
Annex C: Results of the long-term stability measure ments
Datapoints represent the mean value for CFPP and CP means measured at each time-point. Errors bars represent the 95 % confidence interval (CI) of the mean, based on the within-group standard deviation as obtained by single-factor ANOVA

33
Annex D: Summary of methods used and results in the characterisation measurements Cold filter plugging point
Laboratory code and standard
replicate 1 replicate 2 replicate 3 replicate 4 replicate 5 replicate 6 mean
Expanded uncertainty
[°C] [°C] [°C] [°C] [°C] [°C] [°C] [°C]
L1-ASTM D6371 auto
-15 -15 -15 -16 -16 -16 -15.5 1.8
L2-EN 116 auto -14 -13 -14 -14 -13 -13 -13.5 2.7
L3-EN 116 auto -15.3 -14.3 -14.3 -14.3 -14.6 -14.2 -14.5 1.0
L4-EN 116 auto -16 -15 -15 -16 -15 -15 -15.3 2.0
L5-EN 116 auto -16 -16 -16 -16 -16 -16 -16 1.0
L6-EN 116 auto
-16 -16 -16 -16 -15 -16 -15.8 3.0
L7-EN 116 auto -15 -15 -15 -15 -15 -15 -15 1.0
L8-ASTM D6371 auto -15 -16 -15 -16 -16 -16 -15.7 3.0
L9-EN 116 auto
-15 -15 -15 -15 -15 -15 -15 2.6
L10-EN 116 auto -16 -16 -16 -17 -16 -16 -16.2 3.1
L11-EN 116 auto -16 -16 -16 -16 -16 -16 -16 2.0
L12-EN 116 auto
-14 -14 -14 -14 -14 -14 -14 1.0
L13-EN 116 auto -15 -15 -15 -15 -15 -15 -15 1.0
Results of the characterization measurements of CFPP. Error bars are expanded uncertainty (approx. 95% coverage) stated by laboratories. Continuous red lines correspond to the upper and lower end of the certified range (certified value ± expanded uncertainty (UCRM)).

34
Cloud point Laboratory code and standard
replicate 1 replicate 2 replicate 3 replicate 4 replicate 5 replicate 6 mean
Expanded uncertainty
[°C] [°C] [°C] [°C] [°C] [°C] [°C] [°C]
L1-ASTM D6371 auto
-4.0 -4.0 -4.0 -4.0 -4.0 -4.0 -4.0 2.0
L2-EN 116 auto
-4.0 -5.0 -4.0 -5.0 -4.0 -5.0 -4.5 1.9
L4-EN 116 auto
-3.9 -3.9 -3.9 -3.8 -3.8 -3.8 -3.9 2.0
L5-EN 116 auto
-5.0 -5.0 -5.0 -5.0 -5.0 -5.0 -5.0 3.0
L6-EN 116 auto
-5.0 -5.0 -5.0 -5.0 -5.0 -5.0 -5.0 3.0
L7-EN 116 auto
-5.0 -5.0 -5.0 -5.0 -5.0 -6.0 -5.2 3.0
L8-ASTM D6371 auto
-5.0 -5.0 -5.0 -5.0 -5.0 -6.0 -5.2 3.0
L9-EN 116 auto
-4.2 -4.2 -4.2 -4.3 -4.2 -4.2 -4.2 0.9
L10-EN 116 auto
-3.7 -3.6 -3.6 -3.7 -3.6 -3.4 -3.6 1.3
L11-EN 116 auto
-4.0 -3.0 -4.0 -4.0 -4.0 -4.0 -3.8 2.5
L12-EN 116 auto
-4.0 -5.0 -4.0 -4.0 -4.0 -3.0 -4.0 1.0
L13-EN 116 auto
-5.0 -5.0 -5.0 -5.0 -5.0 -5.0 -5.0 0.2
Results not used for certification
L3-EN 116 auto
-2.0 -1.0 -2.0 -1.0 -1.0 -1.0 -1.3 2.2
Results of the characterization measurements of CFPP. Error bars are expanded uncertainty (aprox 95% coverage) stated by laboratories. Continuous red lines correspond to the upper and lower end of the certified range (certified value ± expanded uncertainty (UCRM))

35
Annex E: Results of several parameters included in EN 14214
Parameter Standard Measurement in
origin to bulk material
Measurement after ampouling Units
Ester EN 14103:2011 >99 98.5 % (m/m)
Density at 15 °C ISO 12185 882.8 883 Kg/m3
Viscosity at 40 °C ISO 3104 4.438 n/m mm2/s Flashpoint ISO 3679 172.5 >101 °C
Cetane number EN 15195 52.5 n/m - Copper strip
corrosion ISO 2160 1 n/m Corrosion degree
Oxidation stability at 110 °C EN14112 8.8 12.5 h
Acid value EN 14104 0.49 n/m mg KOH/g Iodine value EN 14111 112 111 g iodine/100g
Linolenic acid methyl ester EN14103 9.8 9.7 % (m/m)
Methyl esters ≥ 4 double bonds EN 15779 <0.6 n/m % (m/m)
Methanol EN 14110 0.01 0.03 % (m/m) Free glycerol EN 14105 0.01 0.001 % (m/m)
Monoglyceride 0.39 0.4 % (m/m) Diglyceride 0.05 < 0.1 % (m/m) Triglyceride 0.01 < 0.1 % (m/m)
Total glycerol 0.12 0.1 % (m/m) Total
contamination ISO
12662:1998 5 n/m mg/kg
Sulfated ash ISO 3987 <0.01 n/m % (m/m) Sulfur ISO 20884 1.8 n/m mg/kg
Metals I (Na + K) EN14107 <1 n/m mg/kg Metals II (Ca + Mg) <1 n/m mg/kg
Phosphorus EN14107 <0.5 n/m mg/kg

36

As the Commission's in-house science service, the Joint Research Centre's mission is to provide EU policies
with independent, evidence-based scientific and technical support throughout the whole policy cycle.
Working in close cooperation with policy Directorates-General, the JRC addresses key societal challenges
while stimulating innovation through developing new methods, tools and standards, and sharing its know-
how with the Member States, the scientific community and international partners.
Key policy areas include: environment and climate change; energy and transport; agriculture and food
security; health and consumer protection; information society and digital agenda; safety and security,
including nuclear; all supported through a cross-cutting and multi-disciplinary approach.
LA
-NA
-27
57
7-E
N-N
doi: 10.2787/434305
ISBN: 978-92-79-53882-7