ceruloplasmin levels in human sera from various...
TRANSCRIPT

Vol.1, No.2, 104-110 (2009) Health doi:10.4236/health.2009.12017
SciRes Copyright © 2009 Openly accessible at http://www.scirp.org/journal/HEALTH/
Ceruloplasmin levels in human sera from various diseases and their correlation with patient’s age and gender
Viorica Lopez-Avila1*, William H. Robinson2, Kirk Lokits3
1Agilent Technologies, Santa Clara, CA, USA; Corresponding author: [email protected] 2Stanford University, Stanford, CA, USA 3University of Cincinnati, Cincinnati, OH, USA; Present address: Midwest Research Institute, 425 Volker Blvd, Kansas City, MO, USA
Received 7 July 2009; revised 5 August 2009; accepted 7 August 2009.
ABSTRACT
Ceruloplasmin (Cp), a copper metalloprotein in human serum has been a valuable diagnostic marker in Wilson’s disease where Cp levels tend to be low while high levels in serum were asso-ciated with myocardial infarction, neoplastic and inflammatory conditions. There is no stan-dardized reference method for Cp and current immunologic and bichromatic assays have a number of drawbacks. The method described here uses immunoaffinity chromatography to remove six of the most abundant proteins from a serum sample and high-pressure liquid chro- matography (HPLC) with a size-exclusion col-umn to separate Cp from other serum proteins and any free Cu prior to analysis of 63Cu and 65Cu by inductively-coupled plasma mass spec-trometry (ICPMS). Identification of Cp is based on retention time match of the unknown protein in the serum sample with the Cp external stan-dard and the presence of 63Cu and 65Cu at a ratio of 2.2 ± 0.1. The method accuracy, as estab-lished independently by two of the authors with a reference serum certified for Cp, is 98 to 101% and the coefficient of variation is 6.4% and 5.4%, respectively. The assay was used to analyze a total of 167 human sera for Cp from patients with myocardial infarction (MI), pulmonary em-bolism (PE), rheumatoid arthritis (RA), systemic lupus erythematosus (SLE), other forms of ar-thritis, and a set of healthy patients as normal controls (NC). Our data show that Cp concen-trations tend to be higher in MI, RA, and SLE patients, higher in female as compared to male patients, and we did not observe a correlation between Cp concentration and patient’s age for the set of 70 patients for which we had gender and age information.
Keywords: Ceruloplasmin; HPLC-ICPMS; Immunoaffinity Chromatography
1. INTRODUCTION
Ceruloplasmin (Cp) is a blue alpha-2 glycoprotein with a molecular weight of 132,000 u [1]. It binds 90-95% of blood plasma copper (Cu), has 6-7 Cu ions per molecule (1) and exhibits ferroxidase activity [1,2], amine oxidase activity [1], superoxidase activity [1] as well as it is in-volved in Cu transport and homeostasis [1]. Hellman and Gitlin, however, reported that Cp plays no essential role in the transport and metabolism of Cu [2] and in a sepa-rate study [3] reported that analysis of Cu incorporation into apoceruloplasmin (apoCp) in vitro showed that fail-ure is intrinsic to mutant proteins. Linder et al. [4] claim that newly absorbed dietary Cu is transported by plasma protein cariers (i.e., albumin, transcuprein, and Cp) from intestine to liver and kidney, and that Cp is involved primarily in transport of Cu from liver to other organs. Prohanska and Gybina [5] provide details on the trans-port process in which Cu, imported by plasma mem-brane protein Ctr1, binds to Cu chaperone proteins like Atox1, which then docks with ATP7B and delivers Cu to plasma Cp.
Current analytical procedures for the determination of Cp include immunoturbidimetry and nephelometry [6], in which Cp is reacted with anti-Cp antibodies to give insoluble aggregates whose absorbance is proportional to the concentration of Cp in the sample [6], radial immu-nodifussion (RID) test [7], and bichromatic assay [8]. When comparing RID with immunonephelometry a sig-nificant bias was found that was in part attributed to the variation in the antisera sources used in the two methods [7]. In the case of the bichromatic method, the proce-dures are based on the oxidase activity of Cp on dia-mines such as benzidine. The bichromatic method re-quires special precautions (i.e., benzidine is a known
V. Lopez-Avila et al. / HEALTH 1 (2009) 104-110
SciRes Copyright © 2009 Openly accessible at http://www.scirp.org/journal/HEALTH/
105
carcinogen) and purification of substrates [9], detects only Cp and not the apoCp [10], and it is not very effec-tive since Cp does not have its own substrate [11]. The immunologic methods also have drawbacks because antisera cross-react with apoCp thus giving higher con-centrations for Cp [9]. Evidence suggests that patients with Wilson’s disease may have exhibited normal serum concentrations of Cp because the immunologic assay could not distinguish between the apoCp and Cp [10]. In general, a normal person has 0.2 to 0.5 mg/mL of Cp in serum [11].
Although low serum concentration of Cp has been an important diagnostic indicator of Wilson’s disease [10], high Cp concentrations were reported in patients with macular degenerations as compared with controls (i.e., Cp concentration 0.691 ± 0.153 mg/mL vs 0.312 ± 0.064 mg/mL) by Newsome et al. [12], in patients with MI by Reunanen et al. [13], and in a variety of neoplastic and inflammatory conditions like carcinomas, leukemia, Hodgkin disease, primary biliary cirrhosis, systemic lupus erythematosus, and rheumatoid arthritis [14].
This paper describes the peer verification of a new method for the determination of Cp in human serum at biologically relevant concentrations > 0.01 mg/mL using a reference serum certified for Cp and a set of 167 hu-man sera from several diseases. This method, which was published recently [15], uses HPLC to separate Cp from other proteins including transcuprein (molecular weight 270,000 u) and from inorganic ions, and ICPMS to de-tect Cu isotopes at mass-to-charge (m/z) ratios of 63 and 65, and to identify Cp from the HPLC retention time and the signal ratios of Cu isotopes 63Cu and 65Cu measured with ICPMS. To eliminate possible interference from highly abundant proteins, some of which may bind Cu to form protein-Cu complexes, the serum sample is first depleted of albumin, IgG, IgA, transferrin, haptoglobin, and anti-trypsin using immunoaffinity chromatography prior to HPLC. Quantitation of Cp in the depleted serum is performed by external standard calibration with a Cp standard.
2. EXPERIMENTAL
Materials: the standard of Cp purified from human plasma was from EMD Biosciences/Calbiochem (La Jolla, CA) in lyophilized form from 133 µL of 50 mM potassium phosphate, pH 6.8, 100 mM potassium chlo-ride, 200 mM ε-amino-n-caproic acid and 5mM EDTA, with a purity of >95%. The 167 serum samples were as follows: 37 patients with MI, 50 with RA, 24 with SLE, 8 with PE, 16 NC, and 32 sera (identified as “other” in this paper) were from patients with different forms of arthritis: osteoarthritis, juvenile rheumatoid arthritis, reactive arthritis, inflammatory arthritis; myositis and
dermatomyositis, fibromyalgia, anthralgia, ankylosing spondilitis, spinal stenosis, Sjogren, Reiter’s syndrome, connective tissue disease, scleroderma, polymyalgia rheumatica and palindromic rheumatism gout and CREST syndrome.
ERM DA470 is a human serum certified for 15 pro-teins including Cp [16,17] and was purchased from RTC (Laramie, WY).
Serum preparation: all human samples were col-lected and utilized under Institutional Review Board approved protocols and with informed consent. To summarize, blood samples were withdrawn using sterile conditions and allowed to clot at room temperature for a minimum of 10 min. Serum was separated by centrifu-gation for 10 min at 4000 rpm, divided among several vials to minimize freeze-thawing, and kept at -80°C until analysis.
Immunoaffinity chromatography: high-abundant protein removal from human serum was performed on a 4.6 x 100 mm immunodepletion column (Agilent Tech-nologies) with a capacity of 40 μL of non-diluted human serum (capacity is defined as the amount of original se-rum that can be loaded onto the column such that 99% of the targeted high-abundant proteins are removed for at least 200 injections on a particular column). After a 5- fold dilution of serum sample with buffer A and filtration through a 0.22 μm spin filter, 150 μL of the diluted sam-ple was injected onto the column in 100% Buffer A at a flow rate of 0.5 mL/min for 10.0 min. After collection of the flow-through fraction (2 mL), the column was washed and the bound proteins were eluted with 100% Buffer B at a flow rate of 1.0 mL/min (volume of bound protein fraction 3 mL). The immunoaffinity column was then regenerated by equilibrating it with Buffer A for 13 min bringing the total run cycle to 30.0 min. Fraction collection of flow-through proteins was time-controlled and corresponded to the UV 280 nm absorbance of the eluting proteins. The flow-through fraction was collected and kept at 4º C using the thermostatted fraction collec-tor, was reduced to a final volume of 30 µL using spin concentrators and analyzed by HPLC-ICPMS. Bound proteins (i.e., albumin, IgG, IgA, transferin, haptoglobin and anti-trypsin) were eluted from the immunodepletion column and selected samples were analyzed by ICPMS (data not included here). Buffer A is a phosphate buffer (pH 7.4) and buffer B is a concentrated urea buffer in water (pH 2.25).
Instrumentation: An Agilent 1100 LC system equipped with a binary pump, degasser, autosampler (300 µL loop) with thermostat, diode array detector with 6 mm flow cell, and a thermostated fraction collector was used for the immunodepletion work. Protein separa-tion was achieved on a silica TSKGel column SW3000 (30 cm x 4.6 mm id x 4 μm particles x 250 nm pore size)
V. Lopez-Avila et al. / HEALTH 1 (2009) 104-110
SciRes Copyright © 2009 Openly accessible at http://www.scirp.org/journal/HEALTH/
106
from Tosoh Bioscience (Montgomerryville, PA). All HPLC analyses were performed on an Agilent Tech-nologies 1100 Series High Performance Liquid Chro-matography system equipped with a binary pump, de-gasser, autosampler (100 μL loop) and diode array de-tector (215 nm and 280 nm). 0.1 M Tris (pH 7) was used as mobile phase at a flow rate of 0.3 mL /min. The liquid flow from the HPLC column was converted into aerosol droplets by a Micromist nebulizer with a dual pass spray chamber. 63Cu and 65Cu scan was performed on an Agilent 7500ce ICPMS system with a quadrupole mass analyzer and an Octapole Reaction System (ORS) for matrix-based interference removal. High levels of Na in the sample can cause the formation of 40Ar 23Na polya-tomic species that overlap with 63Cu. Similarly, 31P based molecular species (31P 16O 16O and 31P 18O 16O) can overlap with the 63Cu and 65Cu isotopes. The ORS with He (99.999 % purity) as collision gas at 3.5 mL/min was used to eliminate these interfering species and to im-prove signal to noise. ICPMS conditions: outer gas (Ar) flowrate 15 L/min; carrier gas (Ar) flowrate 0.8 L/min; makeup gas (Ar) flowrate 0.15 L/min; RF power 1.55kW, sampling depth 8 mm.
3. RESULTS AND DISCUSSION
3.1. Method Performance
The performance of this method (see Table 1) was es-tablished independently by two of the authors (in sepa-rate laboratories) with a reference human serum ERM DA470 that is certified for Cp at 0.205 mg/mL using identical instrumentation. This serum was reconstituted with high purity water and analyzed in triplicate in Laboratory 1 and in seven replicates over a period of two months in Laboratory 2. The results are summarized in Table 1. The agreement between the concentration of Cp in the certified serum and the reconstituted serum ana-lyzed by this method is excellent (method accuracy is 101% in Laboratory 1 and 98.0% in Laboratory 2). The coefficient of variation (CV) for the three replicate measurements of the freshly reconstituted serum in Laboratory 1 is 5.4 %. The CV of the seven replicates performed over a period of two months in Laboratory 2 is 6.4%.
Method performance data are included in Table 2. The method detection limit was established from the instrument detection limit and applies only to sample injection volumes of 5 µL; larger injection volumes would allow a lower method detection limit but such experiments were not pursued here. The method dy-namic range is given as 0.01 to 5 mg/mL since this is the range of concentrations that were tested here. Although the instrument dynamic range is 9 orders of magnitude, that would involve adjustments in ICPMS operating pa-rameters to accommodate such a wide range. Expected
Table 1. Concentration of Cp in the ERM DA 470 reference serum.
Certified
value (mg/mL)
Conc meas-ured in this
study (mg/mL)
63Cu/65Cu
ERM DA 470 Reference Serum
(Laboratory 1)
0.205 (0.011)a
0.208 (5.4 %)b 2.1 (3.6%)b
ERM DA 470 Reference Serum
(Laboratory 2)
0.205 (0.011)a
0.201 (6.4%)c 2.2 (7.3%)c
aUncertainty (mg/mL) – defined as half-width of the 95% confidence interval of the mean value(K factors were chosen according to the t-distribution depending on the number of labs) [12, 13]. bAverage of 3 determinations; value given in parentheses is the coeffi-cient of variation.
cAverage of 7 determinations; value given in parentheses is the coeffi-cient of variation.
Table 2. Cp determination by HPLC-ICPMS-method perfor-mancea.
Method indicator Value
Detection Limit 0.01 mg/mL
Dynamic Range 0.01 – 5.0 mg/mL (tested only until 5
mg/mL)
Reproducibility
CV for immunodepletion : 0.07% to 2.2 % CV for injection into HPLC: 5.3%
(Cp standard at 1 mg/mL) Overall CV: <10%
Accuracy using ERMDA470
101 % (Laboratory 1); 98.0% (Laboratory 2)
Cp Identification
from retention time match of the unknown peak in the sample to the Cp standard and the presence of 63Cu and 65Cu at a ratio of
2.2 ± 0.1 aThis method takes approximately 95 min/sample from start to finish (15 min dilution and filtration, 30 min immunoaffinity chromatography, 20-30 min concentration, and 20 min HPLC-ICPMS analysis).
concentrations of Cp in human sera are in the 0.1-2 mg/mL range, therefore a 30 µL volume of the original serum is sufficient to detect Cp at 0.1 mg/mL if the final volume of the depleted serum is 30 µL. The overall CV for method reproducibility is <10 % and it is shown in Table 2 for various steps in the analysis. The identifica-tion of Cp is based on retention time match of the un-known peak in the sample to the Cp standard and the ratio of 63Cu/65Cu. The average HPLC retention time for 8 consecutive injections of the Cp standard is 8.389 min with a CV of 0.059%. The relative abundance of the 63Cu is 69.17% and 65Cu is 30.83%, thus the theoretical ratio for 63Cu /65Cu is 2.24; based on our experimental data we set the acceptance limits for 63Cu /65Cu to 2.2 ± 0.1 [15].
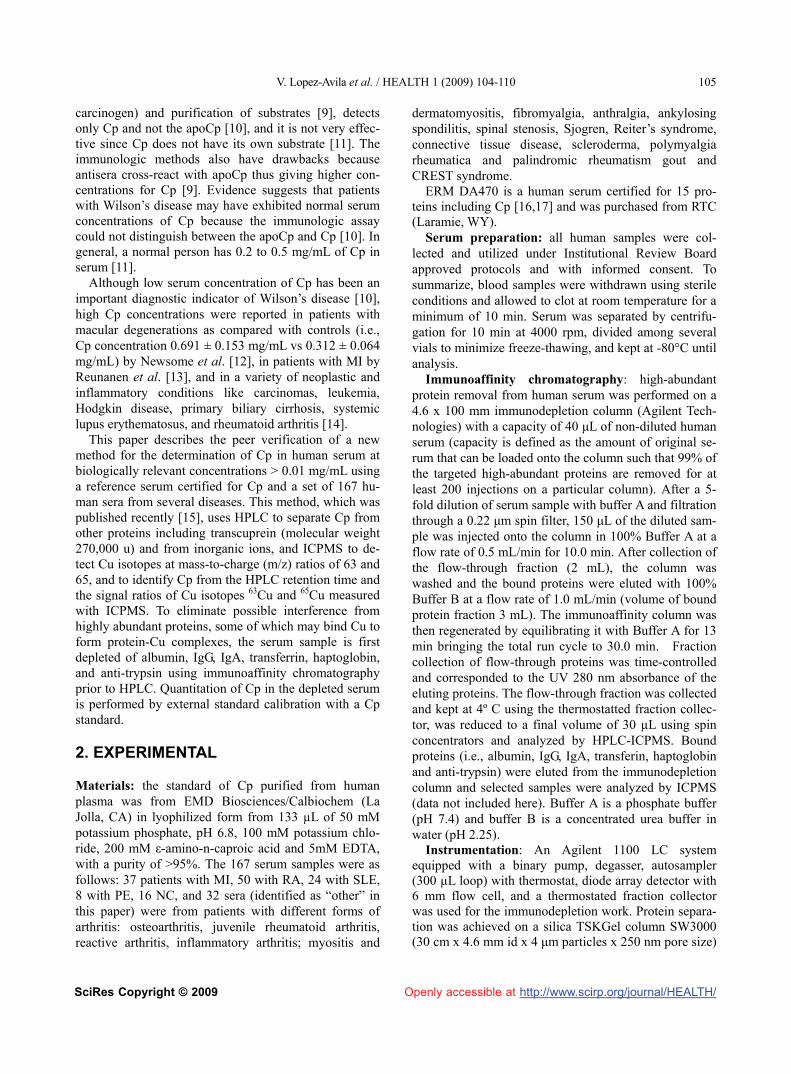
In addition, we validated the Cp measurements by performing a total Cu analysis on a set of 23 depleted sera and compared those measurements with the Cp concentrations measured by HPLC-ICPMS (see Figure 1). Regression analysis gave a correlation coefficient of
V. Lopez-Avila et al. / HEALTH 1 (2009) 104-110
SciRes Copyright © 2009 Openly accessible at http://www.scirp.org/journal/HEALTH/
107
0.9, which confirms literature reports that most Cu in depleted serum is bound by Cp [1]. Furthermore, we verified the number of Cu atoms bound by Cp in the ERM DA470 reference serum by determining the total Cu in the depleted sample. At a Cp concentration of 0.2
Total Cu conc vs Cp conc (n=23 samples)
y = 1073x + 641.98
R2 = 0.805
0
500
1000
1500
2000
2500
3000
0 0.5 1 1.5 2
Cp conc (mg/mL)
To
tal
Cu
co
nc
(ng
/mL
)
Figure 1. Total Cu vs Cp concentration for 23 serum samples (7 PE, 1 NC, 14 MI and ERM DA470).
mg/mL (measured in this study for the ERM DA470 serum), 6 Cu atoms per Cp molecule would correspond to a total Cu concentration of 596 ng/mL and 7 Cu atoms per Cp molecule would correspond to 695 ng/mL. Be-cause the total Cu measured in the depleted reference serum was in the range of 618-661 ng/mL, we concluded that Cp must contains between 6 and 7 atoms per mole-cule, consistent with the published data for Cp [1] Also as part of method validation, a Cp standard, the ER-MDA470 certified serum and one of the depleted MI sera were fractionated by HPLC and the corresponding fractions containing Cp were collected manually, and were then subjected to one gel electrophoresis followed by Cp band excision, in-gel digestion, and electrospray MS of the digest to confirm the presence of Cp [15].
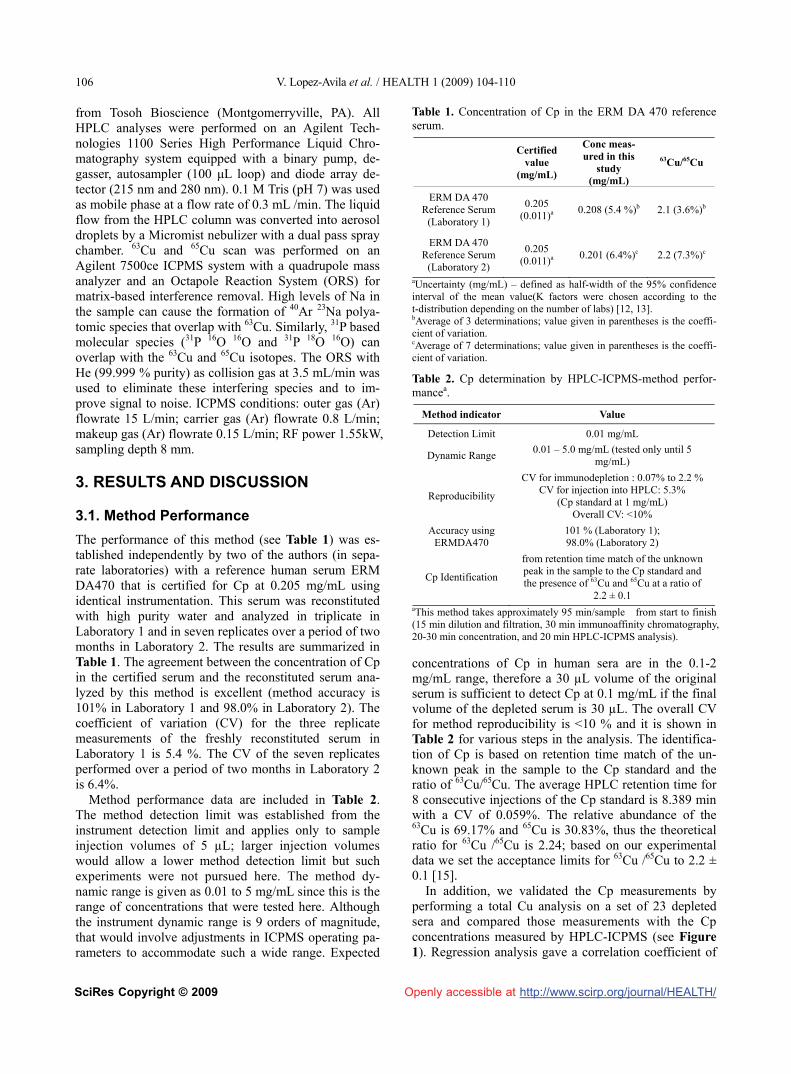
Figure 2 shows HPLC-UV and ICPMS chroma tograms for a Cp standard and a depleted serum sample; the HPLC chromatograms show the complexity of the
Figure 2. HPLC-ICPMS chromatograms for Cp standard and depleted serum sample.

V. Lopez-Avila et al. / HEALTH 1 (2009) 104-110
SciRes Copyright © 2009 Openly accessible at http://www.scirp.org/journal/HEALTH/
108
serum sample even after its depletion of the high abun-dant proteins whereas the ICPMS chromatograms show only the 63Cu and 65Cu signals at a retention time that matches that of the Cp standard and are in a ratio corre-sponding to 6-7 Cu atoms per Cp molecule.
3.2. Ceruloplasmin Levels in Sera from Different Diseases
Figure 3 shows the distribution of Cp concentration across several diseases, including MI, PE, RA, SLE, other forms of arthritis (i.e., osteoarthritis, juvenile rheumatoid arthritis, reactive arthritis, inflammatory arthritis) and NC sera (167 serum samples in all). Sam-ples derived from patients experiencing MI (37 in our study) had an average Cp concentration of 0.402 ± 0.377 mg/mL and exhibited Cp concentrations as high as 1.64 mg/mL, while a subset of 50 RA patients and 24 SLE patients had average concentrations of 0.447 ± 0.215 mg/mL and 0.426 ± 0.264 mg/mL and exhibited elevated Cp concentrations as high as 1.23 mg/mL and 1.24 mg/mL, respectively (Figure 3). Normal Cp concentra-tions are in the 0.2-0.5 mg/mL range [11] and the aver-age Cp concentration in the set of NC sera in our study (16 patients) was 0.316 ± 0.120 mg/mL. When compar-ing Cp concentrations for our MI, RA, SLE, and “other”sera with our set of NC sera, only the RA and SLE data were statistically different from the NC in a t test (i.e., p values were 0.0037 and 0.0837 for RA and SLE sera, respectively). The MI data reported here show a much higher variation than our NC data, and this variation is statistically significant (F value is 9.92, F crit is 2.22, and p<0.001). Reunanen et al. [13], using serum from 104 patients with MI or stroke and 104 matched controls, concluded that high Cp concentrations in serum were significantly associated with higher incidents of MI but not of stroke.
Hantzschel et al. [18] reported for RA and polymyal-gia rheumatica an average Cp concentration for 23 RA patients (22 females) of 0.7 ± 0.4 mg/mL and for 16 po-lymyalgia rheumatica patients (all females) 0.5 ± 0.1 mg/mL. The authors suggested that clinical data, includ-ing a history of hip and shoulder muscle tenderness and lack of positive rheumatoid factor, and a normal Cp level could distinguish polymyalgia rheumatica from rheuma-toid arthritis. We observed a similar trend for RA pa-tients as compared with patients with “other” forms of arthritis. The average Cp concentrations for RA of 0.447 ± 0.215 mg/mL were significantly different from the average Cp concentrations for “other” diseases, which had an average Cp concentration of 0.376 ± 0.145 mg/mL, only when doing a one-tail test (p value was 0.041). Perhaps Cp concentrations above 0.5 mg/mL would be indicative of disease severity, however charac-terization of larger sample sets will be necessary to sub-stantiate this observation.
Figures 4 and 5 show Cp concentrations as a function of patient’s gender and age, respectively. Although this is a very limited sample set (70 sera from 33 RA, 5 SLE and 32 “other”arthritis patients with 49 females and 21 males) it is interesting to note that female patients exhib-ited slightly higher Cp concentrations (ave ± SD of 0.392 ± 0.153 mg/mL) than male patients (0.319 ± 0.123 mg/mL) that were statistically significant at 5% signifi-cance level (48 degrees of freedom, tstat. 2.104, tcrit 2.011, probability for a two-tail test was 0.0410). However, when we averaged only the Cp concentrations for the 33 RA patients by gender (24 females and 9 males) we found a larger difference between the female patients and male patients (0.417 ± 0.158 mg/mL vs 0.278 ± 0.096 mg/mL, respectively) that was statistically sig-nificant at 5% significance level (24 degrees of freedom, tstat. 3.059 , tcrit 2.064, probability for a two-tail test was 0.005 ). Data reported by Lyngbye and Kroll [19] for a normal population (280 patients, 149 males and 111 fe-males) also indicate significantly higher concentrations of Cp in female patients which are known to be caused by use of oral contraceptives [20].
There does not seem to be a correlation between the Cp concentration and patient’s age across these 70 pa-tients with RA and arthritis (Figure 5). The average Cp concentration for RA patients was 0.370 ± 0.149 mg/mL and 0.384 ± 0.163 mg/mL for <50 y.o. and > 50 y.o., respectively ( tstat. of 0.247 is less than t crit 2.059, p for a two-tail test was 0.807, indicating that the results were not statistically different). The average Cp concentra-tions for “other” arthritis patients were 0.387 ± 0.162 mg/mL and 0.356 ± 0.110 mg/mL for <50 y.o. and > 50 y.o., respectively (tstat. 0.645 is less than tcrit 2.048, p for a two-tail test was 0.524), indicating again that the
167 serum samples consist of 37 MI (myocardial infarction), 16 NC (normal controls), 8 PE (pulmonary embolism), 50 RA (rheumatoid arthritis), 24 SLE (systemic lupus erythematosus) and 32 other diseases (osteoarthitis, gout, dermatomyositis, ankylosing spondylitis, myositis, juvenile rheumatoid arthritis, etc)
Figure 3. Cp concentration for various diseases and normal controls.

V. Lopez-Avila et al. / HEALTH 1 (2009) 104-110
SciRes Copyright © 2009 Openly accessible at http://www.scirp.org/journal/HEALTH/
109
70 serum samples from 33 RA patients, 5 SLE, and 32 other diseases M – male (21 patients) F – female (49 patients)
Figure 4. Cp concentration as a function of patient’s gender.
70 serum samples from 33 RA patients, 5 SLE, and 32 other diseases
Figure 5. Cp concentration as a function of patient’s age.
results were not statistically significant). Results for a normal population indicated no age variation in adults [19], however in another study Revnic [21] reported differences (p<0.05) between Cp concentrations in RA patients < 50 y.o. and >70 y.o. We have looked at Cp concentration for 22 RA patients < 50 y.o. (12 patients) and > 66.6 y.o (10 patients) and found no significant differences at p<0.05. Age related changes in human Cp concentrations were attributed to oxidative modifications, which can likely cause conformational changes around the Cu sites [22].
4. CONCLUSIONS
The method described here uses immunoaffinity chro-matography and HPLC to separate Cp from the serum proteins prior to analysis by ICPMS. By removing the six most abundant proteins from serum with immunoaf-finity chromatography and by using HPLC to separate Cu bound by Cp from any free Cu in the serum sample,
we demonstrated that we can measure Cp in the ERM DA470 reference serum with an accuracy of 98 to 101%. The HPLC-ICPMS method was used to analyze 167 serum samples from several diseases and a set of NC for Cp. Our data for the 167 human sera show that Cp con-centrations tend to be higher in MI, RA, and SLE pa-tients. Cp concentrations were higher in female as com-pared to male patients, and this trend was most promi-nent in patients with RA. We did not observe a correla-tion between Cp concentration and patient’s age for the limited set of 70 patients for which we had gender and age information. Thus, measurement of Cp levels by ICPMS represents a biomarker that when combined with conventional clinical and laboratory data may provide increased diagnostic value.
5. ACKNOWLEDGEMENTS
The authors thank Toshiaki Matsuda of Agilent Tokyo Analytical Divi-sion, Tokyo, Japan, for making available an ICPMS system for per-forming this research, Alex Apffel of Agilent Labs, Santa Clara, CA for making available an HPLC system with fraction collection and for assistance with the immunodepletion process.
REFERENCES
[1] Takahashi, N., Ortel, T., and Putnam, F. (1984) Sin-gle-chain structure of human ceruloplasmin: The com-plete amino acid sequence of the whole molecule. Proc Nat Acad Sci USA, 81, 390-4.
[2] Hellman, N.E. and Gitlin, J.D. (2002) Ceruloplasmin metabolism and function. Annu Rev Nutr, 22, 439-458.
[3] Hellman, N.E., Kono, S., Mancini, G.M., Hoogeboom, A.J., de Jong, G.J., and Gitlin, J.D. (2002) Mechanisms of copper incorporation into human ceruloplasmin. J Biol Chem, 48, 46632-46638.
[4] Linder, M.C., Wooten, L., Cerveza, P., Cotton, S., Shulze, R., and Lomeli, N. (1998) Copper transport. Am J Clin Nutr, 67, 965S-971S.
[5] Prohanska, J.R. and Gybina, A.A., (2004) Intracellular copper transport in mammals. J Nutr, 134, 1003-1006.
[6] DakoCytomation (1998) Application note guideline for determination of ceruloplasmin in serum/plasma on hi-tachi 911, 3.
[7] Buffone, G.J., Brett, E.M., Lewis, S.A., Iosefson, M., and Hicks, J.M. (1979) Limitations of immunochemical measurement of ceruloplasmin. Clin Chem, 25, 749-51.
[8] Hohbadel, D.C., McNeely, M.D., and Sunderman, F.W. (1975) Automated bichromatic analysis of serum ceru-loplasmin. Annals Clin Lab Sci, 5, 65-70.
[9] Twomey, P.J., Viljoen, A., House, I.M., Reynolds, T.M., Wierzbicki, A.S., (2005) Relationship between serum copper, ceruloplasmin, and non-ceruloplasmin –bound Copper in routine clinical practice. Clin Chem, 51, 1558-9.
[10] Macintyre, G., Gutfreund, K.S., Martin, W.R., Camicioli, R., Cox, D.W. (2004) Value of an enzymatic assay for the determination of serum ceruloplasmin. J. Lab. Clin. Med. 144, 294-301.
V. Lopez-Avila et al. / HEALTH 1 (2009) 104-110
SciRes Copyright © 2009 Openly accessible at http://www.scirp.org/journal/HEALTH/
110
[11] Hahn, S.-H., Jang, Y.-J., Lee, S.-Y., Shin, H.-C., Park, S.-Y., Yu, E.-S., and Han, H.-S. (2004) US patent 6,806,044 B2–Method of measuring ceruloplasmin con-centration in a blood spot, kit and method of diagnosing Wilson’s disease.
[12] Newsome, D.A., Swartz, M., Leone, N.C., Hewitt, A.T., Wolford, F., and Miller, E.D. (1986) Macular degenera-tion and elevated serum ceruloplasmin. Investig Ophtal-mol &Visual Sci, 27, 1675-80.
[13] Reunanen, A., Knekt, P., and Aaran, R.K. (1992) Serum ceruloplasmin level and the risk of myocardial infarction and stroke. Amer J Epidemiol, 136, 1082-90.
[14] Interpath Laboratory, Inc. www.interpathlab.com/TechnicalUpdates/ceruloplasmin.htm (Accessed November 2006)
[15] Lopez-Avila, V., Robinson, W.H., and Sharpe, O. (2006) Determination of ceruloplasmin in human serum by SEC- ICPMS. Anal Bioanal Chem, 386, 180-7.
[16] Emons, H. (2005) Certificate of analysis ERM DA470, Institute for Reference Materials and Measurements, Geel, Belgium.
[17] Baudner, S., Bienvenu, J., Blirup-Jensen, S., Calstrom, A., Johnson, A.M., Milford Ward, A., et al. (2005) Certifica-
tion report – The certification of a matrix reference mate-rial for immunochemical measurement of 15 serum pro-teins, institute for reference materials and measurements, Geel, Belgium.
[18] Hanzschel, H., Bird, H.A., Seidel, W., Kruger, W., Neu-mann, G., Schneider, G., and Wright, V. (1991) Polym-yalgia rheumatica and rheumatoid arthritis of the elderly: A clinical, laboratory, and scintigraphic comparison. An-nals of the Rheumatic Diseases, 50, 619-22.
[19] Lyngbye, J. and Kroll, J. (1971) Quantitative immu-noelectrophoresis of protein in serum from a normal population: season-, age-, and sex-related variations. Clin Chem, 17, 495-500.
[20] Sontakke, A.N. and More, U. (2004) Changes in serum ceruloplasmin levels with commonly used methods of contraception. Indian J Clin Biochem, 19(1), 102-104.
[21] Revnic, F. (1995) The significance of serum ceruloplas-min in diagnosis of rheumatoid arthritis, Toxicol Lett, 78 (1), 70-71.
[22] Musci, G., Bonaccorsi, di Patti, M.C., Fagiolo, U., and Calabrese, L. (1993) Age-related changes in human ce-ruloplasmin, J Biol Chem, 268 (18), 13388-13395.
Appendix List of Abbreviations:
Cp - ceruloplasmin HPLC - high-pressure liquid chromatography ICPMS - inductively-coupled plasma mass spectrometry MI - myocardial infarction NC - normal control
PE - pulmonary embolism RA - rheumatoid arthritis SLE - systemic lupus erythematosus CREST- form of systemic sclerosis ERM - European Reference Materials