ces overview of services for mainehealth & maine medical...
TRANSCRIPT

www.competitive-energy.com 866.408.4591
CES Overview of Services for
MaineHealth & Maine Medical
Center
Competitive Energy Services
May 23, 2014

Presentation Agenda
CES Overview
Accomplishments for MMC / MaineHealth
Selected Case Studies
Procurement strategy
2
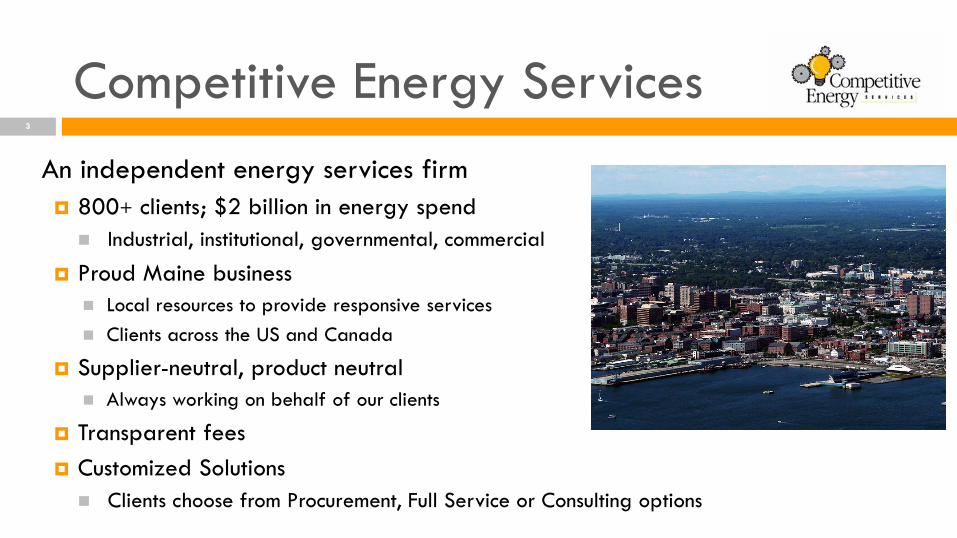
Competitive Energy Services 3
An independent energy services firm
800+ clients; $2 billion in energy spend
Industrial, institutional, governmental, commercial
Proud Maine business
Local resources to provide responsive services
Clients across the US and Canada
Supplier-neutral, product neutral
Always working on behalf of our clients
Transparent fees
Customized Solutions
Clients choose from Procurement, Full Service or Consulting options
Experience 4
Headquartered in Portland, Maine
30+ employees based in Maine covering account management, pricing, analytics, consultation
Serving healthcare industry since 2001
Professional advice for all energy issues including utilities, utilization, demand side initiatives, risk, budget, finance, sustainability, commodities, etc.
Local expertise and availability
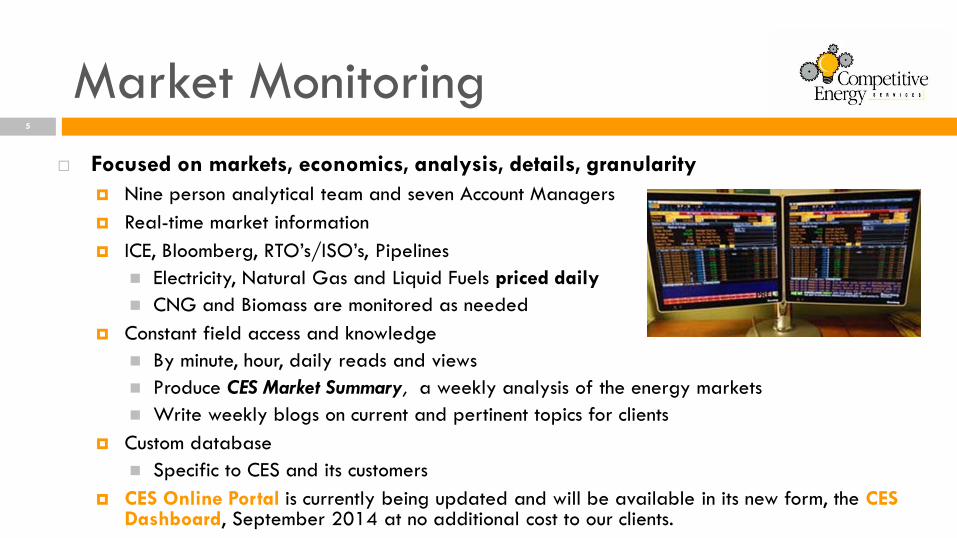
Market Monitoring
Focused on markets, economics, analysis, details, granularity
Nine person analytical team and seven Account Managers
Real-time market information
ICE, Bloomberg, RTO’s/ISO’s, Pipelines
Electricity, Natural Gas and Liquid Fuels priced daily
CNG and Biomass are monitored as needed
Constant field access and knowledge
By minute, hour, daily reads and views
Produce CES Market Summary, a weekly analysis of the energy markets
Write weekly blogs on current and pertinent topics for clients
Custom database
Specific to CES and its customers
CES Online Portal is currently being updated and will be available in its new form, the CES Dashboard, September 2014 at no additional cost to our clients.
5

Selected Clients
Healthcare Eastern Maine Healthcare System -
all members including: Acadia Hospital Eastern Maine Medical Center Inland Hospital Maine Coast Memorial Hospital MDI Hospital Redington Fairview Hospital
Cottage Hospital Covenant Health System Harrington Memorial Hospital Heywood Memorial Hospital Martin’s Point Healthcare York Hospital
Non-Healthcare Huhtamaki/Chinet Co.
New Balance Athletic Shoe
Hannaford Bros. Supermarkets
Pratt & Whitney
University of Maine
LL Bean
State of Maine
Ethan Allen
Adobe
Texas Instruments
Dartmouth College
University of Massachusetts
City of Portland
6
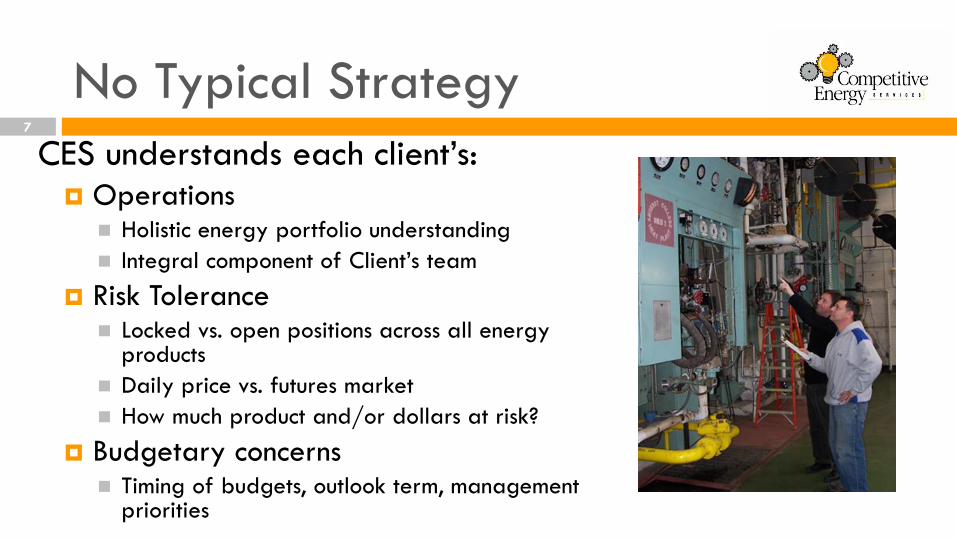
No Typical Strategy
CES understands each client’s: Operations
Holistic energy portfolio understanding
Integral component of Client’s team
Risk Tolerance Locked vs. open positions across all energy
products
Daily price vs. futures market
How much product and/or dollars at risk?
Budgetary concerns Timing of budgets, outlook term, management
priorities
7
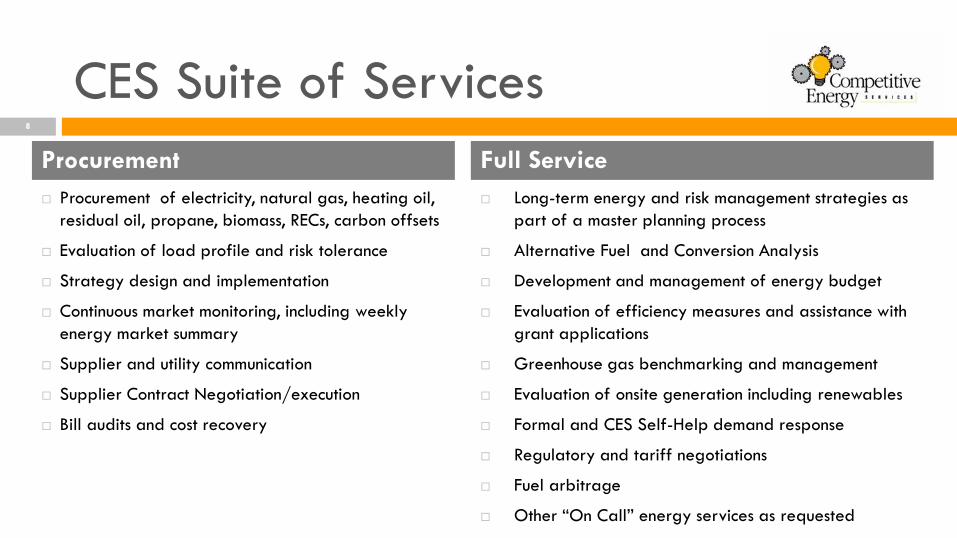
CES Suite of Services
Long-term energy and risk management strategies as
part of a master planning process
Alternative Fuel and Conversion Analysis
Development and management of energy budget
Evaluation of efficiency measures and assistance with
grant applications
Greenhouse gas benchmarking and management
Evaluation of onsite generation including renewables
Formal and CES Self-Help demand response
Regulatory and tariff negotiations
Fuel arbitrage
Other “On Call” energy services as requested
Procurement of electricity, natural gas, heating oil,
residual oil, propane, biomass, RECs, carbon offsets
Evaluation of load profile and risk tolerance
Strategy design and implementation
Continuous market monitoring, including weekly
energy market summary
Supplier and utility communication
Supplier Contract Negotiation/execution
Bill audits and cost recovery
8
Full Service Procurement

9
CES Accomplishments
with MMC / MaineHealth
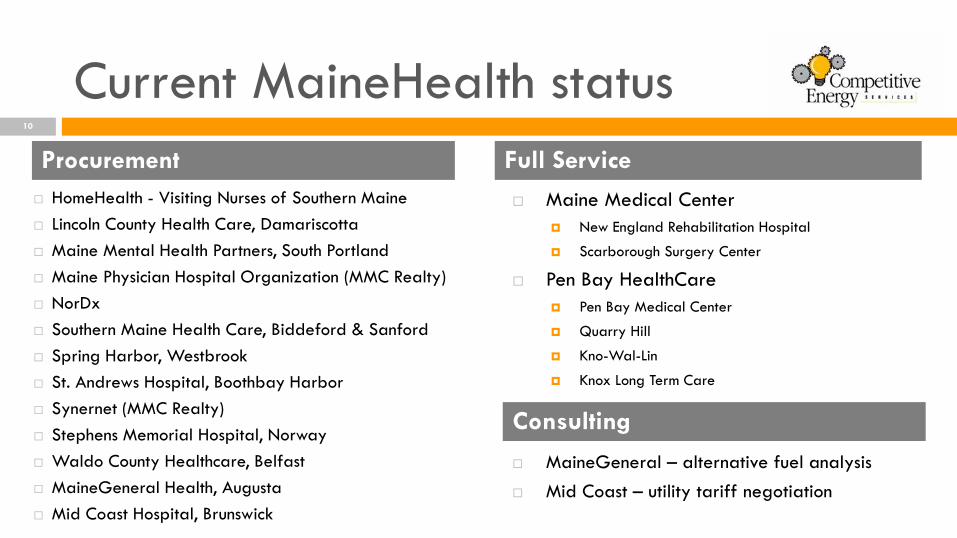
Current MaineHealth status
Maine Medical Center
New England Rehabilitation Hospital
Scarborough Surgery Center
Pen Bay HealthCare
Pen Bay Medical Center
Quarry Hill
Kno-Wal-Lin
Knox Long Term Care
HomeHealth - Visiting Nurses of Southern Maine
Lincoln County Health Care, Damariscotta
Maine Mental Health Partners, South Portland
Maine Physician Hospital Organization (MMC Realty)
NorDx
Southern Maine Health Care, Biddeford & Sanford
Spring Harbor, Westbrook
St. Andrews Hospital, Boothbay Harbor
Synernet (MMC Realty)
Stephens Memorial Hospital, Norway
Waldo County Healthcare, Belfast
MaineGeneral Health, Augusta
Mid Coast Hospital, Brunswick
10
Full Service Procurement
Consulting
MaineGeneral – alternative fuel analysis
Mid Coast – utility tariff negotiation
History with MaineHealth
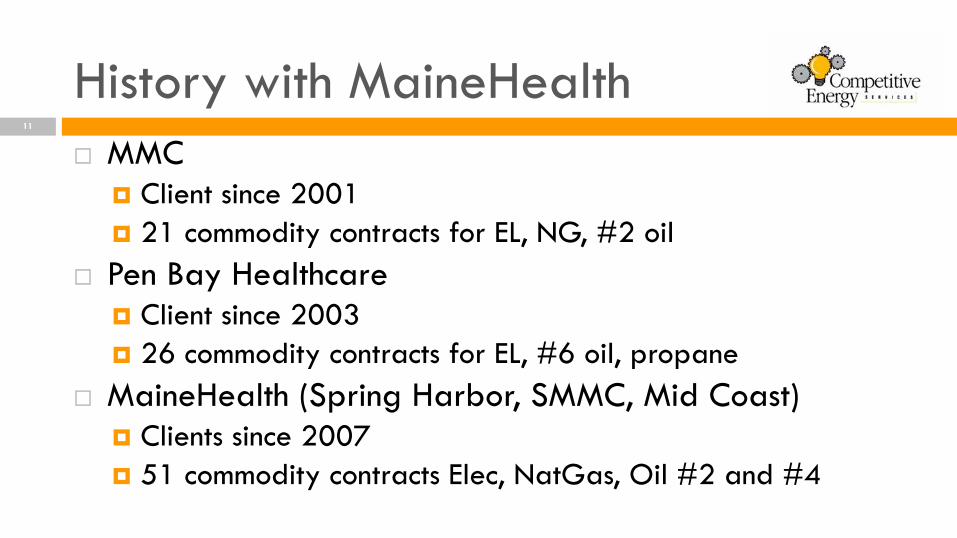
MMC
Client since 2001
21 commodity contracts for EL, NG, #2 oil
Pen Bay Healthcare
Client since 2003
26 commodity contracts for EL, #6 oil, propane
MaineHealth (Spring Harbor, SMMC, Mid Coast)
Clients since 2007
51 commodity contracts Elec, NatGas, Oil #2 and #4
11

MMC Electricity Contracts 12
Short Term Contracts In
Declining Market
Focus On:
Year-Over-Year Savings
Budget Certainty
Potential for future savings
Longer Contract Terms At
Market Low
2 yr term
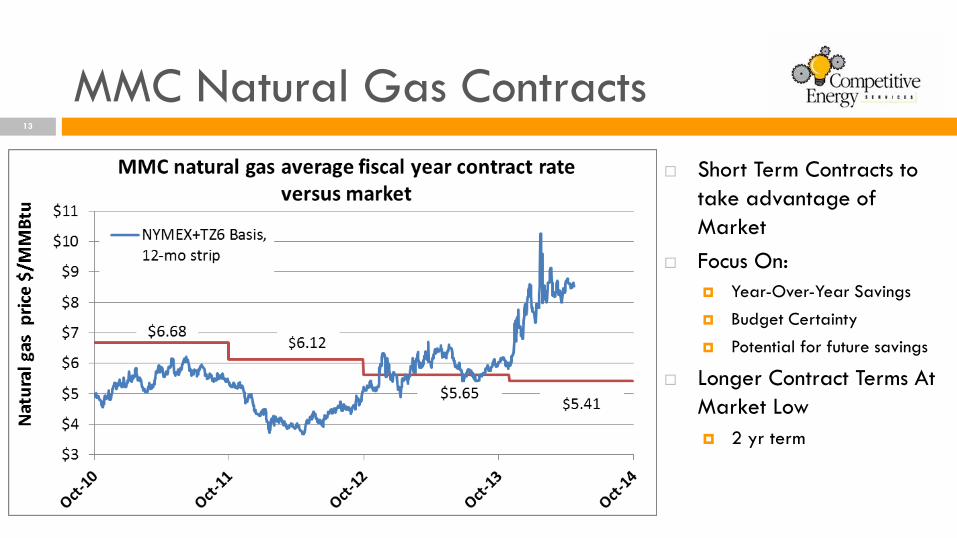
MMC Natural Gas Contracts 13
Short Term Contracts to
take advantage of
Market
Focus On:
Year-Over-Year Savings
Budget Certainty
Potential for future savings
Longer Contract Terms At
Market Low
2 yr term
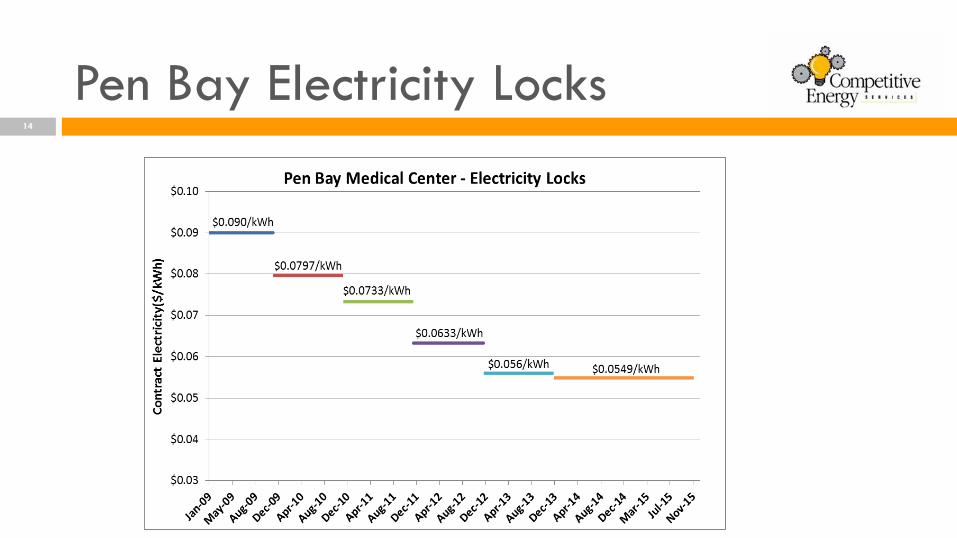
Pen Bay Electricity Locks 14
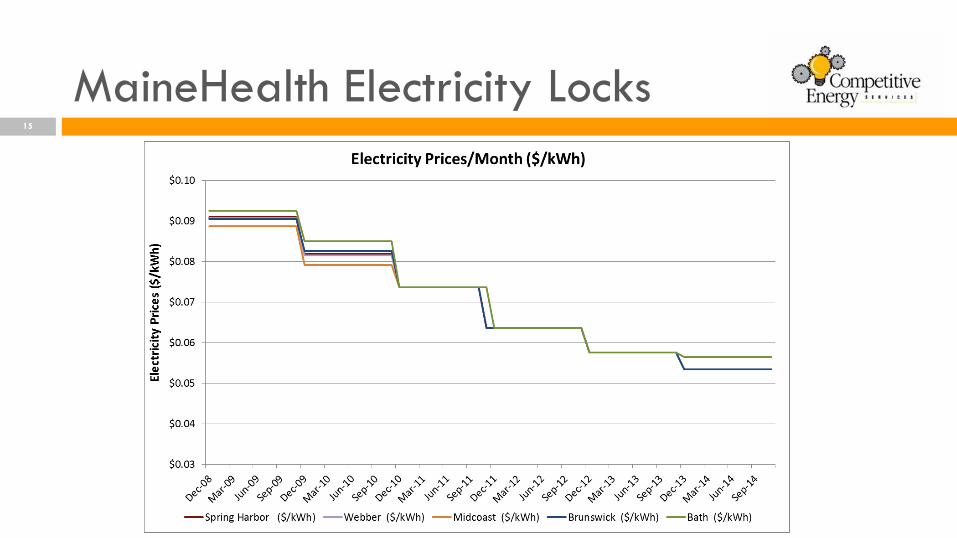
MaineHealth Electricity Locks 15

MaineHealth Natural Gas locks 16

17
Selected Case Studies
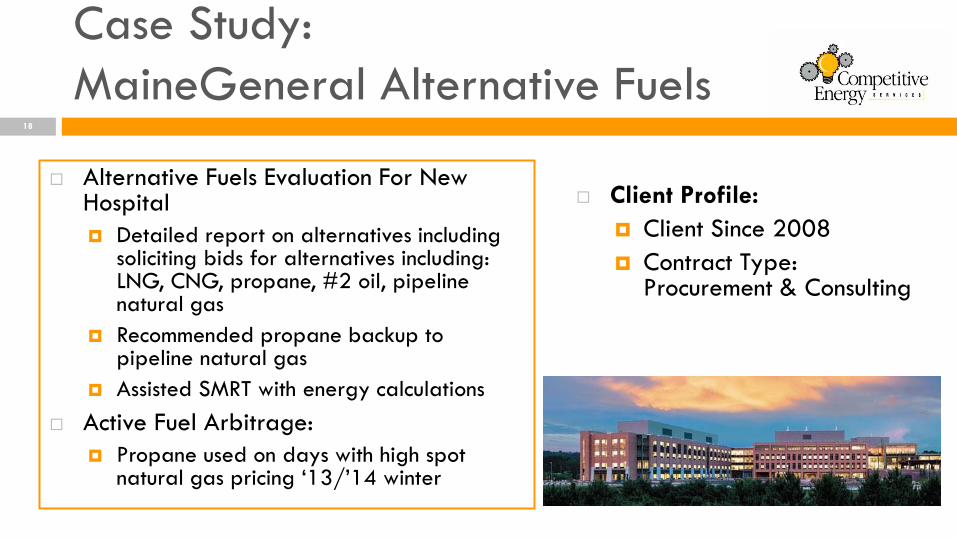
Case Study:
MaineGeneral Alternative Fuels
Alternative Fuels Evaluation For New Hospital
Detailed report on alternatives including soliciting bids for alternatives including: LNG, CNG, propane, #2 oil, pipeline natural gas
Recommended propane backup to pipeline natural gas
Assisted SMRT with energy calculations
Active Fuel Arbitrage:
Propane used on days with high spot natural gas pricing ‘13/’14 winter
18
Client Profile:
Client Since 2008
Contract Type: Procurement & Consulting
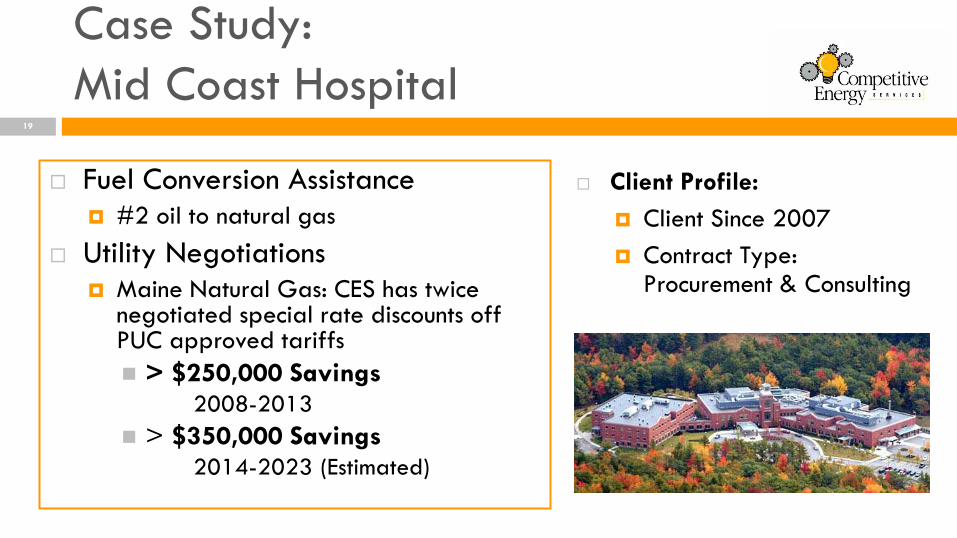
Case Study:
Mid Coast Hospital
Fuel Conversion Assistance #2 oil to natural gas
Utility Negotiations Maine Natural Gas: CES has twice
negotiated special rate discounts off PUC approved tariffs
> $250,000 Savings 2008-2013
> $350,000 Savings 2014-2023 (Estimated)
19
Client Profile:
Client Since 2007
Contract Type: Procurement & Consulting

Case Study:
Maine Medical Center
Electricity & Natural Gas Procurement Over 50 million kWh per year
Over 250,000 MMBtu per year
Development of detailed annual energy budgets
Design and implementation of strategic energy procurement plan
Contract terms and conditions negotiations with suppliers
Fuel conversion analysis and Bill Audit
Cogeneration and Boiler ROI Analysis
20
Client Profile:
Client Since 2006
Contract Type: Monthly Retainer, Full Service

Case Study:
EMMC Cogen
4.5 MW natural gas-fired CHP unit
CES performed the economic analysis and financial modeling
CES represented and negotiated terms with utilities and Maine PUC
Worked with EMMC and the local utility to secure an interconnection agreement
Nominated and secured all natural gas and ultra-low sulfur diesel (ULSD)
Continues to help EMMC realize savings by designing and implementing a detailed fuel hedging strategy for the CHP
21
Client Profile:
Client Since 2003
Contract Type: Consulting and Procurement
Case Study:
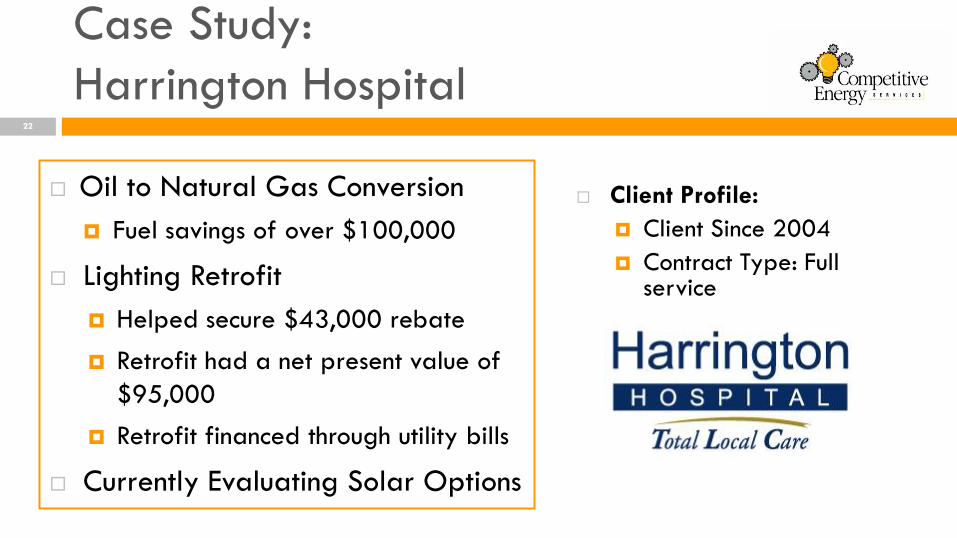
Harrington Hospital
Oil to Natural Gas Conversion
Fuel savings of over $100,000
Lighting Retrofit
Helped secure $43,000 rebate
Retrofit had a net present value of
$95,000
Retrofit financed through utility bills
Currently Evaluating Solar Options
22
Client Profile:
Client Since 2004
Contract Type: Full service

23
Procurement

Procurement Strategies
Understand your risk tolerance Risk vs reward
Costs for insurance
Make a market assessment High prices
How high?
Relief
Market Intelligence/Forecasts
Finance – internal discussion Budget Assurance
Political Management
Product Discussion Electricity – fixed, heat rate,
block and index, index
Natural Gas – fixed, dailies, combinations
Oil/Propane – spot and future market adders
All products – hedge, hybrid vs spot
Terms Long
Mid
Short
24
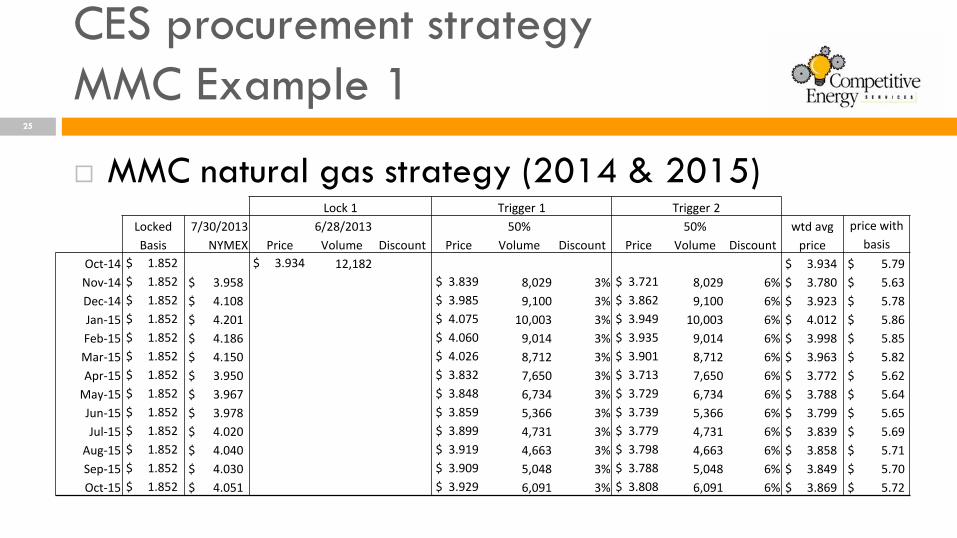
CES procurement strategy
MMC Example 1
MMC natural gas strategy (2014 & 2015)
25
Lock 1 Trigger 1 Trigger 2
Locked 7/30/2013 6/28/2013 50% 50% wtd avg price with
Basis NYMEX Price Volume Discount Price Volume Discount Price Volume Discount price basis
Oct-14 $ 1.852 $ 3.934 12,182 $ 3.934 $ 5.79
Nov-14 $ 1.852 $ 3.958 $ 3.839 8,029 3% $ 3.721 8,029 6% $ 3.780 $ 5.63
Dec-14 $ 1.852 $ 4.108 $ 3.985 9,100 3% $ 3.862 9,100 6% $ 3.923 $ 5.78
Jan-15 $ 1.852 $ 4.201 $ 4.075 10,003 3% $ 3.949 10,003 6% $ 4.012 $ 5.86
Feb-15 $ 1.852 $ 4.186 $ 4.060 9,014 3% $ 3.935 9,014 6% $ 3.998 $ 5.85
Mar-15 $ 1.852 $ 4.150 $ 4.026 8,712 3% $ 3.901 8,712 6% $ 3.963 $ 5.82
Apr-15 $ 1.852 $ 3.950 $ 3.832 7,650 3% $ 3.713 7,650 6% $ 3.772 $ 5.62
May-15 $ 1.852 $ 3.967 $ 3.848 6,734 3% $ 3.729 6,734 6% $ 3.788 $ 5.64
Jun-15 $ 1.852 $ 3.978 $ 3.859 5,366 3% $ 3.739 5,366 6% $ 3.799 $ 5.65
Jul-15 $ 1.852 $ 4.020 $ 3.899 4,731 3% $ 3.779 4,731 6% $ 3.839 $ 5.69
Aug-15 $ 1.852 $ 4.040 $ 3.919 4,663 3% $ 3.798 4,663 6% $ 3.858 $ 5.71
Sep-15 $ 1.852 $ 4.030 $ 3.909 5,048 3% $ 3.788 5,048 6% $ 3.849 $ 5.70
Oct-15 $ 1.852 $ 4.051 $ 3.929 6,091 3% $ 3.808 6,091 6% $ 3.869 $ 5.72
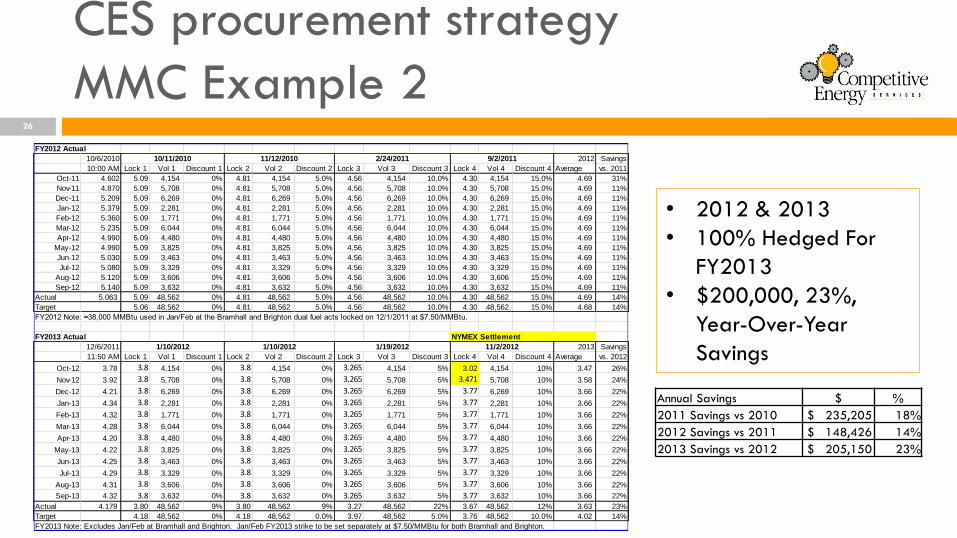
CES procurement strategy
MMC Example 2 26
FY2012 Actual
10/6/2010 10/11/2010 11/12/2010 2/24/2011 9/2/2011 2012 Savings
10:00 AM Lock 1 Vol 1 Discount 1 Lock 2 Vol 2 Discount 2 Lock 3 Vol 3 Discount 3 Lock 4 Vol 4 Discount 4 Average vs. 2011
Oct-11 4.602 5.09 4,154 0% 4.81 4,154 5.0% 4.56 4,154 10.0% 4.30 4,154 15.0% 4.69 31%
Nov-11 4.870 5.09 5,708 0% 4.81 5,708 5.0% 4.56 5,708 10.0% 4.30 5,708 15.0% 4.69 11%
Dec-11 5.209 5.09 6,269 0% 4.81 6,269 5.0% 4.56 6,269 10.0% 4.30 6,269 15.0% 4.69 11%
Jan-12 5.379 5.09 2,281 0% 4.81 2,281 5.0% 4.56 2,281 10.0% 4.30 2,281 15.0% 4.69 11%
Feb-12 5.360 5.09 1,771 0% 4.81 1,771 5.0% 4.56 1,771 10.0% 4.30 1,771 15.0% 4.69 11%
Mar-12 5.235 5.09 6,044 0% 4.81 6,044 5.0% 4.56 6,044 10.0% 4.30 6,044 15.0% 4.69 11%
Apr-12 4.990 5.09 4,480 0% 4.81 4,480 5.0% 4.56 4,480 10.0% 4.30 4,480 15.0% 4.69 11%
May-12 4.990 5.09 3,825 0% 4.81 3,825 5.0% 4.56 3,825 10.0% 4.30 3,825 15.0% 4.69 11%
Jun-12 5.030 5.09 3,463 0% 4.81 3,463 5.0% 4.56 3,463 10.0% 4.30 3,463 15.0% 4.69 11%
Jul-12 5.080 5.09 3,329 0% 4.81 3,329 5.0% 4.56 3,329 10.0% 4.30 3,329 15.0% 4.69 11%
Aug-12 5.120 5.09 3,606 0% 4.81 3,606 5.0% 4.56 3,606 10.0% 4.30 3,606 15.0% 4.69 11%
Sep-12 5.140 5.09 3,632 0% 4.81 3,632 5.0% 4.56 3,632 10.0% 4.30 3,632 15.0% 4.69 11%
Actual 5.063 5.09 48,562 0% 4.81 48,562 5.0% 4.56 48,562 10.0% 4.30 48,562 15.0% 4.69 14%
Target 5.06 48,562 0% 4.81 48,562 5.0% 4.56 48,562 10.0% 4.30 48,562 15.0% 4.68 14%
FY2012 Note: ≈38,000 MMBtu used in Jan/Feb at the Bramhall and Brighton dual fuel acts locked on 12/1/2011 at $7.50/MMBtu.
FY2013 Actual NYMEX Settlement
12/6/2011 1/10/2012 1/10/2012 1/19/2012 11/2/2012 2013 Savings
11:50 AM Lock 1 Vol 1 Discount 1 Lock 2 Vol 2 Discount 2 Lock 3 Vol 3 Discount 3 Lock 4 Vol 4 Discount 4 Average vs. 2012
Oct-12 3.78 3.8 4,154 0% 3.8 4,154 0% 3.265 4,154 5% 3.02 4,154 10% 3.47 26%
Nov-12 3.92 3.8 5,708 0% 3.8 5,708 0% 3.265 5,708 5% 3.471 5,708 10% 3.58 24%
Dec-12 4.21 3.8 6,269 0% 3.8 6,269 0% 3.265 6,269 5% 3.77 6,269 10% 3.66 22%
Jan-13 4.34 3.8 2,281 0% 3.8 2,281 0% 3.265 2,281 5% 3.77 2,281 10% 3.66 22%
Feb-13 4.32 3.8 1,771 0% 3.8 1,771 0% 3.265 1,771 5% 3.77 1,771 10% 3.66 22%
Mar-13 4.28 3.8 6,044 0% 3.8 6,044 0% 3.265 6,044 5% 3.77 6,044 10% 3.66 22%
Apr-13 4.20 3.8 4,480 0% 3.8 4,480 0% 3.265 4,480 5% 3.77 4,480 10% 3.66 22%
May-13 4.22 3.8 3,825 0% 3.8 3,825 0% 3.265 3,825 5% 3.77 3,825 10% 3.66 22%
Jun-13 4.25 3.8 3,463 0% 3.8 3,463 0% 3.265 3,463 5% 3.77 3,463 10% 3.66 22%
Jul-13 4.29 3.8 3,329 0% 3.8 3,329 0% 3.265 3,329 5% 3.77 3,329 10% 3.66 22%
Aug-13 4.31 3.8 3,606 0% 3.8 3,606 0% 3.265 3,606 5% 3.77 3,606 10% 3.66 22%
Sep-13 4.32 3.8 3,632 0% 3.8 3,632 0% 3.265 3,632 5% 3.77 3,632 10% 3.66 22%
Actual 4.179 3.80 48,562 9% 3.80 48,562 9% 3.27 48,562 22% 3.67 48,562 12% 3.63 23%
Target 4.18 48,562 0% 4.18 48,562 0.0% 3.97 48,562 5.0% 3.76 48,562 10.0% 4.02 14%
FY2013 Note: Excludes Jan/Feb at Bramhall and Brighton. Jan/Feb FY2013 strike to be set separately at $7.50/MMBtu for both Bramhall and Brighton.
• 2012 & 2013
• 100% Hedged For
FY2013
• $200,000, 23%,
Year-Over-Year
Savings
Annual Savings $ %
2011 Savings vs 2010 $ 235,205 18%
2012 Savings vs 2011 $ 148,426 14%
2013 Savings vs 2012 $ 205,150 23%
Risk Management
Benchmarks
CES Budget
Previous contract
CES forecast based on
market knowledge
27
Maine Medical Center
NG Bid comparison to budgetBasis rates WTD AVERAGE
FY14 budget 4.242$
FY13 budget 1.555$
Metromedia Lock, 24 mo 1.852$
Basis costs TOTAL
FY14 budget cost 699,763$
FY13 budget cost 256,563$
Metromedia Lock, 24 mo 305,480$
Basis Difference from FY TOTAL
FY14 (394,283)$ under FY14 budget
FY13 48,917$ over FY13 budget
FY14 Commodity - 100% UNLOCKED WTD AVERAGE
NYMEX Futures as of 6/26/13 3.98$
Commodity Cost (w/ current NYMEX) 656,292$
TOTAL COST - FY14
Total Cost (w/ current NYMEX &
Metromedia Lock) 961,772$
Effective All-In Rate 5.83$
MaineHealth Portfolio Strategy
Evaluate aggregation
CES will chair quarterly meetings
Share best practices
Review markets
Review strategy
On-site meetings at each facility as needed
28
Risk Assessment & Strategies 29
CES will factor in system-wide goals and objectives
Overall energy initiatives (efficiency, demand side, sustainability)
Aggregated procurement
CES will examine the value of aggregating vs. individual hospital campuses
On a voluntary basis only
Individual Procurement strategies will reflect the risk tolerance specific to each entity
What is the desired outlook for budget certainty? ( e.g. 1 year outlook vs. 3 years)
To what extent does usage need to be hedged going into each fiscal year? What is the risk tolerance for open positions?
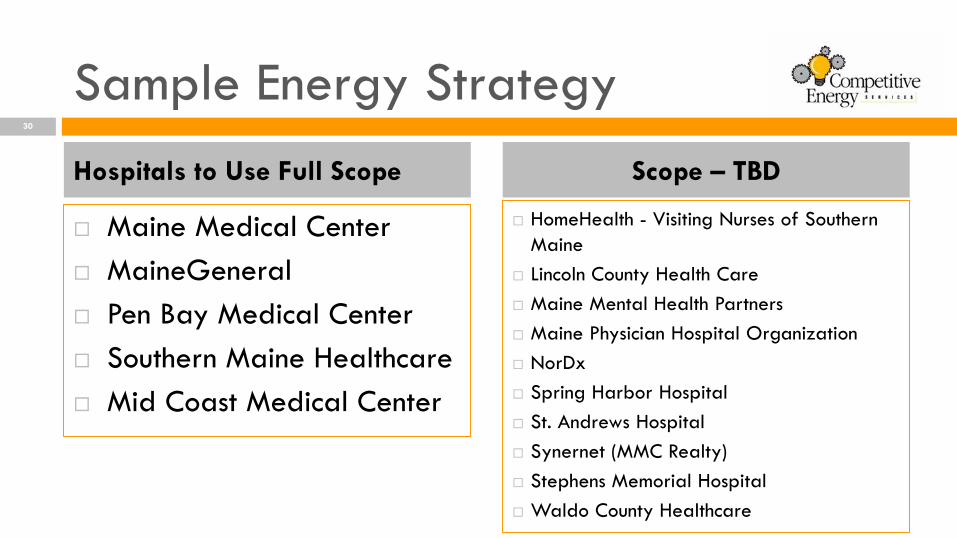
Sample Energy Strategy
Maine Medical Center
MaineGeneral
Pen Bay Medical Center
Southern Maine Healthcare
Mid Coast Medical Center
HomeHealth - Visiting Nurses of Southern
Maine
Lincoln County Health Care
Maine Mental Health Partners
Maine Physician Hospital Organization
NorDx
Spring Harbor Hospital
St. Andrews Hospital
Synernet (MMC Realty)
Stephens Memorial Hospital
Waldo County Healthcare
30
Hospitals to Use Full Scope Scope – TBD

31
Markets
Focus On Natural Gas Basis
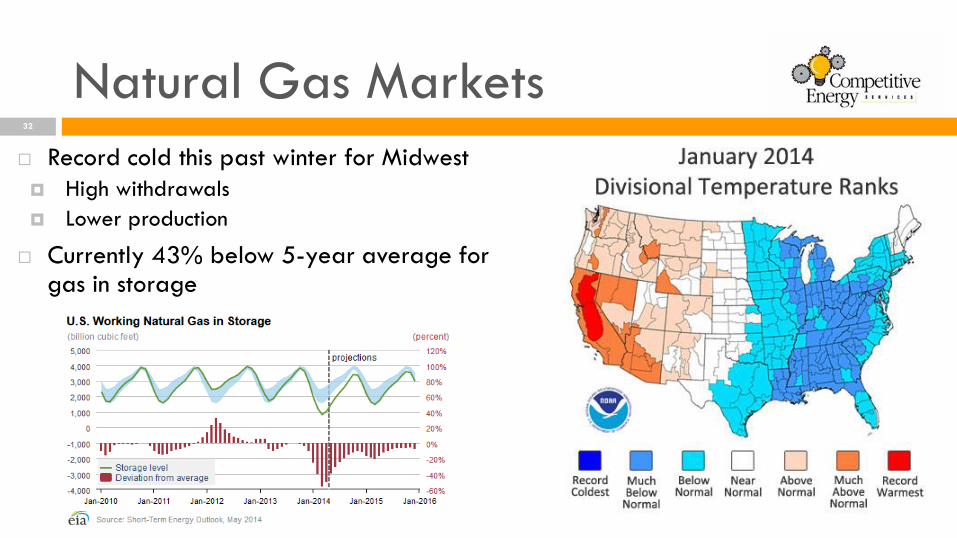
Natural Gas Markets 32
Record cold this past winter for Midwest
High withdrawals
Lower production
Currently 43% below 5-year average for gas in storage
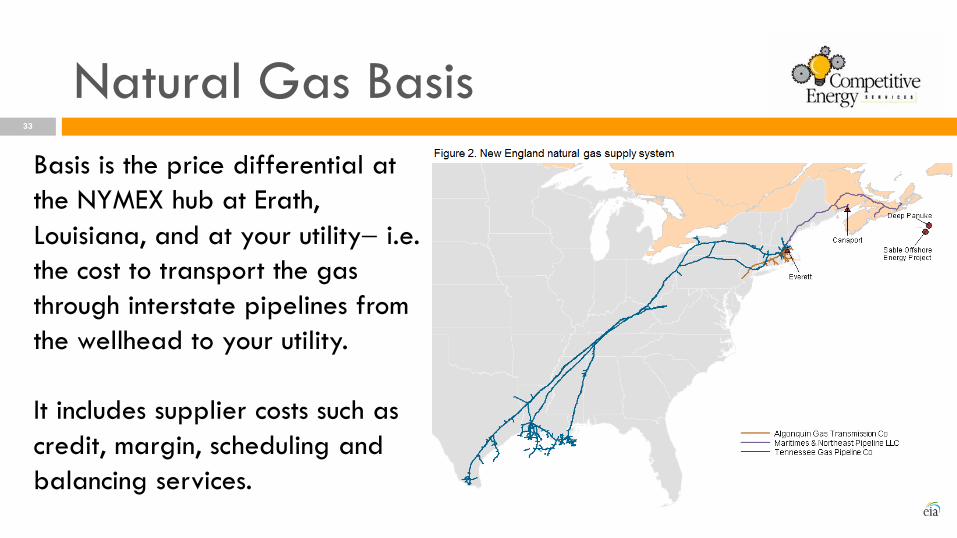
Natural Gas Basis 33
Basis is the price differential at
the NYMEX hub at Erath,
Louisiana, and at your utility i.e.
the cost to transport the gas
through interstate pipelines from
the wellhead to your utility.
It includes supplier costs such as
credit, margin, scheduling and
balancing services.
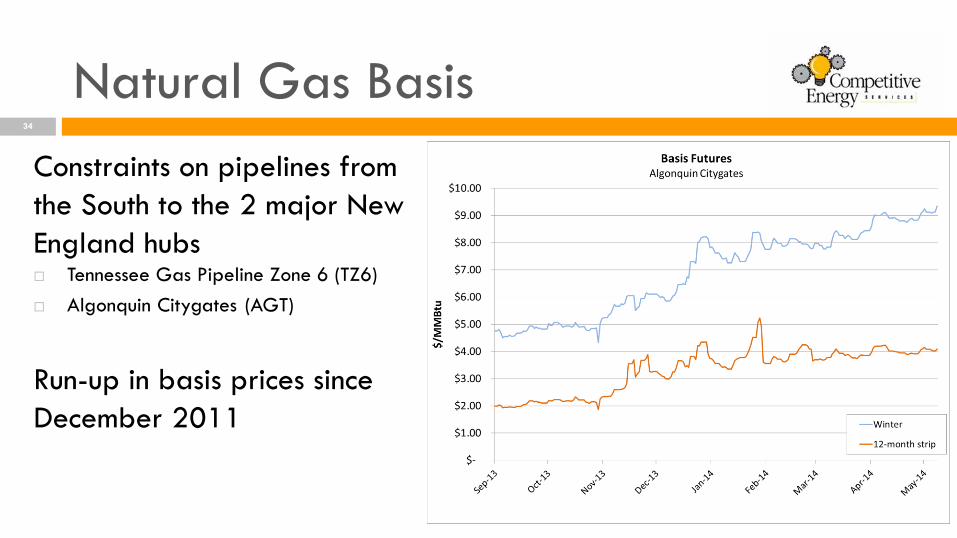
Natural Gas Basis 34
Constraints on pipelines from
the South to the 2 major New
England hubs Tennessee Gas Pipeline Zone 6 (TZ6)
Algonquin Citygates (AGT)
Run-up in basis prices since
December 2011
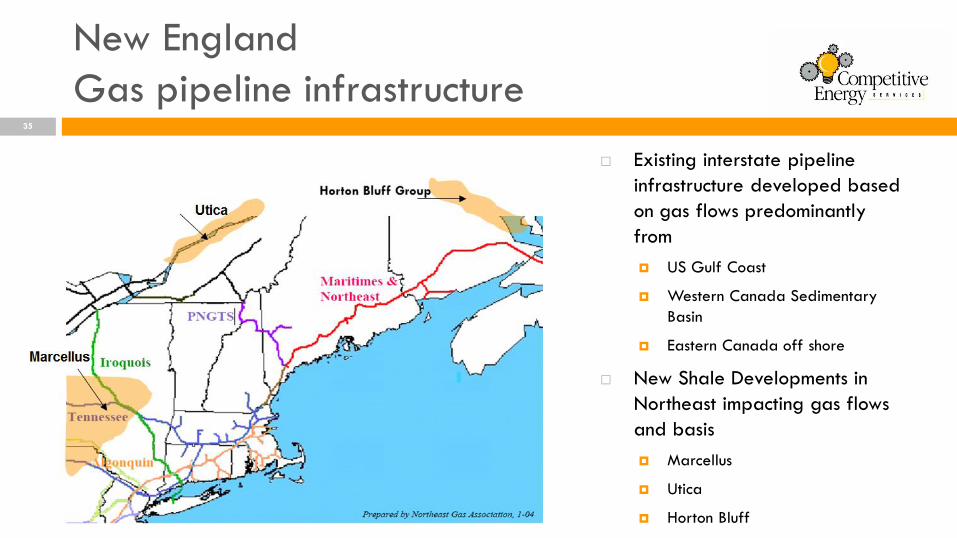
New England
Gas pipeline infrastructure
Existing interstate pipeline
infrastructure developed based
on gas flows predominantly
from
US Gulf Coast
Western Canada Sedimentary
Basin
Eastern Canada off shore
New Shale Developments in
Northeast impacting gas flows
and basis
Marcellus
Utica
Horton Bluff
35
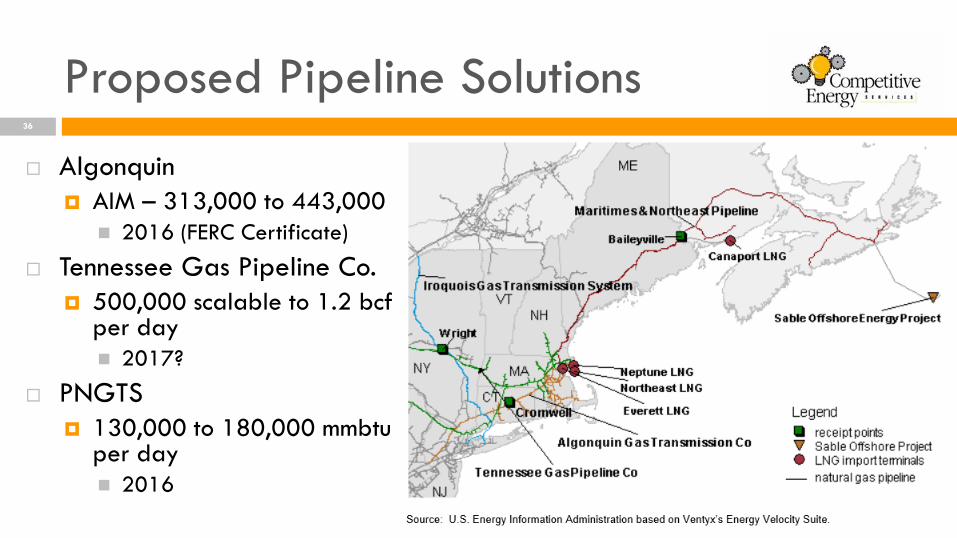
Proposed Pipeline Solutions
Algonquin
AIM – 313,000 to 443,000
2016 (FERC Certificate)
Tennessee Gas Pipeline Co.
500,000 scalable to 1.2 bcf per day
2017?
PNGTS
130,000 to 180,000 mmbtu per day
2016
36
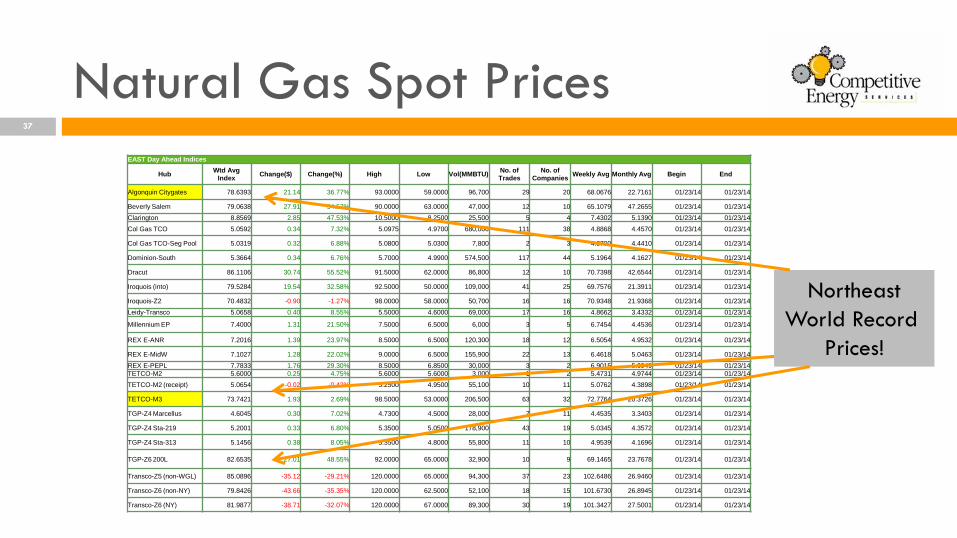
Natural Gas Spot Prices 37
EAST Day Ahead Indices
Hub Wtd Avg
Index Change($) Change(%) High Low Vol(MMBTU)
No. of Trades
No. of Companies
Weekly Avg Monthly Avg Begin End
Algonquin Citygates 78.6393 21.14 36.77% 93.0000 59.0000 96,700 29 20 68.0676 22.7161 01/23/14 01/23/14
Beverly Salem 79.0638 27.91 54.57% 90.0000 63.0000 47,000 12 10 65.1079 47.2655 01/23/14 01/23/14
Clarington 8.8569 2.85 47.53% 10.5000 8.2500 25,500 5 4 7.4302 5.1390 01/23/14 01/23/14
Col Gas TCO 5.0592 0.34 7.32% 5.0975 4.9700 680,000 111 38 4.8868 4.4570 01/23/14 01/23/14
Col Gas TCO-Seg Pool 5.0319 0.32 6.88% 5.0800 5.0300 7,800 2 3 4.8700 4.4410 01/23/14 01/23/14
Dominion-South 5.3664 0.34 6.76% 5.7000 4.9900 574,500 117 44 5.1964 4.1627 01/23/14 01/23/14
Dracut 86.1106 30.74 55.52% 91.5000 62.0000 86,800 12 10 70.7398 42.6544 01/23/14 01/23/14
Iroquois (into) 79.5284 19.54 32.58% 92.5000 50.0000 109,000 41 25 69.7576 21.3911 01/23/14 01/23/14
Iroquois-Z2 70.4832 -0.90 -1.27% 98.0000 58.0000 50,700 16 16 70.9348 21.9368 01/23/14 01/23/14
Leidy-Transco 5.0658 0.40 8.55% 5.5000 4.6000 69,000 17 16 4.8662 3.4332 01/23/14 01/23/14
Millennium EP 7.4000 1.31 21.50% 7.5000 6.5000 6,000 3 5 6.7454 4.4536 01/23/14 01/23/14
REX E-ANR 7.2016 1.39 23.97% 8.5000 6.5000 120,300 18 12 6.5054 4.9532 01/23/14 01/23/14
REX E-MidW 7.1027 1.28 22.02% 9.0000 6.5000 155,900 22 13 6.4618 5.0463 01/23/14 01/23/14
REX E-PEPL 7.7833 1.76 29.30% 8.5000 6.8500 30,000 3 2 6.9015 5.0949 01/23/14 01/23/14
TETCO-M2 5.6000 0.25 4.75% 5.6000 5.6000 3,000 1 2 5.4731 4.9744 01/23/14 01/23/14
TETCO-M2 (receipt) 5.0654 -0.02 -0.42% 5.2500 4.9500 55,100 10 11 5.0762 4.3898 01/23/14 01/23/14
TETCO-M3 73.7421 1.93 2.69% 98.5000 53.0000 206,500 63 32 72.7764 20.3726 01/23/14 01/23/14
TGP-Z4 Marcellus 4.6045 0.30 7.02% 4.7300 4.5000 28,000 7 11 4.4535 3.3403 01/23/14 01/23/14
TGP-Z4 Sta-219 5.2001 0.33 6.80% 5.3500 5.0500 178,900 43 19 5.0345 4.3572 01/23/14 01/23/14
TGP-Z4 Sta-313 5.1456 0.38 8.05% 5.3500 4.8000 55,800 11 10 4.9539 4.1696 01/23/14 01/23/14
TGP-Z6 200L 82.6535 27.01 48.55% 92.0000 65.0000 32,900 10 9 69.1465 23.7678 01/23/14 01/23/14
Transco-Z5 (non-WGL) 85.0896 -35.12 -29.21% 120.0000 65.0000 94,300 37 23 102.6486 26.9460 01/23/14 01/23/14
Transco-Z6 (non-NY) 79.8426 -43.66 -35.35% 120.0000 62.5000 52,100 18 15 101.6730 26.8945 01/23/14 01/23/14
Transco-Z6 (NY) 81.9877 -38.71 -32.07% 120.0000 67.0000 89,300 30 19 101.3427 27.5001 01/23/14 01/23/14
Northeast
World Record
Prices!
38
Natural Gas Conclusions
New shale gas discoveries and drilling techniques should keep commodity prices
low in the near and mid term
Northeast currently has inadequate infrastructure to move supply
Major projects projected to have impact ~2017
Risks include:
Increased regulation to mitigate environmental issues surrounding new fracking
techniques
Increased demand, power generation, transportation, manufacturing and LNG exports (NEPOOL – over 50 percent natural gas power gen)
Lack of Infrastructure to move gas into demand centers
39
CES Summary
CES is a full-service energy advisory firm
All energy commodities - electricity, natural gas, fuel oils, biomass, REC’s
Maine-based company with North American footprint - fast response time
Represent clients with suppliers, utilities, and governmental agencies
Sustainability, Efficiency and Grant Assistance
Customized Energy Services that have helped our clients save millions of dollars

www.competitive-energy.com | Portland, ME & Topsfield, MA
Phone 866.408.4591 | Fax 866.743.4968
Competitive Energy Services 40