cf34-engine survey
DESCRIPTION
Aircraft Engine CF34 book.TRANSCRIPT
CF34-8EFlight Operations Seminar
February 2004
GE Aircraft Engines


3
NOTES
-8EFLIGHTOPS.PPT
Flight Operations Support• Established within the GE Customer and Product Support Operation to:
– Interface with customer and airplane manufacturer flight operations– Represent their viewpoint within GE– Provide flight operations feedback to GE
• Staffed with pilots with airline, military, flight test, training, and engineering experience
• Specific tasks:– Conduct engine systems/operations briefings and seminars– Perform operations surveys– Research engine operations questions from customers and aircraft manufacturers– Issue and maintain engine operations documents:
• Specific operating instructions• Operations engineering bulletins
– Maintain selected airplane flight/operations manuals– Provide pilot support to GE Flight Test Operation– Participate in accident/incident investigations involving GE powered airplanes
Contact Information:
Walt MoellerTechnical PilotGE Aircraft Engines111 Merchant StreetCincinnati, OH 45246
Phone: (513) [email protected]


5
NOTES
-8EFLIGHTOPS.PPT
Outline
• Program Overview• Technical Features• Operational Characteristics • Testing• Normal Operating Considerations• Reduced Thrust• Erosive FOD and Volcanic Ash• Inclement Weather Operation


7
NOTES
-8E FLIGHTOPS.PPT
Program Overview

8
NOTES
-8EFLIGHTOPS.PPT
Commercial Engines
GE and CFM engines are built at the following locations:
• Lynn, Mass: Small Commercial Turboprop and Turbo Shaft
• Durham, NC: Small and Large Commercial Turbo Fans (CF34, CF6, GE90)
• Evendale, OH: Large Commercial Turbo Fans (CFM56)
• France (Snecma): Large Commercial Turbo Fans (CFM56, CF6)
CF34-1/-3/-8/-10
CT7 shaft
CT7 prop
T64
T700/CT7
T58
CFM56-2 CFM56-3
CFM56-5B
CF6-6 CF6-50 CF6-80A
CF6-80C2 CF6-80E1 GE90
Small LargeCFM56-5A
CFM56-5C CFM56-7B

9
NOTES
-8EFLIGHTOPS.PPT
CF34 Engine Family
CF34-3 CF34-8 CF34-10

10
NOTES
-8EFLIGHTOPS.PPT
CF34 Family Evolution
CF34-1A/-3A
• Reduced Noise
• Improved Materials
• Modularity
• BoroscopePorts
• Containment
• High/Hot Performance
CF34-3A1• Long Life Materials
• New Ignition System
• Serpentine Cooled First Stage Turbine
• New Low Emission Combustor
• Improved Maintainability
CF34-3B/-3B1• Hot Day Performance
• Higher Flow Compressor
• Improved Cruise SFC
• Higher Climb/Cruise Thrust
• Improved Flat Rating
TF34
USNS-3A
USAFA-10
CF34-10• Thrust Capability
to 20,000 Lbs
• Growth Capability to 22,000 lbs +
MilitaryService
CorporateService
Regional Jet andCorporate Service
CF34-8C/D/E/C5
• 50% Thrust Increase 14,500 lbs class
• Improved SFC
• Flat Rated to 86°F
• FADEC equipped
• Reduced Parts Count
1975 1982 - ’86 1991 1995 1999 - 2003 2004 EIS

11
NOTES
-8E FLIGHTOPS.PPT
CF34-8ETechnical Features
12
NOTES
-8EFLIGHTOPS.PPT
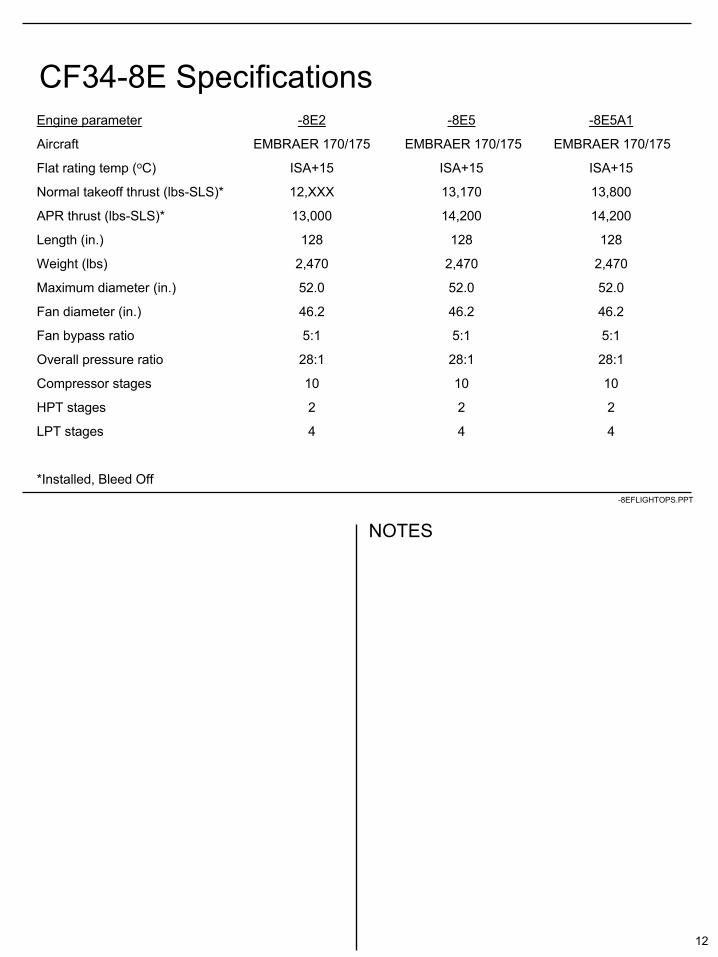
CF34-8E SpecificationsEngine parameter -8E2 -8E5 -8E5A1
Aircraft EMBRAER 170/175 EMBRAER 170/175 EMBRAER 170/175
Flat rating temp (oC) ISA+15 ISA+15 ISA+15
Normal takeoff thrust (lbs-SLS)* 12,XXX 13,170 13,800
APR thrust (lbs-SLS)* 13,000 14,200 14,200
Length (in.) 128 128 128
Weight (lbs) 2,470 2,470 2,470
Maximum diameter (in.) 52.0 52.0 52.0
Fan diameter (in.) 46.2 46.2 46.2
Fan bypass ratio 5:1 5:1 5:1
Overall pressure ratio 28:1 28:1 28:1
Compressor stages 10 10 10
HPT stages 2 2 2
LPT stages 4 4 4
*Installed, Bleed Off
13
NOTES
-8EFLIGHTOPS.PPT
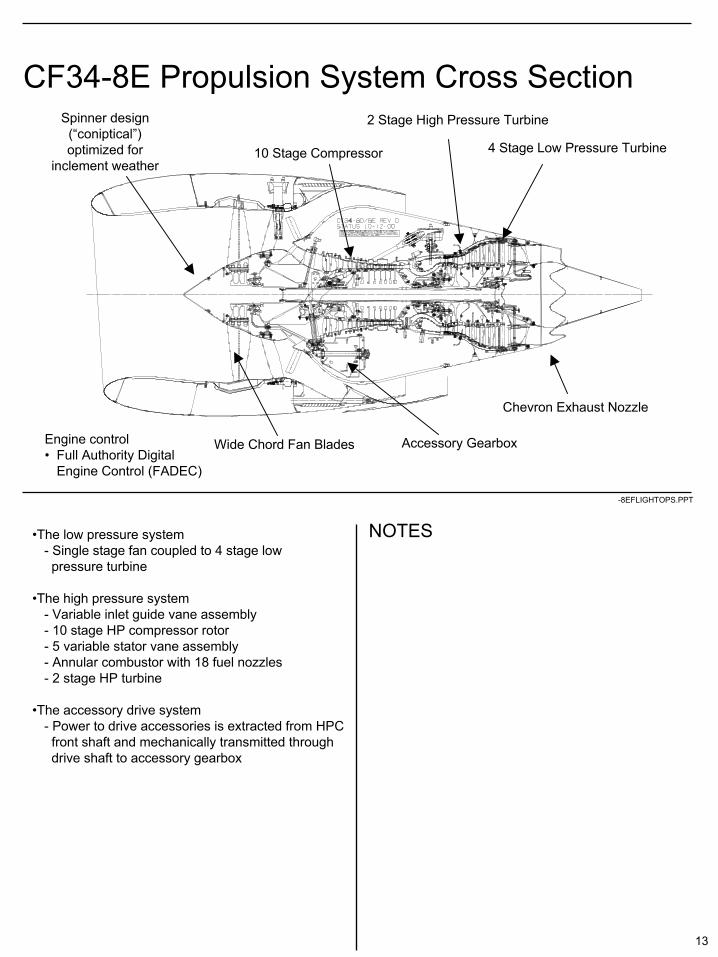
CF34-8E Propulsion System Cross Section
4 Stage Low Pressure Turbine
2 Stage High Pressure Turbine
Chevron Exhaust Nozzle
10 Stage Compressor
Accessory GearboxWide Chord Fan BladesEngine control• Full Authority Digital
Engine Control (FADEC)
Spinner design(“coniptical”)optimized for
inclement weather
•The low pressure system- Single stage fan coupled to 4 stage low pressure turbine
•The high pressure system- Variable inlet guide vane assembly- 10 stage HP compressor rotor- 5 variable stator vane assembly- Annular combustor with 18 fuel nozzles- 2 stage HP turbine
•The accessory drive system- Power to drive accessories is extracted from HPCfront shaft and mechanically transmitted through drive shaft to accessory gearbox
14
NOTES
-8EFLIGHTOPS.PPT
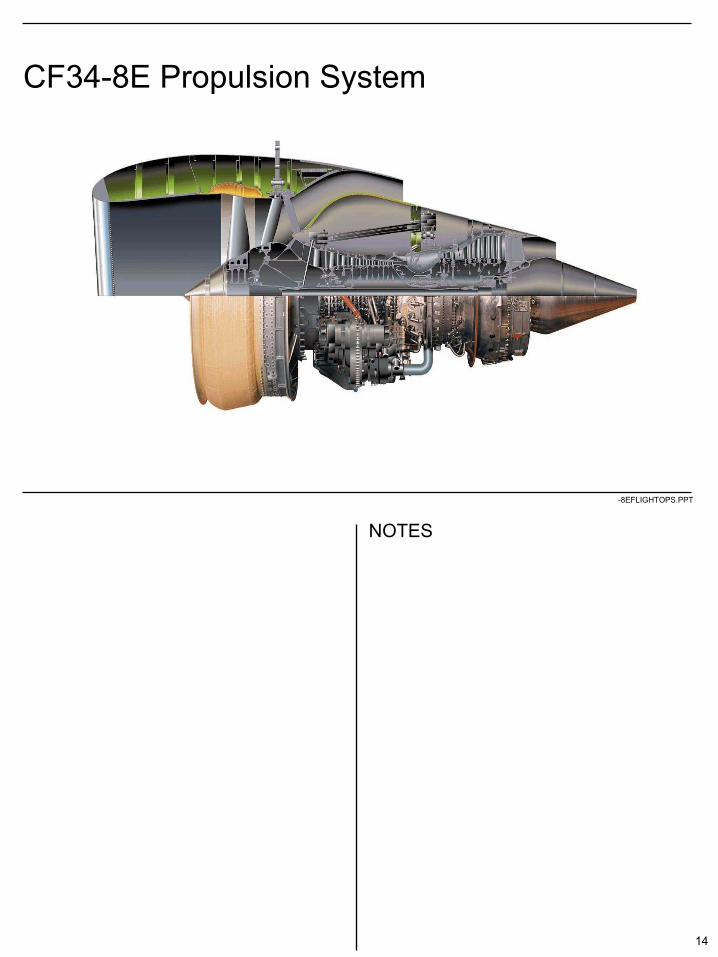
CF34-8E Propulsion System
15
NOTES
-8EFLIGHTOPS.PPT
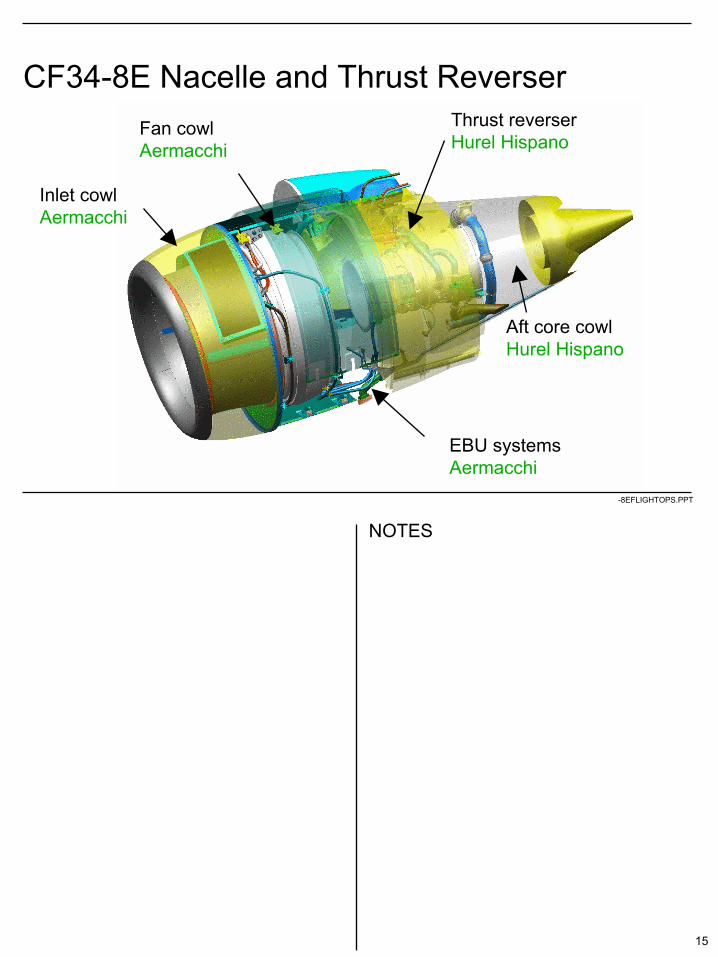
CF34-8E Nacelle and Thrust Reverser
Inlet cowl Aermacchi
Fan cowl Aermacchi
Thrust reverserHurel Hispano
Aft core cowl Hurel Hispano
EBU systems Aermacchi
16
NOTES
-8EFLIGHTOPS.PPT
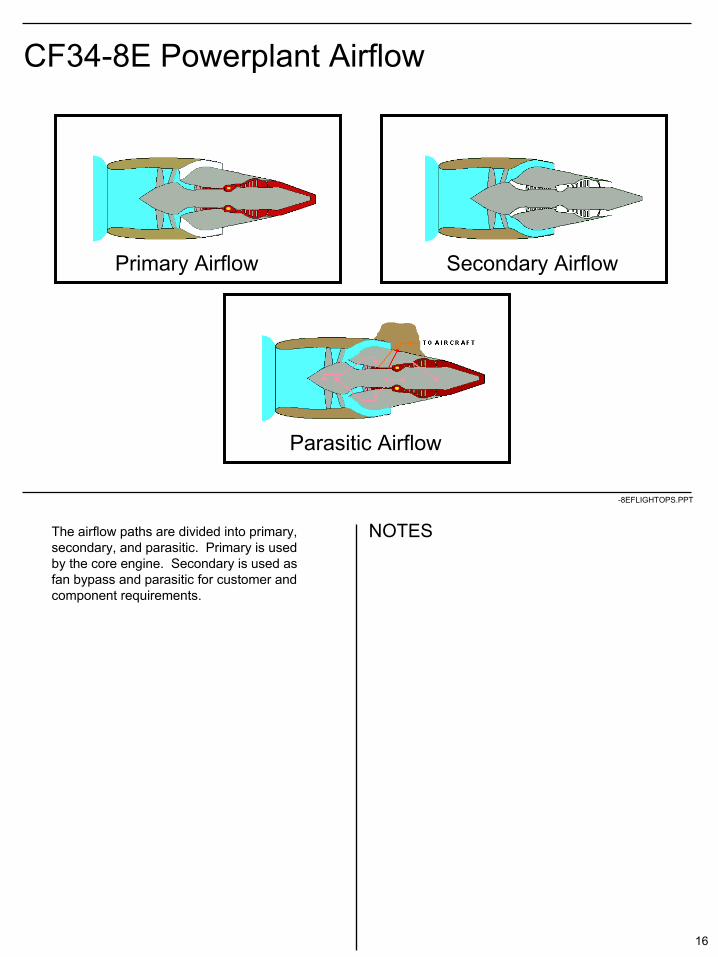
CF34-8E Powerplant Airflow
Primary Airflow Secondary Airflow
Parasitic Airflow
The airflow paths are divided into primary, secondary, and parasitic. Primary is used by the core engine. Secondary is used as fan bypass and parasitic for customer and component requirements.

17
NOTES
-8EFLIGHTOPS.PPT
CF34-8E Thrust Reverser
Innovative design of nacelle shape and transcowl deployment:
•Transcowl naturally blocks bypass duct when deployed•No need for blocker doors•Improved reverse thrust efficiency•Common left hand and right hand nacelle
Forward Thrust Reverse Thrust

18
NOTES
-8EFLIGHTOPS.PPT
CF34-8E Nacelle – Left Side Access
Operability Bleed Valve Exhaust
Inlet & Piccolo Tube Inspection Panel
FADEC & T2 Access Panel
Pressure Relief Door

19
NOTES
-8EFLIGHTOPS.PPT
CF34-8E Nacelle – Right Side Access
Inlet Anti Ice Exhaust & Piccolo Tube Inspection
Inlet & Piccolo Tube Inspection Panel
Oil Servicing Door
IDG Sight Glass Door
20
NOTES
-8EFLIGHTOPS.PPT
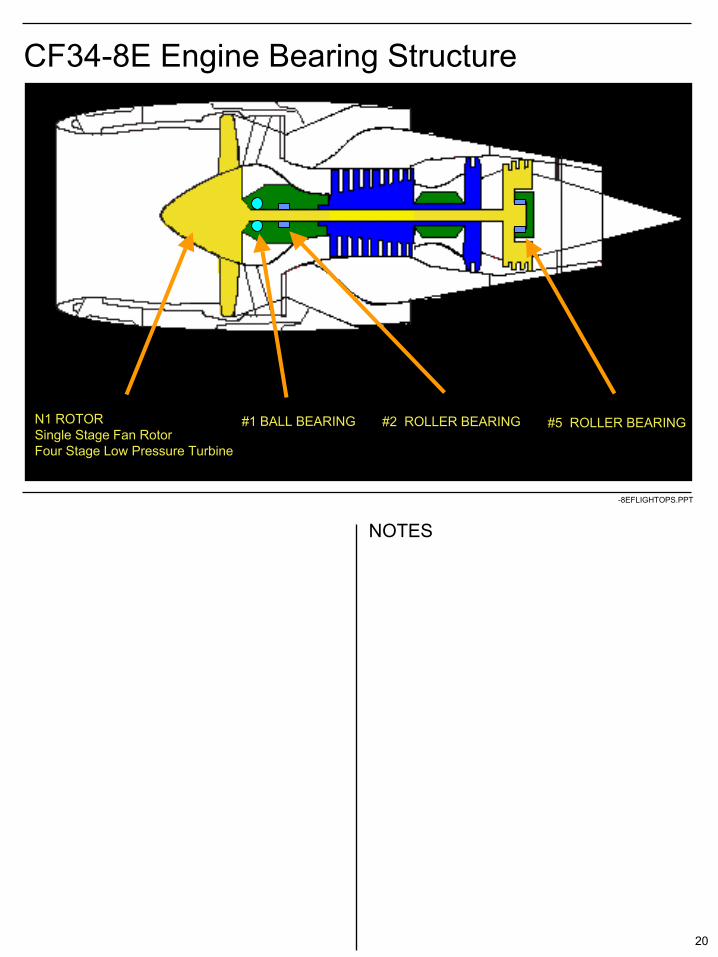
CF34-8E Engine Bearing Structure
N1 ROTORSingle Stage Fan RotorFour Stage Low Pressure Turbine
#1 BALL BEARING #2 ROLLER BEARING #5 ROLLER BEARING
21
NOTES
-8EFLIGHTOPS.PPT
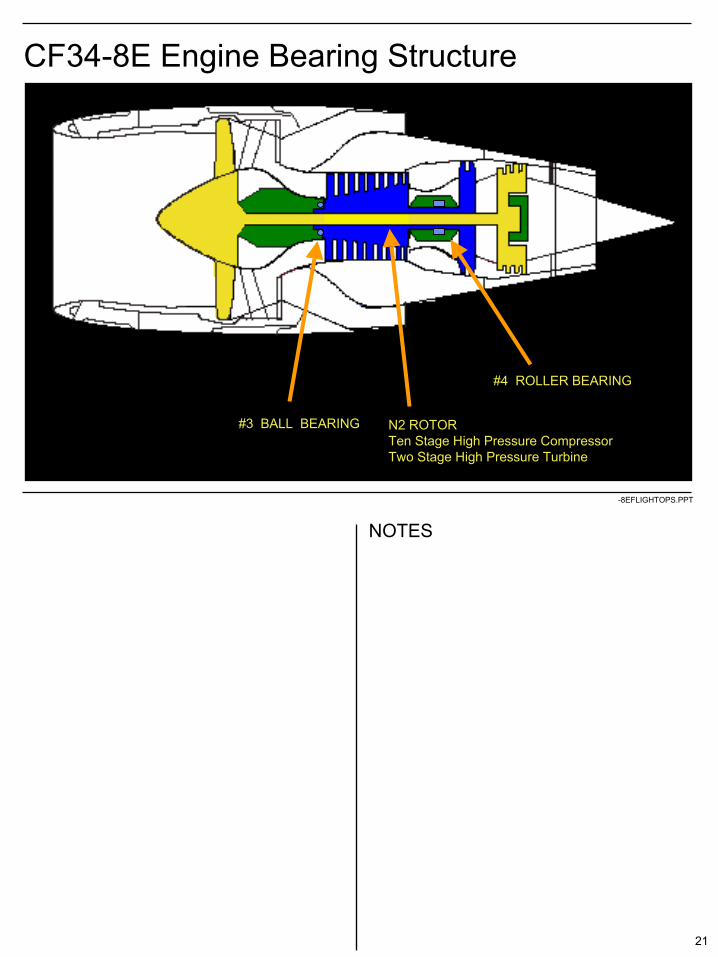
CF34-8E Engine Bearing Structure
N2 ROTORTen Stage High Pressure CompressorTwo Stage High Pressure Turbine
#3 BALL BEARING
#4 ROLLER BEARING

22
NOTES
-8EFLIGHTOPS.PPT
CF34-8E Engine Sump Structure
A SumpLocated in Compressor Front Frame
B SumpLocated in Combustion Chamber Frame
C SumpLocated in Exhaust Frame

23
NOTES
-8EFLIGHTOPS.PPT
CF34-8E Engine Aerodynamic Stations
T2 FAN INLET TEMPERATURE
P3 COMPRESSOR DISCHARGE PRESSURE
T4.5 INTER TURBINE TEMPERATURE
24
NOTES
-8EFLIGHTOPS.PPT
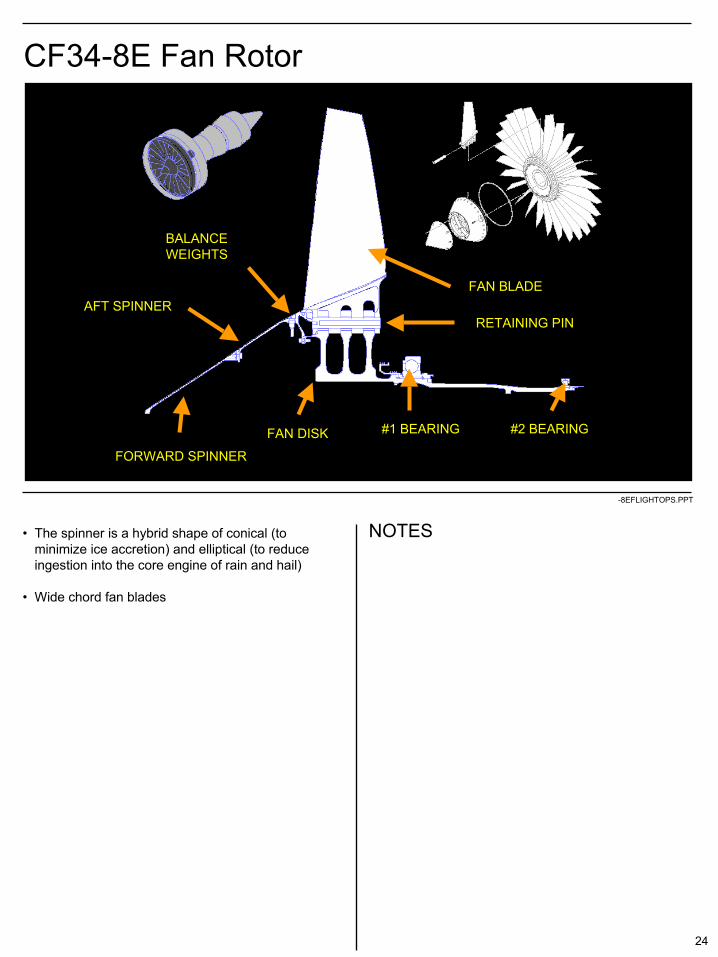
CF34-8E Fan Rotor
• The spinner is a hybrid shape of conical (to minimize ice accretion) and elliptical (to reduce ingestion into the core engine of rain and hail)
• Wide chord fan blades
FORWARD SPINNER
AFT SPINNER
FAN DISK
BALANCEWEIGHTS
#1 BEARING #2 BEARING
FAN BLADE
RETAINING PIN

25
NOTES
-8EFLIGHTOPS.PPT
CF34-8E Fan Stator
• The fan case is lined with acoustic panels for noise reduction
• The fan case also serves as a blade containment system
FAN CONTAINMENT CASE
OUTLET GUIDE VANE
TIE ROD
COMPRESSOR FRONT FRAME
#1 BEARING#2 BEARING
FAN SPEEDSENSOR
26
NOTES
-8EFLIGHTOPS.PPT
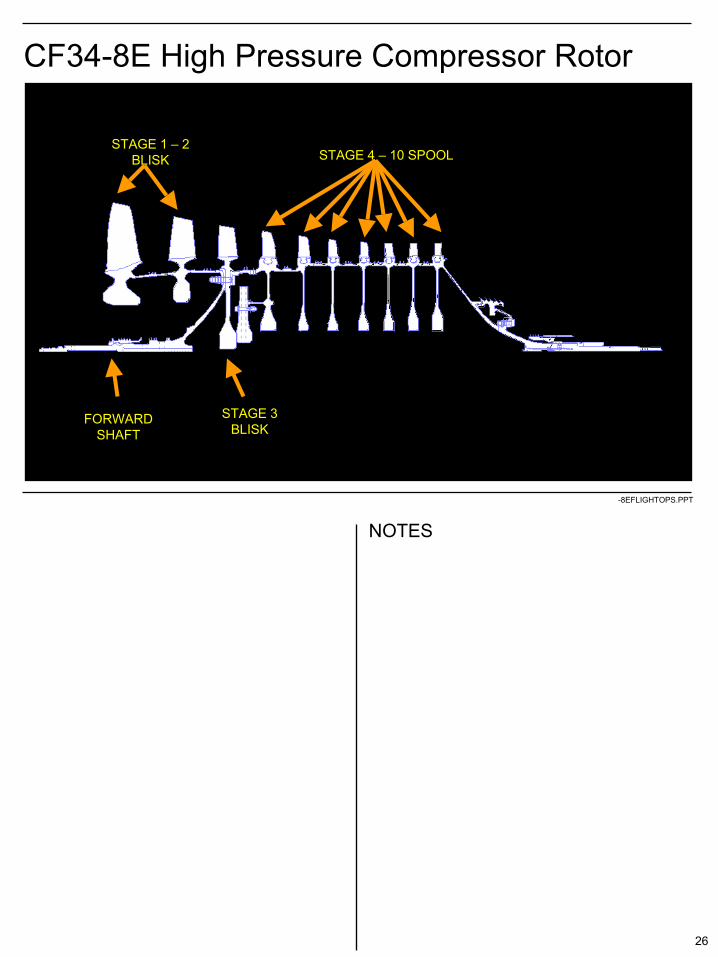
CF34-8E High Pressure Compressor Rotor
STAGE 1 – 2BLISK STAGE 4 – 10 SPOOL
FORWARDSHAFT
STAGE 3BLISK

27
NOTES
-8EFLIGHTOPS.PPT
CF34-8E High Pressure Compressor Stator
• The variable inlet guide vanes and four variable stator vane stages serve to match airflow of the forward and aft compressor stages
• The variable IGVs and VSVs are controlled by the FADEC
• At low N2 speeds they are closed and move toward the open position with increasing N2 speed
• Malfunctioning or off schedule VSVs can cause stalls or slow acceleration
• Fourth stage compressor air is extracted for sump pressurization
• Sixth stage is extracted for air conditioning, nacelle anti-ice, wing anti-ice
• Tenth stage is used for air conditioning, nacelle anti-ice and wing anti-ice
VARIABLE GEOMETRY VANES FIXED STATOR VANESINLET GUIDE VANES
STAGE 4BLEED MANIFOLD
STAGE 6BLEED MANIFOLD
VARIABLE GEOMETRYACTUATING ARMS
28
NOTES
-8EFLIGHTOPS.PPT
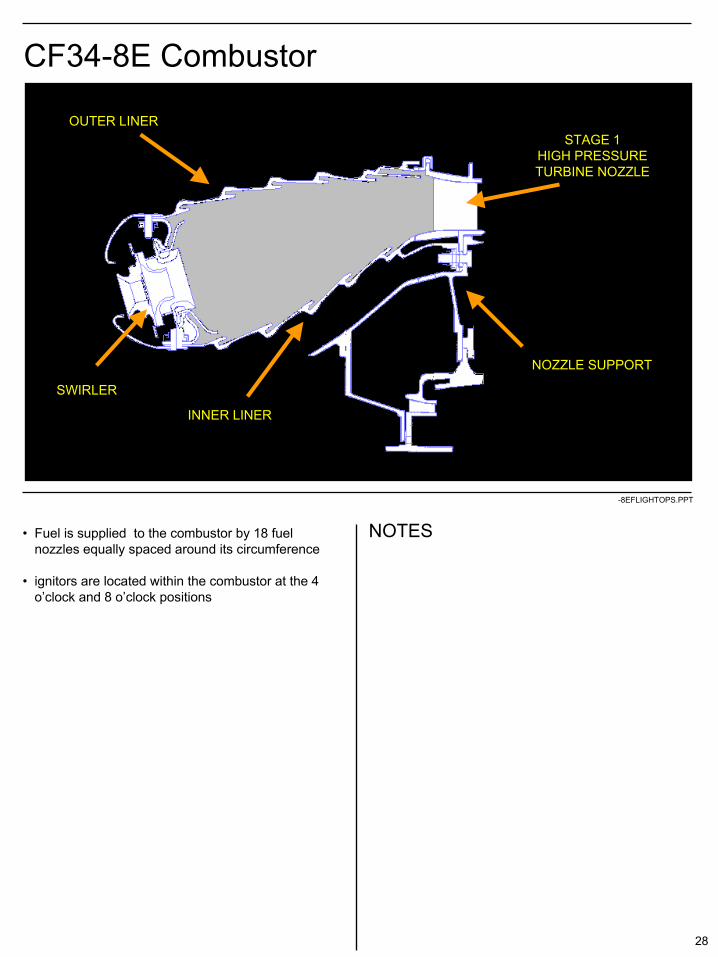
CF34-8E Combustor
INNER LINER
NOZZLE SUPPORT
SWIRLER
STAGE 1HIGH PRESSURETURBINE NOZZLE
OUTER LINER
• Fuel is supplied to the combustor by 18 fuel nozzles equally spaced around its circumference
• ignitors are located within the combustor at the 4 o’clock and 8 o’clock positions
29
NOTES
-8EFLIGHTOPS.PPT
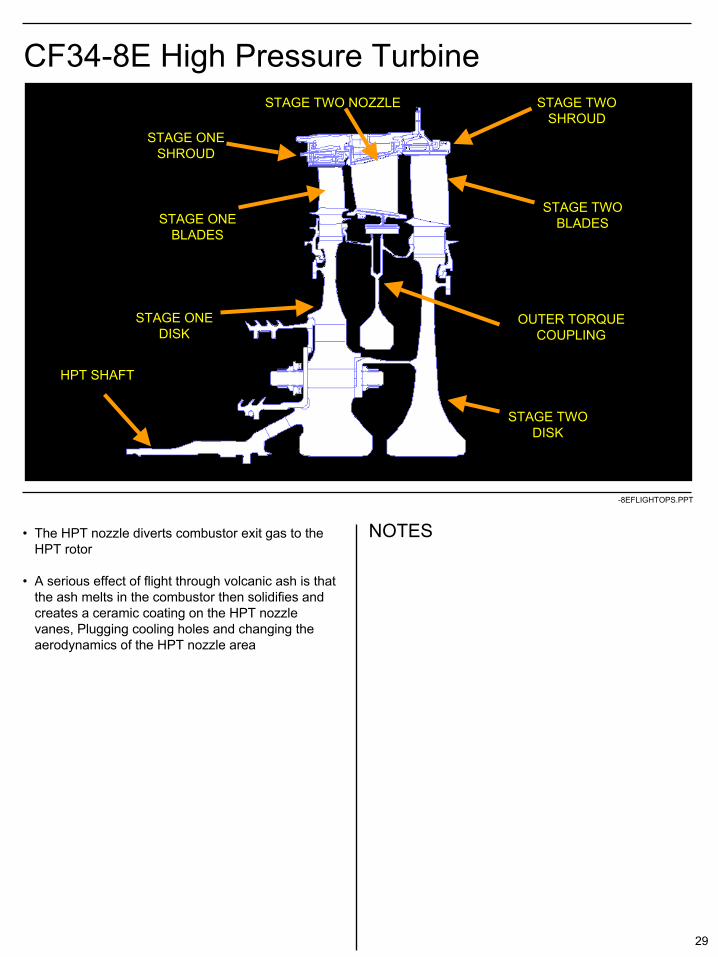
CF34-8E High Pressure Turbine
STAGE ONEDISK
STAGE ONEBLADES
STAGE TWODISK
OUTER TORQUECOUPLING
STAGE TWOBLADES
STAGE ONESHROUD
STAGE TWOSHROUD
STAGE TWO NOZZLE
• The HPT nozzle diverts combustor exit gas to the HPT rotor
• A serious effect of flight through volcanic ash is that the ash melts in the combustor then solidifies and creates a ceramic coating on the HPT nozzle vanes, Plugging cooling holes and changing the aerodynamics of the HPT nozzle area
HPT SHAFT
30
NOTES
-8EFLIGHTOPS.PPT
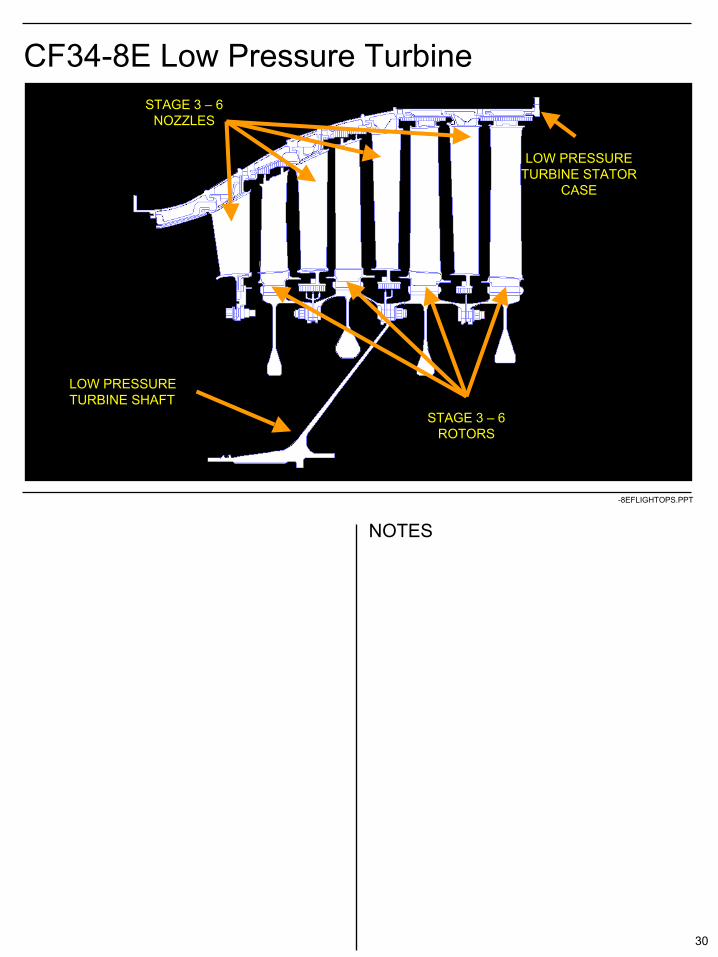
CF34-8E Low Pressure Turbine
STAGE 3 – 6ROTORS
LOW PRESSURETURBINE SHAFT
LOW PRESSURETURBINE STATOR
CASE
STAGE 3 – 6NOZZLES
31
NOTES
-8EFLIGHTOPS.PPT
CF34-8E Accessory Gearbox
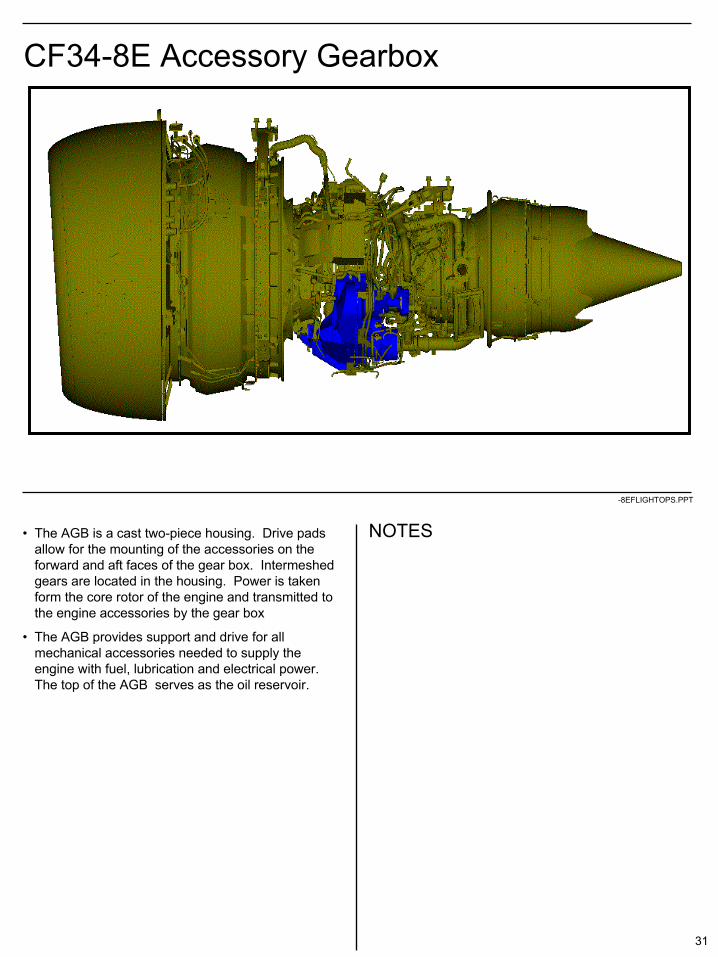
• The AGB is a cast two-piece housing. Drive pads allow for the mounting of the accessories on the forward and aft faces of the gear box. Intermeshed gears are located in the housing. Power is taken form the core rotor of the engine and transmitted to the engine accessories by the gear box
• The AGB provides support and drive for all mechanical accessories needed to supply the engine with fuel, lubrication and electrical power. The top of the AGB serves as the oil reservoir.

32
NOTES
-8EFLIGHTOPS.PPT
CF34-8E Accessory Gearbox – Aft View
Starter Air Valve
Integrated Drive Generator (IDG)
Fuel pump
Starter
PMAOil Reservoir

33
NOTES
-8EFLIGHTOPS.PPT
CF34-8E Accessory Gearbox – Forward View
Hydraulic Pump
Lube and Scavange Pump
Oil Filter
Chip Detector
Oil Pressure Switch
34
NOTES
-8EFLIGHTOPS.PPT
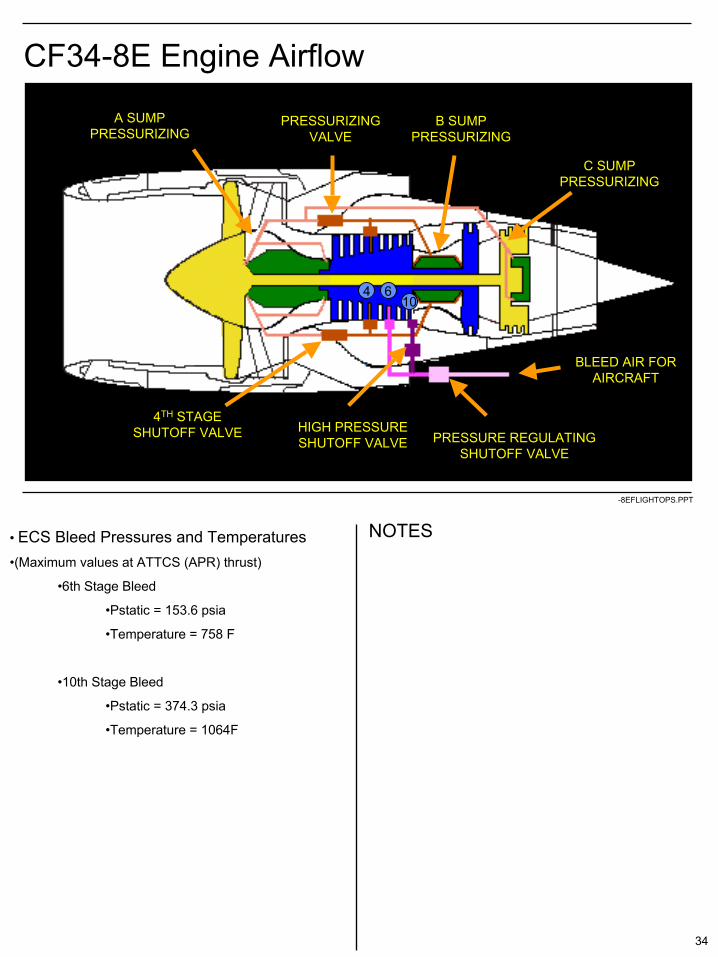
CF34-8E Engine Airflow
BLEED AIR FORAIRCRAFT
PRESSURIZINGVALVE
4TH STAGESHUTOFF VALVE
A SUMPPRESSURIZING
B SUMPPRESSURIZING
C SUMPPRESSURIZING
4 610
HIGH PRESSURESHUTOFF VALVE PRESSURE REGULATING
SHUTOFF VALVE
• ECS Bleed Pressures and Temperatures•(Maximum values at ATTCS (APR) thrust)
•6th Stage Bleed
•Pstatic = 153.6 psia
•Temperature = 758 F
•10th Stage Bleed
•Pstatic = 374.3 psia
•Temperature = 1064F

35
NOTES
-8EFLIGHTOPS.PPT
CF34-8E FADEC
• Full Authority Digital Engine Control– No mechanical connection cockpit to engine– Analogous to “fly by wire” aircraft control system
• Consists of– Dedicated alternator and power supplies– Sensors for control, monitoring and feedback– Cables and connectors
• More than just fuel control functions– Start– Ignition– Variable geometry (VSV’s)– Reverse thrust– Fault detection
FADEC is Full Authority Digital Engine Control. It is the name given to the most recent generation of electronic engine controls currently installed on a variety of high-bypass turbofan engines. FADEC systems are more responsive, more precise, and provide more capability than the older mechanical controls. They also integrate with the aircraft on-board electronic operating and maintenance systems to a much higher degree. The FADEC enhanced engine is not only more powerful and efficient than its mechanically controlled counterpart, it is simpler to operate, and easier to maintain.

36
NOTES
-8EFLIGHTOPS.PPT
FADEC Control System
• Improved operational characteristics– Reduced ITT thermal overshoot– Full flight regime thrust management– Uniform engine response times– Automated starting– Built-in thrust ratings– Idle speed control for aircraft bleed requirements
• Improved aircraft - engine integration– Auto-thrust system features and compatibility– Less hysteresis– Digital aircraft interface– Better informed cockpit
37
NOTES
-8EFLIGHTOPS.PPT
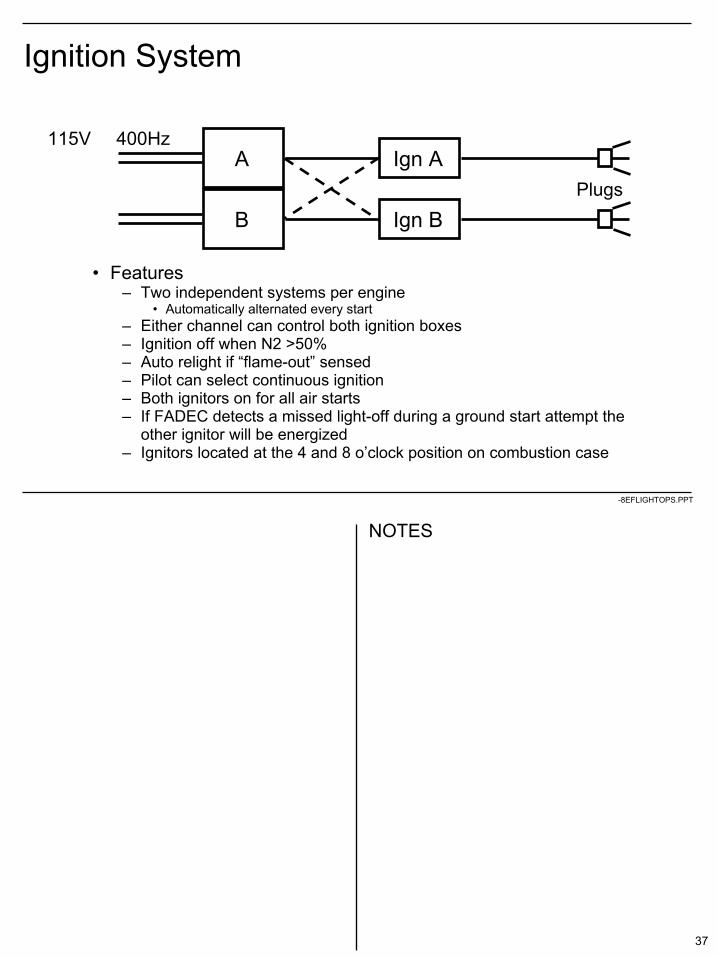
Ignition System
• Features– Two independent systems per engine
• Automatically alternated every start– Either channel can control both ignition boxes– Ignition off when N2 >50%– Auto relight if “flame-out” sensed– Pilot can select continuous ignition– Both ignitors on for all air starts– If FADEC detects a missed light-off during a ground start attempt the
other ignitor will be energized– Ignitors located at the 4 and 8 o’clock position on combustion case
A Ign APlugs
400Hz115V
B Ign B
38
NOTES
-8EFLIGHTOPS.PPT
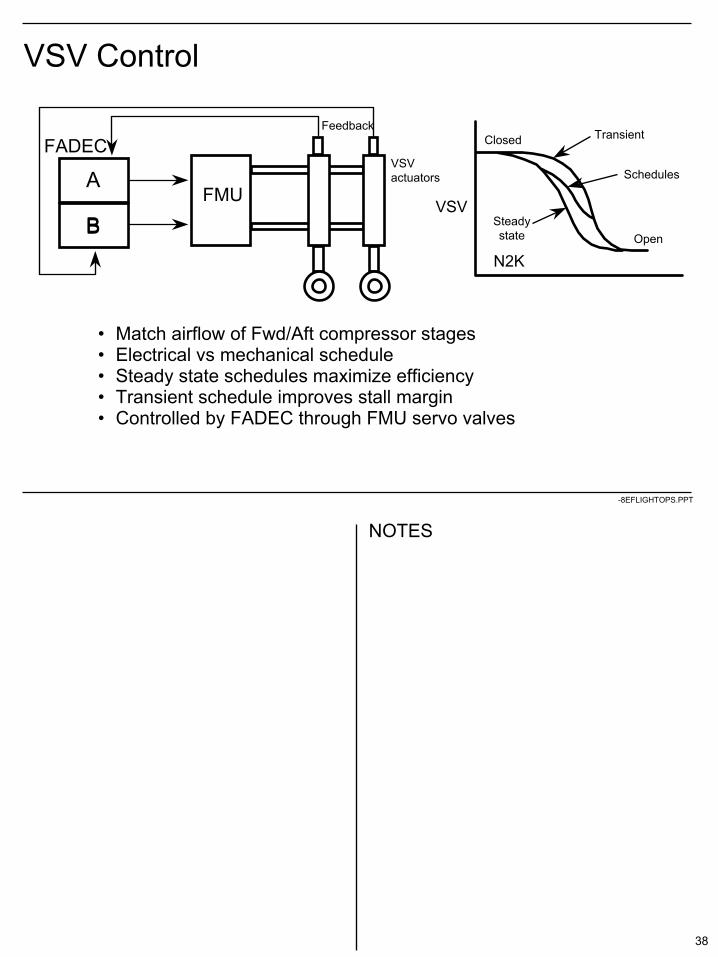
VSV Control
• Match airflow of Fwd/Aft compressor stages• Electrical vs mechanical schedule• Steady state schedules maximize efficiency• Transient schedule improves stall margin• Controlled by FADEC through FMU servo valves
A
BFMU
FADEC
B
Feedback
VSVactuators
VSV
Closed
N2K
Transient
Schedules
Steadystate Open

39
NOTES
-8EFLIGHTOPS.PPT
CF34-8E Fuel System
• Fuel supplied by the aircraft fuel tank(s) flows to the centrifugal boost stage of the fuel pump. Upon exiting, the flow divides into two paths. One flow passes through the secondary high-pressure gear stage of the pump and then goes back to the aircraft as motive flow.
• The second flow exits the pump, passes through the fuel/oil heat exchanger and then flows to the FMU where it enters the fuel filter.
• Once filtered, the flow leaves the FMU and returns to the fuel pump where it enters the primary high-pressure gear stage.
• The flow leaves the pump and returns to the FMU. The FMU, using commands from the FADEC, meters flow to the fuel injectors through the manifold. The 18 fuel injectors deliver atomized fuel into the combustion chamber, where it mixes with compressor discharge air and is burned.
• The fuel pump provides the controlling fuel flow to operate the OBV based on commands from the FADEC
40
NOTES
-8EFLIGHTOPS.PPT
CF34-8E Lube System Schematic
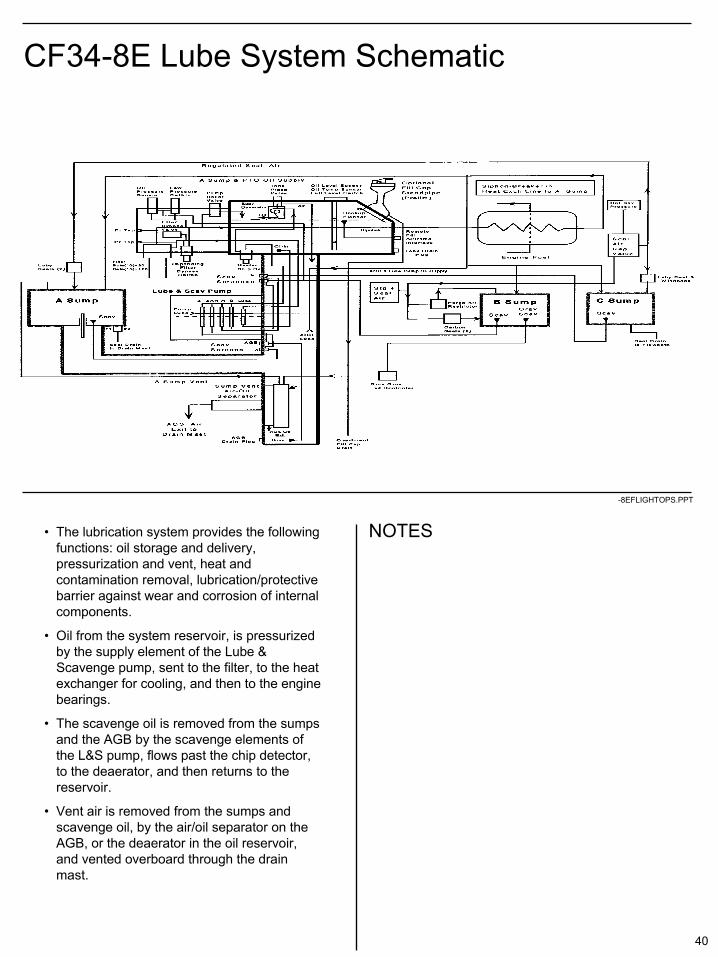
• The lubrication system provides the following functions: oil storage and delivery, pressurization and vent, heat and contamination removal, lubrication/protective barrier against wear and corrosion of internal components.
• Oil from the system reservoir, is pressurized by the supply element of the Lube & Scavenge pump, sent to the filter, to the heat exchanger for cooling, and then to the engine bearings.
• The scavenge oil is removed from the sumps and the AGB by the scavenge elements of the L&S pump, flows past the chip detector, to the deaerator, and then returns to the reservoir.
• Vent air is removed from the sumps and scavenge oil, by the air/oil separator on the AGB, or the deaerator in the oil reservoir, and vented overboard through the drain mast.

41
NOTES
-8E FLIGHTOPS.PPT
CF34-8EOperational Characteristics
42
NOTES
-8EFLIGHTOPS.PPT
Ratings
Transients
Operating Limits
Exceedances
43
NOTES
-8EFLIGHTOPS.PPT
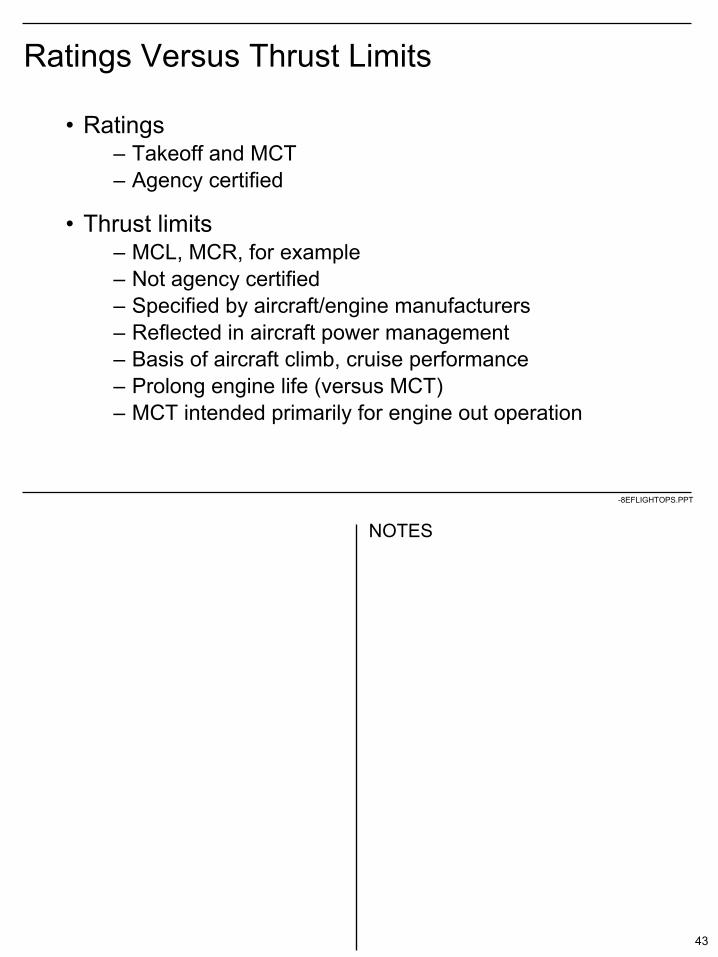
Ratings Versus Thrust Limits
• Ratings– Takeoff and MCT– Agency certified
• Thrust limits– MCL, MCR, for example– Not agency certified– Specified by aircraft/engine manufacturers– Reflected in aircraft power management– Basis of aircraft climb, cruise performance– Prolong engine life (versus MCT)– MCT intended primarily for engine out operation
44
NOTES
-8EFLIGHTOPS.PPT
Flat Rate Concept• All GE/CFMI engines• Power managed for
– Constant thrust independent of ambient temperature up to “flat rate” temperature
– Decreased thrust above flat rate temperature to maintain a constant ITT
– Flat rate temperature defined as ISA +∆T (for example ISA + 15oC)
• N1 schedule reflected in– Thrust Rating Computer (TRC), Flight Management
System (FMS)– Graphic or tabulated data in operations publications
45
NOTES
-8EFLIGHTOPS.PPT
Engine Parameters at Takeoff Thrust
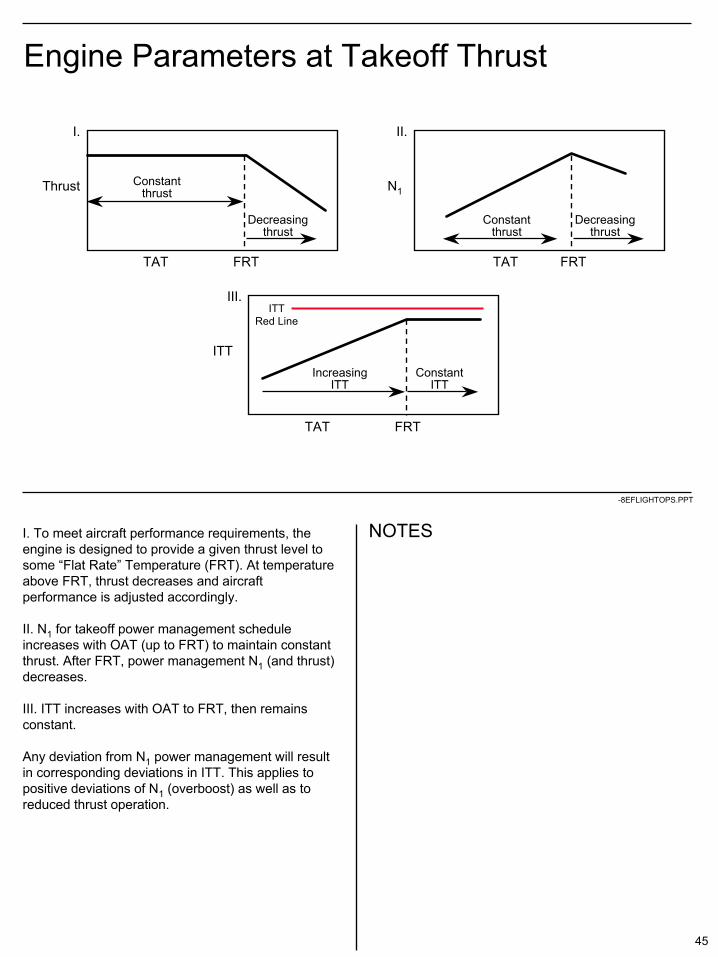
I. To meet aircraft performance requirements, the engine is designed to provide a given thrust level to some “Flat Rate” Temperature (FRT). At temperature above FRT, thrust decreases and aircraft performance is adjusted accordingly.
II. N1 for takeoff power management schedule increases with OAT (up to FRT) to maintain constant thrust. After FRT, power management N1 (and thrust) decreases.
III. ITT increases with OAT to FRT, then remains constant.
Any deviation from N1 power management will result in corresponding deviations in ITT. This applies to positive deviations of N1 (overboost) as well as to reduced thrust operation.
Thrust
TAT FRT
Decreasingthrust
Constantthrust
I.
N1
TAT FRT
Decreasingthrust
Constantthrust
II.
ITT
TAT FRT
ConstantITT
IncreasingITT
III.ITT
Red Line
46
NOTES
-8EFLIGHTOPS.PPT
Altitude Variation
Thrust
FRTOAT
SL
Increasingaltitude
N1
FRTOAT
SL
Increasingaltitude
ITT
FRTOATSL
Increasingaltitude
47
NOTES
-8EFLIGHTOPS.PPT
Typical FADEC Transient Characteristics
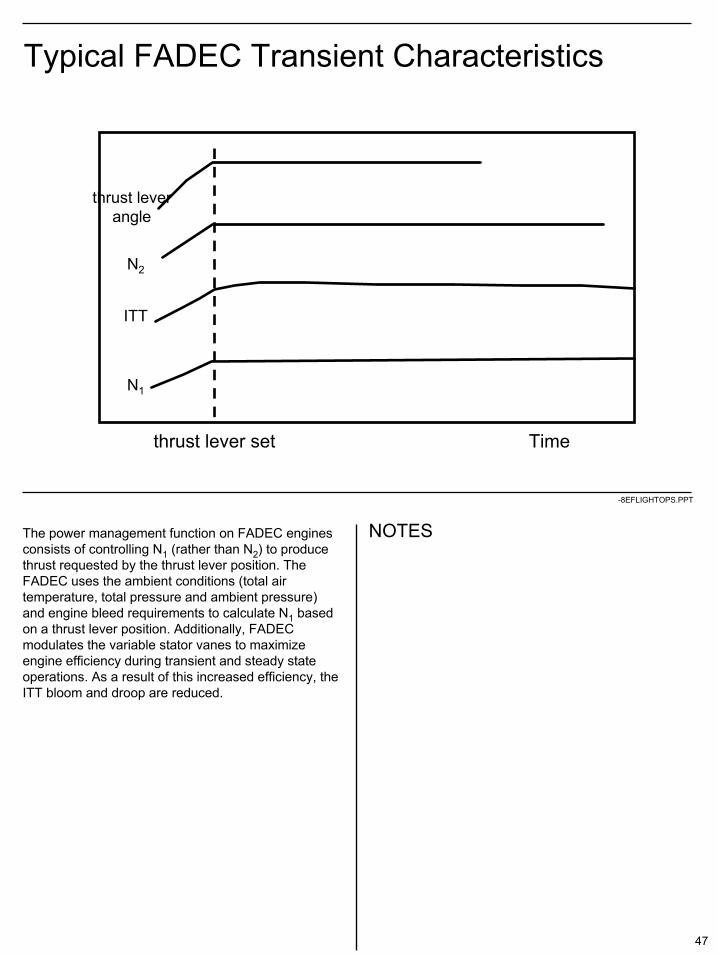
The power management function on FADEC engines consists of controlling N1 (rather than N2) to produce thrust requested by the thrust lever position. The FADEC uses the ambient conditions (total air temperature, total pressure and ambient pressure) and engine bleed requirements to calculate N1 based on a thrust lever position. Additionally, FADEC modulates the variable stator vanes to maximize engine efficiency during transient and steady state operations. As a result of this increased efficiency, the ITT bloom and droop are reduced.
thrust leverangle
N2
ITT
N1
thrust lever set Time
48
NOTES
-8EFLIGHTOPS.PPT
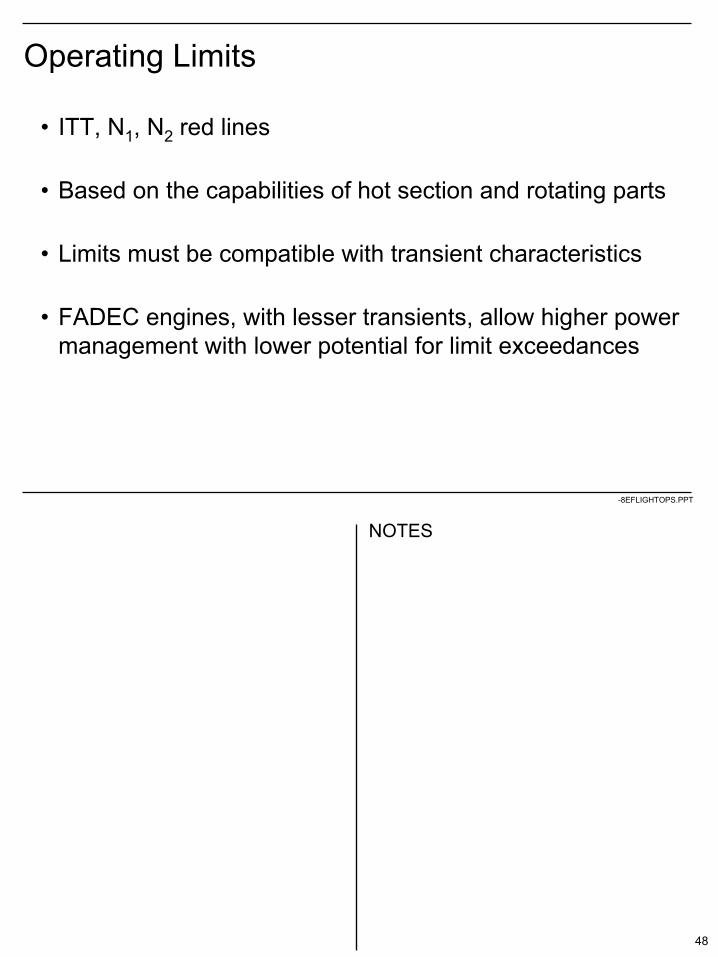
Operating Limits
• ITT, N1, N2 red lines
• Based on the capabilities of hot section and rotating parts
• Limits must be compatible with transient characteristics
• FADEC engines, with lesser transients, allow higher power management with lower potential for limit exceedances
49
NOTES
-8EFLIGHTOPS.PPT
ITT Margin
ITT
TAT FRT
ITT Redline
Margin
OATL
Deterioration
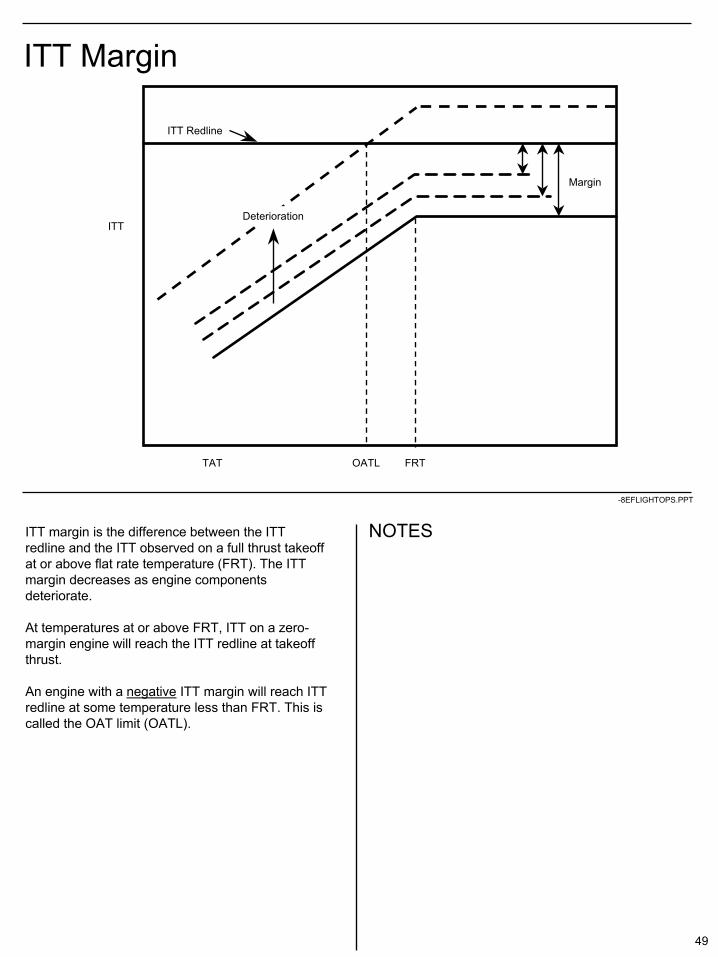
ITT margin is the difference between the ITT redline and the ITT observed on a full thrust takeoff at or above flat rate temperature (FRT). The ITT margin decreases as engine components deteriorate.
At temperatures at or above FRT, ITT on a zero-margin engine will reach the ITT redline at takeoff thrust.
An engine with a negative ITT margin will reach ITT redline at some temperature less than FRT. This is called the OAT limit (OATL).

50
NOTES
-8EFLIGHTOPS.PPT
Contributors to ITT Exceedances
• Engine deterioration
• Engine hardware damage
• Bleed air leak
• Inappropriate selection of bleed air based on the thrust configuration
51
NOTES
-8EFLIGHTOPS.PPT
Effect of Temperature Inversion at Takeoff
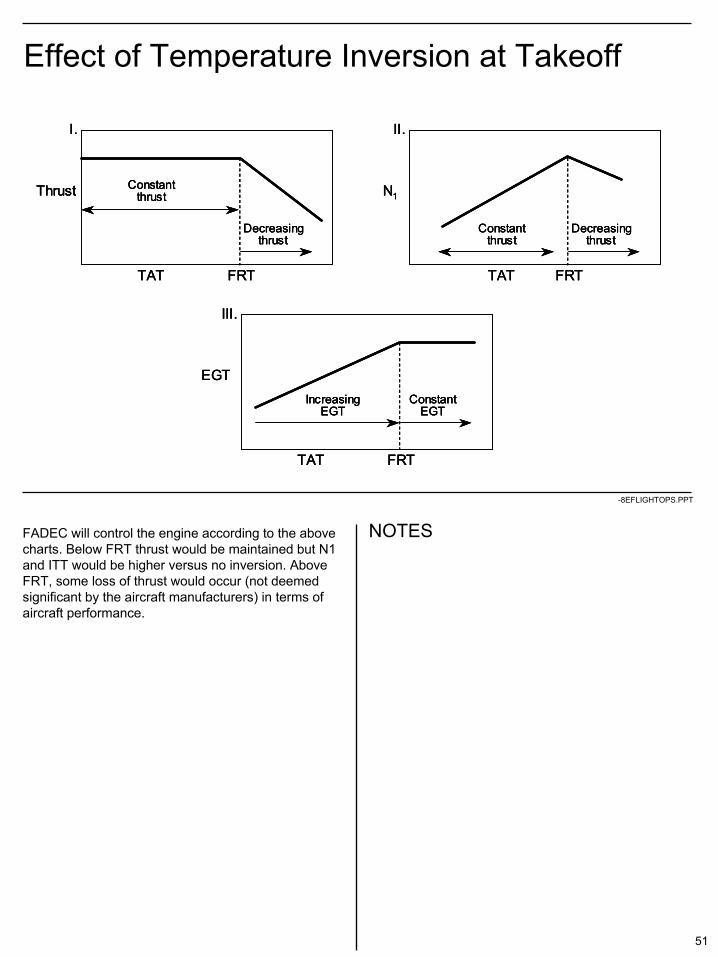
FADEC will control the engine according to the above charts. Below FRT thrust would be maintained but N1 and ITT would be higher versus no inversion. Above FRT, some loss of thrust would occur (not deemed significant by the aircraft manufacturers) in terms of aircraft performance.
Thrust
TAT FRT
Decreasingthrust
Constantthrust
I.
N1
TAT FRT
Decreasingthrust
Constantthrust
II.
EGT
TAT FRT
ConstantEGT
IncreasingEGT
III.
Thrust
TAT FRT
Decreasingthrust
Constantthrust
I.
Thrust
TAT FRT
Decreasingthrust
Constantthrust
I.
N1
TAT FRT
Decreasingthrust
Constantthrust
II.
N1
TAT FRT
Decreasingthrust
Constantthrust
II.
EGT
TAT FRT
ConstantEGT
IncreasingEGT
III.
EGT
TAT FRT
ConstantEGT
IncreasingEGT
III.


53
NOTES
-8EFLIGHTOPS.PPT
Testing

54
NOTES
-8EFLIGHTOPS.PPT
Overview
• A variety of development and certification tests are conducted on GE/CFMI engines. Ground testing is primarily accomplished by GEAE’s Peebles Test Operation in Peebles, Ohio and by comparable SNECMA facilities in France. Flight testing is accomplished by GEAE’s Flight Test Operation in Mojave, California.
This presentation summarizes some of these tests and test facilities used.

55
NOTES
-8EFLIGHTOPS.PPT
GE Peebles Outdoor Test Facility
56
NOTES
-8EFLIGHTOPS.PPT
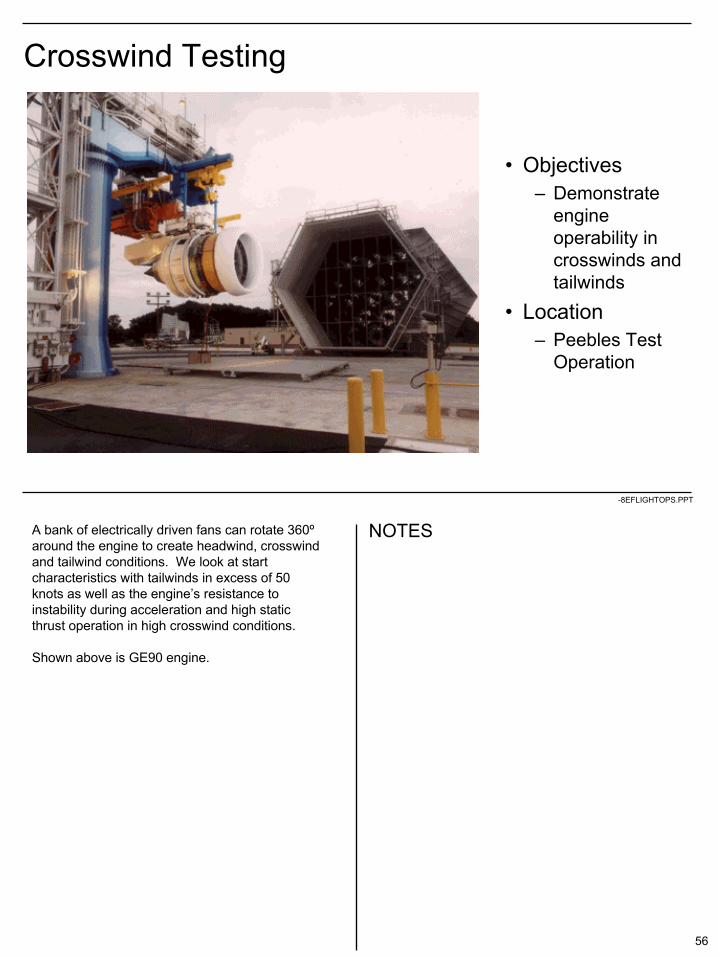
Crosswind Testing
• Objectives– Demonstrate
engine operability in crosswinds and tailwinds
• Location– Peebles Test
Operation
A bank of electrically driven fans can rotate 360º around the engine to create headwind, crosswind and tailwind conditions. We look at start characteristics with tailwinds in excess of 50 knots as well as the engine’s resistance to instability during acceleration and high static thrust operation in high crosswind conditions.
Shown above is GE90 engine.

57
NOTES
-8EFLIGHTOPS.PPT
Cold Weather Testing
• Objectives– Demonstrate engine
operability in a heavy ice environment for certification and engineering evaluation
– Demonstrate a “cold” start
• Location– Peebles Test Operation
These tests evaluate impact on hardware and operability of ice build up on non-anti-iced engine components such as fan blades, spinner and booster/HPC stators.
Ice is allowed to build up at various power settings, then shed by centrifugal force and temperature rise during engine acceleration.
In another test (not shown here), an ice slab is fired into the engine to simulate the shedding of ice that was allowed to build up on the engine because of late or no actuation of inlet anti-ice.
Shown above is GE90 engine.

58
NOTES
-8EFLIGHTOPS.PPT
Icing Tests in Climatic Hangar (CFM56-3 Upgrade)
Normally, icing tests are run at our Peebles, Ohio outdoor test facility. In this case, test stand scheduling and ambient temperature conditions precluded outdoor testing. CFM fabricated a portable version of the Peebles test set-up and shipped it to the USAF climatic hangar in Florida, where the tests were performed with the engine installed on a leased B737-300 in a temperature controlled environment. Outside temperatures were approximately 30 deg C while temperature in the hangar were in the –15 deg C range.

59
NOTES
-8EFLIGHTOPS.PPT
Bird Ingestion Testing
• Objectives– Evaluate impact
on engine hardware and operability of bird ingestion
• Location– Peebles Test
Operation
Large birds (up to 8 lbs.) and medium birds (up to 2 ½ lbs.) are fired into the engine while it is operating at takeoff thrust.
Shown above is CFM56-7 engine.
60
NOTES
-8EFLIGHTOPS.PPT
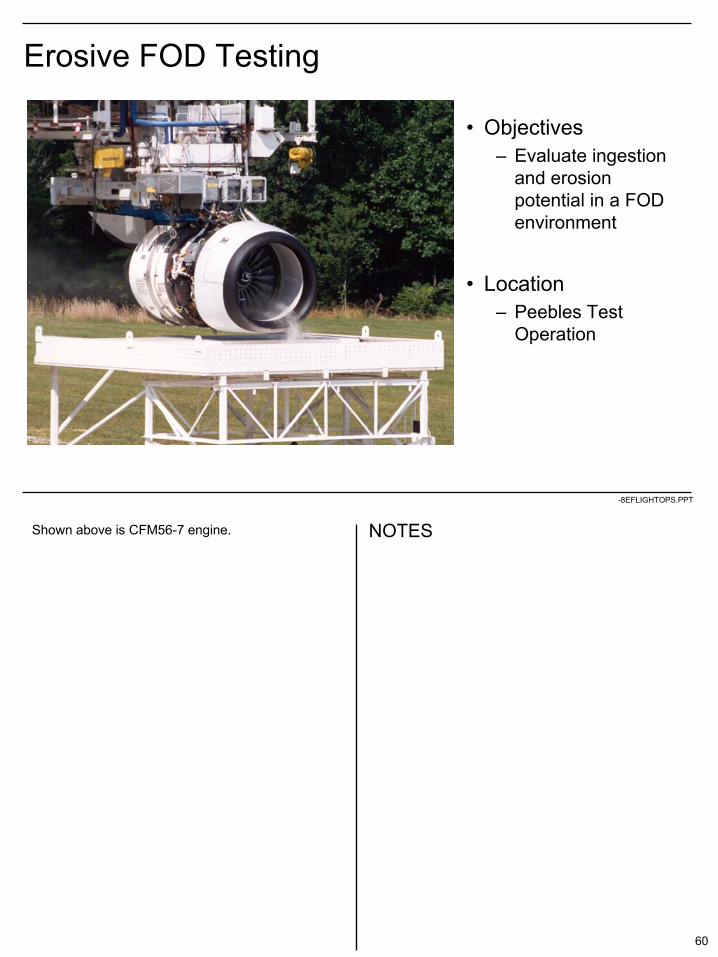
Erosive FOD Testing
• Objectives– Evaluate ingestion
and erosion potential in a FOD environment
• Location– Peebles Test
Operation
Shown above is CFM56-7 engine.

61
NOTES
-8EFLIGHTOPS.PPT
Water Ingestion Testing• Objectives
– Demonstrate engine operability in a heavy rain environment – Demonstrate starting with water ingestion
• Location– Peebles Test Operation
This test simulates a worst case downpour. The engine must demonstrate satisfactory operability.
Shown above is CFM56-5C engine.
62
NOTES
-8EFLIGHTOPS.PPT
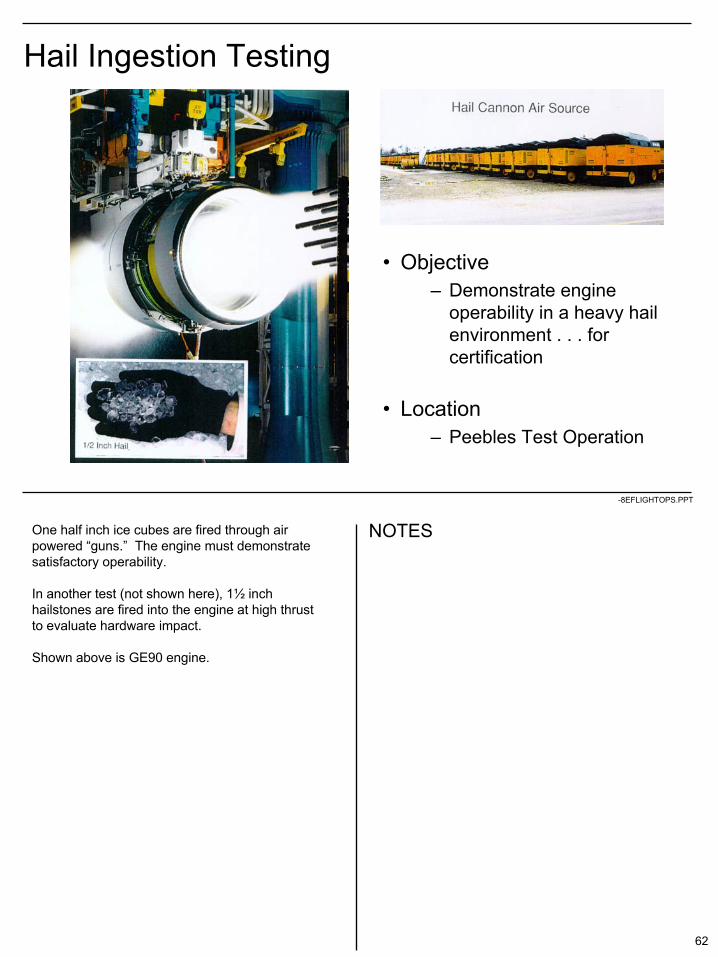
Hail Ingestion Testing
• Objective– Demonstrate engine
operability in a heavy hail environment . . . for certification
• Location– Peebles Test Operation
One half inch ice cubes are fired through air powered “guns.” The engine must demonstrate satisfactory operability.
In another test (not shown here), 1½ inch hailstones are fired into the engine at high thrust to evaluate hardware impact.
Shown above is GE90 engine.
63
NOTES
-8EFLIGHTOPS.PPT
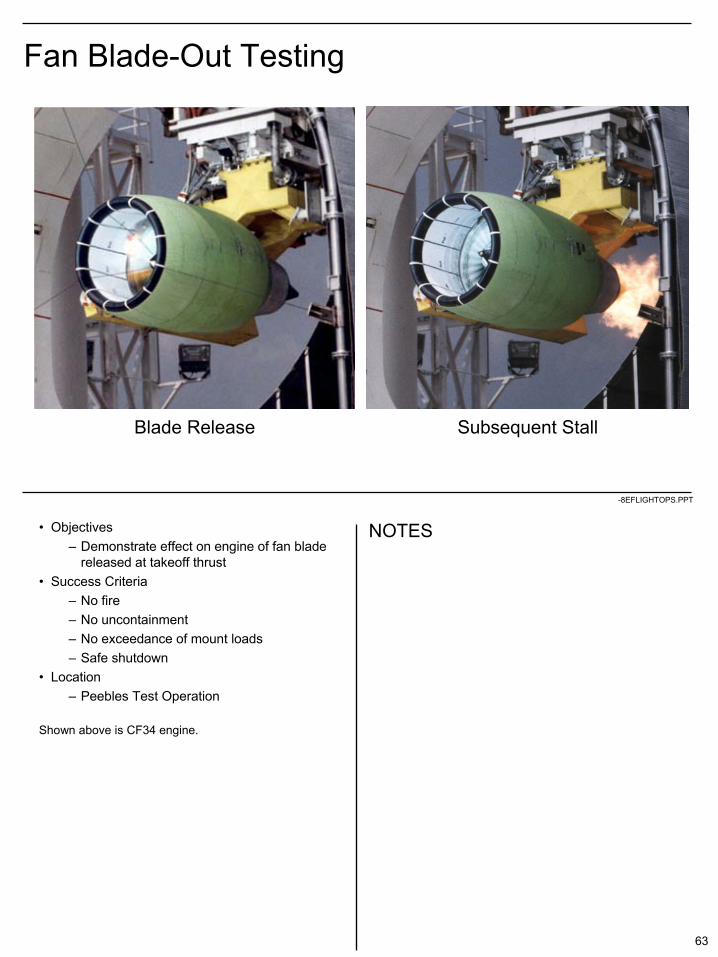
Fan Blade-Out Testing
• Objectives– Demonstrate effect on engine of fan blade
released at takeoff thrust• Success Criteria
– No fire– No uncontainment– No exceedance of mount loads– Safe shutdown
• Location– Peebles Test Operation
Shown above is CF34 engine.
Blade Release Subsequent Stall
64
NOTES
-8EFLIGHTOPS.PPT
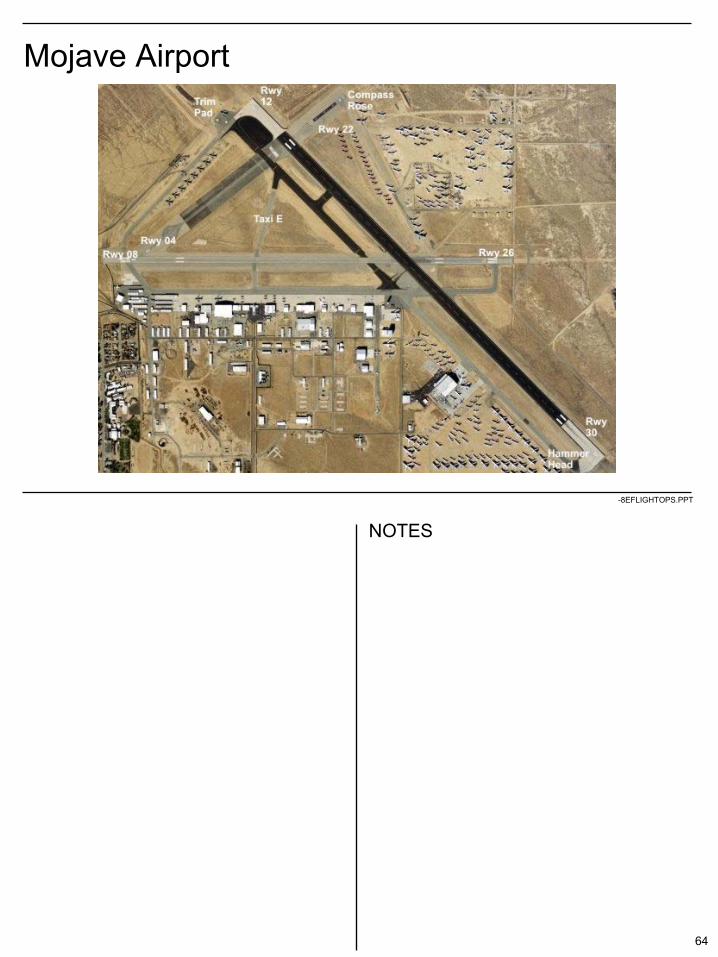
Mojave Airport

65
NOTES
-8EFLIGHTOPS.PPT
A300 Test Bed Aircraft (CF6-80C2 Installed)
This aircraft, an A300B2 leased from Airbus Industrie, was used as a flying test bed for the CF6-80C2 PMC and FADEC engines.
66
NOTES
-8EFLIGHTOPS.PPT
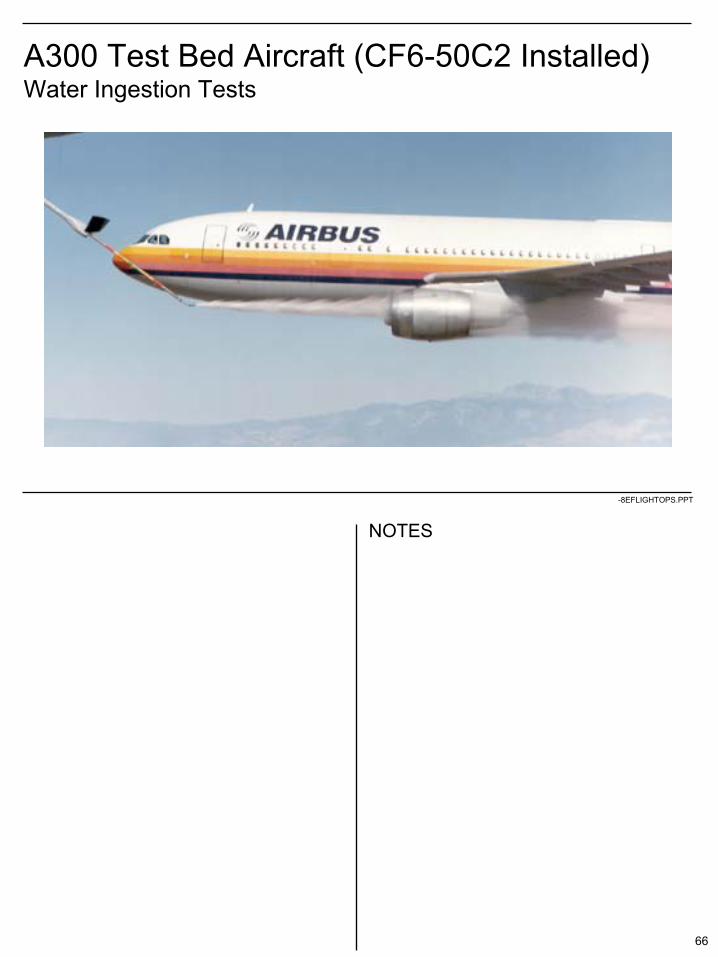
A300 Test Bed Aircraft (CF6-50C2 Installed)Water Ingestion Tests
67
NOTES
-8EFLIGHTOPS.PPT
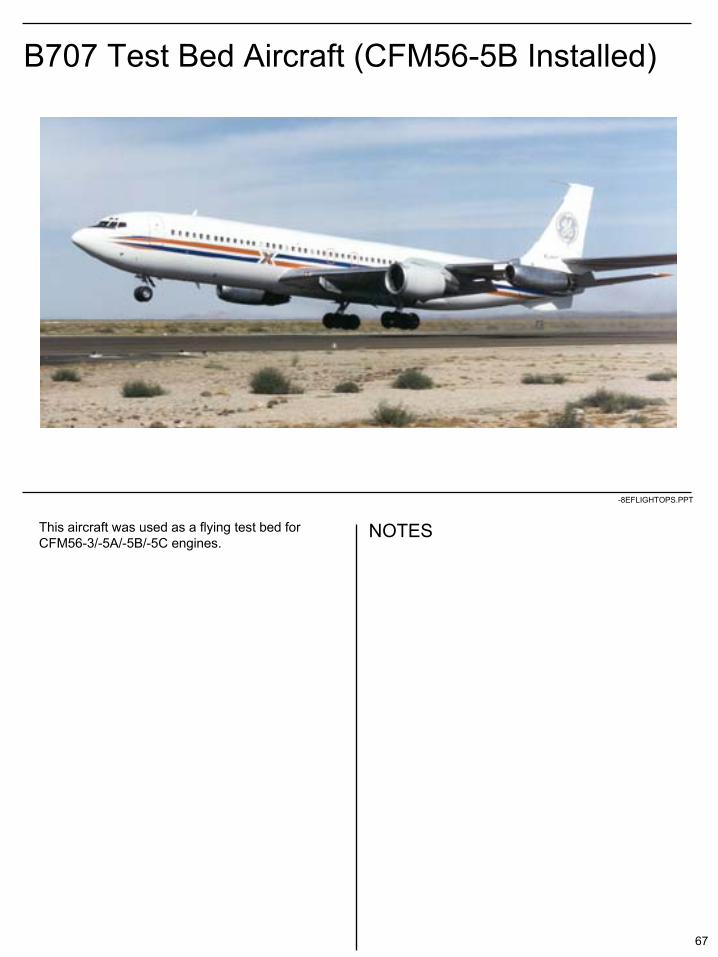
B707 Test Bed Aircraft (CFM56-5B Installed)
This aircraft was used as a flying test bed for CFM56-3/-5A/-5B/-5C engines.

68
NOTES
-8EFLIGHTOPS.PPT
B707 Test Bed Aircraft (CFM56-3 Installed)Water Ingestion Tests
69
NOTES
-8EFLIGHTOPS.PPT
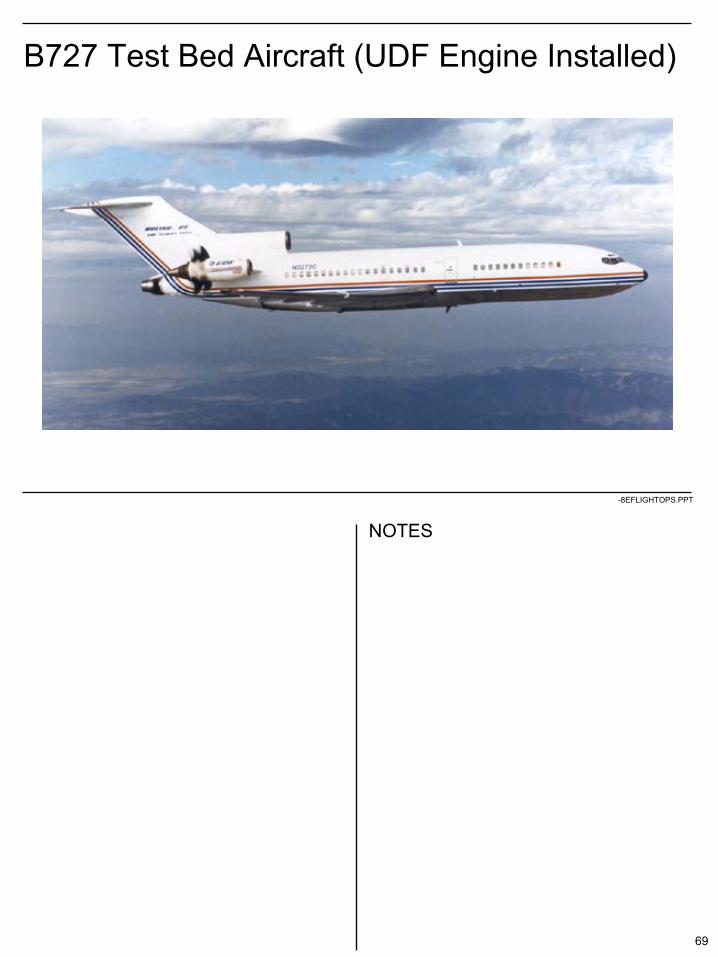
B727 Test Bed Aircraft (UDF Engine Installed)

70
NOTES
-8EFLIGHTOPS.PPT
B747 Test Bed Aircraft (GE90 Installed)
This aircraft, a B747-100, has been used as a flying test bed for all GE and CFM56 engines since 1992, including the GE90, CFM56-7 and CF34 engines. GE believes there is no substitute for in-flight testing. This test bed allows GE to subject our new engines to very rigorous in-flight operability testing before delivery of a new engine to the aircraft manufacturer. This helps account for the outstanding operability reputation of GE and CFM56 engines relative to those of other manufacturers. This test bed was most recently used to flight test the world’s highest thrust engine, the GE90-115B (115,000 pounds of thrust). The GP7000-series (Engine Alliance) engine for the A380 will be tested on the same aircraft as will the CF34-10 regional jet engine.
71
NOTES
-8EFLIGHTOPS.PPT
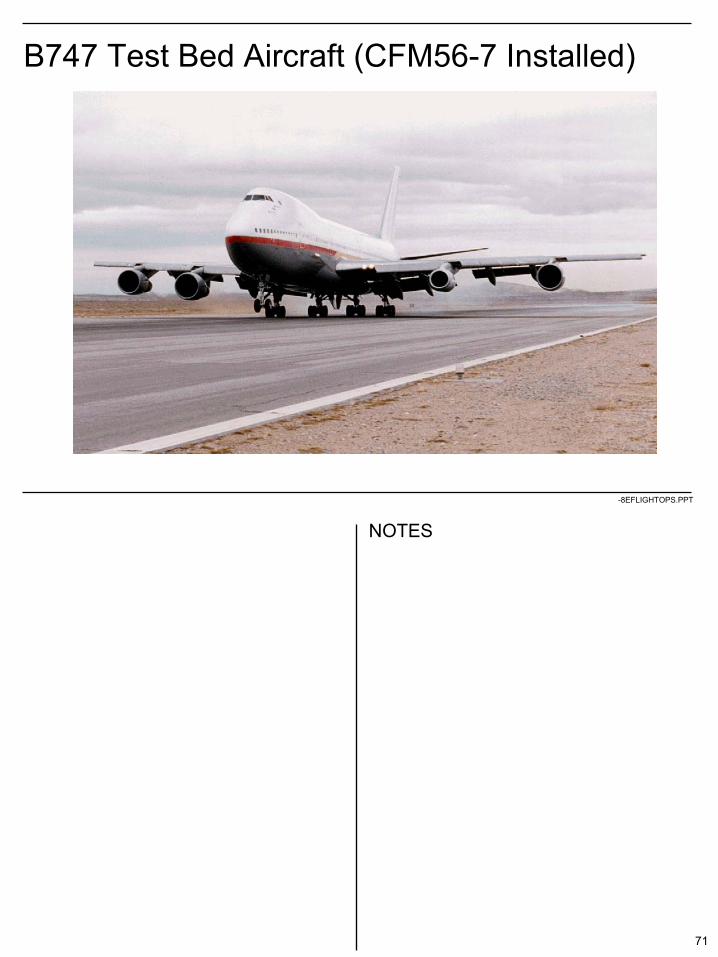
B747 Test Bed Aircraft (CFM56-7 Installed)
72
NOTES
-8EFLIGHTOPS.PPT
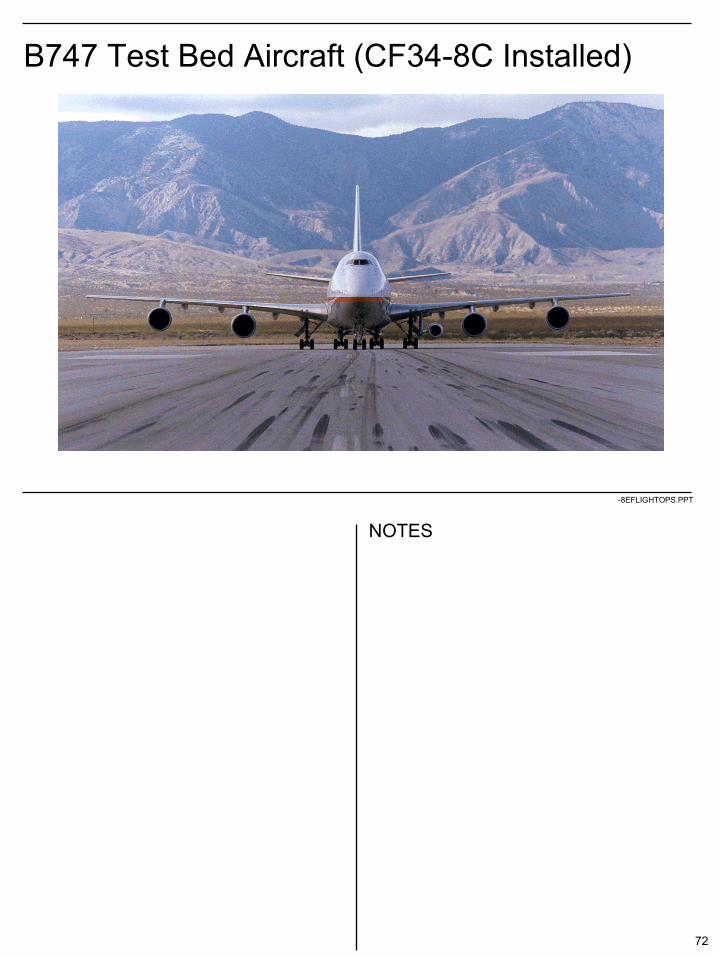
B747 Test Bed Aircraft (CF34-8C Installed)
73
NOTES
-8EFLIGHTOPS.PPT
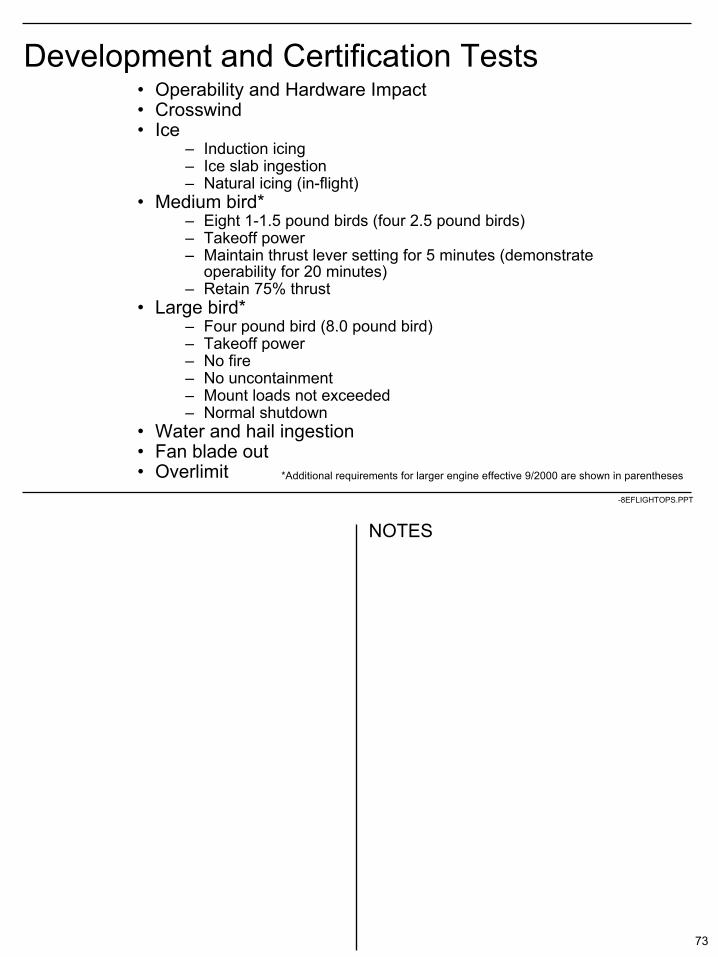
Development and Certification Tests• Operability and Hardware Impact• Crosswind• Ice
– Induction icing– Ice slab ingestion– Natural icing (in-flight)
• Medium bird*– Eight 1-1.5 pound birds (four 2.5 pound birds)– Takeoff power– Maintain thrust lever setting for 5 minutes (demonstrate
operability for 20 minutes)– Retain 75% thrust
• Large bird*– Four pound bird (8.0 pound bird)– Takeoff power– No fire– No uncontainment– Mount loads not exceeded– Normal shutdown
• Water and hail ingestion• Fan blade out• Overlimit *Additional requirements for larger engine effective 9/2000 are shown in parentheses

74
NOTES
-8EFLIGHTOPS.PPT
Typical Operability Test Maneuvers Performed
• Start– Ground– Air– Manual– Auto
• Steady state operation– High thrust– Low thrust
• Acceleration– Normal– Burst
• Deceleration– Normal– Chop
• Bodies

75
NOTES
-8EFLIGHTOPS.PPT
Conditions Under Which Maneuvers are Performed
• Normal
• Crosswind
• Tailwind
• Icing
• Rain
• Hail
• Bird ingestion
• Off schedule VSV’s
• Off schedule fuel
• Suction feed
• High angle of attack
• Slow speed
76
NOTES
-8EFLIGHTOPS.PPT
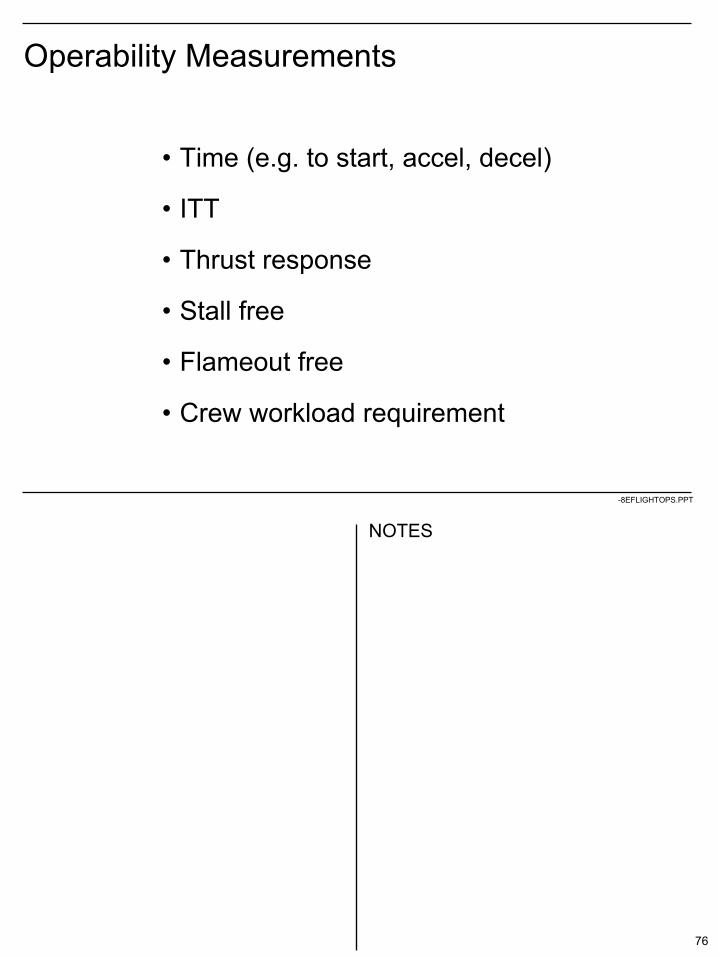
Operability Measurements
• Time (e.g. to start, accel, decel)
• ITT
• Thrust response
• Stall free
• Flameout free
• Crew workload requirement
77
NOTES
-8EFLIGHTOPS.PPT
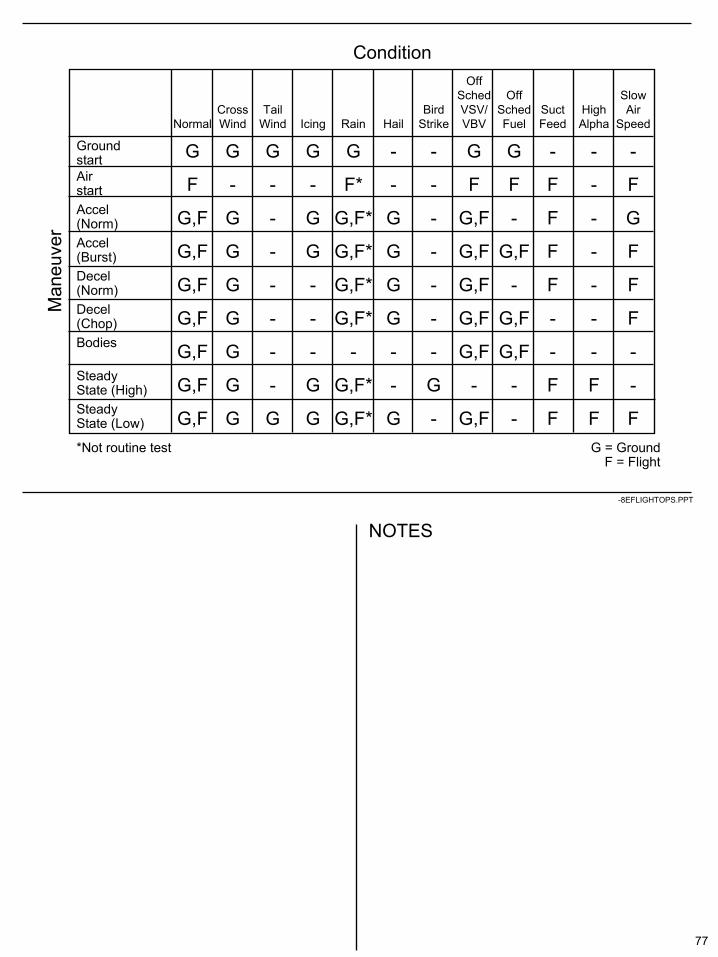
ConditionM
aneu
ver
Normal
G
F
G,F
G,F
G,F
G,F
G,F
G,F
G,F
CrossWind
G
-
G
G
G
G
G
G
G
TailWind
G
-
-
-
-
-
-
-
G
Icing
G
-
G
G
-
-
-
G
G
Rain
G
F*
G,F*
G,F*
G,F*
G,F*
-
G,F*
G,F*
Hail
-
-
G
G
G
G
-
-
G
BirdStrike
-
-
-
-
-
-
-
G
-
OffSchedVSV/VBV
G
F
G,F
G,F
G,F
G,F
G,F
-
G,F
OffSchedFuel
G
F
-
G,F
-
G,F
G,F
-
-
SuctFeed
-
F
F
F
F
-
-
F
F
HighAlpha
-
-
-
-
-
-
-
F
F
SlowAir
Speed
-
F
G
F
F
F
-
-
F
GroundstartAirstartAccel(Norm)Accel(Burst)Decel(Norm)Decel(Chop)Bodies
SteadyState (High)SteadyState (Low)
*Not routine test G = GroundF = Flight


79
NOTES
-8E FLIGHTOPS.PPT
Normal OperatingConsiderations
80
NOTES
-8EFLIGHTOPS.PPT
Note
• If there are inconsistencies between this presentation and the Aircraft Operations Documents the Aircraft Operations Documents take precedence
81
NOTES
-8EFLIGHTOPS.PPT
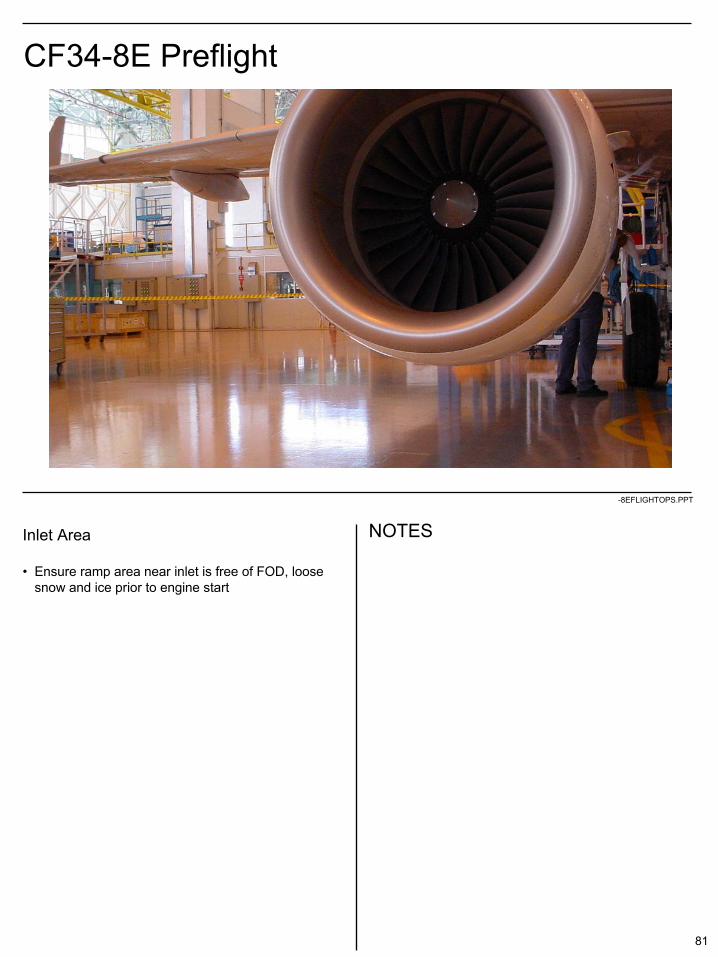
CF34-8E Preflight
Inlet Area
• Ensure ramp area near inlet is free of FOD, loose snow and ice prior to engine start
82
NOTES
-8EFLIGHTOPS.PPT
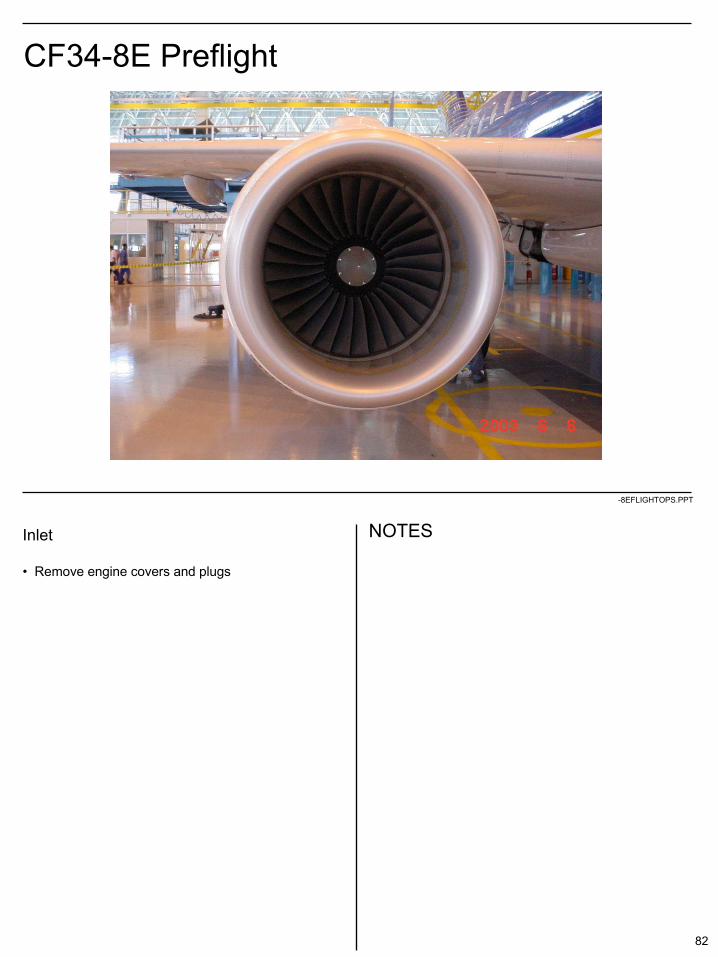
CF34-8E Preflight
Inlet
• Remove engine covers and plugs

83
NOTES
-8EFLIGHTOPS.PPT
CF34-8E Preflight
Inlet/Fan
• Check for tools, equipment, snow, ice or FOD on fan blades, spinner or in the lower inlet near the fan
• Remove snow or ice with warm air instead of de-icing fluid
• Check for damaged fan blades• Ensure fan is free to rotate prior to engine start
84
NOTES
-8EFLIGHTOPS.PPT
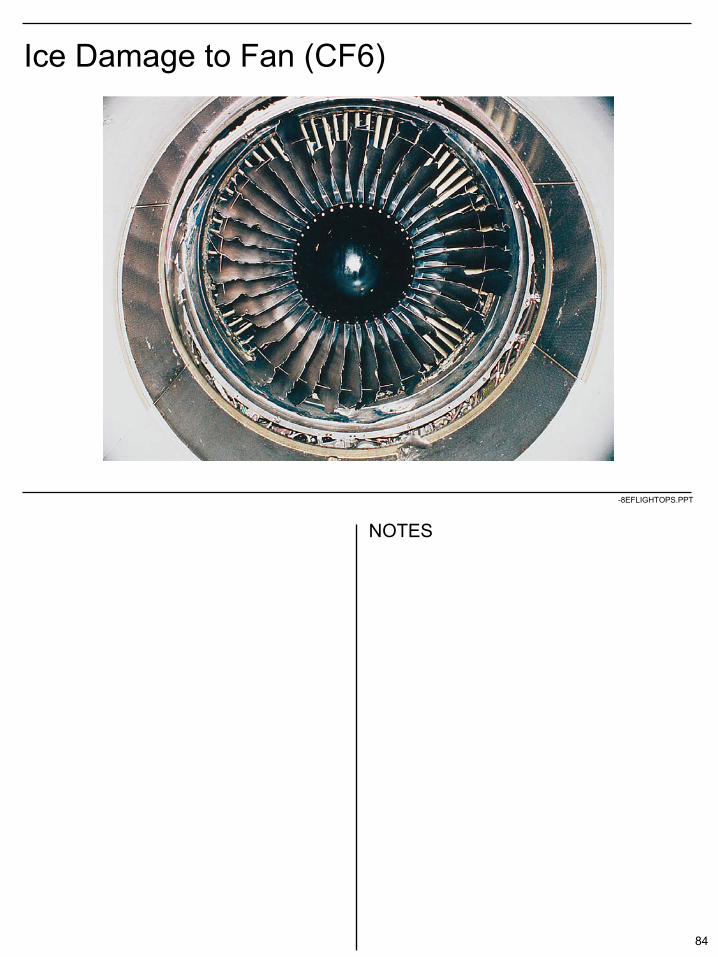
Ice Damage to Fan (CF6)
85
NOTES
-8EFLIGHTOPS.PPT
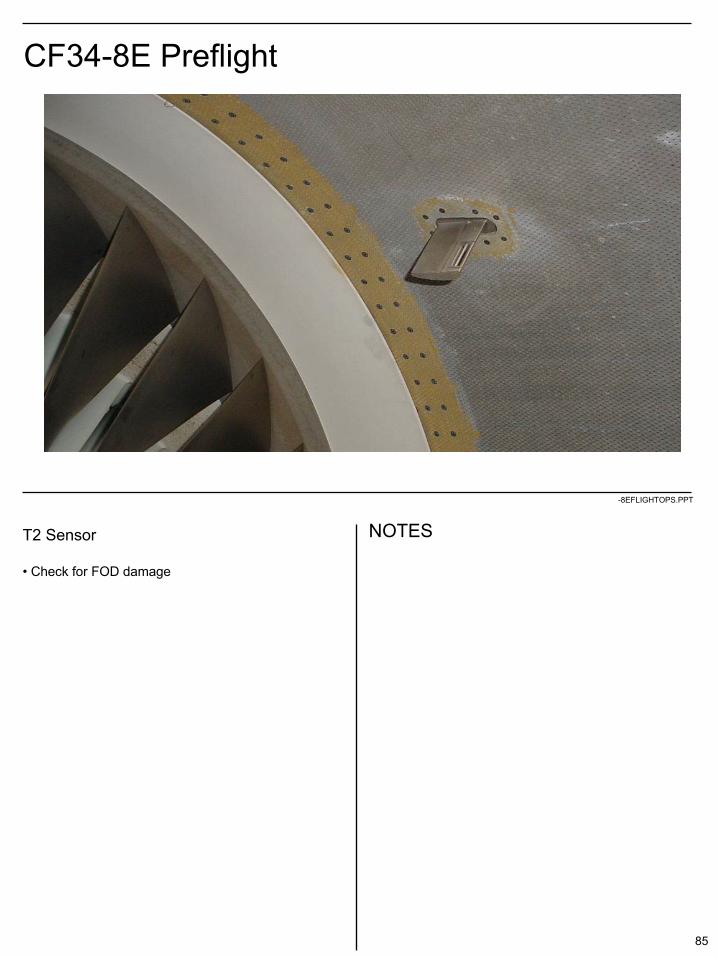
CF34-8E Preflight
T2 Sensor
• Check for FOD damage

86
NOTES
-8EFLIGHTOPS.PPT
CF34-8E Preflight
Cowls and Thrust Reverser in Open Position
• Cowls and thrust reverser are hinged to pylon
3 Fan cowl latches - unlatched

87
NOTES
-8EFLIGHTOPS.PPT
CF34-8E Preflight
Fan Cowl
• Difficult to see if latches are latched at standing height when close to nacelle
• Verify that all three latches are latched. Fan cowl may look secure even though two latches may be unlatched.
2 of 3 Fan cowl latches - unlatched
3 Fan cowl latches - unlatched
Fan compartment vent

88
NOTES
-8EFLIGHTOPS.PPT
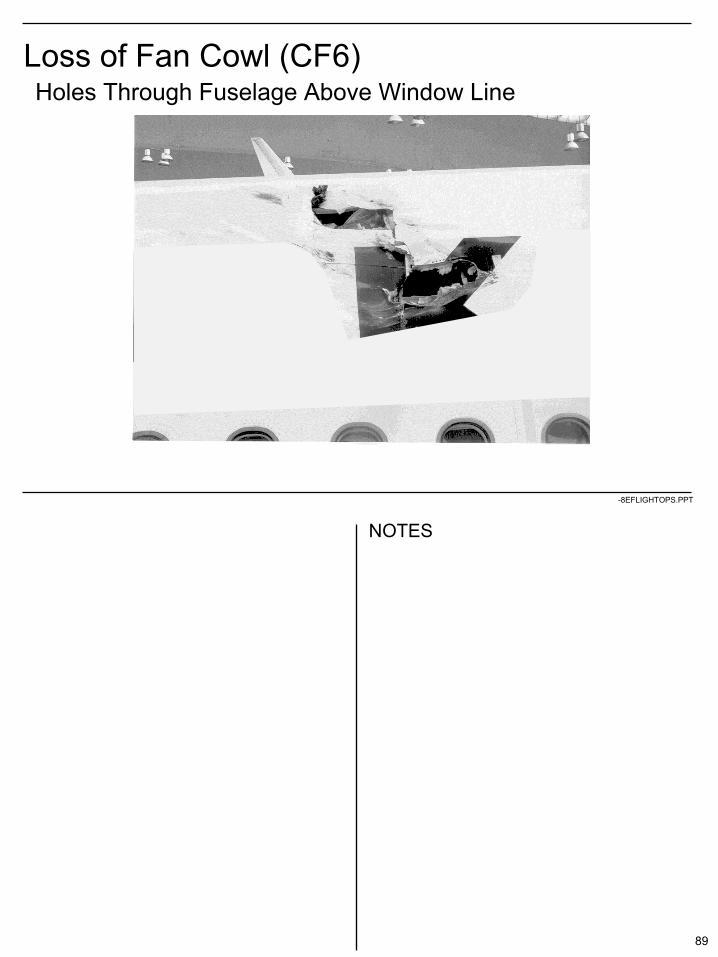
Loss of Fan Cowl (CF6)
We believe this incident was the result of takeoff with one or more cowl latches open.
89
NOTES
-8EFLIGHTOPS.PPT
Loss of Fan Cowl (CF6)Holes Through Fuselage Above Window Line

90
NOTES
-8EFLIGHTOPS.PPT
CF34-8E Preflight
View of Nacelle – Aft Looking Forward
Thrust Reverser latches (2) - unlatched
Core cowl latches (3) - unlatched

91
NOTES
-8EFLIGHTOPS.PPT
CF34-8E Preflight
Core Cowl – View from 6 o’clock• Open pressure relief door may indicate a pneumatic
duct separation
Core cowl latches - latched
Pressure Relief Door
92
NOTES
-8EFLIGHTOPS.PPT
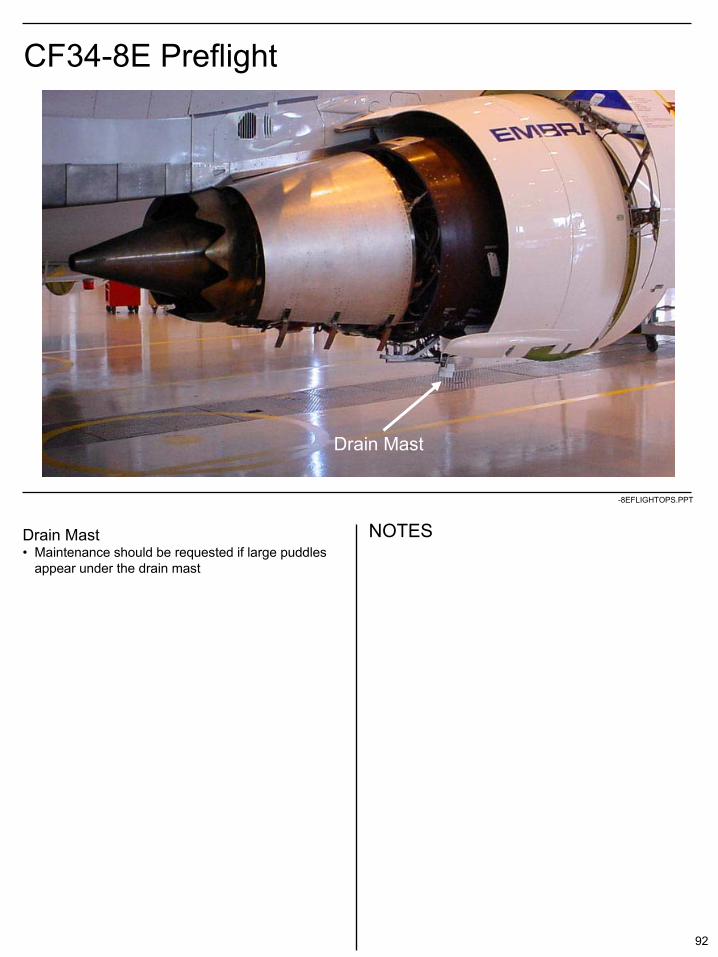
CF34-8E Preflight
Drain Mast• Maintenance should be requested if large puddles
appear under the drain mast
Drain Mast
93
NOTES
-8EFLIGHTOPS.PPT
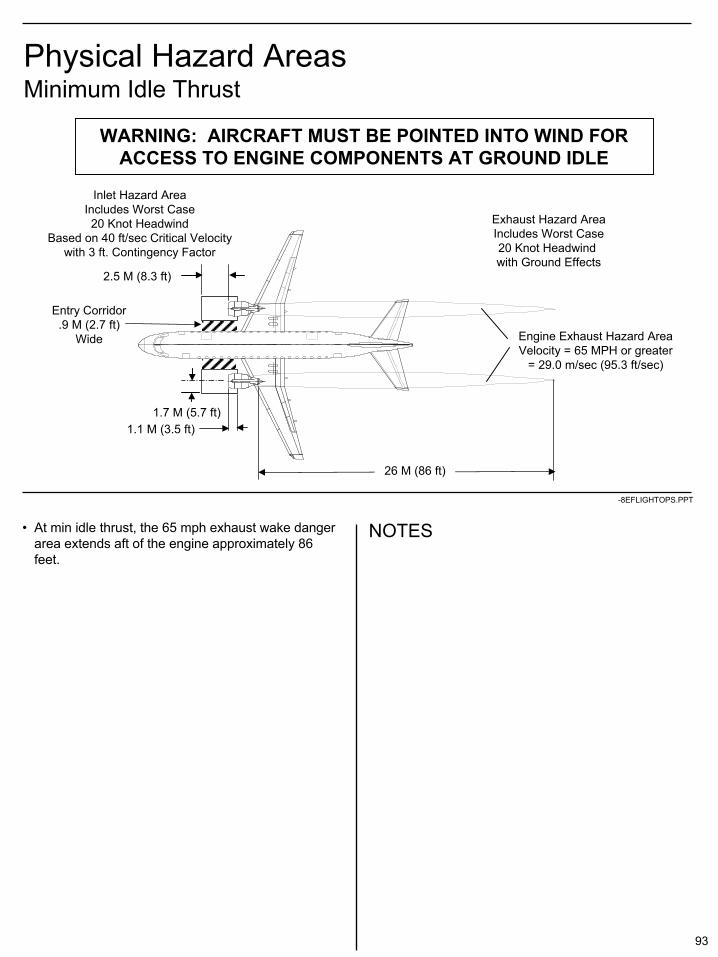
Physical Hazard AreasMinimum Idle Thrust
• At min idle thrust, the 65 mph exhaust wake danger area extends aft of the engine approximately 86 feet.
Inlet Hazard AreaIncludes Worst Case20 Knot Headwind
Based on 40 ft/sec Critical Velocitywith 3 ft. Contingency Factor
WARNING: AIRCRAFT MUST BE POINTED INTO WIND FOR ACCESS TO ENGINE COMPONENTS AT GROUND IDLE
Engine Exhaust Hazard AreaVelocity = 65 MPH or greater
= 29.0 m/sec (95.3 ft/sec)
Exhaust Hazard AreaIncludes Worst Case20 Knot Headwind with Ground Effects
26 M (86 ft)
1.1 M (3.5 ft)1.7 M (5.7 ft)
Entry Corridor.9 M (2.7 ft)
Wide
2.5 M (8.3 ft)
94
NOTES
-8EFLIGHTOPS.PPT
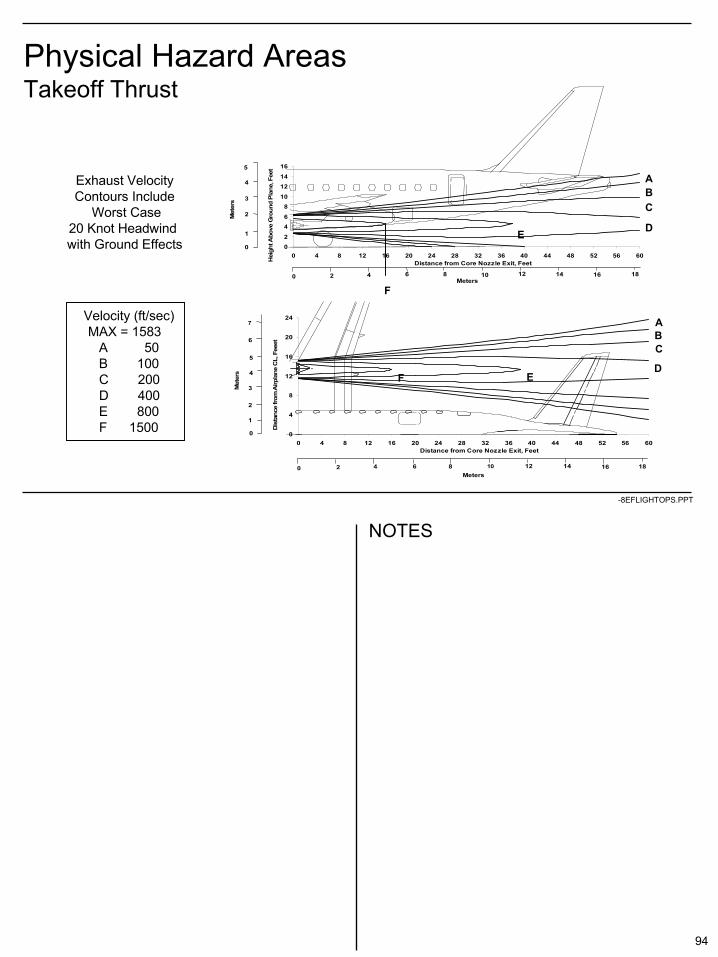
Physical Hazard AreasTakeoff Thrust
0
4
8
12
16
20
24
0 4 8 12 16 20 24 28 32 36 40 44 48 52 56 60Distance from Core Nozzle Exit, Feet
Meters0 2 4 6 8 10 12
Dis
tanc
e fro
m A
irpla
ne C
L, F
eeet
0
5
4
3
2
1
Met
ers
14 16 18
6
7 ABC
DEF
Velocity (ft/sec)MAX = 1583
A 50B 100C 200D 400E 800F 1500
Exhaust VelocityContours Include
Worst Case20 Knot Headwind with Ground Effects
ABC
DE
F
02
46
810
1214
16
0 4 8 12 16 20 24 28 32 36 40 44 48 52 56 60Distance from Core Nozzle Exit, Feet
Meters0 2 4 6 8 10 12
Hei
ght A
bove
Gro
und
Plan
e, F
eet
0
5
4
3
2
1M
eter
s
14 16 18

95
NOTES
-8EFLIGHTOPS.PPT
Embraer 170 Cockpit

96
NOTES
-8EFLIGHTOPS.PPT
Embraer 170 Cockpit Layout

97
NOTES
-8EFLIGHTOPS.PPT
CF34-8E Engine Control Panel

98
NOTES
-8EFLIGHTOPS.PPT
Embraer 170 Thrust Levers
• Flats (detents) at TO/GA and MAX
• Thrust reverser deployed by lifting the idle stop lever on the thrust lever and moving thrust lever into the reverse position

Embraer 170 EICAS Display
100
NOTES
-8EFLIGHTOPS.PPT
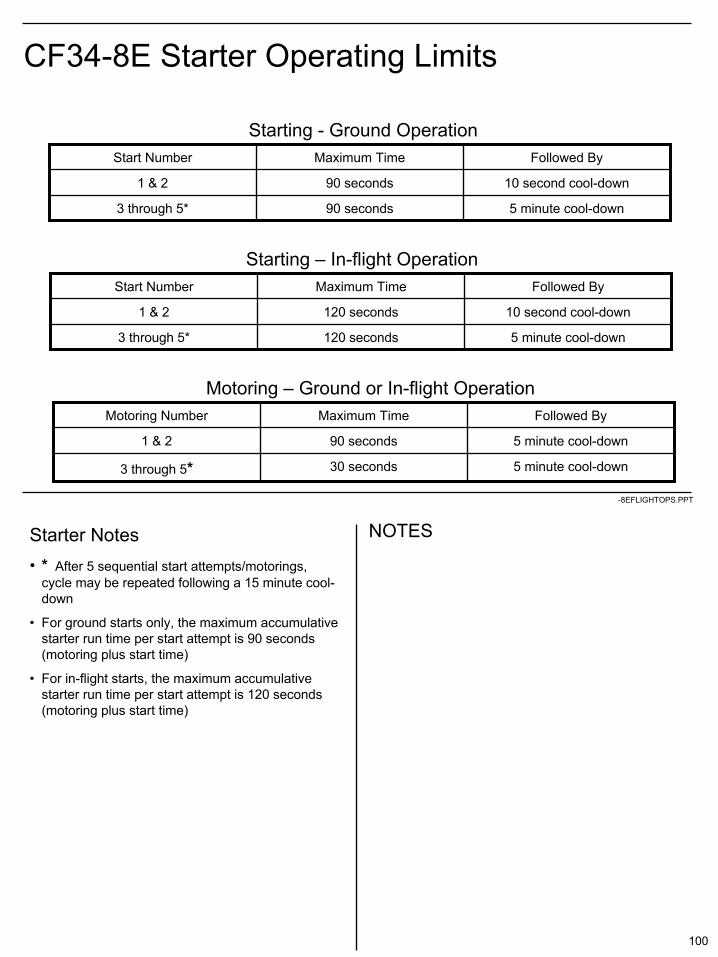
CF34-8E Starter Operating Limits
5 minute cool-down90 seconds3 through 5*
10 second cool-down90 seconds1 & 2
Followed ByMaximum TimeStart Number
Starting - Ground Operation
5 minute cool-down120 seconds3 through 5*
10 second cool-down120 seconds1 & 2
Followed ByMaximum TimeStart Number
Starting – In-flight Operation
5 minute cool-down30 seconds3 through 5*
5 minute cool-down90 seconds1 & 2
Followed ByMaximum TimeMotoring Number
Motoring – Ground or In-flight Operation
Starter Notes• * After 5 sequential start attempts/motorings,
cycle may be repeated following a 15 minute cool-down
• For ground starts only, the maximum accumulative starter run time per start attempt is 90 seconds (motoring plus start time)
• For in-flight starts, the maximum accumulative starter run time per start attempt is 120 seconds (motoring plus start time)

101
NOTES
-8EFLIGHTOPS.PPT
CF34-8E Ground StartingStart Sequence1. Thrust Lever – IDLE position
2. Ignition switch – AUTO
2. Start switch – move to START then release to RUN• FADEC controls starter air valve, ignition and fuel flow
- Starter air valve opens when start switch moved to START
- Ignition sequenced on at 7% N2- Alternate ignitor selected if no light-off in 15 seconds after fuel on- Ignition A (essential bus) – No dispatch message if Ignition A inop.- Ignition B – Short term dispatch if Ignition B inop.- Either FADEC channel can control each ignition exciter- Alternate ignition selected for every other start
- Automatic Fuel Control- Fuel on at 20% N2- Light-off typically within 5 seconds after fuel on
- Starter air valve closes and ignition off at approximately 50% N2
Ground Start Notes
• FADEC will prevent engine start if thrust lever is not in the idle position
• On the ground FADEC will automatically turn off ignition and fuel if a hot start or a hung start is detected
• Engine will continue to motor until the pilot manually closes starter air valve by moving STOP/START switch to STOP
• If no light off within 30 seconds of fuel on the pilot must abort start manually (STOP/START switch to STOP)
• Dry motor the engine for at least 30 seconds after aborting a start to purge the combustor of residual fuel prior to the next start attempt

102
NOTES
-8EFLIGHTOPS.PPT
CF34-8E Starting CharacteristicsNormal Ground Start (All Numerical Values Are “Typical” Not Limits)
• Light-off- Typically within 2-4 seconds
• ITT start limit - 815°C
• Oil pressure- Must be indicated by ground idle- May indicate full scale for cold soaked engine
• Idle- Indicated by ITT and fuel flow reduction- Typical start time: 40 to 60 seconds- 22% N1, 60% N2, typical idle speeds
Idle
N2
Time
light-off(2-4 sec)
30-50 secondsto idle from light-off
Idle
N1
Time
Min N1 Display = 8%
ITT
Time
Light-off
460-550°C ITTat idle
FF
Time
Fuel shutoffopen
450-550 pphat idle
Peak ITT = 550-650°C Peak FF = 110-180 pph prior to light-off500-650 pph after light-off
light-off occursbefore N1 = 8%

103
NOTES
-8EFLIGHTOPS.PPT
CF34-8E Ground Start Considerations• START/STOP switch
– Switch must be moved from STOP to START in 30 seconds or less or FADEC will prevent engine start
– Recycle switch through STOP position for next start attempt
• Starter air pressure– 41 – 48 psi air supply pressure required– Slower starts with lower pressure
• Ignition selection is automatic– FADEC alternates A and B ignitors on every
other start
• Cold Soaked Engine– Oil temperature must be at least -40 °C prior
to engine start– Oil pressure peaks to full scale may occur
due to high oil viscosity– Oil pressure should decrease as the oil
temperature increases
• Fan rotation– N1 indication is absolute– Tailwind may cause opposite fan rotation– Core airflow will gradually override tailwind
effect and eventually turn fan in correct direction
– Minimize tailwind prior to start by repositioning aircraft if practical
– With strong tailwinds consider manually dry-motoring engine (ignition switch OFF) to achieve positive, increasing N1 prior to continuing start (ignition switch AUTO).
• Starts with high residual ITT– Expect delayed light-off if starting with
residual ITT > 120°C– FADEC will automatically dry motor until ITT
is less than 120°C, then turn on ignition and fuel

104
NOTES
-8EFLIGHTOPS.PPT
CF34-8E In-Flight StartingAir Start Envelope
• FADEC will not allow engine start if thrust lever is not in the idle position
• FADEC does NOT provide hot start, hung start or stall protection in the air
-5000
0
5000
10000
15000
20000
25000
0 50 100 150 200 250 300 350Airspeed (kias)
Alti
tude
(ft)
Windmill Starter Assist
Starter Assist Required
Starter Assist or Windmill if N2 is greater than 7.2%
Windmill Only if N2 is greater than 7.2%
105
NOTES
-8EFLIGHTOPS.PPT
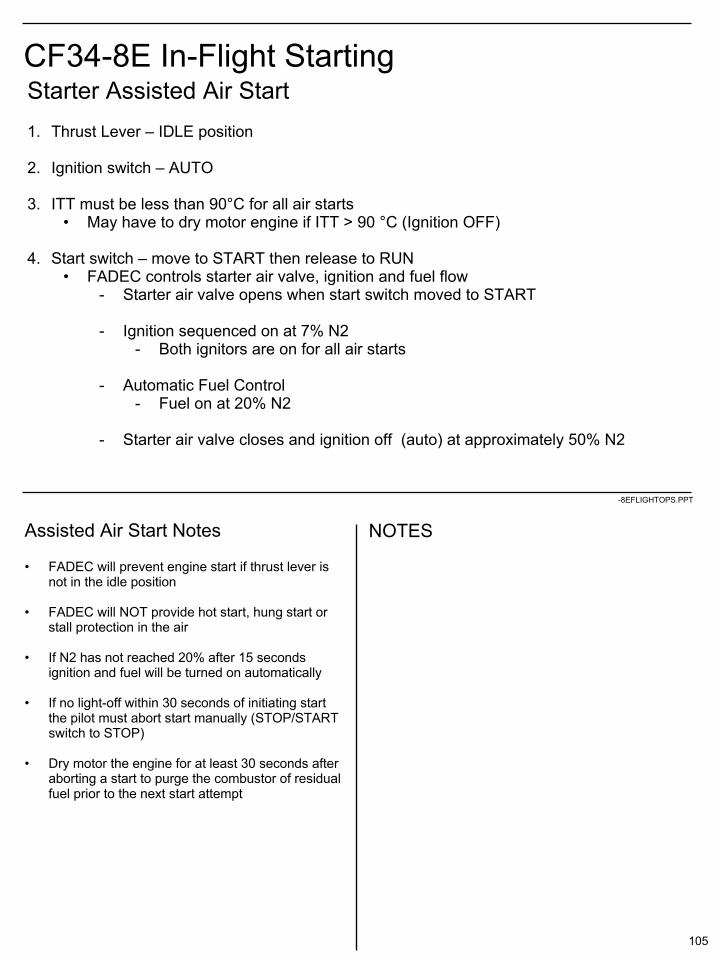
CF34-8E In-Flight StartingStarter Assisted Air Start1. Thrust Lever – IDLE position
2. Ignition switch – AUTO
3. ITT must be less than 90°C for all air starts• May have to dry motor engine if ITT > 90 °C (Ignition OFF)
4. Start switch – move to START then release to RUN• FADEC controls starter air valve, ignition and fuel flow
- Starter air valve opens when start switch moved to START
- Ignition sequenced on at 7% N2- Both ignitors are on for all air starts
- Automatic Fuel Control- Fuel on at 20% N2
- Starter air valve closes and ignition off (auto) at approximately 50% N2
Assisted Air Start Notes
• FADEC will prevent engine start if thrust lever is not in the idle position
• FADEC will NOT provide hot start, hung start or stall protection in the air
• If N2 has not reached 20% after 15 seconds ignition and fuel will be turned on automatically
• If no light-off within 30 seconds of initiating start the pilot must abort start manually (STOP/START switch to STOP)
• Dry motor the engine for at least 30 seconds after aborting a start to purge the combustor of residual fuel prior to the next start attempt
106
NOTES
-8EFLIGHTOPS.PPT
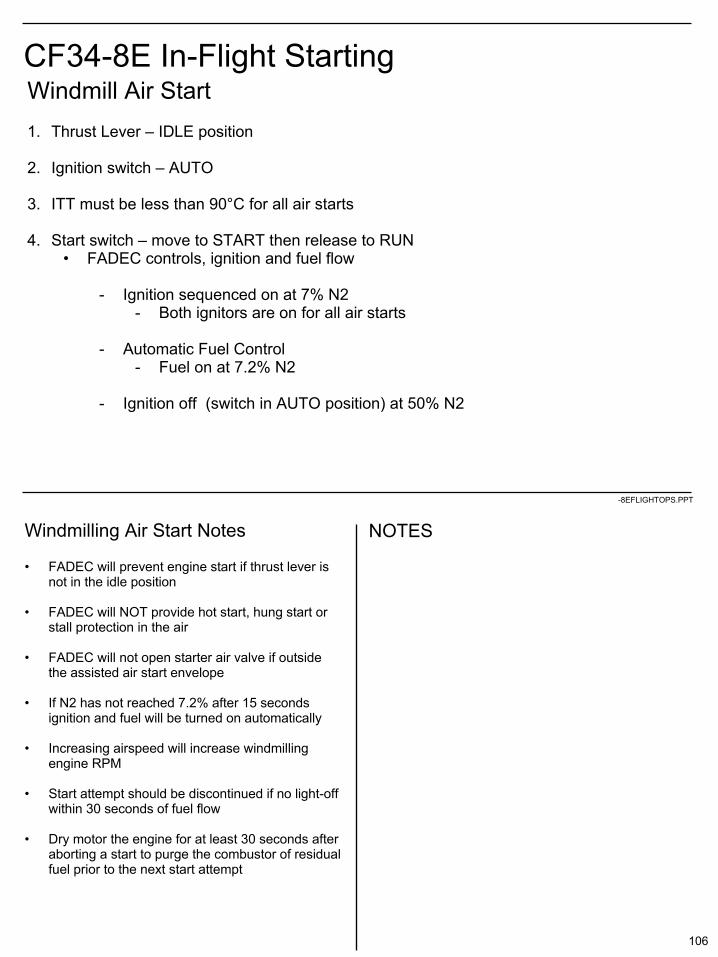
CF34-8E In-Flight StartingWindmill Air Start1. Thrust Lever – IDLE position
2. Ignition switch – AUTO
3. ITT must be less than 90°C for all air starts
4. Start switch – move to START then release to RUN• FADEC controls, ignition and fuel flow
- Ignition sequenced on at 7% N2- Both ignitors are on for all air starts
- Automatic Fuel Control- Fuel on at 7.2% N2
- Ignition off (switch in AUTO position) at 50% N2
Windmilling Air Start Notes
• FADEC will prevent engine start if thrust lever is not in the idle position
• FADEC will NOT provide hot start, hung start or stall protection in the air
• FADEC will not open starter air valve if outside the assisted air start envelope
• If N2 has not reached 7.2% after 15 seconds ignition and fuel will be turned on automatically
• Increasing airspeed will increase windmilling engine RPM
• Start attempt should be discontinued if no light-off within 30 seconds of fuel flow
• Dry motor the engine for at least 30 seconds after aborting a start to purge the combustor of residual fuel prior to the next start attempt

107
NOTES
-8EFLIGHTOPS.PPT
CF34-8E Abnormal Starts• Hot Start
– The indication of a hot start is an unusually fast ITT increase after ignition.
– A start stall condition is indicated by an abnormally slow core speed acceleration and an abnormal increase in ITT as compared to core speed.
– The FADEC provides automatic hot start protection (fuel and ignition off) on the ground. The FADEC will not provide automatic hot start protection in the air.
• Hung Start– A hung start is identified by abnormally slow acceleration after
ignition and rpm that stabilizes below idle. – During ground starts, the FADEC will automatically turn off fuel
and ignition if a hung start is detected. The FADEC will not provide automatic hung start protection in the air.

108
NOTES
-8EFLIGHTOPS.PPT
Taxi• Minimize breakaway thrust
– Less than 40% N1 if possible• Reduces FOD potential• Reduces blast hazard
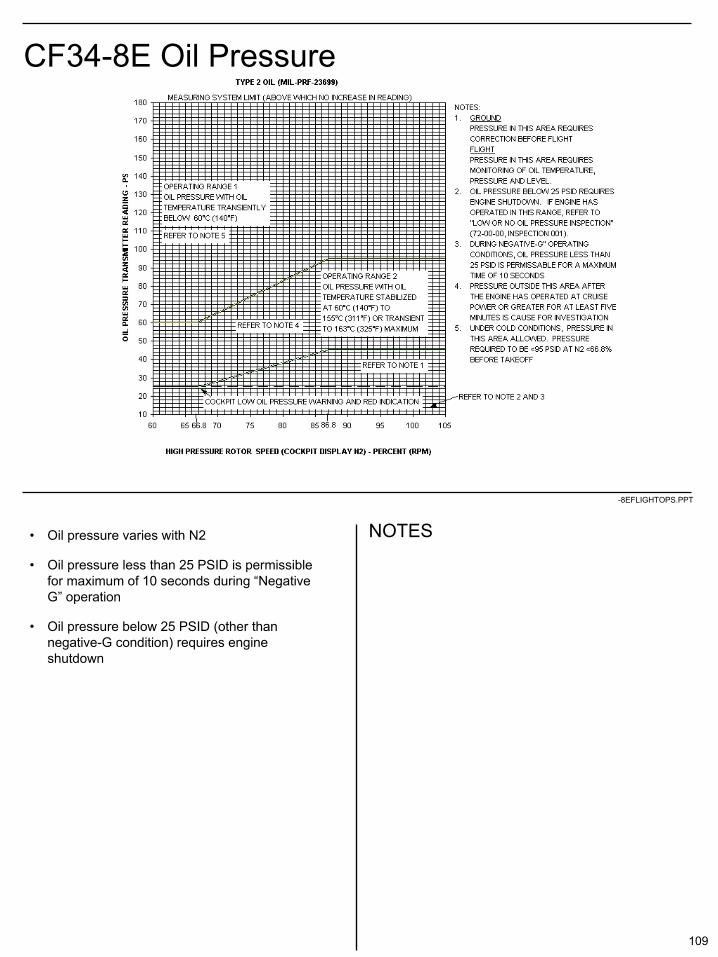
• Operate (warm up) engines two minutes minimum prior to takeoff• Reverse thrust during taxi only in emergency• Oil pressure
– Varies with N2– Minimum 25 psi– May be full scale for cold soaked engine
• Should come off full-scale after required minimum 2 minute warm up time prior to takeoff
• Oil temperature– Rise must be noted prior to takeoff– Maximum 155°C continuous, 163°C for 15 minutes
• Oil quantity– “Gulping”
109
NOTES
-8EFLIGHTOPS.PPT
CF34-8E Oil Pressure
• Oil pressure varies with N2
• Oil pressure less than 25 PSID is permissible for maximum of 10 seconds during “Negative G” operation
• Oil pressure below 25 PSID (other than negative-G condition) requires engine shutdown

110
NOTES
-8EFLIGHTOPS.PPT
CF34-8E Oil Quantity
• Varies inversely with engine speed
• Remains constant during steady-state operation
• Oil gulping: after engine start, oil level decreases due to distribution within system (sumps, gearboxes and supply scavenge lines)
• Increasing oil quantity or lack of gulping could indicate leak in fuel/oil heat exchanger
111
NOTES
-8EFLIGHTOPS.PPT
Taxi (Continued)
• Ground operation in icing conditions– Anti-ice on
• Anti-ices inlet lip
– During extended operation (more than 30 minutes):• Accelerate engines to 54% N1 and hold for 30 seconds (or to an N1 and
dwell time as high as practical, considering airport surface conditions and congestion)
– Allows immediate shedding of fan blade and spinner ice– De-ices stationary vanes with combination of shed ice impact,
pressure increase and temperature rise• Perform this procedure
– Every 30 minutes– Just prior to or in conjunction with the takeoff procedure, with
particular attention to engine parameters prior to final advance to takeoff thrust
– Any time fan ice accumulation is suspected by perceived or indicated fan vibration
112
NOTES
-8EFLIGHTOPS.PPT
Takeoff• Reduced thrust takeoff if conditions permit• Bleeds
– On/off depending on company policy/performance requirements– Avoid bleed configuration changes at low altitudes after takeoff
• From an engine standpoint, rolling takeoff is preferred– Less FOD potential on contaminated runways– Inlet vortex likely if takeoff N1 set below 30 KIAS– Less potential for engine instability or stall during crosswind/tailwind conditions– Observe limitations per aircraft manufacturer’s operations documents
• N1 thrust management– FADEC computes command N1 for max or reduced thrust based on FMS
inputs– Thrust lever “stand up” at approximately 40% N1 prior to full thrust (minimizes
uneven acceleration)– Pilot sets thrust lever to thrust set (TOGA) position for full thrust or reduced
thrust– FADEC maintains N1 at command value
• FADEC will automatically reduce fan speed to compensate for ITT increase of ECS/anti-ice bleeds based on Takeoff Data Set inputs to the FMS prior to takeoff.
• Manual selection of ECS ON below 500 feet above airport altitude at high thrust levels may result in ITT rise above limits unless thrust is momentarily reduced prior to selecting ECS ON.
• Manual or automatic selection of cowl or wing anti-ice ON below 1700 feet above airport altitude at high thrust levels may result in ITT rise above limits unless thrust is momentarily reduced prior to selecting cowl or wing anti-ice ON or prior to entering icing conditions with anti-ice in auto mode.
113
NOTES
-8EFLIGHTOPS.PPT
ATTCS (Automatic Takeoff Thrust Control System)
• Provides additional thrust on takeoff or go-around• Enabled automatically during engine start• Can be turned off for takeoff by pilot input on Takeoff Data Set
page on FMS– For takeoff with ATTCS turned off, thrust increase to RSV thrust is
NOT available automatically or manually (even with thrust lever push to MAX)
– Re-enabled automatically after takeoff phase completed– Always available for go-around
• Windshear (caution or warning) detected– Automatic increase to RSV thrust if ATTCS enabled for takeoff– If ATTCS selected off for takeoff, RSV thrust is still available by
manually pushing thrust lever to the MAX position– Automatic increase to RSV thrust is always available for
approach/go-around
• Thrust lever will stay in TOGA position if thrust increased to RSV level by automatic ATTCS activation
• Pilot must manually reduce thrust to maintain ITT within limits

114
NOTES
-8EFLIGHTOPS.PPT
CF34-8E5 ITT Operating Limits
CON12800 (960)
CON12800 (960)CON
GA RSV14200 (1006/990)
GA13000 (965/949)
ONGA
T/O-211700 (932/916)
T/O-211700 (932/916)
OFF
T/O-2 RSV13000 (965/949)
T/O-211700 (932/916)
ON
T/O-2
T/O-113000 (965/949)
T/O-113000 (965/949)
OFF
T/O-1 RSV14200 (1006/990)
T/O-113000 (965/949)*
ON
T/O-1
OEIAEOATTCSThrust Mode
Thrust (lbf) and ITT Limits
* ITT Time limits• 965°C for first 2 min. of the 5 min. • 949°C for remainder of 5 min.
115
NOTES
-8EFLIGHTOPS.PPT
Maximum Continuous Thrust
• Intended for use during single engine conditions or emergency situations
• NOT intended for normal two engine operations
116
NOTES
-8EFLIGHTOPS.PPT
Climb
• No fixed detent or flat
• Based on thrust lever position

117
NOTES
-8EFLIGHTOPS.PPT
Cruise
• Avoid unnecessary use of ignition– Conserves ignitor plug life
• Trend monitoring– Per company policy

118
NOTES
-8EFLIGHTOPS.PPT
Descent
• Smooth thrust reduction
• Idle most economical
• FADEC maintains idle speed to meet bleed demands

119
NOTES
-8EFLIGHTOPS.PPT
CF34-8E Idle Modes• Flight Idle
– Activated when in-flight and not in the approach idle mode (see below)– Provides minimum engine bleed pressure sufficient for ECS and anti-ice
systems– Fan speed varies as a function of ECS bleed, and anti-ice bleed requirements
• Approach Idle– Activated when the aircraft altitude is less than 15,000 feet, and the flaps are
down or the landing gear is down and locked– Used in flight to enable rapid acceleration to go-around thrust
• Final Approach Idle– Activated when: wing anti-ice is selected on, radar altitude is less than 1200
feet above landing altitude– engine idle speed will drop slightly from flight idle to approach idle to allow
more descent profile flexibility during the final approach phase of flight– wing anti-ice system performance is maintained by the pilot through thrust
lever modulation (cyan line on N1 indication showing minimum N1 to meet wing anti-ice requirements)
• Idle modes only activated when thrust lever is in the idle detent
120
NOTES
-8EFLIGHTOPS.PPT
Icing
• Cowl anti-ice system protects inlet cowl lip only
• Turn on anti-ice prior to entering icing conditions
• If ice is inadvertently allowed to accumulate:– Retard one engine at a time to idle before
turning A/I on– Turn A/I on, monitor engine while increasing
thrust
121
NOTES
-8EFLIGHTOPS.PPT
Icing (Continued)
• While in icing conditions in flight and– N1 is less than 70% or– If fan/spinner ice build-up is suspected (high
indicated or perceived vibration):- Retard thrust lever towards idle, then advance to
minimum of 70% N1 for 10-30 seconds or until vibration ceases
- Return thrust lever to position required for flight conditions
– Repeat every 15 minutes as required

122
NOTES
-8EFLIGHTOPS.PPT
Landing/Reversing• Fan reversers only• FADEC controls N1 in full reverse
– Pilot can move thrust lever(s) to MAX REVERSE detent immediately, but thrust will be limited to idle until reverser(s) deployed
• Modulate reverse if full thrust not needed– Less thermal stress and mechanical loads– Reduced FOD
• Reduce reverse thrust at 80 KIAS• Forward idle by 60 KIAS

123
NOTES
-8EFLIGHTOPS.PPT
Reverse Thrust Effectiveness vs Airspeed
9,000
8,000
7,000
6,000
5,000
4,000
3,000
2,000
1,000
03020 40 50 60 70 80 90
0
50
100
150
Knots TAS
Netreversethrust
(lb/engine)
Percent N1
Training information only
Reverse thrust737-300/CFM56-3SL/STD dayFlaps 40
124
NOTES
-8EFLIGHTOPS.PPT
Shutdown• Cool-down prior to shutdown to thermally stabilize
engine hot section – Two minute cool-down after coming out of reverse
(includes normal taxi thrust lever movements)– One minute cool-down if required - minimize N1
during reverse– Five minute cool-down after high power ground
operation such as maximum power assurance check– Cool-down not required for emergency shutdown
• Monitor fuel flow, ITT, N1 and N2 for decrease

125
NOTES
-8E FLIGHTOPS.PPT
Reduced ThrustCF34-8E

126
NOTES
-8EFLIGHTOPS.PPT
Overview
• Definitions and restrictions
• Benefits
• Severity analysis
• Performance aspects
• Process map and cause/effect chart
• Summary
127
NOTES
-8EFLIGHTOPS.PPT
Reduced Thrust Versus Derate• Reduced thrust (Flex thrust) takeoff
– Takeoff at less than maximum takeoff thrust using the assumed temperature method or a fixed thrust reduction
– V-speeds used protect minimum control speeds for full thrust– Reduced thrust setting is not a limitation for the takeoff, i.e., full thrust may
be selected at any time during the takeoff
• Derated takeoff– Takeoff at a thrust level less than maximum takeoff for which separate
limitations and performance data exist in the AFM. Corresponds to an “alternate” thrust rating
– V-speeds used protect minimum control speeds for the derated thrust . . . not original maximum takeoff thrust
– The derated thrust setting becomes an operating limitation for the takeoff
• On some installations derated thrust and reduced thrust can be used together, e.g., a derated thrust can be selected and thrust further reduced using the assumed temperature method

128
NOTES
-8EFLIGHTOPS.PPT
AC 25-13 Restrictions• Reduced thrust setting must be at least 75% of the full thrust
rating or alternate thrust rating• A periodic takeoff demonstration must be conducted using full
takeoff thrust. An approved maintenance procedure or engine condition monitoring program may be used to extend the time interval between takeoff demonstrations
• Reduced thrust takeoffs may not be performed– On contaminated runways
• “More than 25 percent of the required field length, within the width being used, is covered by standing water or slush more than .125 inch deep or has an accumulation of snow or ice.”
– If anti-skid system is inoperative– These restrictions do not apply to “derated” takeoffs– Any other restrictions on reduced thrust or derated thrust are
imposed by the aircraft manufacturer or operator; not by AC 25-13

129
NOTES
-8EFLIGHTOPS.PPT
Typical Additional Restrictions on Reduced Thrust Takeoffs
• Possible windshear• Other MMEL items inoperative• Anti-ice used for takeoff• Takeoff with tailwind• Performance demo “required”
Note: These are typical restrictions that are applied by individual operators. Each additional restriction should be investigated to determine whether or not it is valid.
When assessing a reduced thrust program, the operator should examine the rationale for each of the additional restrictions that might exist and eliminate restrictions where consistent with flight safety.

130
NOTES
-8EFLIGHTOPS.PPT
Benefits of Reduced Thrust/Derate• Less severe operation due to lower
– Rotational speed– Temperature– Internal pressure
• Less severe operation tends to lower– ITT deterioration rate
• Increased time-on-wing– SFC deterioration rate
• Lower fuel burn over the on-wing life of engine– Maintenance costs
• Lower shop visit rate and cost per shop visit
• Reduced thrust on a given takeoff reduces engine stress level and probability of a failure on that takeoff

131
NOTES
-8EFLIGHTOPS.PPT
CF34-8E5A1 Engine Parameters(Full Versus Reduced Thrust) At Sea Level, Flat Rate Temperature of 30oC, 0.25 Mach, Typical New Engine
Full rated 25% reducedthrust thrust ∆% (or delta)
Thrust (lbs) 11087 8315 -25%
N1 (rpm) 6,878 6262 -9.0%
N2 (rpm) 16,670 16030 -3.8%
ITT (oC) 920 805 -115oC
PS3 (psia) 353 288 -18.4%
132
NOTES
-8EFLIGHTOPS.PPT
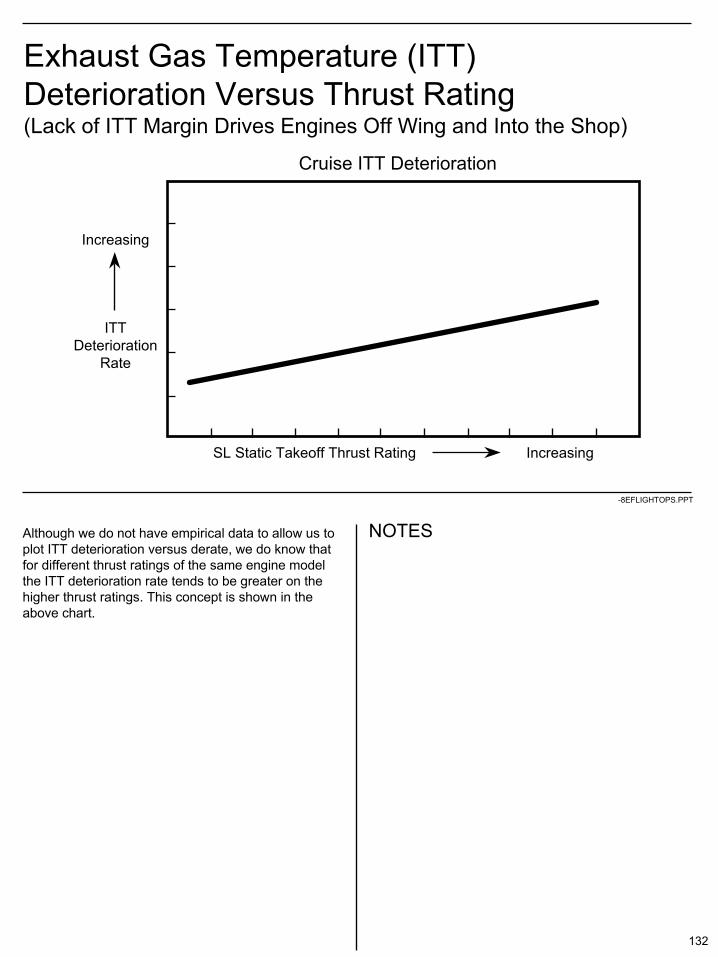
Exhaust Gas Temperature (ITT) Deterioration Versus Thrust Rating(Lack of ITT Margin Drives Engines Off Wing and Into the Shop)
Increasing
ITTDeterioration
Rate
Cruise ITT Deterioration
SL Static Takeoff Thrust Rating Increasing
Although we do not have empirical data to allow us to plot ITT deterioration versus derate, we do know that for different thrust ratings of the same engine model the ITT deterioration rate tends to be greater on the higher thrust ratings. This concept is shown in the above chart.

133
NOTES
-8EFLIGHTOPS.PPT
Specific Fuel Consumption (SFC)Deterioration Versus Thrust Rating(Rate of SFC Deterioration Impacts Fuel Costs)
Increasing
FFDeterioration
Rate
Cruise Fuel Flow Deterioration
SL Static Takeoff Thrust Rating Increasing
Although we do not have empirical data to allow us to plot SFC deterioration versus derate, we do know that for different thrust ratings of the same engine model the SFC deterioration rate tends to be greater on the higher thrust ratings. This concept is shown in the above chart.

134
NOTES
-8EFLIGHTOPS.PPT
Cycles to Shop Visit Versus Thrust Rating
Increasing
Cycles toShop Visit
Cycles to Shop Visit
SL Static Takeoff Thrust Rating Increasing
Although we do not have empirical data to allow us to plot cycles to shop visit versus derate, we do know that for different thrust ratings of the same engine model the cycles to shop visit tend to be lower on the higher thrust ratings. This concept is shown in the above chart.
135
NOTES
-8EFLIGHTOPS.PPT
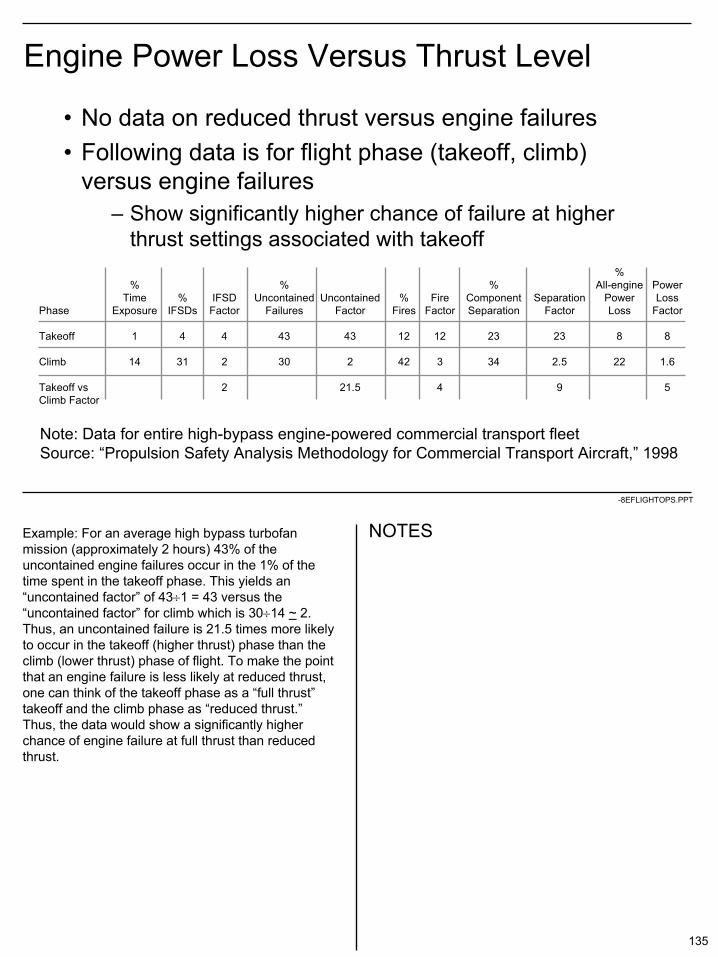
Engine Power Loss Versus Thrust Level
• No data on reduced thrust versus engine failures• Following data is for flight phase (takeoff, climb)
versus engine failures– Show significantly higher chance of failure at higher
thrust settings associated with takeoff%
% % % All-engine PowerTime % IFSD Uncontained Uncontained % Fire Component Separation Power Loss
Phase Exposure IFSDs Factor Failures Factor Fires Factor Separation Factor Loss Factor
Takeoff 1 4 4 43 43 12 12 23 23 8 8
Climb 14 31 2 30 2 42 3 34 2.5 22 1.6
Takeoff vs 2 21.5 4 9 5Climb Factor
Note: Data for entire high-bypass engine-powered commercial transport fleetSource: “Propulsion Safety Analysis Methodology for Commercial Transport Aircraft,” 1998
Example: For an average high bypass turbofan mission (approximately 2 hours) 43% of the uncontained engine failures occur in the 1% of the time spent in the takeoff phase. This yields an “uncontained factor” of 43÷1 = 43 versus the “uncontained factor” for climb which is 30÷14 ~ 2. Thus, an uncontained failure is 21.5 times more likely to occur in the takeoff (higher thrust) phase than the climb (lower thrust) phase of flight. To make the point that an engine failure is less likely at reduced thrust, one can think of the takeoff phase as a “full thrust” takeoff and the climb phase as “reduced thrust.” Thus, the data would show a significantly higher chance of engine failure at full thrust than reduced thrust.

136
NOTES
-8EFLIGHTOPS.PPT
Severity Analysis
• A means of quantifying and predicting mission severity based on how the engine is used
• Analysis and limited field data has shown that mission severity is a function of average flight length and the amount of reduced thrust used and is expressed as a “severity factor”

137
NOTES
-8EFLIGHTOPS.PPT
Severity Analysis (Continued)
• Application– Establish baseline severity factor using
• Actual flight length• Current effective derate*
–The sum of 3 “partial derates” representing takeoff, climb, and cruise
– When these values are varied, a new severityfactor results
– Impact on severity is estimated by ratioing the new severity factor to the baseline severity factor
* For the purpose of this discussion “derate” is used interchangeably with “reduced thrust”
138
NOTES
-8EFLIGHTOPS.PPT
Severity Analysis (Continued)
0 10 20 30
1-Hour Flight LengthTakeoff
Climb
Cruise
PartialDerate
(%)
16
12
8
4
Operational Derate (%)0 10 20 30
2-Hour Flight Length
Takeoff
ClimbCruise
Operational Derate (%)0 10 20 30
3-Hour Flight Length
Takeoff
ClimbCruise
Operational Derate (%)
2.0 4.0
1.6
1.2
0.8
0.4
0
SeverityFactor
Flight Length - Hours
01020
% Effective Derate
(Effective Derate = Partial Takeoff % + Partial Climb % + Partial Cruise %)
16
12
8
4
16
12
8
4
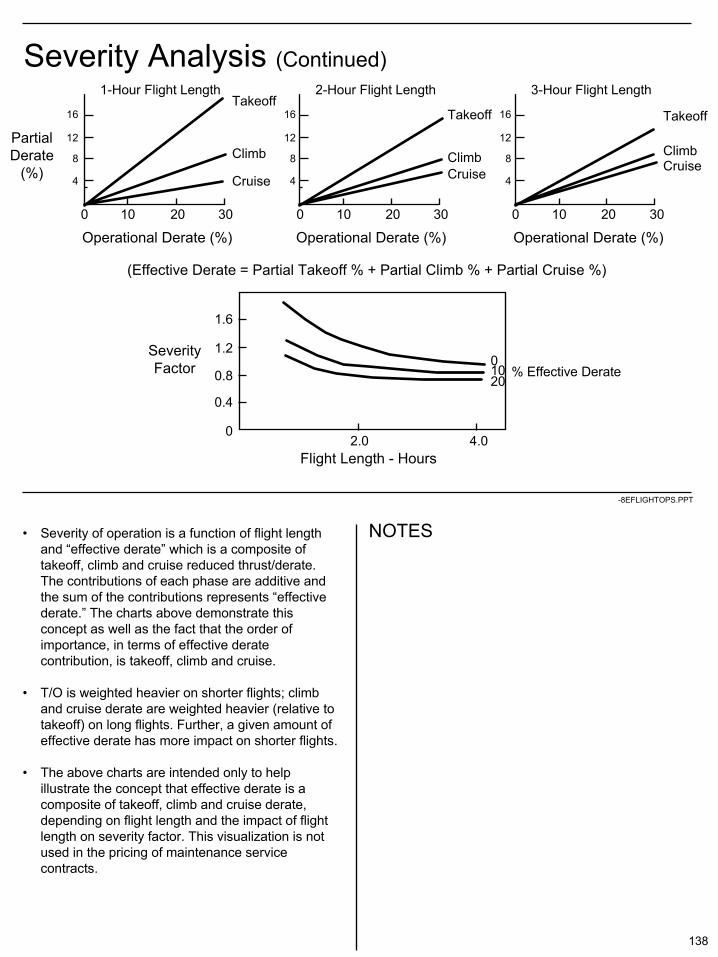
• Severity of operation is a function of flight length and “effective derate” which is a composite of takeoff, climb and cruise reduced thrust/derate. The contributions of each phase are additive and the sum of the contributions represents “effective derate.” The charts above demonstrate this concept as well as the fact that the order of importance, in terms of effective derate contribution, is takeoff, climb and cruise.
• T/O is weighted heavier on shorter flights; climb and cruise derate are weighted heavier (relative to takeoff) on long flights. Further, a given amount of effective derate has more impact on shorter flights.
• The above charts are intended only to help illustrate the concept that effective derate is a composite of takeoff, climb and cruise derate, depending on flight length and the impact of flight length on severity factor. This visualization is not used in the pricing of maintenance service contracts.

139
NOTES
-8EFLIGHTOPS.PPT
SeverityAnalysis(Continued)
CFM56 Severity Factor TableEffective Derate 0.0% 5.0% 10.0% 15.0% 20.0% 25.0%
Flight Length 0.25 4.686 3.653 2.966 2.502 2.185 1.966(Hours) 0.30 4.016 3.153 2.575 2.185 1.919 1.735
0.35 3.537 2.795 2.297 1.959 1.729 1.5700.50 2.676 2.151 1.795 1.553 1.387 1.2740.75 2.005 1.651 1.405 1.236 1.121 1.0441.00 1.670 1.400 1.210 1.078 0.988 0.9281.25 1.469 1.250 1.093 0.983 0.909 0.8591.40 1.383 1.186 1.043 0.943 0.874 0.8291.50 1.335 1.150 1.015 0.920 0.855 0.8131.75 1.239 1.079 0.959 0.875 0.817 0.7802.00 1.168 1.025 0.918 0.841 0.789 0.7552.20 1.122 0.991 0.891 0.819 0.771 0.7402.50 1.067 0.950 0.859 0.793 0.749 0.7213.00 1.000 0.900 0.820 0.762 0.722 0.6983.25 0.974 0.880 0.805 0.750 0.712 0.6893.50 0.952 0.864 0.792 0.739 0.703 0.6813.75 0.933 0.850 0.781 0.730 0.696 0.6753.50 0.952 0.864 0.792 0.739 0.703 0.6814.00 0.916 0.837 0.771 0.722 0.689 0.6694.50 0.888 0.816 0.755 0.709 0.678 0.6595.00 0.866 0.800 0.742 0.698 0.669 0.6525.50 0.848 0.786 0.731 0.690 0.662 0.6456.00 0.832 0.775 0.722 0.683 0.656 0.6406.50 0.820 0.765 0.715 0.677 0.651 0.6367.00 0.809 0.757 0.709 0.671 0.646 0.6328.00 0.791 0.743 0.698 0.663 0.639 0.6269.00 0.777 0.733 0.690 0.656 0.634 0.621
10.00 0.765 0.724 0.683 0.651 0.629 0.61712.00 0.749 0.712 0.674 0.643 0.623 0.611
This chart is used for illustrating the concept of severity factor. It is not intended for use in pricing maintenance contracts.

140
NOTES
-8EFLIGHTOPS.PPT
SeverityAnalysis(Continued)
CFM56 Partial DeratesFlight Time
Hours P T/O P CL P CR
0.25 0.8667 0.0900 0.04330.50 0.7817 0.1410 0.07730.75 0.7100 0.1790 0.11101.00 0.6400 0.2100 0.15001.50 0.5717 0.2400 0.18832.00 0.5200 0.2600 0.22002.50 0.4807 0.2723 0.24703.00 0.4500 0.2800 0.27003.50 0.4233 0.2843 0.29234.00 0.4033 0.2877 0.30904.50 0.3883 0.2907 0.32105.00 0.3767 0.2930 0.33035.50 0.3693 0.2950 0.33576.00 0.3630 0.2967 0.34036.50 0.3580 0.2980 0.34407.00 0.3533 0.2993 0.34737.50 0.3490 0.3003 0.35078.00 0.3450 0.3010 0.35408.50 0.3413 0.3017 0.35709.00 0.3380 0.3023 0.35979.50 0.3350 0.3027 0.3623
10.00 0.3323 0.3030 0.364711.00 0.3300 0.3033 0.366712.00 0.3280 0.3037 0.368313.00 0.3263 0.3040 0.369714.00 0.3250 0.3043 0.370715.00 0.3240 0.3047 0.371316.00 0.3233 0.3050 0.371717.00 0.3227 0.3053 0.372018.00 0.3220 0.3057 0.372319.00 0.3213 0.3060 0.372720.00 0.3207 0.3063 0.3730
141
NOTES
-8EFLIGHTOPS.PPT
Severity Analysis (Continued)
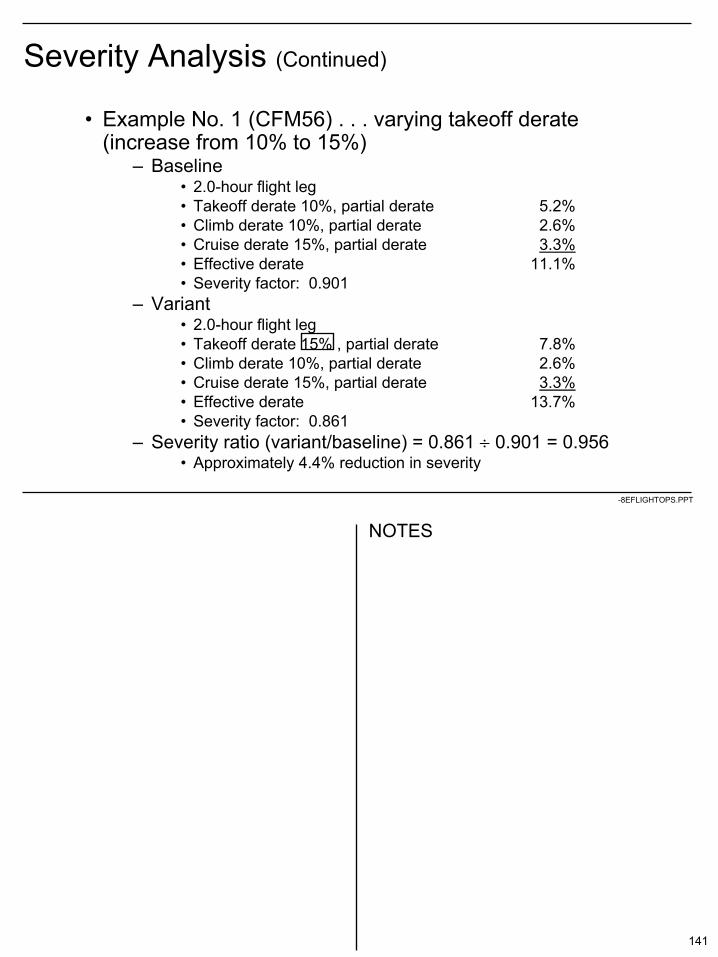
• Example No. 1 (CFM56) . . . varying takeoff derate(increase from 10% to 15%)
– Baseline• 2.0-hour flight leg• Takeoff derate 10%, partial derate 5.2%• Climb derate 10%, partial derate 2.6%• Cruise derate 15%, partial derate 3.3%• Effective derate 11.1%• Severity factor: 0.901
– Variant• 2.0-hour flight leg• Takeoff derate 15% , partial derate 7.8%• Climb derate 10%, partial derate 2.6%• Cruise derate 15%, partial derate 3.3%• Effective derate 13.7%• Severity factor: 0.861
– Severity ratio (variant/baseline) = 0.861 ÷ 0.901 = 0.956• Approximately 4.4% reduction in severity

142
NOTES
-8EFLIGHTOPS.PPT
Severity Analysis (Continued)
• Example No. 2 (CFM56) . . . varying climb derate(increase from 0% to 5%)
– Baseline• 2.0-hour flight leg• Takeoff derate 10%, partial derate 5.2%• Climb derate 0%, partial derate 0.0%• Cruise derate 15%, partial derate 3.3%• Effective derate 8.5%• Severity factor: 0.950
– Variant• 2.0-hour flight leg• Takeoff derate 10%, partial derate 5.2%• Climb derate 5% , partial derate 1.3%• Cruise derate 15%, partial derate 3.3%• Effective derate 9.8%• Severity factor: 0.922
– Severity ratio (variant/baseline) = 0.922 ÷ 0.950 = 0.971• Approximately 2.9% reduction in severity

143
NOTES
-8EFLIGHTOPS.PPT
Severity Analysis (Continued)
Estimated Severity Reduction Dueto the Use of Reduced Takeoff Thrust
0 5 10 15 20 25
EstimatedSeverity
Reduction -%
2-Hour Flight LegClimb Derate = 10%Cruise Derate = 10%
Average Takeoff Reduced Thrust - %
This chart represents the relative impact of reduced thrust increments on severity. Note that the slope of the curve is greater in the 0 to 5% increment than in the 20 to 25% increment, but that the slope is still substantially positive even at the higher increments of reduced thrust. This shows that the first increment of thrust reduction is the most important but that thrust reduction even at the higher increments is important.
144
NOTES
-8EFLIGHTOPS.PPT
Severity Analysis (Continued)
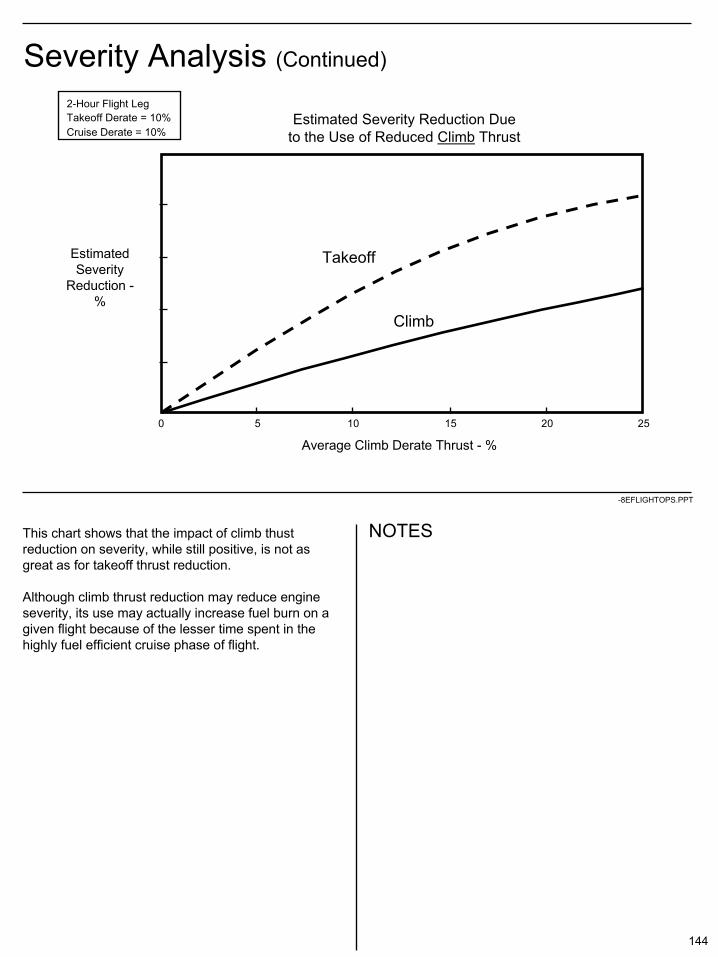
This chart shows that the impact of climb thust reduction on severity, while still positive, is not as great as for takeoff thrust reduction.
Although climb thrust reduction may reduce engine severity, its use may actually increase fuel burn on a given flight because of the lesser time spent in the highly fuel efficient cruise phase of flight.
Estimated Severity Reduction Dueto the Use of Reduced Climb Thrust
EstimatedSeverity
Reduction -%
2-Hour Flight LegTakeoff Derate = 10%Cruise Derate = 10%
Average Climb Derate Thrust - %
0 5 10 15 20 25
Takeoff
Climb

145
NOTES
-8EFLIGHTOPS.PPT
Performance Aspects• Logic for calculating reduced takeoff N1 with the assumed
temperature method:Note: this logic is incorporated in your FCOM/Operations Manualprocedures – not a manual crew calculation
– 1. Find allowable assumed temperature using takeoffanalysis chart
– 2. Find gage N1 (maximum) corresponding to assumed temperature
– 3. Convert the gage N1 (maximum) for the assumed temperature to a value of corrected N1 using the assumed temperature
• This represents the thrust required if actual temperature was equal to assumed temperature value
– 4. Convert this corrected N1 back to the gage N1 using the actual temperature
• This gage N1 value will yield a corrected N1 (and thrust) equivalent to that achieved in Step 3

146
NOTES
-8EFLIGHTOPS.PPT
Performance Aspects (Continued)
TISA TFRT TFTA
∆N1
OAT
N1 = Physical (gage) N1N1K = N1 corrected for temperature
N1
N1K
Obtain max assumed temp(TF) from airport analysis
Find max N1for TF
N1 max at TF correctedto N1K at TF
1.
2.
3.
N1K at TF decorrectedto N1 at ambient TA
4.
N1 with nothrust reduction
∆N1K
This is a graphic representation of the logic on previous chart

147
NOTES
-8EFLIGHTOPS.PPT
• Calculating reduced thrust N1 using the assumed temperature method
– Example 1737-400, CFM56-3B-2 (22k rating) engines. Temperature is 20oC, wind is calm, takeoff weight will be 52,300 kg
• From the takeoff analysis the assumed temperature will be 55oC• From the takeoff N1 chart the gage N1 at 55o is 93.8%• The corresponding corrected N1 is 87.9%
• The gage N1 for 87.9% corrected N1 at 20oC is 88.7%
Performance Aspects (Continued)
(20 + 273.16)288.16
87.9 X = 88.7
(55 + 273.16)288.16
93.8 ÷ = 87.9

148
NOTES
-8EFLIGHTOPS.PPT
Performance Aspects (Continued)
• For a given takeoff, there is obviously more performance margin at full thrust than at reduced thrust; however,
– Reduced thrust takeoffs meet or exceed all the performance requirements of the FAA and other regulatory agencies
– For a reduced thrust takeoff at a given assumed temperature, the performance margin is greater than for a full thrust takeoff at an ambient temperature equal to the assumed temperature
149
NOTES
-8EFLIGHTOPS.PPT
Performance Aspects (Continued)
• For reduced thrust case, V-speeds are based on assumed temperature while aircraft is operating under ambient temperature conditions
– Thus, TAS at a given V-speed is less• Significant improvement in field length
performance• No significant impact on climb-out performance
150
NOTES
-8EFLIGHTOPS.PPT
Performance Aspects (Continued)
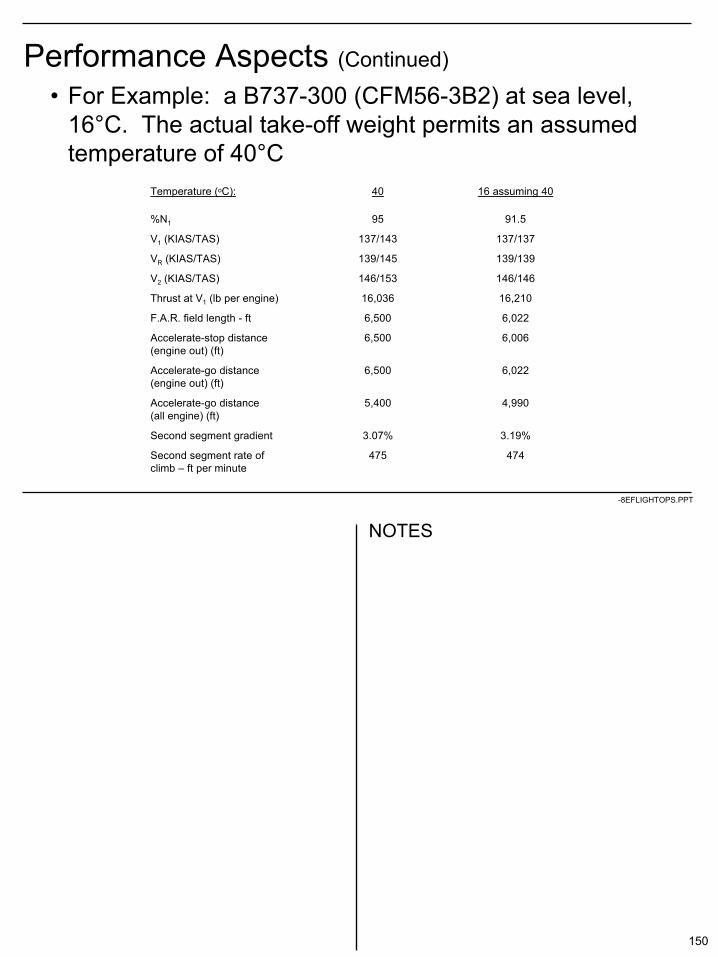
• For Example: a B737-300 (CFM56-3B2) at sea level, 16°C. The actual take-off weight permits an assumed temperature of 40°C
Temperature (oC): 40 16 assuming 40
%N1 95 91.5
V1 (KIAS/TAS) 137/143 137/137
VR (KIAS/TAS) 139/145 139/139
V2 (KIAS/TAS) 146/153 146/146
Thrust at V1 (lb per engine) 16,036 16,210
F.A.R. field length - ft 6,500 6,022
Accelerate-stop distance 6,500 6,006(engine out) (ft)
Accelerate-go distance 6,500 6,022(engine out) (ft)
Accelerate-go distance 5,400 4,990(all engine) (ft)
Second segment gradient 3.07% 3.19%
Second segment rate of 475 474climb – ft per minute
151
NOTES
-8EFLIGHTOPS.PPT
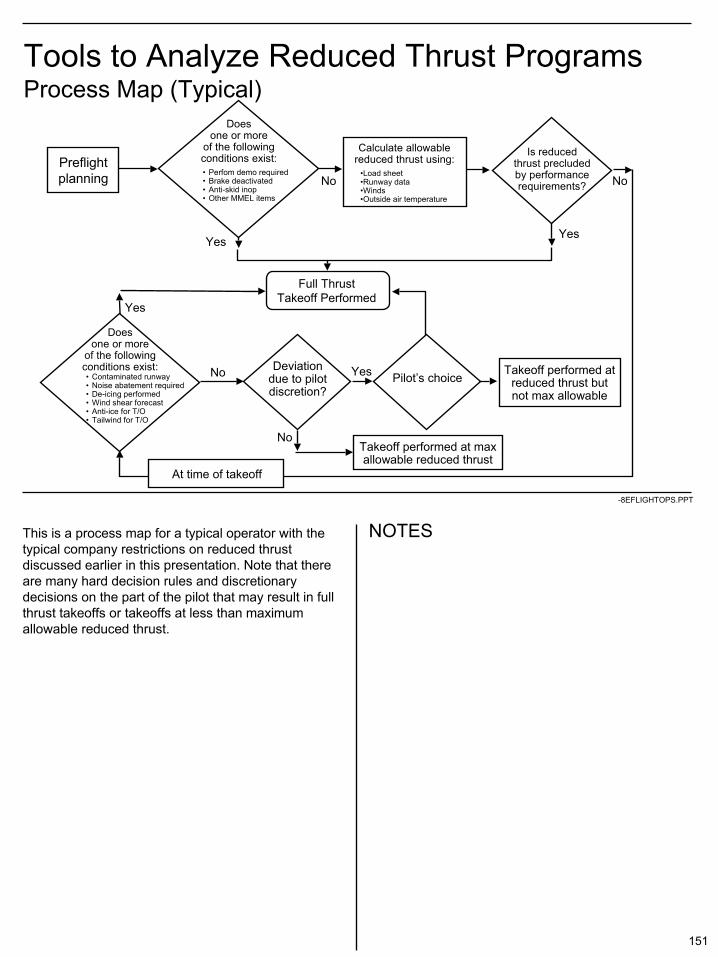
Tools to Analyze Reduced Thrust ProgramsProcess Map (Typical)
This is a process map for a typical operator with the typical company restrictions on reduced thrust discussed earlier in this presentation. Note that there are many hard decision rules and discretionary decisions on the part of the pilot that may result in full thrust takeoffs or takeoffs at less than maximum allowable reduced thrust.
Preflightplanning
Doesone or more
of the followingconditions exist:• Contaminated runway• Noise abatement required• De-icing performed• Wind shear forecast• Anti-ice for T/O• Tailwind for T/O
Calculate allowablereduced thrust using:
•Load sheet•Runway data•Winds•Outside air temperature
Is reducedthrust precludedby performancerequirements?
Full ThrustTakeoff Performed
Doesone or more
of the followingconditions exist:• Perfom demo required• Brake deactivated• Anti-skid inop• Other MMEL items
Deviationdue to pilotdiscretion?
Pilot’s choice
Takeoff performed at maxallowable reduced thrust
Yes
No No
Yes
Yes
YesNo
No
Takeoff performed at reduced thrust butnot max allowable
At time of takeoff
152
NOTES
-8EFLIGHTOPS.PPT
Periodic Takeoff Demonstrations• Operator methods vary e.g.
– Every tenth takeoff– Every Friday– Never make dedicated full thrust T/O for performance verification
• Take credit for ECM and full thrust T/O’s performed for operational reasons
• Less reduced thrust benefits acrue when unnecessary full thrust takeoffs are performed
• Full thrust takeoffs meaningful only when takeoff is performed at the flat rate temperature; otherwise the takeoff data must be extrapolated to flat rate temperature
– Reduced thrust takeoffs can be extrapolated as well– Cruise ECM data can also be used to predict ITT margin
• Negotiate with regulatory agency to extend interval between dedicated performance verification takeoffs
– Take credit for ECM programs (T/O or Cruise)– Take credit for full thrust takeoffs performed for operational requirements– Extrapolate data obtained during reduced thrust as well as full thrust takeoffs

153
NOTES
-8EFLIGHTOPS.PPT
Summary
• Reduced thrust benefits– Longer on-wing time between engine refurbishment– Fewer operational events due to high ITT– Lower fuel burn over on-wing life of engine– Lower probability of engine failure on a given takeoff– Lower maintenance costs
• Severity analysis helps estimate reduced thrust impact on engine severity factor
– Reduced thrust has significant impact on severity– Takeoff thrust reduction has greater impact than climb thrust
reduction– 1st increment of thrust reduction has greatest impact

154
NOTES
-8EFLIGHTOPS.PPT
Summary (Continued)
• Reduced thrust takeoffs meet or exceed FAR or other regulatory requirements
– Significant margin due to operation at actualambient temperature while V-speeds are based on assumed temperature
• May be useful to look at steps in reduced thrust process where use of reduced thrust might be compromised

155
NOTES
-8E FLIGHTOPS.PPT
Erosive FOD andVolcanic Ash
156
NOTES
-8EFLIGHTOPS.PPT
Erosive FOD
• What is it?– Dust– Sand– Volcanic ash– Debris from deteriorated
runways/ramps/taxiways
157
NOTES
-8EFLIGHTOPS.PPT
Effect on Engines
• Erodes airfoils resulting in:– Reduced parts life– Reduced ITT margin– Increased fuel consumption– Reduced airfoil strength (extreme case)– Reduced stall margin (extreme case)
• Blocks cooling flow passages– Higher temperatures for hot section parts
• May be incurred in single occurrence or cumulatively from frequent exposures

158
NOTES
-8EFLIGHTOPS.PPT
Sources
• Contaminated runways, taxiways, ramps• Airborne particles (dust, sand, volcanic ash)• High FOD potential areas:
– Desert and coastal airports– Airports with:
• Construction activity• Deteriorated runways/ramps/taxiways• Narrow runways/taxiways• Ramps/taxiways sanded for winter operations• Plowed snow/sand beside runways/taxiways
159
NOTES
-8EFLIGHTOPS.PPT
Engine Vortices
• Common cause of ingestion on ground• Strength increases at high thrust, low airspeed• Somewhat destroyed by:
– Airspeed– Headwind– General rules:
• 10 knots airspeed/headwind will destroy vortices formed up to 40% N1
• 30 knots airspeed will destroy vortices formed at typical takeoff thrust settings
160
NOTES
-8EFLIGHTOPS.PPT
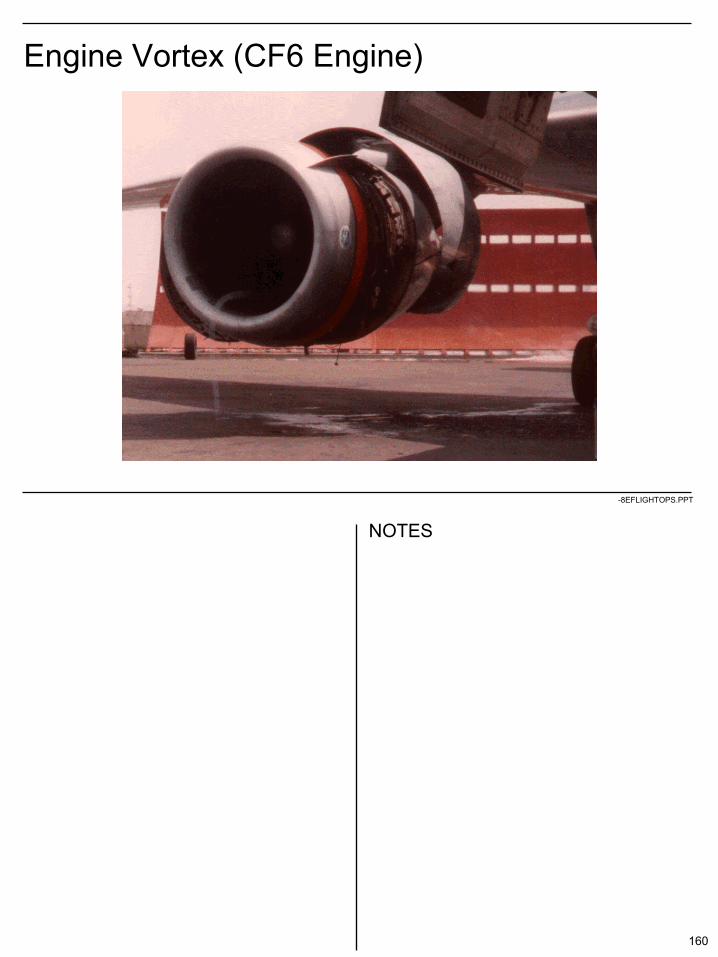
Engine Vortex (CF6 Engine)

161
NOTES
-8EFLIGHTOPS.PPT
Airspeed Effect on Vortex Formation(Data from scale model and actual engine ground tests)
N1, %
111102
70
50403020
100 20 30 40Air speed relative to inlet, knots
Vortex
No vortex
1/16 model, test 1455-115/4 in Cell 21/6 model, test 2
Legend
162
NOTES
-8EFLIGHTOPS.PPT
High Exposure Operations
• Thrust advance for breakaway from stop• 180 degree turn on runway or taxiway
– Overhang of unprepared surface– Thrust assist in turn from outboard engine
• Thrust advance for takeoff• Reverse thrust at low airspeed• Power assurance runs
163
NOTES
-8EFLIGHTOPS.PPT
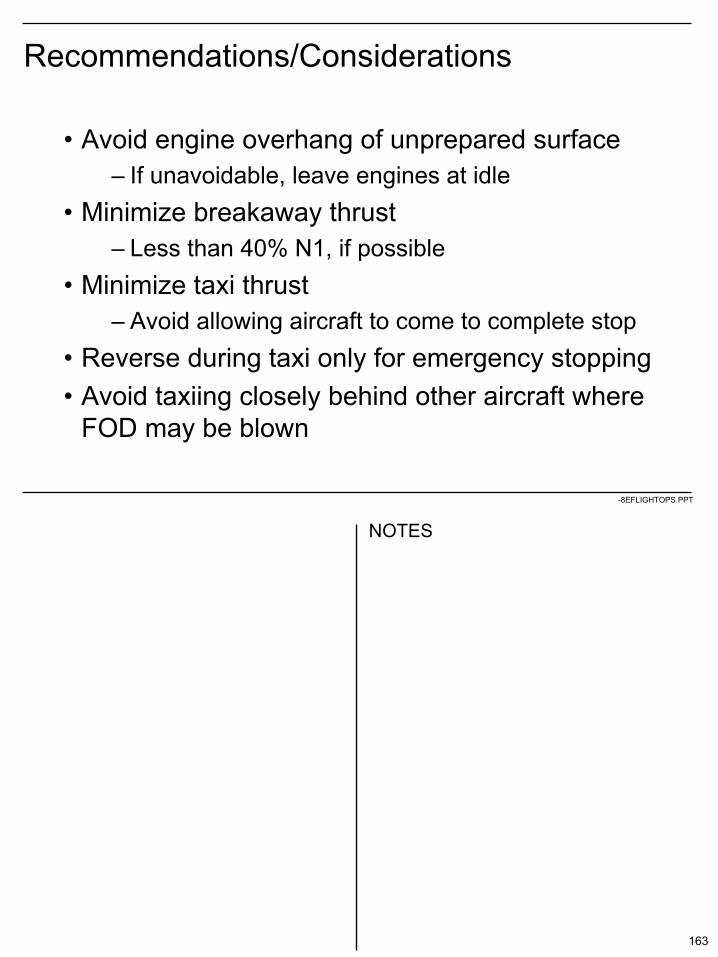
Recommendations/Considerations
• Avoid engine overhang of unprepared surface– If unavoidable, leave engines at idle
• Minimize breakaway thrust– Less than 40% N1, if possible
• Minimize taxi thrust– Avoid allowing aircraft to come to complete stop
• Reverse during taxi only for emergency stopping• Avoid taxiing closely behind other aircraft where
FOD may be blown
164
NOTES
-8EFLIGHTOPS.PPT
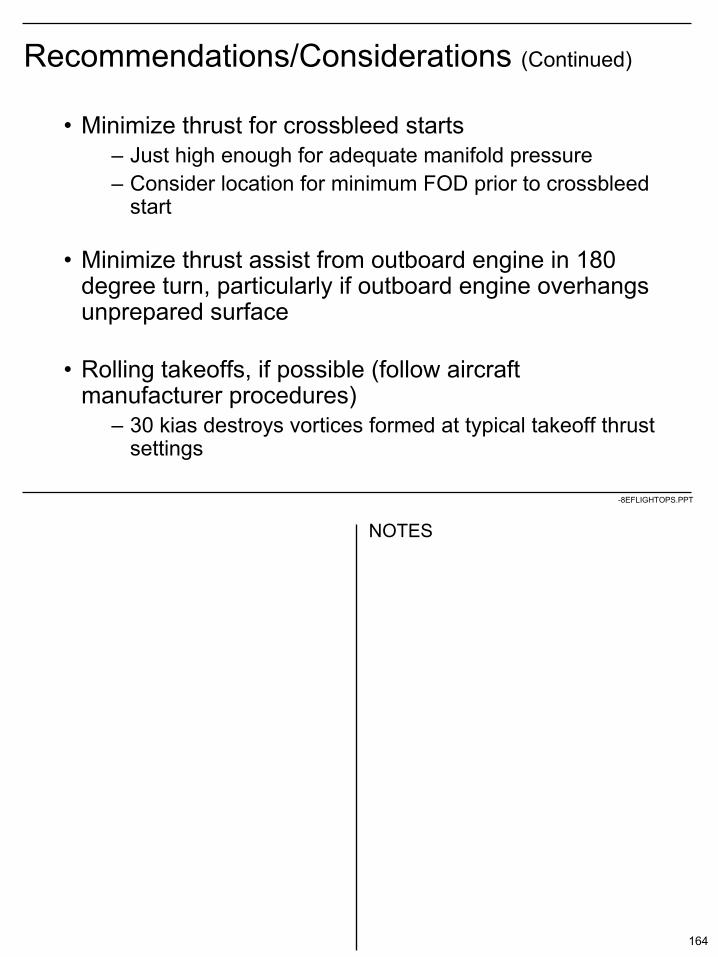
Recommendations/Considerations (Continued)
• Minimize thrust for crossbleed starts– Just high enough for adequate manifold pressure– Consider location for minimum FOD prior to crossbleed
start
• Minimize thrust assist from outboard engine in 180 degree turn, particularly if outboard engine overhangs unprepared surface
• Rolling takeoffs, if possible (follow aircraft manufacturer procedures)
– 30 kias destroys vortices formed at typical takeoff thrust settings

165
NOTES
-8EFLIGHTOPS.PPT
Recommendations/Considerations (Continued)
• Reverse thrust– Minimize reverse thrust use on contaminated runways
– Reverse thrust is more effective at high speed• Use high reverse thrust early, if necessary
– Start reducing reverse thrust per aircraft operations manual• For FOD conditions, at 80 kias, if practical
• Most installations are certified for full thrust use to 60 kias (without engine instability) but re-ingestion of exhaust gases/debris may occur at full reverse thrust below 80 kias
– Select forward thrust at taxi speed and before clearing runway
166
NOTES
-8EFLIGHTOPS.PPT
8,000
6,000
4,000
2,000
020 30 40 50 60 70 80 90
16,000
40 50 60 70 80 90 10030
12,000
8,000
4,000
0
150
100
50
0
Knots TAS
Netreversethrust(lb perengine)
Percent N1
“Training information only”Reverse thrust737-300/CFM56-3SL/Std dayFlaps 40
200Knots TAS
Netreversethrust(lb perengine)
Percent N1
“Training information only”Reverse thrust747-400/CF6-80C2SL/Std dayFlaps 30
150
100
60300
Effect of N1 and Airspeed onNet Reverse Thrust
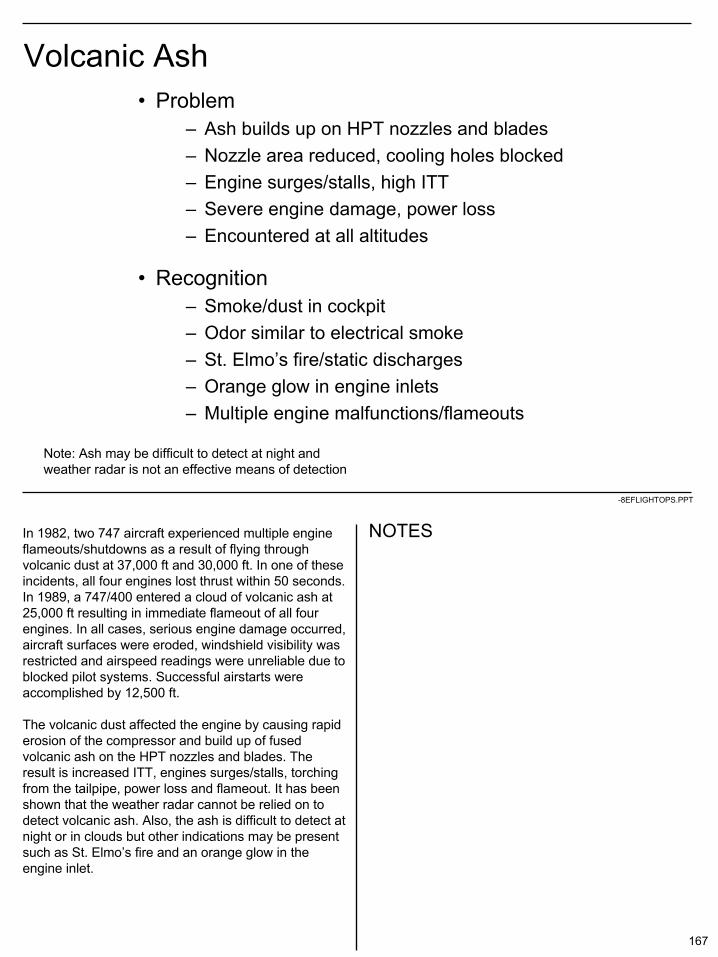
167
NOTES
-8EFLIGHTOPS.PPT
Volcanic Ash• Problem
– Ash builds up on HPT nozzles and blades– Nozzle area reduced, cooling holes blocked– Engine surges/stalls, high ITT– Severe engine damage, power loss– Encountered at all altitudes
• Recognition– Smoke/dust in cockpit– Odor similar to electrical smoke– St. Elmo’s fire/static discharges– Orange glow in engine inlets– Multiple engine malfunctions/flameouts
In 1982, two 747 aircraft experienced multiple engine flameouts/shutdowns as a result of flying through volcanic dust at 37,000 ft and 30,000 ft. In one of these incidents, all four engines lost thrust within 50 seconds. In 1989, a 747/400 entered a cloud of volcanic ash at 25,000 ft resulting in immediate flameout of all four engines. In all cases, serious engine damage occurred, aircraft surfaces were eroded, windshield visibility was restricted and airspeed readings were unreliable due to blocked pilot systems. Successful airstarts were accomplished by 12,500 ft.
The volcanic dust affected the engine by causing rapid erosion of the compressor and build up of fused volcanic ash on the HPT nozzles and blades. The result is increased ITT, engines surges/stalls, torching from the tailpipe, power loss and flameout. It has been shown that the weather radar cannot be relied on to detect volcanic ash. Also, the ash is difficult to detect at night or in clouds but other indications may be present such as St. Elmo’s fire and an orange glow in the engine inlet.
Note: Ash may be difficult to detect at night and weather radar is not an effective means of detection

168
NOTES
-8EFLIGHTOPS.PPT
CF6-80C2B1F Encounter
• December 1989, B747-400 descended inMt. Redoubt ash cloud
• Ash cloud had visual characteristics of normal overcast
• Cloud entry at 26,000 feet
• Dust/smoke in cockpit immediately after cloud entry
• Maximum climb thrust selected to climb out of ash

169
NOTES
-8EFLIGHTOPS.PPT
CF6-80C2B1F Encounter (Continued)
• After approximately one minute at high power, all four engines lost thrust (spooled down to below idle)
• After five or six start attempts, engine No. 1 and No. 2 restarted at 17,200 feet, engine No. 3 and No. 4 restarted at 13,300 feet
• Subsequent operation normal, but higher ITT levels

170
NOTES
-8EFLIGHTOPS.PPT
Fan and Spinner
• Spinner erosion was evident
• Fan blades were dusted with ash
• Fan blade outer panel leading edges were slightly roughened
• Light polishing was required to restore original finish
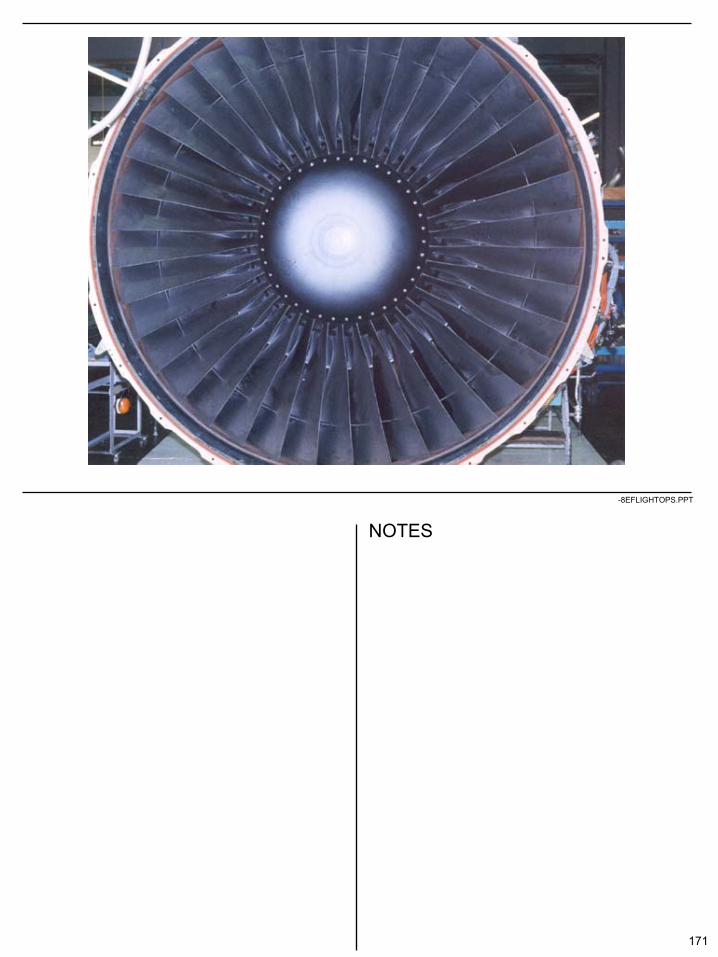
171
NOTES
-8EFLIGHTOPS.PPT

172
NOTES
-8EFLIGHTOPS.PPT
High Pressure Compressor Blades, Stage 10
• Leading edge erosion near the blade tip– Resulted in concave leading edge profile
• Blades were razor sharp on the corners and tips

173
NOTES
-8EFLIGHTOPS.PPT

174
NOTES
-8EFLIGHTOPS.PPT
Stage 1 High Pressure Nozzle Guide Vanes
• Surface deposits were recrystallized ash
• High temperature operation formed harder ceramic layer
– Total ash thickness was approximately 0.3 inch
• Ash buildup caused reduction in nozzle flow area– Increased compressor operating line– Reduced stall margin– Lowered HPT efficiency

175
NOTES
-8EFLIGHTOPS.PPT
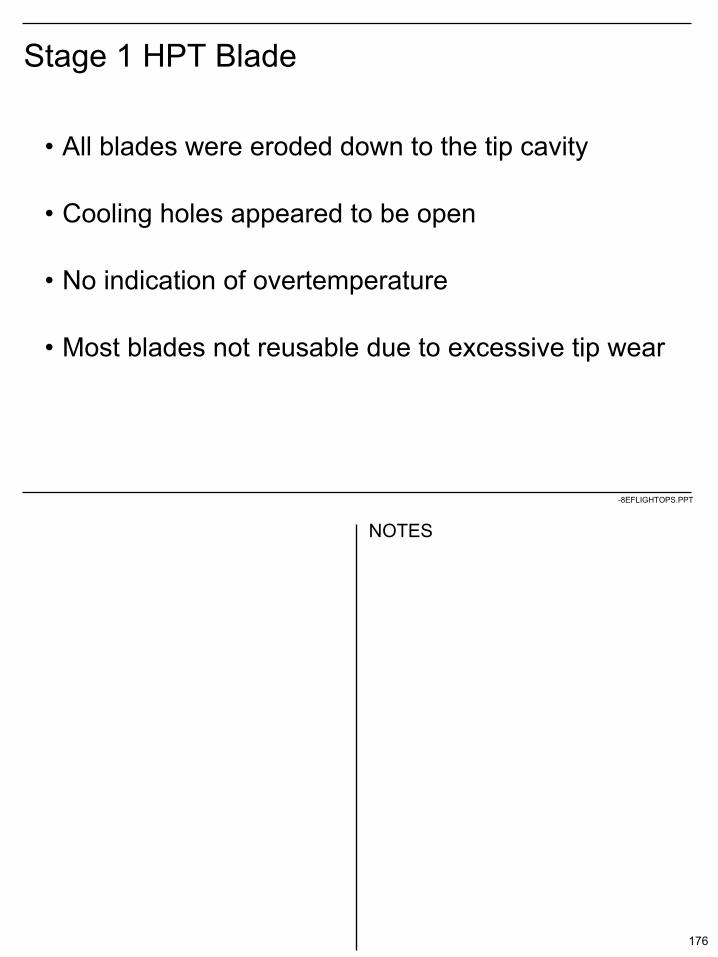
176
NOTES
-8EFLIGHTOPS.PPT
Stage 1 HPT Blade
• All blades were eroded down to the tip cavity
• Cooling holes appeared to be open
• No indication of overtemperature
• Most blades not reusable due to excessive tip wear

177
NOTES
-8EFLIGHTOPS.PPT

178
NOTES
-8EFLIGHTOPS.PPT
Volcanic Ash
• Recommendations– AVOID FLIGHT NEAR VOLCANIC ACTIVITY– Fly on upwind side of dust– If in dust, exit immediately– Turn on continuous ignition– Turn off auto-throttle– Reduce thrust to idle or low as practical– Turn on all available airbleed systems
• Wing and nacelle anti-ice• A/C packs on high
– If engine is shutdown/flameout, restart using published procedures– Resume normal operations upon exiting dust
Since severe consequences can result by flying through volcanic ash, the best policy is to avoid ash clouds. However, if volcanic ash is encountered, immediate action should be taken to leave the cloud by the shortest distance/time. Other procedures can be accomplished to reduce engine damage and possible loss of power. Turning off the auto-throttle prevents thrust levers from increasing thrust to recapture airspeed that is indicating low due to pitot system blockage with ash. By reducing power when encountering ash, the lower ITT will reduce the debris build up in the HPT. Turning on all bleed systems increases the stall margin. If the engine is shutdown due to overtemperature/stalls or flameouts, attempt restart(s) using flight manual procedures. Successful starts may not be possible until clear of the ash cloud and within the airstart envelope. At high altitude engines are slow to accelerate to idle which may be interpreted as a failure to start.
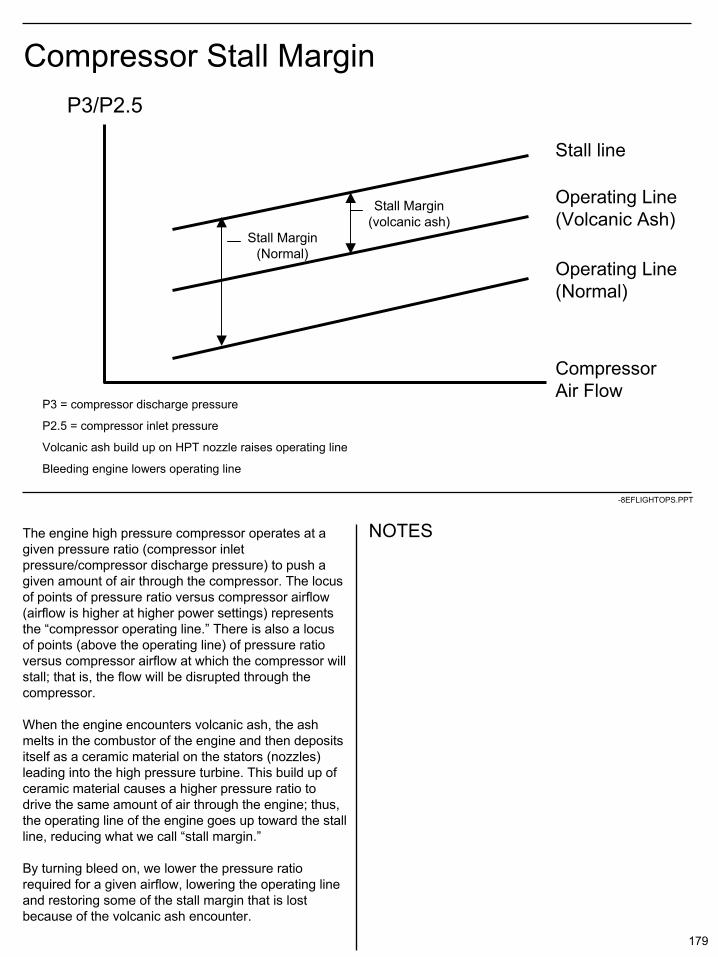
179
NOTES
-8EFLIGHTOPS.PPT
Compressor Stall MarginP3/P2.5
CompressorAir Flow
Stall line
Operating Line (Volcanic Ash)
Operating Line(Normal)
P3 = compressor discharge pressure
P2.5 = compressor inlet pressure
Volcanic ash build up on HPT nozzle raises operating line
Bleeding engine lowers operating line
Stall Margin(Normal)
Stall Margin(volcanic ash)
The engine high pressure compressor operates at a given pressure ratio (compressor inlet pressure/compressor discharge pressure) to push a given amount of air through the compressor. The locus of points of pressure ratio versus compressor airflow (airflow is higher at higher power settings) represents the “compressor operating line.” There is also a locus of points (above the operating line) of pressure ratio versus compressor airflow at which the compressor will stall; that is, the flow will be disrupted through the compressor.
When the engine encounters volcanic ash, the ash melts in the combustor of the engine and then deposits itself as a ceramic material on the stators (nozzles) leading into the high pressure turbine. This build up of ceramic material causes a higher pressure ratio to drive the same amount of air through the engine; thus, the operating line of the engine goes up toward the stall line, reducing what we call “stall margin.”
By turning bleed on, we lower the pressure ratio required for a given airflow, lowering the operating line and restoring some of the stall margin that is lost because of the volcanic ash encounter.

181
NOTES
-8EFLIGHTOPS.PPT
Inclement WeatherOperation

182
NOTES
-8EFLIGHTOPS.PPT
Inclement Weather Operation
• Rain and Hail
• Icing Conditions

183
NOTES
-8EFLIGHTOPS.PPT
Rain and Hail
• FAR 33 Requirements
– Water ingestion 4% by weight of engine airflow-idle to takeoff thrust
• Confirm operability (acceleration and stall/flameout resistance) in heavy rain
– Hail Testing• Confirm mechanical integrity after FOD
– Volleys of large hailstones fired at takeoff thrust• Confirm operability in heavy hailstorm conditions
(smaller hailstones but heavier concentration)
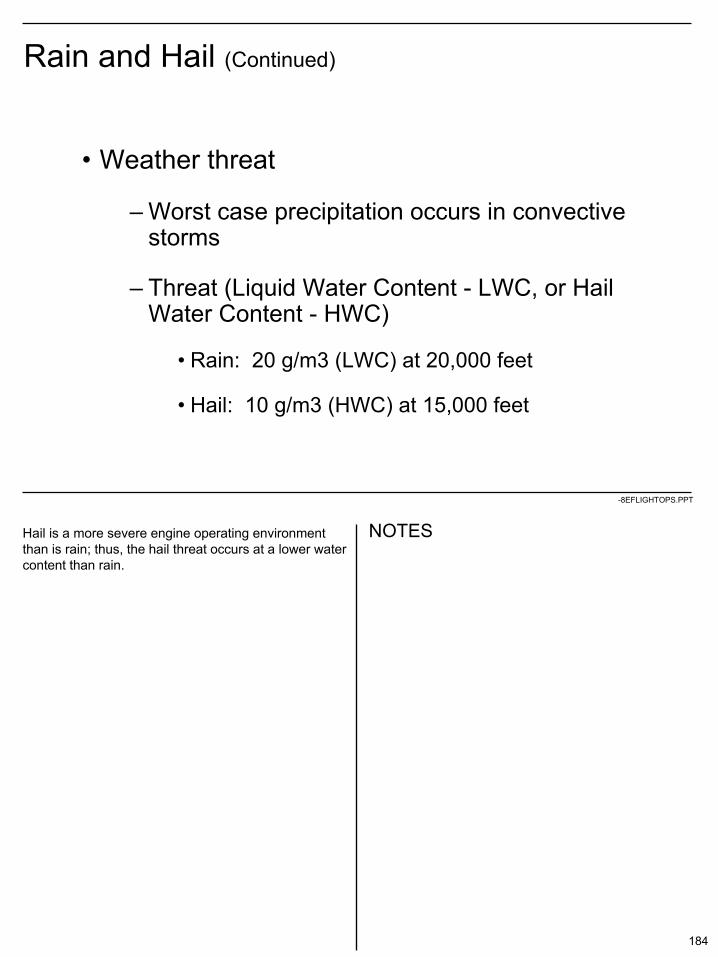
184
NOTES
-8EFLIGHTOPS.PPT
Rain and Hail (Continued)
• Weather threat
– Worst case precipitation occurs in convective storms
– Threat (Liquid Water Content - LWC, or Hail Water Content - HWC)
• Rain: 20 g/m3 (LWC) at 20,000 feet
• Hail: 10 g/m3 (HWC) at 15,000 feet
Hail is a more severe engine operating environment than is rain; thus, the hail threat occurs at a lower water content than rain.

185
NOTES
-8EFLIGHTOPS.PPT
Rain and Hail (Continued)
• Effect on engine operation– Reduces engine tolerance to:
• Engine rollback• Surge/stall• Flameout
• Effect varies with:– Engine speed– Aircraft speed– Engine configuration/geometry– Type of precipitation

186
NOTES
-8EFLIGHTOPS.PPT
Rain and Hail (Continued)Migration of Operating Line
Fuel flow (WF)Burner pressure (PS3)
Rollback
Operating line in water
Accel schedule
Operating line dry
Decel schedule
Core speed (N2)
In rain and hail conditions, the engine requires a higher WF/PS3 ratio to maintain a given N2. The WF/PS3 ratio to run at a given N2 eventually is constrained by the maximum accel schedule. At this point N2 will roll back on the accel schedule, which may lead to a flameout.
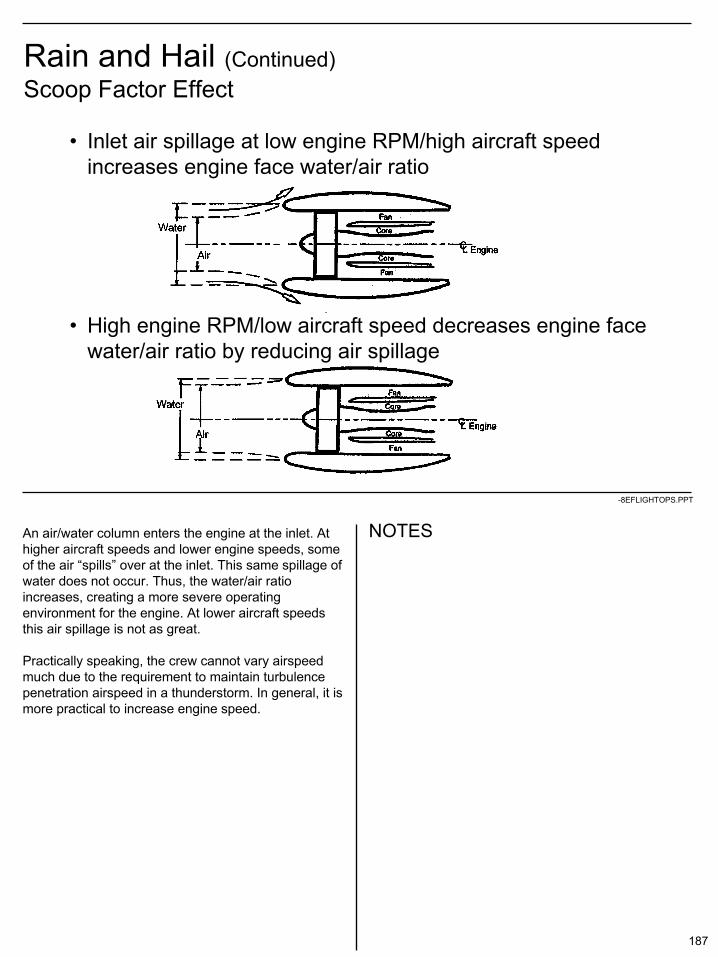
187
NOTES
-8EFLIGHTOPS.PPT
Rain and Hail (Continued)Scoop Factor Effect
• Inlet air spillage at low engine RPM/high aircraft speed increases engine face water/air ratio
• High engine RPM/low aircraft speed decreases engine face water/air ratio by reducing air spillage
An air/water column enters the engine at the inlet. At higher aircraft speeds and lower engine speeds, some of the air “spills” over at the inlet. This same spillage of water does not occur. Thus, the water/air ratio increases, creating a more severe operating environment for the engine. At lower aircraft speeds this air spillage is not as great.
Practically speaking, the crew cannot vary airspeed much due to the requirement to maintain turbulence penetration airspeed in a thunderstorm. In general, it is more practical to increase engine speed.

188
NOTES
-8EFLIGHTOPS.PPT
Rain and Hail (Continued)
Coniptical
ConicalElliptical
The “coniptical” spinner is a compromise between the conical and elliptical and is used on the newer engine models.
Note: This spinner design is on the GE90, CFM56-7 and CF34-8E
Configuration effects• Coniptical spinner - used on new
GE/CFMI engines

189
NOTES
-8EFLIGHTOPS.PPT
Rain and Hail (Continued)
• GE/CFM analysis and testing– Driven by CFM56-3 flameouts in late 1980’s– Extensive analysis– Ground test
• Water and hail (necessitated developing new test rig)• CFM56-3 (various configurations)• CF6-50 (as baseline…this engine was the standard)
– Flight test• Water only…USAF KC135 tanker with water flow capability• B707 test bed with CFM56-3 engine installed• A300B with CF6-50 engines installed
– Correlated flight tests with ground tests
190
NOTES
-8EFLIGHTOPS.PPT
Rain and Hail (Continued)
• Operational recommendations– Avoidance– If encountered:
• Ignition-on• Engine anti ice-as required by FCOM/OM• Auto-thrust-off• Increase engine speed, if practical• Avoid rapid thrust lever movements• APU-start (if available)
– If power loss is experienced• Use appropriate published aircraft manual procedures
– Note: Restart may not be possible until exiting rain/hail conditions
These are generic recommendations made by an industry committee formed to address the issue of power loss in rain and hail conditions. These recommendations have been incorporated to various degrees by the aircraft manufacturers, depending on applicability and manufacturer philosophy.
For example, Boeing has the discussion on the following chart for the B737 classic, which is non-FADEC and does not have auto-relight capability. For commonality with the NG airplane they have the same procedure even though the CFM56-7 installation has the auto-relight feature.
Airbus, with all CFM56 FADEC (auto-relight) engines on their airplanes does not have a procedure.
In any case, avoidance of thunderstorms and hail by overflight or circumnavigation is always a prudent course. Although extremely unlikely, there is always a possibility that the airplane could encounter conditions more sever than those to which the engine/airplane is certified.

191
NOTES
-8EFLIGHTOPS.PPT
IcingAreas of Engine Icing
Spinner
Inlet
Fan blades
Fan OGV’s
HPC first Stages

192
NOTES
-8EFLIGHTOPS.PPT
IcingAreas of Engine Icing (Continued)
• Spinner shape– Conical: Provides best ice accretion characteristics (minimizes)– Elliptical: Provides best hail ingestion capability– Coniptical: A compromise between ice accretion characteristics and hail
ingestion capability
• Fan icing appears on leading edge and pressure face of the fan blades and decreases from the root to the tip (centrifugal effect)
Conical Elliptical Coniptical

193
NOTES
-8EFLIGHTOPS.PPT
Spinner Ice Build Up, CFM56-5A

194
NOTES
-8EFLIGHTOPS.PPT
Spinner Ice Build Up, CFM56-3

195
NOTES
-8EFLIGHTOPS.PPT
Fan Blade and OGV Ice Build Up, CFM56-3
196
NOTES
-8EFLIGHTOPS.PPT
Icing (Continued)
• Effects on engine– Operability
• Ice ingestion into HPC may cause compressor stall, power loss, etc.
– Engine hardware• Ice slab ingestion may cause damage to fan or compressor
– External source– Late application of engine anti-ice
• Ice shed from fan or spinner may cause acoustic panel or fan blade tip damage
• Asymmetric ice accretion on the fan and spinner may cause high vibration
197
NOTES
-8EFLIGHTOPS.PPT
Icing (Continued)
• Recommendations– Anti-ice system protects inlet cowl lip only– Use engine anti-ice during all defined icing conditions– Turn on anti-ice prior to entering icing conditions– Perform ice shed procedure as prescribed in aircraft
operations documents– If ice is inadvertently allowed to accumulate on the inlet
• Retard one engine at a time to idle before turning A/I on• Turn A/I on, monitor engine while increasing thrust

198
NOTES
-8EFLIGHTOPS.PPT
Icing (Continued)
De-ice inlet, spinner and fan prior to engine start– Use hot air if practical
• Ensure any melted ice/snow does not refreeze near fan blades (check for fan rotation prior to engine start)
– De-icing/anti-icing fluid may be used if hot air de-icing is not practical
• Engine must be off • Avoid spraying de-icing/anti-icing fluid into engine compressor
– Do not spray de-icing/anti-icing fluid into a running engine• May cause “hot corrosion” of turbine components• May result in increased maintenance costs
– If fan/spinner cannot be deiced prior to starting, use fan/spinner ice shedding procedures prior to takeoff
• May result in economic damage to engine
Removal of Ice/Snow Prior to Engine Start - Recommendations

199
NOTES
-8EFLIGHTOPS.PPT
Icing (Continued)Ice Shedding (Ground)
• Ground operation in icing conditions– During ground operations of more than 30 minutes in icing
conditions or if excessive fan vibration due to fan ice accumulation is present, increase to approximately 54 percent N1 and hold at that thrust level for 30 seconds or until fan vibration level returns to normal
• Allows immediate shedding of fan blade root and spinner ice• De-ices stationary vanes with combination of shed ice impact,
pressure increase and adiabatic temperature rise (typical rise across fan is about 20°F)
– Perform this procedure• Every 30 minutes• Just prior to or in conjunction with the takeoff procedure, with
particular attention to engine parameters prior to final advance to takeoff thrust

200
NOTES
-8EFLIGHTOPS.PPT
Icing (Continued)Ice Shedding (Flight)
• While in moderate or severe icing conditions and– If fan ice build up is suspected (high indicated or
perceived vibration):• One engine at a time, reduce towards idle then
advance to a minimum of 70% N1 for 10 to 30 seconds, then return thrust lever to position required for flight conditions
– Repeat every 15 minutes or as often as required
201
NOTES
-8EFLIGHTOPS.PPT
Typical CF6 Icing Event
• Low power descent caused ice build-up
• When power applied at level off, ice started shedding and vibs increased dramatically at about 70%
• Vibs reduced with further acceleration and subsequent deceleration

202
NOTES
-8EFLIGHTOPS.PPT
Typical CF6 Icing Event (Continued)
100
90
80
70
60
50
40
30
20
10
0
10
9
8
7
6
5
4
3
2
1
00 20 40 60 80 100 120 140 160 180
%N1 Fan vibes(units)
Time (seconds)
Ice shedpoint
N1
Fan vibes
Indications on other engine models would be similar.

