cfd analysis of combustion and emissions to study the ......advanced computational fluid dynamics...
TRANSCRIPT

CFD analysis of combustion and emissions to study the effect of compression ratio and biogas substitution in a diesel engine with
experimental verification. .
Shaik Magbul Hussain1*, Dr.B. Sudheer Prem Kumar2,Dr.K. Vijaya Kumar Reddy3
1* Associate Professor, Mechanical Engineering Dept., Royal Institute of Tech. & Science, Chevella, Hyderabad, India.
2Vice-Principal, JNTU College of Engineering, Jagtial, Andhra Pradesh, India. 3Professor, Mechanical Engg. Dept., JNTU College of Engineering, Hyderabad, Andhra Pradesh, India.
1*Corresponding Author: E-mail: [email protected] Abstract Advanced computational fluid dynamics (CFD) simulations of engine reacting flow processes have emerged as a complementary and efficient design tool for the development of the next-generation engines. Many of the early multi-dimensional CFD attempts to predict engine combustion rates were conducted using simplified chemistry. In the present study, Biogas-Diesel dual fuel combustion CFD analysis is carried out using FLUENT software to study the effect of Biogas substitution on turbulent kinetic energy, Turbulent Dissipation Rate, Combustion flame velocity, and NOx formation for five compression ratios. For Turbulence analysis, RNG κ−ε model is used, which is further modified for the dual fuel analysis. Meshing of the combustion chamber is carried out using GAMBIT, by tetrahedral element using cooper tool. To analyze the effect of compression ratio in dual fuel mode, compression ratios were varied along with Bio-gas substitutions. To validate CFD results, experimental investigations were carried out, which showed a good agreement between the predicted and experimental results. 1.Introduction As the reserves of fossil fuels have decreased, alternate fuels as well as alternative power sources have become more and more important. The fueling of classical IC engines with biogas represents the other possibility of biogas utilization as the alternate renewable fuel. It is a very convenient fuel for reciprocating engines, which is able to fulfill all future requirements concerning emission formation and engine efficiency. An optimization of performance could be achieved if the diesel engines are supplied with premixed biogas gas and is ignited by the combustion flame initiated by a diesel spray, and subsequently supplied with the controlled supply of diesel. Pure biogas fueled engine performance is better at very high compression ratios, which are practically difficult, and the complete engine needs to be re designed. Instead if biogas is supplied in diesel engine in dual fuel mode with the controlled supply of diesel, the existing diesel engine could be used without any modifications and with considerable reduction in pollution. Light load operation of dual fuel engines, associated with the use of very lean gaseous fuel-air mixtures produces relatively significant exhaust concentrations of unconverted methane and carbon monoxide, especially when small pilot liquid fuel injection is involved [3, 12]. Natural gas in combination with diesel was tried and found to be very effective in NOx reduction but engine operation can suffer from high hydrocarbons (HC) emissions and poor performance, especially at high loads [1,9]. The auto ignition of methane was studied experimentally to obtain ignition delay data as a function of engine cylinder pressure and temperature by Sandia Group [2, 6]. Polasek, et al. [8] has developed an application of advanced simulation and modeling of biogas-fueled engine. Two models have been applied i.e. 0-D algorithm and CFD. The 0-D model has been based on GT-Power code. The CFD model has been based on advanced Multizone Eulerian Model representing general method of finite volume. The influence of main engine parameters e.g. excess air, spark timing, compression ratio, on NOx formation and engine efficiency has been investigated and reported. Experimental investigation on a LPG – diesel dual fuel engine by Poonia, et.al, revealed that at low loads, the brake thermal efficiency is always lower than diesel values but is better at high loads. Also, at low outputs increasing the pilot quantity and intake temperature improves the thermal efficiency. The HC and CO emissions were found to increase in the dual fuel mode. The objective of the present work was to carry out the CFD analysis to analyze the combustion and emissions for Biogas-Diesel combination in dual fuel
Shaik Magbul Hussain et al. / International Journal of Engineering Science and Technology (IJEST)
ISSN : 0975-5462 Vol. 4 No.02 February 2012 473

engine by (1) varying the compression ratio (2) by varying the biogas substitution over a wide range and to (3) Experimentally verify the results.
Model Formulation:
The drawback of lean operation with hydrocarbon fuels is the reduction in power output. Lean mixtures are hard to ignite, despite the mixture being above the Low fire (point) limit of the fuel. Lean burning results in misfire, which increases unburned hydrocarbon emissions, reduces performance and wastes fuel. Biogas can be used in conjunction with compact liquid fuels such as gasoline; alcohol or diesel provided each is stored separately. Mixing biogas with other hydrocarbon fuels reduces all of these drawbacks. Biogas lowers the ignition limit and high burning speed makes the biogas/hydrocarbon mixture easier to ignite, reducing misfire and thereby improving emissions, performance and fuel economy. Regarding power output, biogas augments the mixture’s energy density at lean mixtures by increasing the biogas-to-carbon ratio, and thereby improves torque at wide-open throttle conditions. Biogas cannot be used directly in a diesel (or “compression ignition”) engine since biogas auto ignition temperature is too high (this is also true of natural gas). Thus, diesel engines must be outfitted with spark plugs or use a small amount of diesel fuel to ignite the gas (known as pilot ignition). Although pilot ignition techniques have been developed for use with natural gas, no one is currently doing this with biogas.
Combustion Model:
The Standard Characteristics – time combustion model calculates the equilibrium concentration of each species and the corresponding laminar and turbulent characteristic times to determine the reaction rates [5]. Seven major combustion species are considered, fuel, O2, N2, CO2, H2, H2O and CO. The time rate of change of the concentration of species m is given as [5]. dYm /dt = (Ym – Y* m) / τc, where Ym is the concentration of species m, Y*m, is the local and instantaneous thermodynamic equilibrium concentration, and τc is the chemical conversion time to achieve equilibrium. The chemical conversion time is calculated as the sum of a kinetic laminar time scale τl and a turbulent mixing time scale τt as follows: τc = τl + f τt. --- (5) The variable f is a delay coefficient that simulates the influence of turbulence on the combustion after ignition has occurred. [5]. f = 0, prior to combustion and f=1 when combustion is complete. The Laminar timescale is derived from a one-step kinetic reaction rate is modified as [4], τl = A-1 [CnH2n+2] 0.75 [O2] –1.5exp (E/RuT) --- (6) Where A is a constant equal to 1.2 x 10⁶ , E is the activation energy 18,479 cal/mol, Ru is the universal gas constant, and T is the local gas temperature. One or more turbulent flames that are Initiated by the ignition of diesel fuel consume the biogas gas and air mixture. The main heat release occurs in a thin reaction sheet, i.e. a flame that separates the burned and unburned gases. The flame front is tracked by a level set method that was developed for premixed combustion. [7,11]. The turbulent time scale is based on the eddy breakup concept and modeled as [5], τl = Cm2 k / ε, -- (7) where Cm2 is a model constant for mixing characteristics in the engine, k is the turbulent kinetic energy, and ε is its dissipation rate. In order to apply the above models to simulate dual fuel combustion, some modifications were needed. In the Biogas /diesel, duel fuel engine, it is known that the combustion is initiated by the auto-ignition of the diesel fuel. Thus SHELL model [10] was used to predict the diesel fuel ignition. Only diesel was considered to be the fuel for ignition prediction. However the combustion characteristics of the diesel fuel and Biogases are different and hence the combustion model needs to be modified. In the previous research by Zhang et.al. [13], the reaction timescale were evaluated at different locations based on the local composition of fuel. It is now required that use of a different turbulent mixing model constant for each fuel based on relative amount of Biogas gas and diesel fuel in each computational cell would be required. Thus, the model constant Cm2 was modified as: Cm2 = 1.8 (1-x) + 0.4x, --- (8) x = ρdiesel / ρdiesel + ρBiogas --- (9) Where ρdiesel & ρBiogas are local partial densities of the diesel and Biogas gas respectively. The constants in eq. (8) were empirically by modeling the present duel fuel combustion and pure Biogas and pure diesel cases separately.
CFD Analysis:
CFD Analysis was carried out using FLUENT for the combustion and emission analysis of biogas-diesel dual fuel mode by varying the percentage of biogas substitution and for each variation of biogas in the fuel mixture, here only the emission analysis is reported. Diesel was injected with a nozzle of 0.15 dia. At a pressure of 160bar, air was inducted at atmospheric temperature & pressure and biogas was injected through the injector at a pressure of 60bar directly into the combustion chamber. The exhaust species analysis for dual fuel analysis was also verified experimentally. The computer simulation and CFD results obtained were compared with that of experimental work for the code and model validation. Diesel and biogas were injected at the same injection angle of 200 BDTC. Each time hydrogen was varied by 20% and analyses carried out for NOx, N2, CO2, H2O, were noted along with temperature and pressure. The results obtained were compared with the simulation results. Both the simulation and CFD results were compared with the experimental values for the validation of code and confirmation.
Shaik Magbul Hussain et al. / International Journal of Engineering Science and Technology (IJEST)
ISSN : 0975-5462 Vol. 4 No.02 February 2012 474

2.EXPERIMENTAL SETUP :
The engine used in the present study was a Kirloskar AV-1, single cylinder direct injection diesel engine with the specifications given in Table1.
Specifications : Table 1
Type 4-stroke,single cylinder,
Compression ignition engine with variable compression ratio.
Make Kirloskar AV-1 Rated Power 3.7 KW,1500RPMBore &Stroke 85mmx110mm Compression Ratio 16.5:1varible from 14.3to 24.5Cylinder Capacity 624 CC Dynamometer Electrical-AC AlternatorCylinder Pressure Piezo sensor,Range:2000psiOrifice Dia. 0.15mm Fuel Diesel, Biogas Biogas injection By CNG injector & by induction
method. Diesel was injected with a nozzle of hole size of 0.15mm; Biogas was injected by a Biogas injector. Simultaneous provision is also provided for biogas induction through inlet manifold, this is to compare the effect of injection verses induction. The engine was coupled to a DC dynamometer and all the experiments were carried out a constant speed of 1400 rpm. Crank-angle-resolved in-cylinder pressure and the diesel injection pressure were measured. A computer interfaced Piezoelectric sensor, of Range 145 bar was used to note the in cylinder pressure. Pressure signals were obtained at one-degree crank angle intervals using a digital data acquisition system. The average pressure data from 100 consecutive cycles were used for calculating combustion parameters. Special software was used to obtain combustion parameters. The special software stores the data of pressures and volumes corresponding to a particular crank angle location for plotting the P-V and P-θ curves. The Software also provides the facility of analyzing the combustion data such as the Rate of Heat-Release; peak pressures and stores it separately for analysis in the computer system. The experiments were carried out first by injecting biogas at a pressure of 60bar, and then it was repeated for the same operating conditions by induction into the manifold at atmospheric pressure, while the diesel was directly injected into the cylinder in both the cases at a pressure of 160bar. Biogas flow rate was controlled by a mass flow controller. The airflow rate was measured using a laminar flow element. The engine speed was maintained constant by controlling the Biogas gas mass flow rate. Engine exhausts emissions were measured using an advanced AVL five-gas analyzer, which is a non-dispersive infrared gas analyzer. The sample to be evaluated is passed through a cold trap to condense the water vapors, which influences the functioning of the infrared analyzer. The exhaust gas analyzer is calibrated periodically using standard calibration gas. The hydrocarbons and NOx are measured in terms of parts per million (ppm) as hexane equivalent and carbon monoxide emissions are measured in terms of percentage volume. Standard Bosch smoke measuring instrument is used to measure the exhaust smoke emission from the engine.
3.RESULTS AND DISCUSSIONS 3.1. Analysis of Effect of compression ratio: (a) Effect of compression ratio on combustion Velocity: As the compression ratio increases the pressure and temperature of the working mixture increases, which reduces the initial preparation phase of combustion and hence less ignition advance is needed. High pressures and temperatures also speed up the second phase combustion. Increased compression ratio reduces the clearance volume and therefore increases the density of the cylinder gases during burning. This increases the peak pressures and temperatures and the total combustion duration is reduced. Thus higher compression ratios give rise to higher flame speeds, as can been seen from figure 1 & 2. When the compression ratio was changed from 16.35 to 24.5, the flame speed was increased by 46.9%.
Shaik Magbul Hussain et al. / International Journal of Engineering Science and Technology (IJEST)
ISSN : 0975-5462 Vol. 4 No.02 February 2012 475

Fig. 1 CFD Analysis of Combustion Velocity for CR 24.5, 20% Biogas.
Shaik Magbul Hussain et al. / International Journal of Engineering Science and Technology (IJEST)
ISSN : 0975-5462 Vol. 4 No.02 February 2012 476
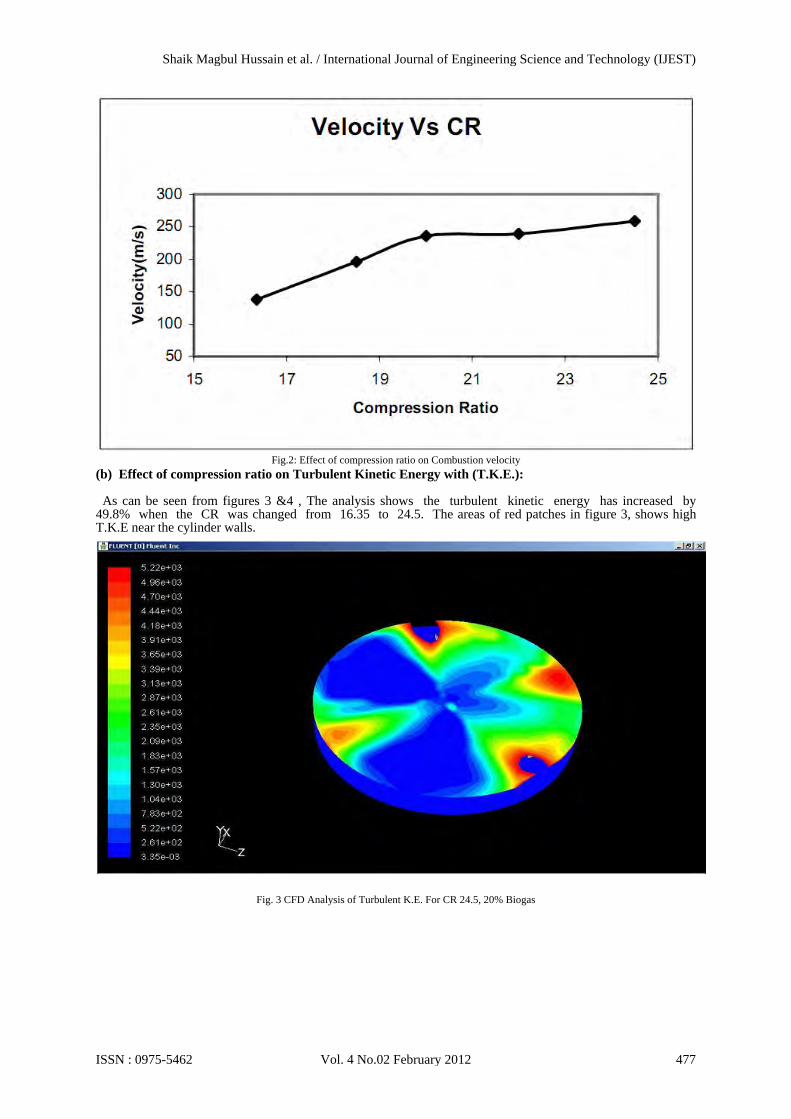
Fig.2: Effect of compression ratio on Combustion velocity
(b) Effect of compression ratio on Turbulent Kinetic Energy with (T.K.E.): As can be seen from figures 3 &4 , The analysis shows the turbulent kinetic energy has increased by 49.8% when the CR was changed from 16.35 to 24.5. The areas of red patches in figure 3, shows high T.K.E near the cylinder walls.
Fig. 3 CFD Analysis of Turbulent K.E. For CR 24.5, 20% Biogas
Shaik Magbul Hussain et al. / International Journal of Engineering Science and Technology (IJEST)
ISSN : 0975-5462 Vol. 4 No.02 February 2012 477

Fig.-4 CFD Results Analysis of Turbulent Kinetic Energy Vs Compression ratio
(c) Effect of compression ratio on Turbulent Dissipation Rate: The flame speed is quite low in non -Turbulent mixtures and increases with increasing turbulence. This is mainly due to the additional intermingling of the burning and unburned particles at the flame front, which expedites reaction by increasing the rate of contact. Turbulence increases the heat flow to the cylinder walls. It also accelerates the chemical reaction by mixing of fuels and oxygen so that spark advance may be reduced. As the compression ration ratio increases both the turbulent kinetic energy and turbulent
Fig. 5 CFD Analysis of Turbulent Dissipation rate For CR 24.5, 20% Biogas
dissipation rate increases as shown in the result analysis figures 5 & 6, Which result in reduced combustion duration and hence minimizes the tendency of abnormal combustion. Biogas flame speed is almost thrice that of gasoline further helps in the mixture of diesel and biogas for faster combustion, increasing both turbulent kinetic energy and dissipation rate, and reducing the tendency of abnormal combustion. Turbulent dissipation rate has increased by 91.4% when the CR was changed from16.35 to 24.5.
Shaik Magbul Hussain et al. / International Journal of Engineering Science and Technology (IJEST)
ISSN : 0975-5462 Vol. 4 No.02 February 2012 478
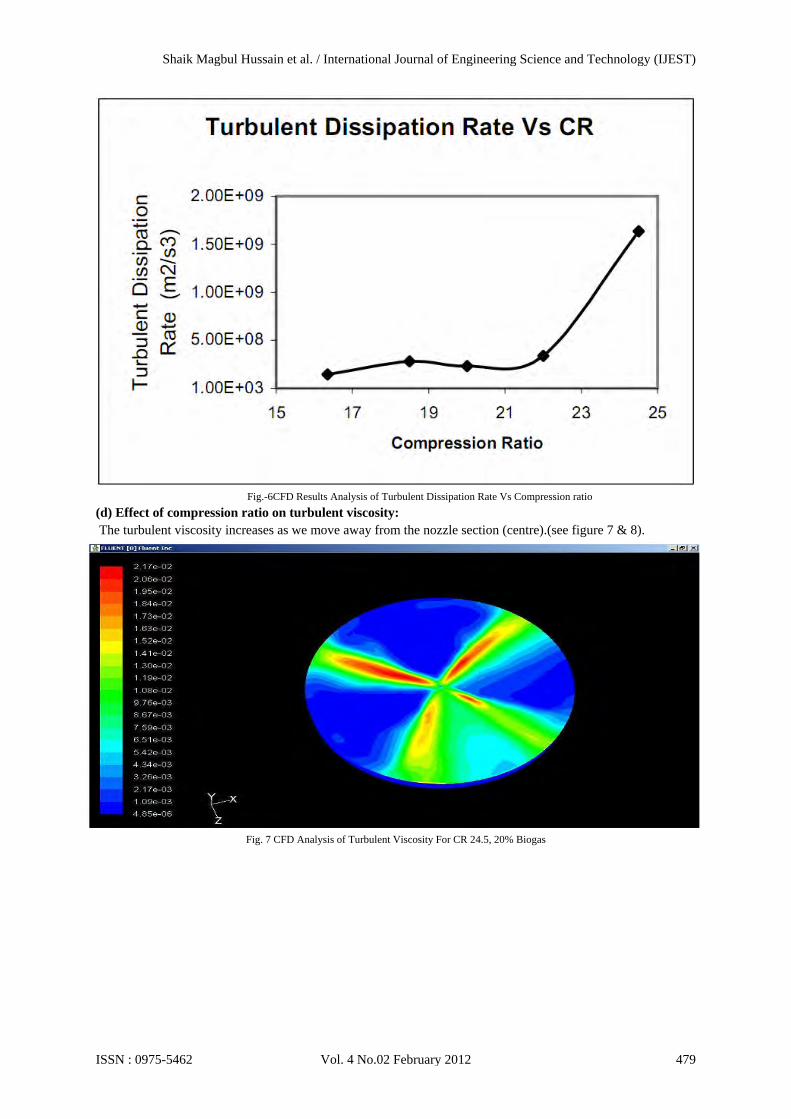
Fig.-6CFD Results Analysis of Turbulent Dissipation Rate Vs Compression ratio
(d) Effect of compression ratio on turbulent viscosity: The turbulent viscosity increases as we move away from the nozzle section (centre).(see figure 7 & 8).
Fig. 7 CFD Analysis of Turbulent Viscosity For CR 24.5, 20% Biogas
Shaik Magbul Hussain et al. / International Journal of Engineering Science and Technology (IJEST)
ISSN : 0975-5462 Vol. 4 No.02 February 2012 479

Fig.-8 CFD Results Analysis of Turbulent Viscosity Vs Compression ratio
(e) Effect of compression ratio on NOx: As seen above, NOx increases with increase in compression ratio, and has increased by 56.5% when the CR was changed from 16.35 to 24.5. Some localized spots of high NOx concentration is seen in the NOx contours. (see figure 9 & 10).
Fig. 9 CFD Analysis of NOx for CR 24.5, 20% Biogas.
Shaik Magbul Hussain et al. / International Journal of Engineering Science and Technology (IJEST)
ISSN : 0975-5462 Vol. 4 No.02 February 2012 480

Fig. - 10 CFD Results Analysis of Mole Fraction of NOx Vs Compression ratio.
2. Effect of Biogas substitution: CFD has been carried out to analyze the effect of biogas substitution on combustion parameters for the compression ratio of 24.5. Biogas substitution has been varied from 20% to 80%, and the effect of variation is analyzed. Biogas is injected through hydrogen injector in to the combustion chamber at a pressure between 50 and 60 bar. Diesel Injection was at 160 bar and air was inducted at atmospheric condition.
(a) Effect of Biogas substitution on NOx: As seen from figure 11-15, contours and graphs representing change in mole fraction of NOx with the percentage increase in biogas. As biogas substitution in the mixture increases the mole fraction of NOx value drops. The main reason being, as biogas percentage in the mixture increases, the moisture i.e. the mole fraction of H2O increases, which reduces the net combustion temperature. As the combustion temperature falls down the tendency of NOx formation reduces, which finally results in reduction in NOx value with the increase in % biogas substitution.
Fig. - 11; 20% Biogas.
Shaik Magbul Hussain et al. / International Journal of Engineering Science and Technology (IJEST)
ISSN : 0975-5462 Vol. 4 No.02 February 2012 481

Fig. – 12; 40% Biogas.
Fig. - 13; 60% Biogas.
Shaik Magbul Hussain et al. / International Journal of Engineering Science and Technology (IJEST)
ISSN : 0975-5462 Vol. 4 No.02 February 2012 482
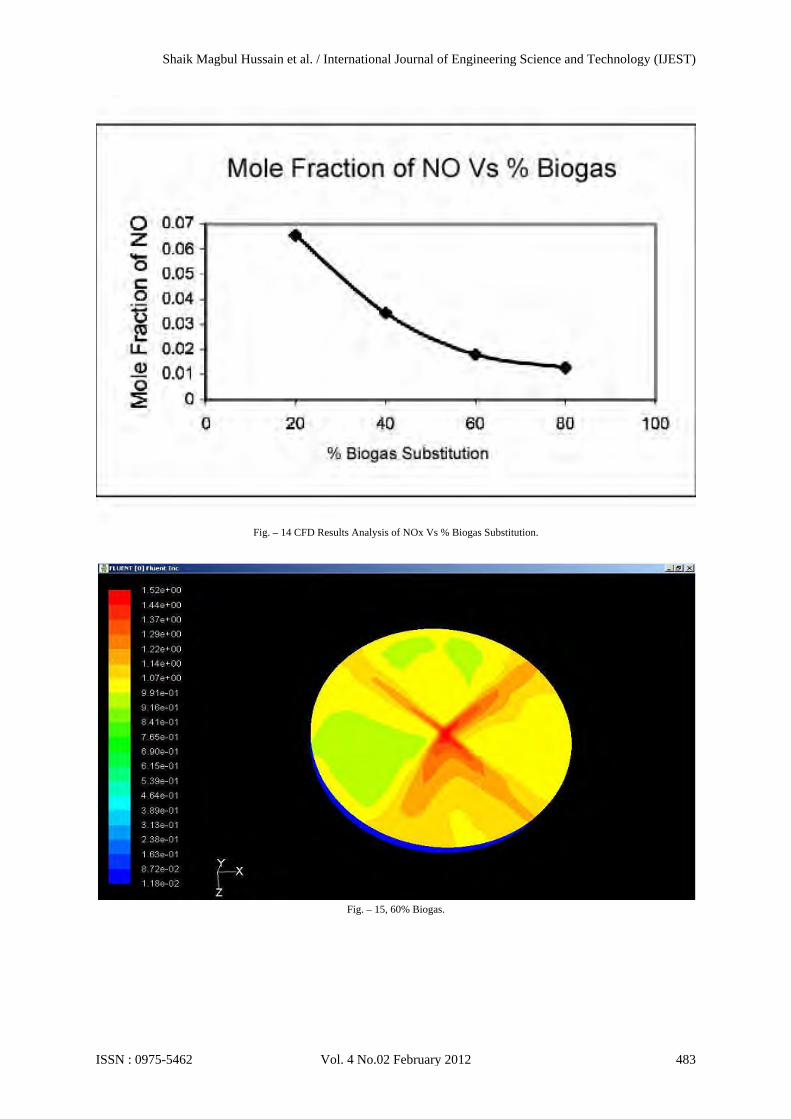
Fig. – 14 CFD Results Analysis of NOx Vs % Biogas Substitution.
Fig. – 15, 60% Biogas.
Shaik Magbul Hussain et al. / International Journal of Engineering Science and Technology (IJEST)
ISSN : 0975-5462 Vol. 4 No.02 February 2012 483
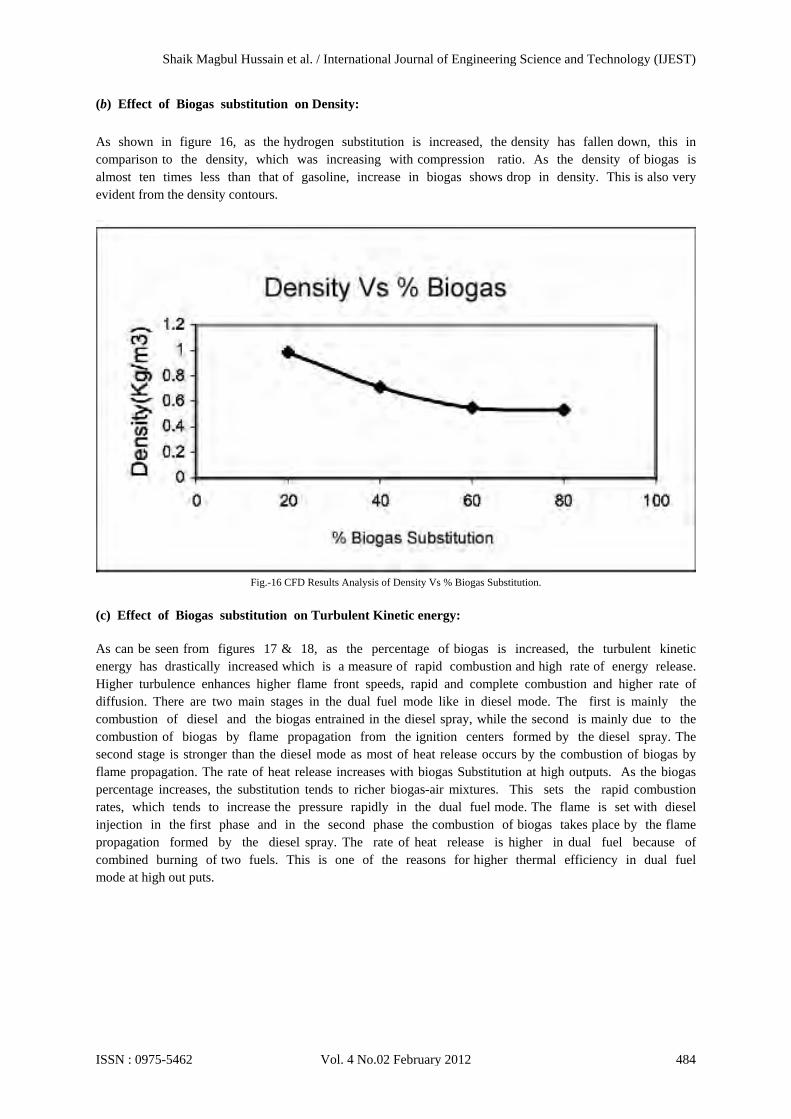
(b) Effect of Biogas substitution on Density:
As shown in figure 16, as the hydrogen substitution is increased, the density has fallen down, this in comparison to the density, which was increasing with compression ratio. As the density of biogas is almost ten times less than that of gasoline, increase in biogas shows drop in density. This is also very evident from the density contours.
Fig.-16 CFD Results Analysis of Density Vs % Biogas Substitution.
(c) Effect of Biogas substitution on Turbulent Kinetic energy:
As can be seen from figures 17 & 18, as the percentage of biogas is increased, the turbulent kinetic energy has drastically increased which is a measure of rapid combustion and high rate of energy release. Higher turbulence enhances higher flame front speeds, rapid and complete combustion and higher rate of diffusion. There are two main stages in the dual fuel mode like in diesel mode. The first is mainly the combustion of diesel and the biogas entrained in the diesel spray, while the second is mainly due to the combustion of biogas by flame propagation from the ignition centers formed by the diesel spray. The second stage is stronger than the diesel mode as most of heat release occurs by the combustion of biogas by flame propagation. The rate of heat release increases with biogas Substitution at high outputs. As the biogas percentage increases, the substitution tends to richer biogas-air mixtures. This sets the rapid combustion rates, which tends to increase the pressure rapidly in the dual fuel mode. The flame is set with diesel injection in the first phase and in the second phase the combustion of biogas takes place by the flame propagation formed by the diesel spray. The rate of heat release is higher in dual fuel because of combined burning of two fuels. This is one of the reasons for higher thermal efficiency in dual fuel mode at high out puts.
Shaik Magbul Hussain et al. / International Journal of Engineering Science and Technology (IJEST)
ISSN : 0975-5462 Vol. 4 No.02 February 2012 484

Fig. – 17, Turbulent K.E. at 60% Biogas.
Fig.-18 CFD Results Analysis of Turbulent Kinetic energy Vs % Biogas Substitution.
Shaik Magbul Hussain et al. / International Journal of Engineering Science and Technology (IJEST)
ISSN : 0975-5462 Vol. 4 No.02 February 2012 485

(d) Effect of Biogas substitution on Turbulent Dissipation Rate:
Fig. – 19, Turbulent dissipation rate at 60% Biogas.
Fig.-20 CFD Results Analysis of Turbulent Dissipation Rate Vs % Biogas Substitution
Shaik Magbul Hussain et al. / International Journal of Engineering Science and Technology (IJEST)
ISSN : 0975-5462 Vol. 4 No.02 February 2012 486

As seen in the above contour, in figures 19 & 20 the turbulent dissipation rate drastically increases with the increase in the percentage of biogas; this is for the same reason as explained in the case of turbulent kinetic energy.
(e) Effect of Biogas substitution on Mole fraction of H2O:
As the percentage of biogas increases in the mixture, the mole fraction of H2O (i.e. the moisture) content
Increases (figure 21). As the moisture increases the peak temperatures of combustion are reduced (figure 22) in the cylinder, which finally reduces the formation of NOx.
Fig.-21 80% Biogas
Fig.-22 CFD Results Analysis of Temperature Vs % Biogas substitution
Shaik Magbul Hussain et al. / International Journal of Engineering Science and Technology (IJEST)
ISSN : 0975-5462 Vol. 4 No.02 February 2012 487

(f) Effect of Biogas substitution on Combustion velocity:
It can be seen from figures 23 & 24, as the biogas percentage increases, the combustion velocity increases drastically. It has increased almost twice that of initial value with 20% substitution when compared to that of 80% substitution. This shows high flammability of biogas. The heat release rate and peak pressures obtained from the experimental data for various compression ratios are shown in figures 25 & 26. The values are well in conformity with the predicted results. Especially the values of emissions predicted CO2, NOx (as shown in figures 27 & 28).
Fig.-23 Combustion velocity at 80% Biogas substitution
Fig.-24 CFD Results Analysis of Combustion velocity Vs % Biogas Substitution
Shaik Magbul Hussain et al. / International Journal of Engineering Science and Technology (IJEST)
ISSN : 0975-5462 Vol. 4 No.02 February 2012 488

Fig. - 25 Heat Release rate at different Compression ratios
Fig. – 26 peak pressures at different Compression ratios
Shaik Magbul Hussain et al. / International Journal of Engineering Science and Technology (IJEST)
ISSN : 0975-5462 Vol. 4 No.02 February 2012 489

Fig. – 27 Comparisons of CO2 Fig. – 28 Comparisons of Nox
Shaik Magbul Hussain et al. / International Journal of Engineering Science and Technology (IJEST)
ISSN : 0975-5462 Vol. 4 No.02 February 2012 490

CONCLUSIONS
The CFD analysis has led to the following conclusions: The CFD analysis shows that when the compression ratio was changed from 16.35 to 24.5, the flame speed was
increased by 46.9%.
The peak density in the CFD analysis is at the nozzle, as it is the region of concentration of combusting particles. Away from the nozzle region the density drops.
The density has increased almost by 49.5%, when the CR was changed from 16.35 to 24.5.
The mole fraction (percentage) of N2 gradually increases with the increase in CR and it has increased by 72.3% when the CR was changed from 16.35 to 24.5.
NOx increases with increase in compression ratio, and has increased by 56.5% when the CR was changed from 16.35 to 24.5.
The net Turbulent Kinetic energy is at its peak at the nozzle, Away from the nozzle the turbulence increases.
The analysis shows the turbulent kinetic energy has increased by 49.8% when the CR was changed from 16.35 to 24.5.
Near and away from the nozzle the dissipation rate increases and it is dependent on turbulent kinetic energy.
Turbulent dissipation rate has increased by 91.4% when the CR was changed from16.35 to 24.5.
As the biogas substitution is increased, the density has fallen down, since the density of biogas is almost ten times less than that of gasoline, increase in biogas shows drop in density.
The net Turbulent Kinetic energy is at its peak at the nozzle, away from the nozzle the turbulence increases and its value increases drastically with the increase in % Biogas in fuel mixture.
The turbulent viscosity decreases as the percentage of biogas increases.
As H2 substitution in the mixture increases the mole fraction of N2 and NOx value drops considerably and H2O concentration increases.
The predicted results of combustion and emissions are in well conformity with experimental results.
REFERENCES
[1] ABD-ALLA, G.H., SOLIMAN H.A., BADR O.A., and ABD-RABBO, M.F., “Energy Conversion Management” 41(2000) 559- 572. [2] FRASER, R.A., SIEBERS, D.L., and EDWARDS, C.F., “Auto-ignition of Methane and Natural Gas in a Simulated Diesel
Environment”. Presented at SAE. Paper SAE 2003-01-0755. [3] KARIM, G.A., LIU, T., and JONES, W., “Exhaust Emissions from Dual fuel Engines at Light Loads”. Presented at SAE. Paper SAE
932822(1993). [4] KONG, S.C., HAN, Z.W., and REITZ,R.D., “The Development and Application of a Diesel Ignition and Combustion Model for
Multidimensional Engine simulation” SAE 950278, 1995. [5] KONG, S.C., HAN, Z.W., and REITZ, R.D., “The Development and Application of a Diesel Ignition and Combustion Model for
Multidimensional Engine Simulations,” SAE 950278, 1995. [6] NABER, J.D., SIEBERS, D.L., CATON, J.A., WESTBROOK C.K., and DI JJULIO, S.S.,“Natural Gas Auto Ignition under Diesel
Condition: Experiments and Chemical Kinetics Modeling”. Presented at SAE. Paper SAE 942034(1994). [7] PETERS N., “Turbulent Combustion”. Cambridge University Press UK 2000. [8] POLASEK, MILOS, MACEK, JAN, TAKATS, MICHAL, “Biogas Fuelled Engine- Properties Of Working Cycle and Emission
Potentials” Report No. F02V102 Czech Technical University in Prague, Czech Republic, 2002. [9] SINGH, S., “The effect of Fuel Injection Timing and Pilot Quantity on the Pollutant Emissions From a Pilot ignited Natural Gas
Engine”, Master’s Thesis The University Of Alabama, 2002. [10] SING, S. LIANG, L., SONG-CHARNG K., and RIETZ R.D., “Development of a Flame Propagation Model for Dual – Fuel Partially
Premixed Compression Ignition Engines” SAE May 2004. [11] TAN, Z., AND REITZ, R.D., “Modeling in Spark – Ignition Engines Using a Level Set Method”. Presented at SAE. Paper SAE 2003
– 01- 0722. [12] YASHUHIRO, KOU, T., YUKI, SHIGEKI, N., RYOJI, K., and TAKESHI, S., “Controlling Combustion and exhaust Emissions in a
Direct – injection Diesel Engine Dual Fueled with natural Gas”. Presented at SAE. Paper SAE 952436 (1995). [13] ZHANG, Y., KONG, S.C., and REITZ, R.D., “Modeling and simulation of a Dual - Fuel Diesel/Natural gas) Engine with © CIMAC
Congress 2007, Vienna Paper No. 228 11 Multidimensional CFD “SAE 2003-01-0755, 2003.
Biographical notes : Shaik Magbul Hussain received his M. Tech. degree in 2004 from Jawaharlal Nehru Technological University, Hyderabad, (Andhra Pradesh) and pursuing Ph.D. degree from same university . Presently, he is an Associate Professor in the Department of Mechanical engineering, Royal Institute Of Technology & Science , Hyderabad, (Andhra Pradesh), India. He has more than 15 years of teaching experience. He published papers in referred
Shaik Magbul Hussain et al. / International Journal of Engineering Science and Technology (IJEST)
ISSN : 0975-5462 Vol. 4 No.02 February 2012 491

national and international journals. He attended and presented papers in national and international conferences. His area of research includes biogas as alternative fuel. and a member of the Institution of Engineers (India).,he is the author of two books for engineering students.
Shaik Magbul Hussain et al. / International Journal of Engineering Science and Technology (IJEST)
ISSN : 0975-5462 Vol. 4 No.02 February 2012 492