cfd modeling of the test 25 of the panda experiment n
TRANSCRIPT
CFD MODELING OF THE TEST 25 OF THE PANDA EXPERIMENT
N. Mechitoua+, S. Mimouni+, M. Ouraou*, E. Moreau*
+ Electricité de France R&D Division 6, Quai Watier, 78400 Chatou Cedex France
* INCKA 85, avenue Pierre Grenier, 92100 Boulogne Billancourt France [email protected]
Abstract The accurate modeling of gas distribution (air, steam and Hydrogen) in a PWR containment, which can be released after the hypothetical beginning of a severe accident leading to the melting of the core, concerns phenomena such as wall condensation, hydrogen accumulation, gas stratification and transport in the different compartments of the containment. Numerical simulations performed with CFD solvers NEPTUNE_CFD and Code_Saturne are compared with experimental data corresponding to the test 25 of the PANDA experiment. The overall dimensions of the experiment (Diameter~4 m, Height~8 m, Volume of the 2 vessels~180 m3) are not yet representative of the right scale of the reactors, but they already provide valuable information when compared to smaller scales (as experience TOSQAN~7m3). The obtained computational results compare fairly well with experimental data and with computational results obtained with other flow solvers. The formation of high concentration helium layers in the two vessels is predicted, as well as the earlier arrival of helium with respect to steam at the vent. The analysis of the different fields (velocity, concentrations, density, mechanical pressure) and their comparisons with experimental data permit to explain the observed stratifications and to understand the formation of the complex flow structures. Ongoing works concern mesh sensitivity studies comprising structured mesh (hexahedra) or unstructured mesh (tetrahedron) and multiphase flows simulations. 1. INTRODUCTION A severe accident in a PWR nuclear power plant generally originates from a lack of cooling of the core, whose residual power can no longer be evacuated. In a few hours, due to multiple failures, human or hardware, including the failure of backup procedures, the structure of fuel elements deteriorates. Hydrogen is produced from the oxidation of zirconium sheaths and of structures of fuel elements during the phase of core degradation. The hydrogen and water vapor thus produced are transferred to the containment and then transported by convection loops. Given the significant differences in density between hydrogen and other gases in the containment (nitrogen, oxygen, water vapor, carbon monoxide, carbon dioxide, ..), hydrogen can accumulate preferentially in the upper parts of the compartments of the reactor building. In case of strong heterogeneity, hydrogen can achieve high local concentrations that exceed the threshold flammable gas mixture. Among the different safety systems for limiting the pressure increase during the course of the accident and the impact of possible combustion (deflagration), French and German PWR reactors use two types of mitigation means:
- The passive auto-catalytic recombiners (PAR): their role is to pro-actively oxidize hydrogen for preventing its accumulation in the containment. The catalytic recombiners initiate a controlled combustion, which is similar to a slow deflagration.
- Sprinkler systems: the injected water droplets cool the containment and lower the pressure by condensing steam on the droplets. They also promote mixing of gas by breaking quickly possible stratifications of the lightest gases (Mimouni et al, 2009).
1
The walls of the containment building and metallic structures play an important role from a thermal viewpoint. The walls, colder than the gas, condense the water vapor contained in the gas mixture and thus limit the pressure increase in the containment. Furthermore, the temperature difference between fluid and walls generates convection loops, enhancing the mixing of gases having different density. This paper focuses on numerical assessments of gas transport and stratification phenomena with CFD solver Code_Saturne (Code_Saturne website, 2010, Archambeau et al, 2004) and CMFD solver NEPTUNE_CFD (Méchitoua et al, 2003, Guelfi et al, 2007). It is organized as follows. The first part describes the homogeneous gas dynamic model implemented in Code_Saturne. As the multi-fluid model of NEPTUNE_CFD has already been presented several times (Mimouni et al, 2008, Mimouni et al, 2009, Mimouni et al, 2010), it is not described here. The second part concerns the numerical assessments upon the test n° 25 of the PANDA experiment, performed at PSI (De Cachard, 2007). 2. HOMOGENEOUS GAS DYNAMIC MODEL USED IN CODE_SATURNE The motion of gases and heat transfer in containment enclosures can be described by the general momentum, partial masses and energy conservation equations (Williams, 1985). The predominant physical phenomena driving the distribution and heat transfer of fluids are the following: - Mixing and /or segregation of gas whose velocity, density and temperature are different. - "Swelling" of containment: the compressibility of gas is taken into account, even if the flow velocities are low when compared to the acoustic speed. - Laminar and controlled combustion of hydrogen in recombiners, in order to limit its concentration. - Condensation of steam on cold structure surfaces, which has the main effect of limiting the pressure rise and of concentrating other gases. The general momentum, partial masses and energy conservation equations describing these phenomena can be simplified and stiffness due to the presence of physics having very different characteristic length and time scales can be removed or relaxed. 2.1 Low mach number approximation The flows are mainly low Mach number flows, whose motion is predominantly driven by free convection. A low Mach number model can be implemented within a pressure correction based solver usually used for incompressible or steady dilatable flows, as Code_Saturne (Archambeau et al, 2004). A spatial filtering of acoustic waves leads to the separation of the static pressure P into a uniform time-dependent thermodynamic pressure Pth(t) and a mechanical pressure p(x,t) (Kudriakov et al, 2006):
),();,()( txpPtxptPP thth >>+= (1) The general motion conservation equation of the mixture
r
Icondtott
tot UgPkUdivUUUUdivtU rr
rrrrrrrrrrrΓ+=+++∇+∇−⊗+
∂∂
ρρµµρρ ]1)3/23/2()([
associated with supplementary approximations concerning the mechanical pressure and the taking into account of mean hydrostatic pressure as
rzgkUdivtxptxp tot 03/23/2),(),( ρρµ +++≡ with 00 /ΩΩ≡ ∫ dρρ
then becomes: r
UgUUUUdivtU
condt
tot prrrrrrrrrr r
Γ+−=∇+∇−⊗+∂
∂∇+ )(])([ 0ρρµρ
ρ (2)
where ρ, U, µtot, p, ρ0, g and Γcond stand respectively for the mixture density, the mixture velocity vector, the total dynamic viscosity (including the turbulent viscosity deduced from the k-ε turbulence model), the mechanical pressure, the averaged density, the gravity acceleration and the condensation sink term. Thanks to the low Mach number approximation (1), the mechanical pressure is neglected for the computation of density, through the thermal equation of state:
2
∑=
k k
k
th
MY
TR
Pρ (3)
where R, T, Yk and Mk stand respectively for the perfect gas Constant, the absolute temperature (in Kelvin), the mass fractions of the different gases contained in the reactor building during a severe accident (Oxygen, Nitrogen, Steam and Hydrogen). The additional unknown Pth is solved, using integral forms over the entire domain Ω0 of mass or enthalpy equations, written below:
dSnUddt
00
cond
0
rr
∫∫∫Ω∂ΩΩρ−ΩΓ=Ωρ
∂∂
or (4)
Ω+∇+−−Ω∂∂
−=Ω ∫∫∫ΩΩ∂Ω
dSdSnhC
hUdhtdt
dPh
pt
tth
000
0 ])([ ρλσµ
ρρrvr
2.2 Energy equation The enthalpy equation of the mixture is quite complex and contains several terms. The body forces, the viscous constraint contributions, the supplementary terms due to the presence of more than two different species are negligible, when compared to the convective and turbulent transport contributions. For low Mach number flows, the kinetic energy remains small when compared to the thermal energy. On the other side, the unsteady contribution of the thermodynamic pressure is conserved, as it plays a key role in the pressure rise in the containment. The Fourier laminar and turbulent conduction term is directly written according to the enthalpy variable through the linearized relation:
jpj xh
CxT
∂∂
=∂∂ λλ where λ and Cp stand respectively for conductivity and specific Heat of the mixture.
The enthalpy equation is finally written in the following form:
2..])([ Hsteamcondth
pt
t wEhdtPd
hC
hUdivth
&rr
ρ−Γ+=∇λ
+σµ
−ρ+∂ρ∂
(5)
where h stands for the sensitive enthalpy of the gas mixture, defined as . ∫≡T
T
dTCh p
0Cp is the gas mixture specific heat. Then, in presence of exothermic chemical reactions, due to the combustion of hydrogen by the recombiners, the transformation of formation enthalpy into sensitive enthalpy is taken into account through a source term proportional to the reaction heat E released by the chemical reactions and to the chemical reaction speed wH2. We recall that the formation enthalpies and reaction heat E of Hydrogen at ambient temperature are :
kgMJEkgMJThThThThTh vapOHNOHeH /22.1/4.13)(;0)()()()( 00
,200
200
200
00
2 =−===== The heat transfer due to condensation at the walls is modeled through a sink term proportional to the steam mass reduced into liquid water Γcond and the latent heat Lcond (~2.44 MJ/kg).
3
2.3 Mass conservation equations The mass conservation equations are written as below: - the global mass equation, containing the sink term of wall condensation:
condUdivt
Γρρ
=+∂∂
)(r
(6)
- the conservation equations of non condensable gases, containing the slow combustion sink terms due to the recombiners:
H2H2
O2O2O2O2
O2 wM2
MρΓ)YDρYdiv
tYρ
U(ρ &rr
==∇−+∂
∂
22222 )( HHHH
H wYDYUdivt
Y&
rrρρρ
ρ=Γ=∇−+
∂∂
(7)
0)( 2222 =Γ=∇−+
∂∂
NNNN YDYUdiv
tY rr
ρρρ
- the relation for obtaining the condensable gas (steam) from the concentration of the other gases: 2222 1 HNOOH YYYY −−−= (8)
2.4 Turbulence Modeling The standard k-ε turbulence model, adapted to the variable density flows, is used. The equations of the kinetic energy k and the turbulence dissipation ε obtained by a Favre averaging are as follows:
ερ−+=∇σµ
−+∂∂
GPk)divtkρ
k
tkU(ρrr
(9)
[ ]k
CGCPk
C)divtρ tU(ρ
2
231 )1( ερ−−+
ε=ε∇
σµ
−+∂ε∂
εεεε
εrr
(10)
where P and G represent respectively the contribution to the turbulence production of the inertia and of the buoyancy forces:
22 )(32
32)(2 UdivUdivkUUtrP tt
rrvrrrrrµ−ρ−
∇+∇µ= (11)
ρρ∇
σµ
−=r
rgGt
t
Then, the turbulent viscosity is given as:
ερ=µ µ
2kCt (12)
The constants of the model are that given by (Launder and Spalding,1974) and (Launder, 1980)
σt σε σk Cµ Cε1 Cε2 Cε3 0.9 1.3 1 0.09 1.44 1.92 1 if G<0, 0 if G>0
2.5 Wall condensation modeling Steam condensation on the walls of the containment enclosure plays a key role in the dynamic and heat transfer. The heat and mass sink terms of gases due to condensation are modeled through correlations based on heat and mass transfer analogy, of Chilton-Colburn type (Murty Kanury, 1975). The liquid film is not modeled and it is assumed that vapor and non condensable gases are in direct contact with the wall. The heat transfer by condensation of steam in liquid is written as:
4
condcond Lm&=φ (13)
where and (~2.44 MJ/kg) represent respectively the mass per unit time of steam condensed in liquid and the latent heat between liquid water and steam.
m& condL
The analogy with the Chilton-Colburn correlation is used for modeling the mass transfer:
i
iz
vapinc
YYY
Shz
Dm
−= /ρ
& (14)
where : - Dinc/vap is the molecular diffusion coefficient between steam and non condensable gases. - Yi an Y are the mass fractions of the non condensable gases respectively at the liquid/gas interface and far from the interface (in fact, in the cell adjacent to the cold wall). - Shz is the Sherwood number based on the distance z representing the length of the boundary layer The interface non condensable gases mass fraction is deduced from the molar fraction, which depends on the thermodynamic pressure Pth and the steam saturation pressure PH2Oi.
thsatthiOHiOHi PPPPXX /1/11 ,2,2 −=−=−= The Sherwood number depends on local Reynolds and Grashoff numbers, defined as below.
]1/3z
1/34/5zz Sc)0.13(Gr,Sc0.029Re[maxξSh =
i
i
XXX −
+= 625.01ξν
zUz =Re (15)
2
3)/(νρδρ zg
Grz =
),(),( YTYT ii ρρδρ −≡ For buoyancy dominated flows, the Sherwood number mainly depends upon the Grasshoff number. Then, the correlation is independent of the distance z representing the length of the boundary layer. 2.6 Wall temperature modeling The long term mixing phenomena in the containment are closely related to the heat and mass transfer due to the condensation of steam in contact with colder structures. Then, it depends on the wall temperatures, which evolves in function of unsteady heat conduction. The use of a one dimensional unsteady formulation approach gives enough precision, because the unsteady behavior of wall temperature depends much stronger on the condensation heat flux than on the transverse heat conduction. The boundary conditions of this computation are given by : - equation (13) for the heat transfer due to condensation and a log law type for heat transfer in gaseous phase, which is generally much smaller than the condensation heat transfer, - an external condition, taking into account the presence or not of insulation and the external temperature. 2.7 Numerical Procedure A numerical procedure based on a segregated approach of SIMPLE type is used for advancing in time (Méchitoua et al, 2003, Archambeau et al, 2004). The first step consists of predicting the velocity field from the momentum equations. This step solves an implicit equation for velocity, all other variables as pressure being frozen. Then, a reduced form of the momentum equation containing the predicted velocity and the implicit part of the mechanical pressure is coupled with the global mass equation. The
5
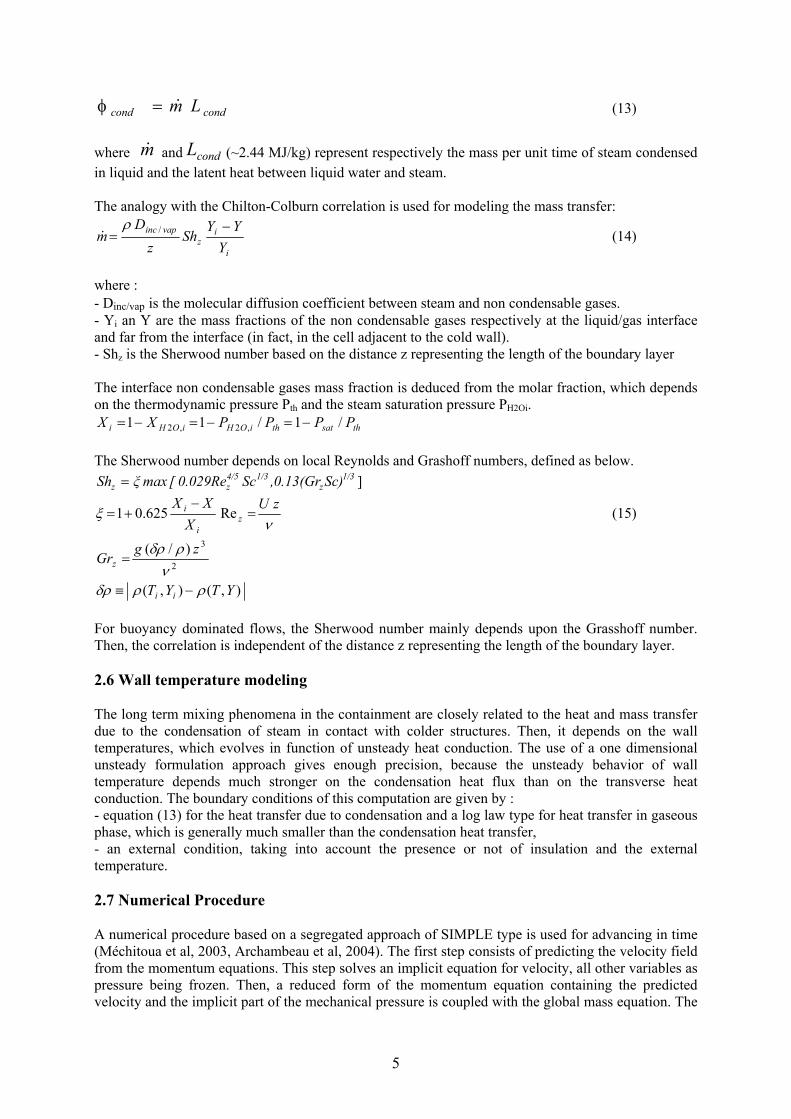
mass accumulation term verifying the global conservation (4) is taken into account in the right hand side of the mechanical pressure equation. A strong conservative form of all transport equations according to the time and spatial derivatives is preferred to a volumetric form of the mass equation used for fire simulations (Sapa et al, 2009). The volumetric form of mass equation is more precise for coarse discretization for which the mesh Reynolds number is high, but this formulation can be too sensitive to loss or gain of mass for long transient simulation within closed containment, as it is the case for safety studies concerning nuclear severe accidents. Spatial discretization follows a 3D full unstructured finite volume approach, with a collocated arrangement of all variables. A face based data structure allows the use of arbitrary shaped cells, including non matching meshes. Numerical consistency and precision for diffusive and convective fluxes for non orthogonal mesh and irregular cells are taken into account through a gradient reconstruction technique and non linear schemes. The collocated arrangement of all variables necessitates a careful treatment of gradient terms of momentum equations, similar to a Rhie&Chow interpolation, for avoiding spurious oscillations of pressure and velocity components. 3 PANDA TEST 25 SIMULATIONS The PANDA experiments performed at PSI (De Cachard et al, 2007) provide data of 3D gas flow and distribution issues in both PWR and BWR containments. The addressed phenomena play a key role for code prediction capability improvements, accident management and design of mitigating measures. The experiments are conducted at large scale in a multi-compartment geometry in order to provide data suitable for the improvement and validation of safety analysis codes. The PANDA experiment represents containment compartments and the Reactor Pressure Vessel by six cylindrical pressure vessels. The total height of the facility is 25 m, the total volume of the vessels is about 460 m3 and the maximum operating conditions are 10 bars and 200°C. For the SETH tests concerning local investigations of flows, only some parts of the facility are used. Experiments are carried out in a large volume of about 180 m3 consisting of two identical vessels, 8 m in height and 4 m in diameter. Figure 1 gives an overview of the experiment.
Figure 1 PANDA facility configuration for the SETH Three Gas Mixtures test 25
6
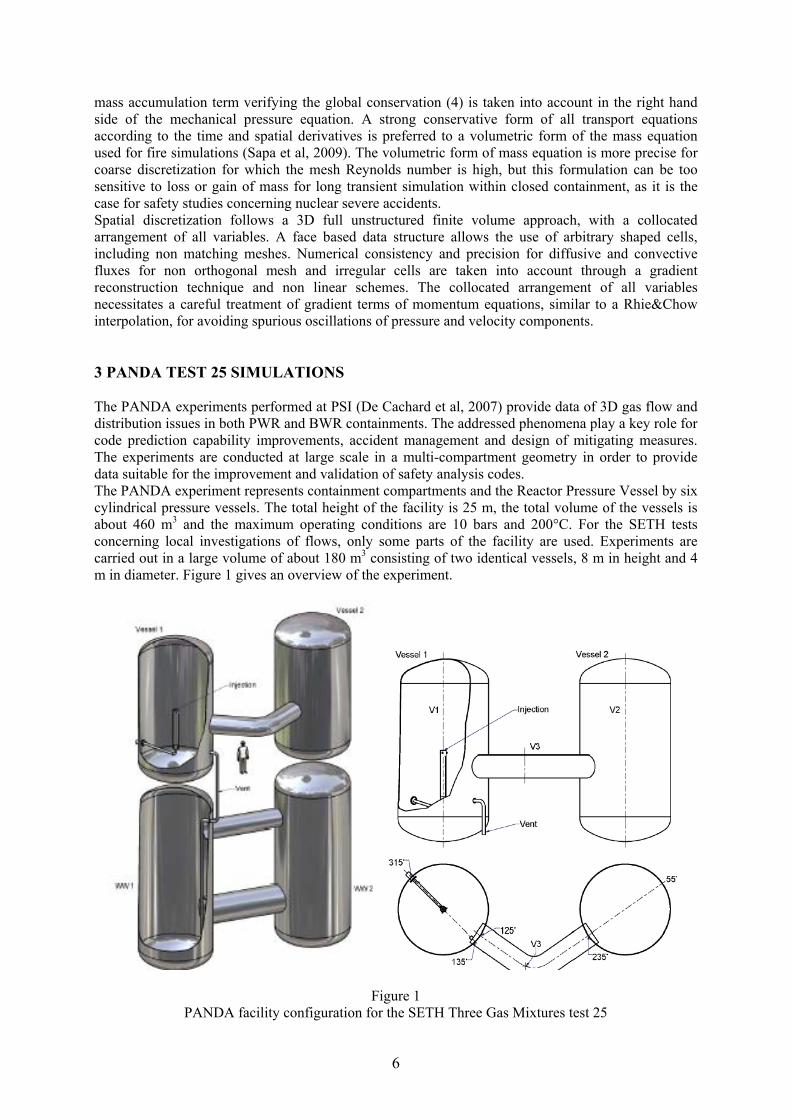
The test 25 experiment consists of injection of steam and Helium through a vertical pipe of 0.2 m diameter in the vessel 1 (DW1). The mixture is vented into the PANDA Wetwells (WW1, WW1), which are used as a buffer volume smoothing the pressure increase in vessels DW1 and DW2 due to the gas injection. The experimental conditions are summarized below: Initial conditions: Pressure=1.3 bars; Fluid Temperature=27°C, Structure temperature=27°C, Gas composition: Air only. Scenario 1: time=0 up to 7200 s Linear pressure increase : 1.3 to 2.6 bars Injection Fluid Temperature : 120°C Helium flow-rate : 0.008 kg/s Water vapor flow-rate : 0.064 kg/ s Scenario 2 : time=7200 up to 14400 s Linear pressure increase : 2.6 to 3.0 bars Injection Fluid Temperature : 150°C Helium flow-rate : 0.000 kg/s Water vapor flow-rate : 0.064 kg/ s Three Cartesian meshes and three unstructured tetrahedron meshes have been used, ranging from a coarse discretization of 3,500 cells up to a fine discretization of 224,000 cells, representing the two drywells, the interconnecting pipe and the two manholes. Figure 2 shows the mesh of the surfaces, as well as for the Cartesian and unstructured mesh, ranging respectively from 3,500 cells at the left to 224,000 cells at the right.
Figure 2 Meshes of the PANDA test case
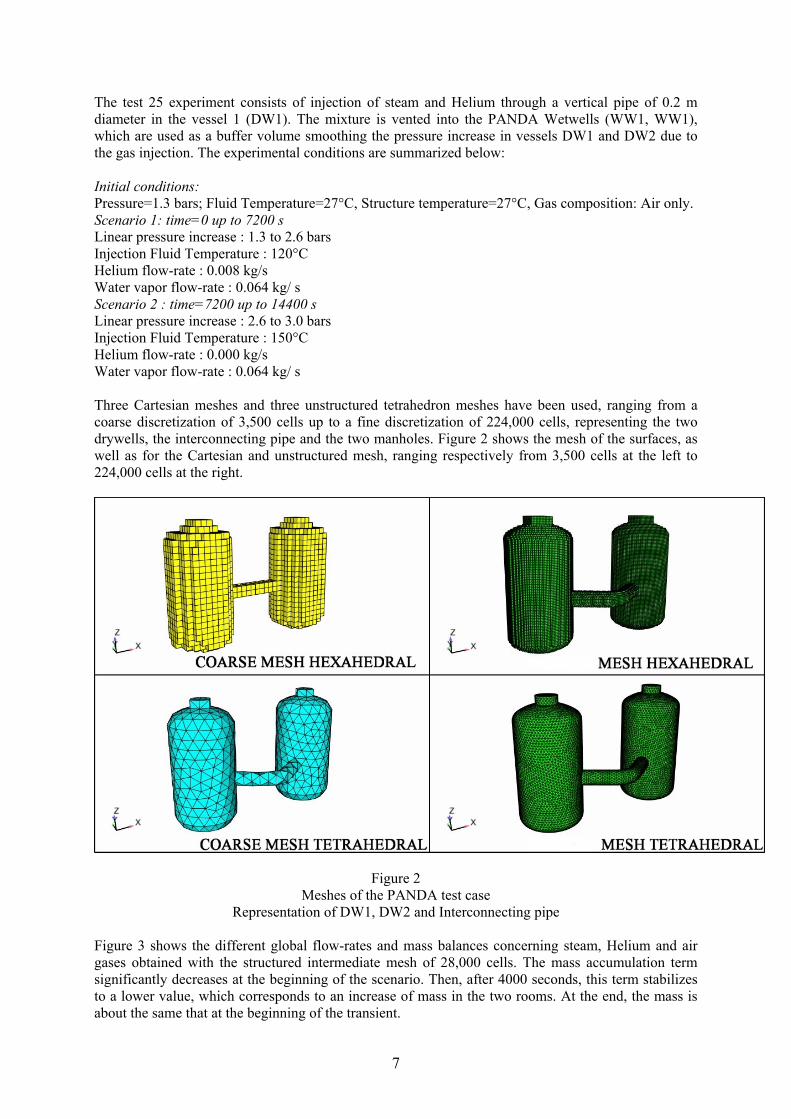
Representation of DW1, DW2 and Interconnecting pipe Figure 3 shows the different global flow-rates and mass balances concerning steam, Helium and air gases obtained with the structured intermediate mesh of 28,000 cells. The mass accumulation term significantly decreases at the beginning of the scenario. Then, after 4000 seconds, this term stabilizes to a lower value, which corresponds to an increase of mass in the two rooms. At the end, the mass is about the same that at the beginning of the transient.
7
The condensation flow-rate is very important and nearly corresponds to 2/3 of the injected steam. The mass decreases at the beginning because the lightest fluid as helium and steam replaces the heaviest fluid as air. The slightly increase in pressure smoothes this decrease. The Helium and steam masses both increase during the first part of the transient. Then, the mass of helium slightly decreases (no injection of this gas during the second part of the transient) and this gas is replaced by steam (increase in steam mass stronger than that during the first part of the scenario).
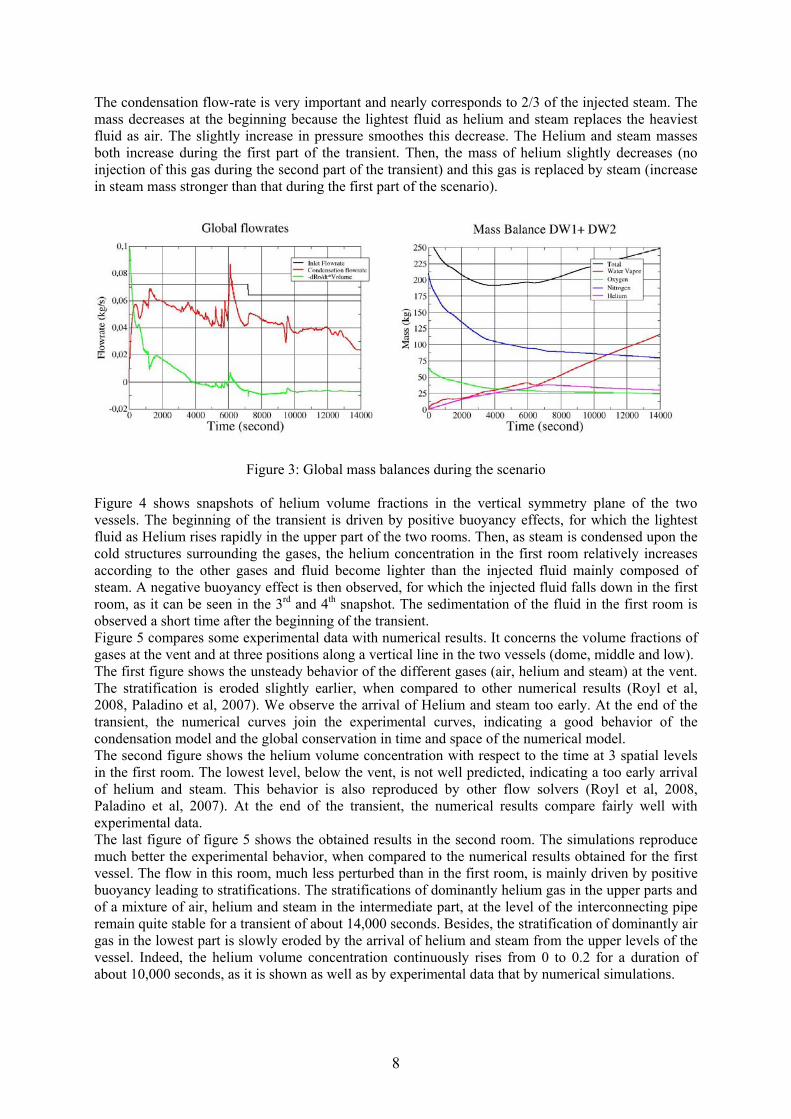
Figure 3: Global mass balances during the scenario Figure 4 shows snapshots of helium volume fractions in the vertical symmetry plane of the two vessels. The beginning of the transient is driven by positive buoyancy effects, for which the lightest fluid as Helium rises rapidly in the upper part of the two rooms. Then, as steam is condensed upon the cold structures surrounding the gases, the helium concentration in the first room relatively increases according to the other gases and fluid become lighter than the injected fluid mainly composed of steam. A negative buoyancy effect is then observed, for which the injected fluid falls down in the first room, as it can be seen in the 3rd and 4th snapshot. The sedimentation of the fluid in the first room is observed a short time after the beginning of the transient. Figure 5 compares some experimental data with numerical results. It concerns the volume fractions of gases at the vent and at three positions along a vertical line in the two vessels (dome, middle and low). The first figure shows the unsteady behavior of the different gases (air, helium and steam) at the vent. The stratification is eroded slightly earlier, when compared to other numerical results (Royl et al, 2008, Paladino et al, 2007). We observe the arrival of Helium and steam too early. At the end of the transient, the numerical curves join the experimental curves, indicating a good behavior of the condensation model and the global conservation in time and space of the numerical model. The second figure shows the helium volume concentration with respect to the time at 3 spatial levels in the first room. The lowest level, below the vent, is not well predicted, indicating a too early arrival of helium and steam. This behavior is also reproduced by other flow solvers (Royl et al, 2008, Paladino et al, 2007). At the end of the transient, the numerical results compare fairly well with experimental data. The last figure of figure 5 shows the obtained results in the second room. The simulations reproduce much better the experimental behavior, when compared to the numerical results obtained for the first vessel. The flow in this room, much less perturbed than in the first room, is mainly driven by positive buoyancy leading to stratifications. The stratifications of dominantly helium gas in the upper parts and of a mixture of air, helium and steam in the intermediate part, at the level of the interconnecting pipe remain quite stable for a transient of about 14,000 seconds. Besides, the stratification of dominantly air gas in the lowest part is slowly eroded by the arrival of helium and steam from the upper levels of the vessel. Indeed, the helium volume concentration continuously rises from 0 to 0.2 for a duration of about 10,000 seconds, as it is shown as well as by experimental data that by numerical simulations.
8
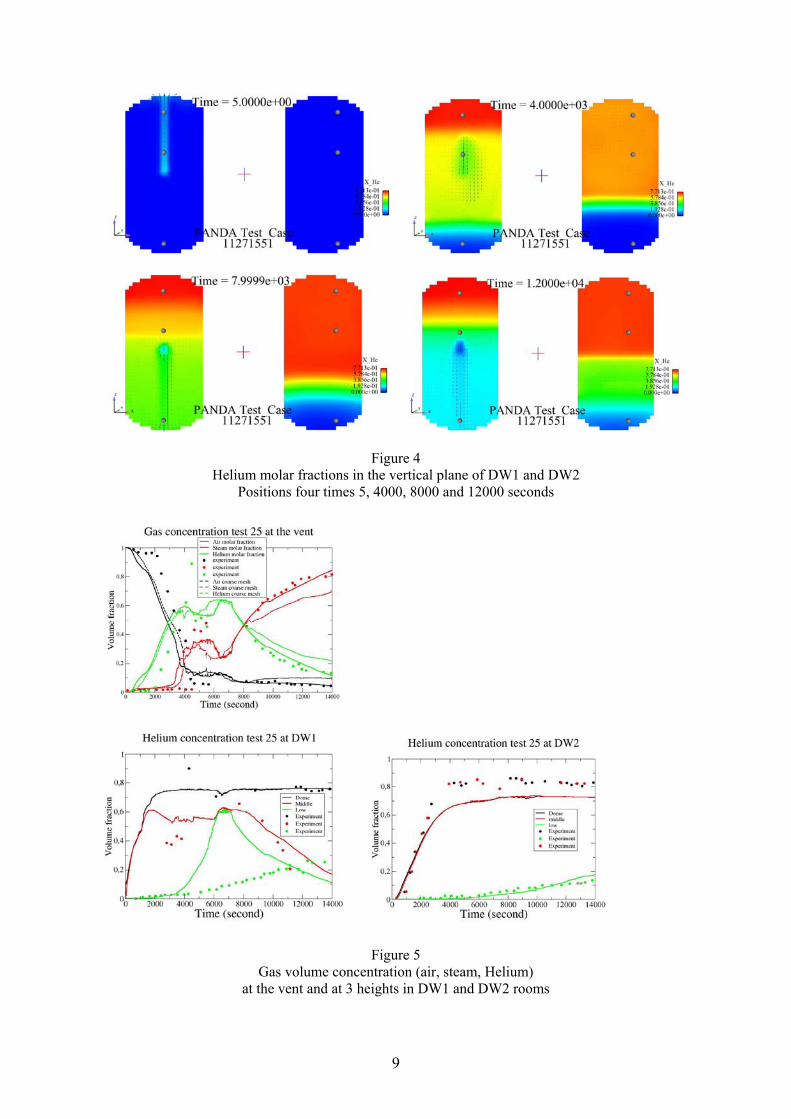
Figure 4 Helium molar fractions in the vertical plane of DW1 and DW2
Positions four times 5, 4000, 8000 and 12000 seconds
Figure 5 Gas volume concentration (air, steam, Helium)
at the vent and at 3 heights in DW1 and DW2 rooms
9
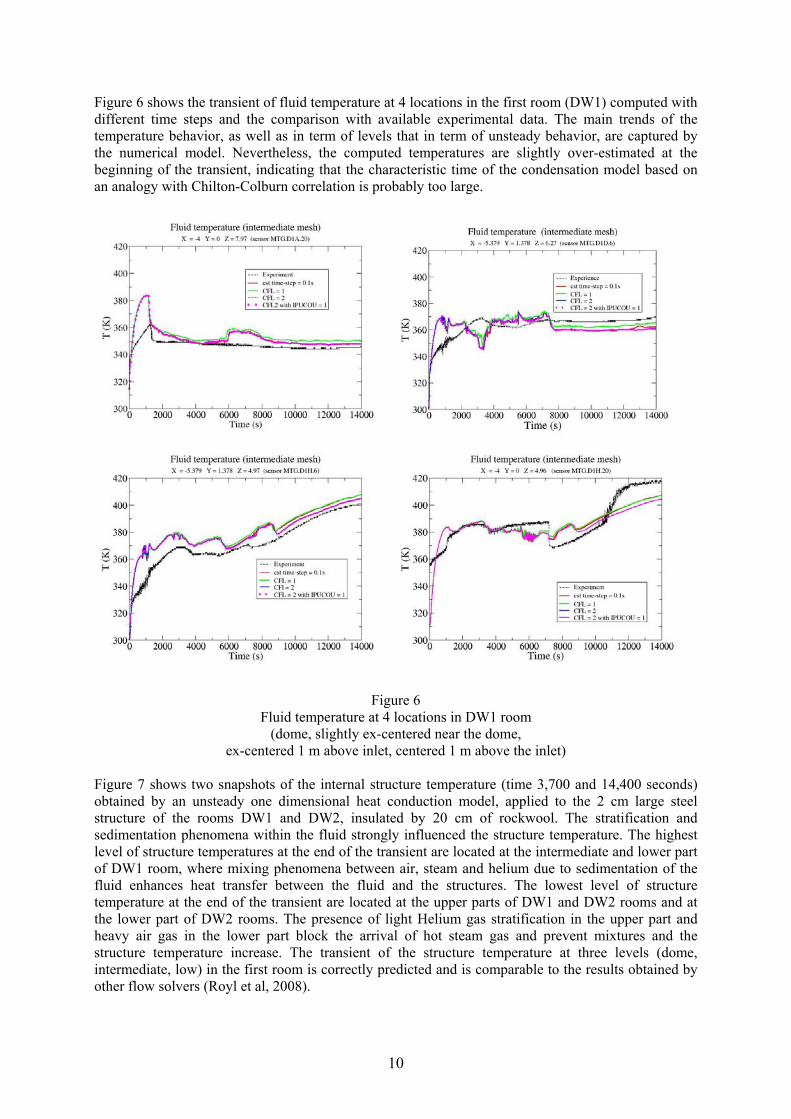
Figure 6 shows the transient of fluid temperature at 4 locations in the first room (DW1) computed with different time steps and the comparison with available experimental data. The main trends of the temperature behavior, as well as in term of levels that in term of unsteady behavior, are captured by the numerical model. Nevertheless, the computed temperatures are slightly over-estimated at the beginning of the transient, indicating that the characteristic time of the condensation model based on an analogy with Chilton-Colburn correlation is probably too large.
Figure 6 Fluid temperature at 4 locations in DW1 room
(dome, slightly ex-centered near the dome, ex-centered 1 m above inlet, centered 1 m above the inlet)
Figure 7 shows two snapshots of the internal structure temperature (time 3,700 and 14,400 seconds) obtained by an unsteady one dimensional heat conduction model, applied to the 2 cm large steel structure of the rooms DW1 and DW2, insulated by 20 cm of rockwool. The stratification and sedimentation phenomena within the fluid strongly influenced the structure temperature. The highest level of structure temperatures at the end of the transient are located at the intermediate and lower part of DW1 room, where mixing phenomena between air, steam and helium due to sedimentation of the fluid enhances heat transfer between the fluid and the structures. The lowest level of structure temperature at the end of the transient are located at the upper parts of DW1 and DW2 rooms and at the lower part of DW2 rooms. The presence of light Helium gas stratification in the upper part and heavy air gas in the lower part block the arrival of hot steam gas and prevent mixtures and the structure temperature increase. The transient of the structure temperature at three levels (dome, intermediate, low) in the first room is correctly predicted and is comparable to the results obtained by other flow solvers (Royl et al, 2008).
10
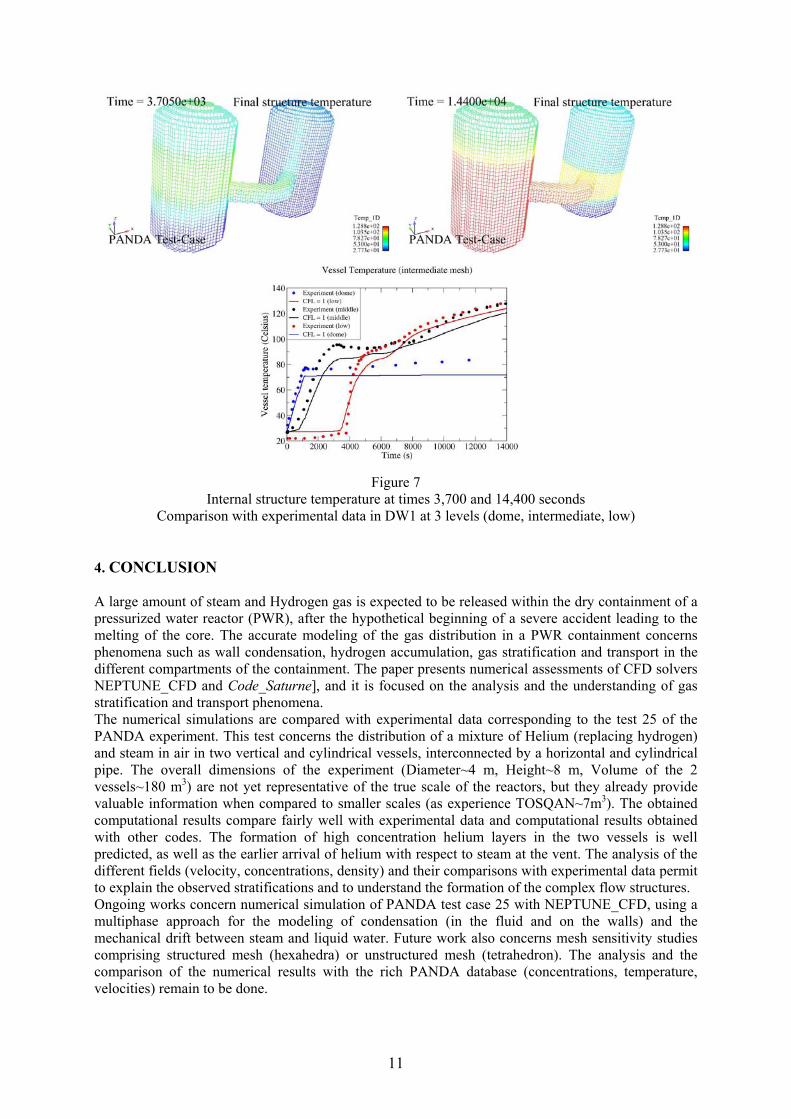
Figure 7
Internal structure temperature at times 3,700 and 14,400 seconds Comparison with experimental data in DW1 at 3 levels (dome, intermediate, low)
4. CONCLUSION A large amount of steam and Hydrogen gas is expected to be released within the dry containment of a pressurized water reactor (PWR), after the hypothetical beginning of a severe accident leading to the melting of the core. The accurate modeling of the gas distribution in a PWR containment concerns phenomena such as wall condensation, hydrogen accumulation, gas stratification and transport in the different compartments of the containment. The paper presents numerical assessments of CFD solvers NEPTUNE_CFD and Code_Saturne], and it is focused on the analysis and the understanding of gas stratification and transport phenomena. The numerical simulations are compared with experimental data corresponding to the test 25 of the PANDA experiment. This test concerns the distribution of a mixture of Helium (replacing hydrogen) and steam in air in two vertical and cylindrical vessels, interconnected by a horizontal and cylindrical pipe. The overall dimensions of the experiment (Diameter~4 m, Height~8 m, Volume of the 2 vessels~180 m3) are not yet representative of the true scale of the reactors, but they already provide valuable information when compared to smaller scales (as experience TOSQAN~7m3). The obtained computational results compare fairly well with experimental data and computational results obtained with other codes. The formation of high concentration helium layers in the two vessels is well predicted, as well as the earlier arrival of helium with respect to steam at the vent. The analysis of the different fields (velocity, concentrations, density) and their comparisons with experimental data permit to explain the observed stratifications and to understand the formation of the complex flow structures. Ongoing works concern numerical simulation of PANDA test case 25 with NEPTUNE_CFD, using a multiphase approach for the modeling of condensation (in the fluid and on the walls) and the mechanical drift between steam and liquid water. Future work also concerns mesh sensitivity studies comprising structured mesh (hexahedra) or unstructured mesh (tetrahedron). The analysis and the comparison of the numerical results with the rich PANDA database (concentrations, temperature, velocities) remain to be done.
11
12
Acknowledgments The work presented here has been achieved in the framework of the EDF R&D project “PAGODES2”, dedicated to the physical and numerical modeling of PWR severe accidents. The authors are grateful to the signatory partners of the OECD-SETH project concerning the PANDA experiments: AVN, NRI, VTT, CEA, IRSN, EDF, VGB, AREVA NP, GRS, KFKI, APAT, ENEA, JNES, KAERI, CSN, SKI, PSI, TAEK, HSE, USNRC. The authors are grateful to Code_Saturne and NEPTUNE_CFD development teams for their support to the use of these codes. In the frame of the NEPTUNE project, NEPTUNE_CFD code is jointly developed by EDF (Electricité de France) and CEA (Commissariat à l’Energie Atomique). The project is also funded by AREVA-NP and IRSN (Institut de Radioprotection et de Sûreté Nucléaire). REFERENCES F. Archambeau, N. Méchitoua, M. Sakiz, Code_Saturne: a FV code for the computation of turbulent incompressible flows – industrial applications, International Journal of Finite Volume, Vol. 1 (2004). F. de Cachard, D. Paladino, R. Zboray, M. Andreani, Large scale experimental investigation of gas mixing and stratification in LWR reactors. Internal report of Paul Scherrer InstituteInternal, 2007 Code_Saturne: Theoretical manual of Code_Saturne available on line upon the internet website http://www.code-saturne.org A. Guelfi, D. Bestion, M. Boucker, P. Boudier, P. Fillion, M. Grandotto, J-M. Hérard, E. Hervieu, P. Péturaud, “NEPTUNE - A new software platform for advanced nuclear thermal hydraulics”, Nuclear Science and Engineering, vol. 156, pp. 281-324, 2007. S. Kudriakov, F. Dabbene, E. Studer, A. Beccantini, J.P. Magnaud, H. Paillère, A. Bentaib, A. Bleyer, J. Malet, and C. Caroli, “The TONUS CFD Code for hydrogen risk analysis: physical models numerical schemes and validation matrix”, XCFD4NRS-1 , Garching (Munich, 2006). B.E. Launder, D.B. Spalding., Numerical computation of turbulent flows. Computer Methods in Applied Mechanics and Engineering, 3, 1974 B.E. Launder, Turbulence transport models for numerical computation of complex turbulent flows. Von Karman Institute for fluid dynamics, lecture series 3, 1980 N. Mechitoua, J. Lavieville et al, “An Unstructured Finite Volume Solver for 2-Phase Water/Vapor Flows Modelling Based on an Elliptic Oriented Fractional Step Method”, Proceeding of NURETH 10, Seoul, South Korea, October 5-9, 2003. S. Mimouni, M. Boucker, J. Laviéville, A. Guelfi, D. Bestion, “Modeling and computation of cavitation and boiling bubbly flows with the NEPTUNE_CFD code”, Nuclear. Engineering. And Design 238 (2008) pp 680-692. S. Mimouni J-S. Lamy, J. Lavieville, S. Guieu , M. Martin, Modeling of sprays in containment applications with a CMFD code, Nuclear Engineering And Design, in press, available online 21 december 2009. S. Mimouni, A. Foissac, J. Lavieville, “CFD modeling of wall steam condensation by a two-phase flow approach”, Nuclear Engineering And Design, 2010, accepted. A. Murty Kanury, Introduction to Combustion Phenomena, Combustion Science and Technology Book Series, ISBN 0-677-02690-, 1975 D. Paladino, R. Zboray, P. Benz, M. Andreani, Three Gas Mixture Plume inducing Mixing and Stratification in a multi-compartment containment. Proceeding of NURETH 12, Pittsburg, Pensylvania, USA, September 30- October 4, 2007 P. Royl, J.R. Travis, W. Breitung, Gasflow validation with PANDA tests from the OECD SETH Benchmark covering steam/air ans steam/helium/air mixtures. Journal of Science and Technology of Nuclear Installations special issue IPASS 2008 B. Sapa, L. Gay, N. Méchitoua, P. Plion, H. El Rabii, H.Y. Wang, URANS approach for buoyancy dominated turbulent diffusion flames. 6th Meditteranean Symposium on Combustion, Ajaccio, France, June 7-11, 2009 F.A. Williams, Combustion Theory, second edition, Benjamin/ Cummings Publishing Company Inc, 1985, ISBN 0-8053-9801-5