cfe fd model solutions - soa.org · pdf filecfe fd spring 2015 solutions page 1 cfe fd model...
TRANSCRIPT

CFE FD Spring 2015 Solutions Page 1
CFE FD Model Solutions
Spring 2015
1. Learning Objectives: 2. The candidate will understand how an enterprise’s structure and policies allow its
management to prioritize and select among projects or business activities that are
competing for scarce capital resources.
Learning Outcomes:
(2a) Evaluate how the legal form of an organization, corporate governance and/or
compensation dynamics impact decision-making on projects or business
activities.
(2b) Describe the factors impacting short-term capital needs.
(2e) Describe considerations for the risk borne by capital employed.
(2g) Evaluate human behavioral biases in the decision making processes.
Sources:
Jonathan Berk and Peter Demarzo, Corporate Finance, Third Edition, Ch 2
F-115-14 McKinsey, Overcoming a Bias against Risks
Commentary on Question:
Commentary listed underneath question component.
Solution:
(a) Evaluate the change in CW’s liquidity from 2012 to 2013. Support your
evaluation.
Commentary on Question:
Liquidity ratios were expected to support the analysis part of the question. Most
candidates were able to identify the deterioration of the company’s liquidity and
received partial credit.
Quick ratio: ratio of cash and "near cash" assets (short-term investments and
accounts receivable) to current liabilities.
2012 quick ratio = 0.528= (50+900) / (1000+300+500)
2013 quick ratio= 0.353 = (30+800) / (1200+500+650)

CFE FD Spring 2015 Solutions Page 2
1. Continued
Cash ratio: ratio of cash assets to current liabilities
2012 cash ratio = 0.028 = (50) / (1000+300+500)
2013 cash ratio = 0.013 = (30) / (1200+500+650)
The liquidity measures have deteriorated. The firm may have liquidity concerns
that it is not able to generate positive cash from operating and investing activities
(b)
(i) Calculate the cash generated by CW from its operating activities in 2013.
Show your work.
(ii) Calculate the change in CW’s retained earnings from 2012 to 2013. Show
your work.
Commentary on Question:
Candidates did poorly on this analysis question. Very few candidates received
full credit for part (i). Many candidates did not recognize the change in accounts
receivable and accounts payable. A common error was not to include
depreciation. For part (ii), some candidates only calculated the retained earnings
for 2013, but forgot to complete the change in retained earnings part.
(i) Calculate cash generated from 2013 operating activities.
Operating Activities
+200: Net income adjusted by all non-cash items related to operating
activity
+160: Depreciation and amortization added back to net income
+100: Increase of accounts receivable deducted from net income
+200: Increase of accounts payable added back to net income
-200: Increase of inventory deducted from the net income
= 460: Cash from operating activities
(ii) Calculate the change in retained earnings from 2012 to 2013.
Retained Earnings = Net Income - Dividends
Retained Earnings in 2012 = 190 - 0 = 190
Retained Earnings in 2013 = 200 - 100 = 100
The change in Retained Earnings from 2012 to 2013 = 100 - 190 = -90
(c) Explain three company-wide policies CW could implement to address its mid-
level management’s risk-averse behavior.

CFE FD Spring 2015 Solutions Page 3
1. Continued
Commentary on Question:
Candidates generally did well on this retrieval part of the question. A common
error was to state the policy without any explanation. Three answers were
needed for full credit.
Up the ante on risk projects
Ask managers for project ideas that are risky but have high potential returns.
Require managers to submit each investment recommendation with a riskier
version of the same project with more upside
Consider both the upside and downside
Executives should require that project plans include a range of scenarios or
outcomes that include both failure and success.
Avoid overcompensating for risk
Managers should pay attention to the discount rates to evaluate projects.
Higher discount rates for relatively small but frequent investment do not make
sense once projects are pooled at a company level.

CFE FD Spring 2015 Solutions Page 4
2. Learning Objectives: 1. The candidate will understand how a business enterprise funds its activities with
considerations for its business model, and the cost and constraints of the sources
of capital.
Learning Outcomes:
(1d) Assess whether the risky return from a new project or ongoing business is
sufficient to employ investor capital
(1e) Evaluate the return on employed capital using NPV, IRR and Payback period.
(1g) Describe the methods of allocating risk capital.
Sources:
Corporate Finance 3rd edition, Chapter 7: Investment Decision Rules
F-101-13: Capital Allocation in Financial Firms
Commentary on Question:
Candidates generally did well on this question.
Solution:
(a)
(i) Describe two potential pitfalls of relying on IRR to make investment
decisions for stand-alone projects.
(ii) Recommend three methods, other than relying on IRR, that a company
should use to make investment decisions.
Commentary on Question:
Most candidates did well on part (a). A common error was to recommend
payback period as an alternative to IRR. Alternate solutions received full credit.
(i) “Delayed Investments” - The IRR rule is only guaranteed to work for a
stand-alone project if all of the project’s negative cash flows precede its
positive cash flows.
“Multiple IRRs” – Sometimes multiple IRRs can exist, depending on
projected cash flow patterns.
(ii) Should incorporate NPV rule since it is the most accurate and reliable
decision rule. Could incorporate a Profitability Index to help make
investment decisions under resource constraints. Need to ensure that
hurdle rates reflect risk premiums and costs of risk capital.

CFE FD Spring 2015 Solutions Page 5
2. Continued
(b)
(i) Determine the stand-alone profits, net of deadweight costs, for both LLL
(excluding the ULSG product) and the ULSG product. Show your work.
(ii) Explain the effects of business unit diversification on firm-wide
deadweight costs of capital and investment decisions.
(iii) Determine the economic capital requirement, net of diversification effects
that would make LLL indifferent in its decision to move forward with the
ULSG product. Show your work.
Commentary on Question:
Most candidates earned full credit for parts (i) and (ii). Nearly half of candidates
gave incorrect answers for the qualitative statements and calculations for part
(iii). A common mistake was to use an economic profit of 0 as the break-even
point.
(i) LLL (excl ULSG): 40 – 0.25*100 = 15 (profitable). ULSG: 5 – 0.25*40
= -5 (unprofitable)
(ii) Diversification across business units with imperfectly correlated profit
streams can reduce a company’s deadweight cost of risk capital. Can
reduce required rates of return for investment projects. Can increase firm
value. The value-maximizing amount of risk capital for diversified firms is
less than the sum of the capital requirements for each of the businesses
operated on a stand-alone basis.
(iii) LLL will be indifferent in its decision if its economic profits net of
deadweight cost of capital remain unchanged after moving forward with
the ULSG product. 45 – 0.25*x = 15 --> x = 120, where x represents
combined economic capital requirements after diversification effects.
Diversified economic capital requirements need to be 20 less than the sum
of stand-alone requirements in order for LLL to be indifferent in its
investment decision.
(c) Recommend whether or not LLL should proceed with the ULSG product offering.
Justify your recommendation.
Commentary on Question:
Most candidates arrived at correct calculations along with right recommendation.
An alternative solution of comparing total economic capital given (100+15=115)
to the break-even point calculated in b(iii) also received full credit.

CFE FD Spring 2015 Solutions Page 6
2. Continued
Total expected economic profits net of deadweight costs = 45 – 0.25*115 = 16.25.
The addition of the ULSG product results in an increase in net profits of 1.25,
from 15 to 16.25, so the recommendation is to proceed.

CFE FD Spring 2015 Solutions Page 7
3. Learning Objectives: 1. The candidate will understand how a business enterprise funds its activities with
considerations for its business model, and the cost and constraints of the sources
of capital.
Learning Outcomes:
(1e) Evaluate the return on employed capital using NPV, IRR and Payback period.
(1f) Apply real options analysis to recommend and evaluate firm decisions on capital
utilization.
Sources:
Corporate Finance, Ch 18, Capital Budgeting with Valuation and Leverage
Corporate Finance, Ch 22, Real Options
Commentary on Question:
Most candidates arrived at correct answers by applying the correct WACC formulas and
valuing the project and options. Some candidates mistakenly used the book value for
WACC calculation and discounted incorrectly.
Solution:
(a) Determine Emmet’s weighted average cost of capital (WACC).
Commentary on Question:
A common mistake was to use book values instead of market values. Partial credit
was given for the correct WACC formula and calculation, and also for using net-
of-cash debt values.
rWACC = E/(E+D) x rE + D/(E+D) x rD x ( 1- marginal tax rate)
= 80/(80+20)x12% + 20/(80+20)x5%x(1-35%) = 10.25%
(b) Determine the value of the project. Show your work.
Commentary on Question:
Most candidates provided correct formula and calculations, while some
candidates did not increase year-two FCF of $10M by 2% for FCF(3) and did not
subtract the initial investment or discount time value.
Terminal value for FCF year 3+ (@the end of year 2) is:
FCF(3) / (WACC - g) = 10*(1+2%) / (10.25% - 2%) = $123.64m
Value of the project = PV of FCFs discounted at WACC
= -30 + 5/(1+10.25%) + (10+123.64)/(1+10.25%)^2 = $84.48 million

CFE FD Spring 2015 Solutions Page 8
3. Continued
(c) Estimate the WACC to use in valuing Emmet’s new medical device division.
Show your work.
Commentary on Question:
Nearly half of candidates used the correct formula for equity cost of capital which
lead to the right WACC calculation. Some candidates didn’t correctly calculate
ru based on the 2 comparables given. If rU is based on only one of the
comparables with a reason given, full credit was awarded.
Calculate the unlevered cost of capital for the two comparable companies:
Comparable 1: rU = E/(E+D) * rE + D/(E+D) * rD = (1-50%)*15.5% + 50%*7.5%
= 11.5%
Comparable 2: rU = E/(E+D) * rE + D/(E+D) * rD = (1-20%)*13% + 20%*6.5% =
11.7%
Take the average of the two, the unlevered cost of capital is: rU = 11.6%
Equity cost of capital rE = rU + D/E*(rU – rD)
=11.6% + 2 * (11.6% - 5%) = 24.8%
rWACC = E/(E+D) x rE + D/(E+D) x rD x ( 1- marginal tax rate)
= ( 1 - 66.67%) * 24.8% + 66.67% * (5%) * ( 1-35%) = 10.43%
(d)
(i) Critique the statement.
(ii) Determine the value to Emmet of an investment in the medical device
division. Show your work.
Commentary on Question:
Most candidates received full credit for part (i). When calculating the NPV of the
expansion option, common errors included incorrect discounting and using
WACC instead of the risk free rate in discounting.
The board member's comment is incorrect since it ignores the option for future
expansion if it turns out to be a success.
NPV (tripling if successful) = Incremental FCF (1) / r - Additional Investment =
400 / 0.03 - 4000 = 9,333.33 million
PV(Expansion option) = NPV (tripling if successful) * p / (1 + r) = 9333.33 *
30% / 1.03 = 2,718.45 million

CFE FD Spring 2015 Solutions Page 9
3. Continued
NPV (without expansion option) = FCF(1) / r * p - Initial Investment = 200 / 0.03
* 30% - 2500 = -500 million
Value of the Projection = NPV (without expansion option) + PV(Expansion
option) = -500 + 2718.45 = $2,218.45 million or $2.22 billion

CFE FD Spring 2015 Solutions Page 10
4. Learning Objectives: 3. The candidate will understand how and when to apply various stochastic
techniques to situations which have uncertain financial outcomes.
Learning Outcomes:
(3a) Explain the mathematical foundation of stochastic simulation.
(3c) Recommend the use of techniques to reduce the computational demand when
applying stochastic methodology.
Sources:
Huynh Ch 7, Introduction to Random Processes
Dowd Ch 8, Monte Carlo Simulation Methods
Dowd Ch 9, Applications of Stochastic Risk Measurement Techniques
Commentary on Question:
Most candidates did well on part (a) and (d). Most candidates struggled with the
discrete-formula of geometric Brownian motion for the terminal stock price on part (b)
and assessing shortcomings in the fixed-income portfolio modeling process on part (c).
Solution:
(a) Identify the figure that represents daily returns of the S&P 500 index. Support
your answer.
Commentary on Question:
Full credit was awarded for identification by elimination with proper reasoning.
Figure 2 is log function and Figures 3 and 4 are SIN/COS functions.
Figure #1 represents S&P return.
Figure #1 exhibits a random process.
(b) Calculate the terminal stock price.
Commentary on Question:
Most candidates didn’t correctly apply the geometric Brownian motion formula to
solve for μ and σ. Partial credit was given for calculating S(t) even if used the
wrong μ and σ.
Rewrite the equation S(t+Δt) = S(t)*(1+μ*Δt+σ*ϕ*sqrt(Δt)), then
S(1) = S(0)*(1+ μ +0.1168*σ)
S(2) = S(1)*(1+ μ +0.4779*σ)
Solve for μ=0 and σ=0.25.
Then S(t) = S(t-1)*(1+ μ +0.2440*σ), S(t)= 1.1006

CFE FD Spring 2015 Solutions Page 11
4. Continued
(c) Assess shortcomings in your manager’s approach.
Commentary on Question:
Most candidates performed poorly on part (c). Some candidates identified
Brownian motion as inappropriate. Very few mentioned that term structure is
needed.
1. Identification: Brownian process is not the best choice for fixed income [or
interest rate] process.
Assessment: Interest rates are usually modeled as mean reverting.
Assessment: Cox-Ingersoll-Ross process is a better [or popular] option.
2. Identification: Need information about the spot rate term structure.
Assessment: The portfolio consists of various coupon-paying bonds. Need to
model the term structure.
3. Geometric Brownian Motion is not a Martingale process; normal Brownian
motion is. (Step 1)
4. Starting spot rate should be the same for all paths, not varying by simulation.
(Step 3)
(d)
(i) Suggest the most applicable variance reduction technique for each of the
projects.
(ii) Provide a brief description for each technique.
Commentary on Question:
Most candidates suggested the correct variance reduction techniques with
supporting explanations.
(i) Project I: Recommend Control Variate Technique.
Project II: Recommend Importance Sampling Technique.
(ii) Control Variates - used to price a derivative with no analytical solution
where there exists some similar derivative that has a closed-form solution.
The control variate estimate of the Eurpoean call price is fA = fAMCS –
fBMCS + fB.
Importance Sampling - Sample only from the paths where the option ends
up in the money. If F is the distribution function for the underlying and p
is the probability of the option ending up in the money, work with G=F/p.
CFE FD Spring 2015 Solutions Page 12
5. Learning Objectives: 3. The candidate will understand how and when to apply various stochastic
techniques to situations which have uncertain financial outcomes.
4. The candidate will understand how to critique the appropriateness of advanced
risk assessment methods for a given situation.
Learning Outcomes:
(3g) Explain the benefits and limitations of Value-at-Risk, Incremental Value-at-Risk,
Component Value-at-Risk, and Expected Shortfall as tail risk measures.
Pricing
(4a) Apply and interpret the results of equilibrium pricing and no-arbitrage pricing
theory to risk valuation.
Sources:
Artzner, Application of Coherent Risk Measures
Panjer, Ch 5, No-Arbitrage Pricing Theory
Commentary on Question:
Commentary listed underneath question component.
Solution:
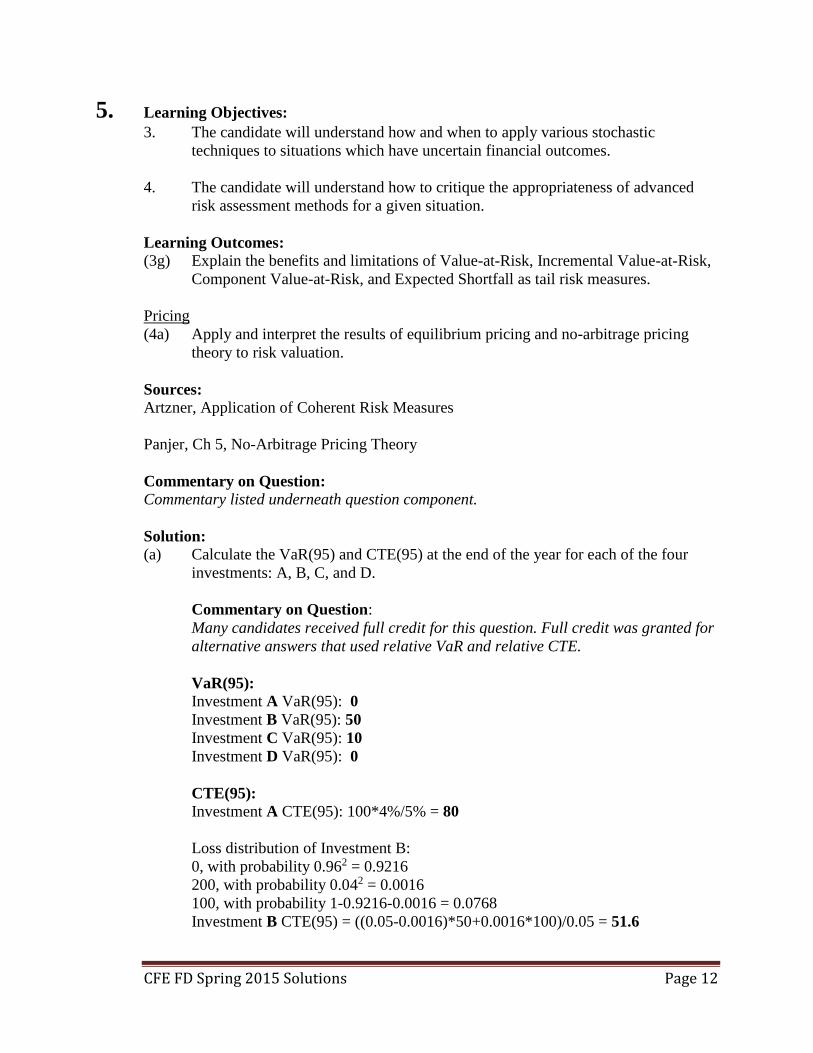
(a) Calculate the VaR(95) and CTE(95) at the end of the year for each of the four
investments: A, B, C, and D.
Commentary on Question:
Many candidates received full credit for this question. Full credit was granted for
alternative answers that used relative VaR and relative CTE.
VaR(95): Investment A VaR(95): 0
Investment B VaR(95): 50
Investment C VaR(95): 10
Investment D VaR(95): 0
CTE(95):
Investment A CTE(95): 100*4%/5% = 80
Loss distribution of Investment B:
0, with probability 0.962 = 0.9216
200, with probability 0.042 = 0.0016
100, with probability 1-0.9216-0.0016 = 0.0768
Investment B CTE(95) = ((0.05-0.0016)*50+0.0016*100)/0.05 = 51.6

CFE FD Spring 2015 Solutions Page 13
5. Continued
Investment C CTE(95): 10
Investment D CTE(95): 300*0.2%/5% = 12
(b) Contrast the use of VaR and CTE for evaluating the following:
(i) Risk concentration for Investments A and B.
(ii) Tail risk for Investments C and D.
Commentary on Question:
Few candidates were able to step back from the results and compare the risks
behind each pair of investments versus what VaR and CTE conveyed.
Investments A & B:
The two investments are identical, except that Investment A invests in one bond
while Investment B invests in two identical and independent bonds. Investment A
has higher concentration risk.
VaR suggests Investment A is less risky, and that diversification increases risk.
CTE correctly points out that Investment A is riskier. VaR does not address risk
concentration properly.
Investment C & D:
The two investments have the same PV. However, Investment D has extreme loss
at its tail. Investment D is at least as risky as investment C because of its
magnitude of loss.
VaR suggests that there is no risk for investment D, which is incorrect. VaR tells
us the maximum loss at 95% confidence, but it does not provide any information
beyond the 95% confidence level. Investment D has an extreme loss that VaR
isn't able to measure. CTE is able to capture the tail risk of Investment D.
(c) Critique the student’s statement. Support your critique.
Commentary on Question:
Many candidates were able to identify the fact that insurance risk and default risk
are two different risks that can’t be hedged by each other. There are other
problems with the student’s statement. However, few candidates could identify the
problems other than the basis difference described above.
For an instrument to perfectly offset a liability, the instrument has to be the
liability itself or its derivative. Default of Investment A is mostly likely, if not
totally, independent to the insurance liability.

CFE FD Spring 2015 Solutions Page 14
5. Continued
Interest rate derived from market price of Investment A reflects credit risk,
liquidity margin, buy-sell spreads and other margins of Investment A, which
may not be suitable to discount the insurance liability. Selection of interest
rate for an insurance liability should reflect its risk and purpose.
No-arbitrage pricing theory requires investments to be available in the market
so that a replicating portfolio can be constructed. Liability of life insurance
contract is likely not to be available in the market. So, this method won't
work.
The timing of the insurance liability payment is unknown, unlike the known
payoff period of ZCB.

CFE FD Spring 2015 Solutions Page 15
6. Learning Objectives: 3. The candidate will understand how and when to apply various stochastic
techniques to situations which have uncertain financial outcomes.
Learning Outcomes:
(3b) Assess the appropriateness of a given stochastic simulation technique to quantify
various market risk exposures.
(3e) Interpret the results of a given application of stochastic modeling and the impact
of the chosen calibration process used.
(3g) Explain the benefits and limitations of Value-at-Risk, Incremental Value-at-Risk,
Component Value-at-Risk, and Expected Shortfall as tail risk measures.
Sources:
Dowd, Ch. 2, Measures of Financial Risk
Dowd, Ch. 4, Non-parametric Approaches
Dowd, Ch. 16, Model Risk
Huynh, Ch. 14, Risk Management and VaR
Hardy, Ch. 3, Maximum Likelihood Estimation for Stock Return Models
Commentary on Question:
Commentary listed underneath question component.
Solution:
(a) Explain why ROSY is a coherent risk measure.
Commentary on Question:
Very few candidates identified that ROSY is a spectral risk measure. Credit was
awarded for alternative answers that correctly referred to ROSY as a linear
combination or sum of coherent risk measures.
The weights given to higher losses are weakly increasing (the applied weights are
0 for 0 < p < 0.9, 5 for 0.9 < p < 0.98, and 30 for 0.98 < p < 1).
ROSY is a spectral risk measure and thus coherent since all spectral risk measures
are coherent.

CFE FD Spring 2015 Solutions Page 16
6. Continued
(b)
(i) Calculate ROSY using the basic historical simulation approach on all 100
years of data. Show your work.
(ii) Describe two advantages and two disadvantages of this approach for
Tybee.
Commentary on Question:
Candidates generally performed well in this section. In section (ii), a common
error was to discuss advantages and disadvantages of ROSY, which was not what
the question is asking. Correct alternative answers received full credit.
CTE(90%) = (550 + 485 + 434 + 408 + 403 + 367 + 327 + 266 + 265 + 249)/10 =
375.4
CTE(98%) = (550 + 485)/2 = 517.5
ROSY = (CTE(90%) + CTE(98%))/2 = (375.4 + 517.5)/2 = 446
Advantages:
Simple to implement in spreadsheet
Simple to explain to town council
Disadvantages :
Does not allow for more extreme events than those observed (black swans)
Subject to ghost effects in the future as top 10 snowfall events fall outside
100-year sample period
(c)
(i) Calculate ROSY using the delta-normal approach on all 100 years of data.
Show your work.
(ii) Explain why the delta-normal approach is inappropriate for this data.
Show your work.
Commentary on Question:
Many candidates were able to calculate ROSY using the delta-normal approach.
However, candidates did not perform well in part (ii). For part (ii), candidates
who received full credit were able to use data provided by the question to support
their reasoning.
(i) CTE(90%) = 99 + 112*1.755 = 295.56
CTE(98%) = 99 + 112*2.421 = 370.15
ROSY = (CTE(90%) + CTE(98%))/2 = (295.56 + 370.15)/2 = 332.86

CFE FD Spring 2015 Solutions Page 17
6. Continued
(ii) 5% of historical observations are above 370, the model average of the
worst 2%.
The data exhibits a fatter tail than a normal distribution can provide. Using
the delta-normal method will underestimate the risk measures of fat-tailed
distributions.
(d)
(i) Determine the maximum likelihood estimate (MLE) for the exponential
distribution parameter λ using all 100 years of data. Show your work.
(ii) Calculate ROSY using an exponential distribution with the parameter
estimated in (d)(i). Show your work.
Commentary on Question:
Candidates generally performed well on part (d).
(i) l(λ) = Sum from i = 1 to 100 of log f(x(i))
= Sum from i = 1 to 100 of log λe-λx(i)
= Sum from i = 1 to 100 of [(log λ) - λx(i)]
= 100 log λ - 9900λ (since average of x(i) is 99)
l'(λ) = 100/λ - 9900
Setting l'(λ) to 0 yields parameter estimate λ* = 100/9900 = 1/99
(ii) CTE(90%) = (1 - log(1 - 0.9))(1/(1/99)) = 99(1 - log(0.1)) = 327.3
CTE(98%) = (1 - log(1 - 0.98))(1/(1/99)) = 99(1 - log(0.02)) = 486.8
ROSY = (CTE(90%) + CTE(98%))/2 = (327.3 + 486.8)/2 = 407
(e) Explain why using the mixed exponential distribution will cause ROSY to
increase compared to the result from (d)(ii).
Commentary on Question:
Few candidates realized that by randomizing one of the parameters of a
distribution, overall variability increased.
Introducing a mixing variable increases the uncertainty and widens the probability
distribution. This will cause the CTE calculations to produce higher results and
ROSY to increase.

CFE FD Spring 2015 Solutions Page 18
6. Continued
(f) Describe the directional impact moving from 100 years to 50 years of calibration
has on ROSY for each of the following approaches. Justify each answer.
(i) The non-parametric approach in (b)
(ii) The exponential parametric approach in (d)
(iii) The mixed exponential parametric approach in (e)
Commentary on Question:
Most candidates did well on part (i) and (ii) but poorly on part (iii). However,
most candidates thought ROSY would decrease for the mixed exponential model,
which was not correct.
(i) Non-parametric approach:
ROSY will decrease
ROSY = (485 + 367 + 327 + 266 + 265)/2 + 485/2 = 413.5 < 446
(ii) Exponential approach:
ROSY will decrease
ROSY is proportional to the average, which decreases from 99 to 97
(iii) Mixed exponential approach:
ROSY will increase
Smaller data set for calibration will increase parameter estimation error
and lead to wider mixed distribution
(g) Recommend an approach, of the three in (f), that Tybee should adopt to calculate
ROSY. Justify your recommendation.
Commentary on Question:
Candidates performed well on this question. Correct alternative answers other
than non-parametric methods (provided below) were awarded credit. Candidates
were expected to give sufficient justification to receive full credit.
Recommend: Non-parametric justifications
It is easy to explain to the town council, unlike the other two.
It is simple to put into a spreadsheet and update without actuary's help, unlike
mixed exponential approach.
It produces a higher result than exponential, a politically savvy result.

CFE FD Spring 2015 Solutions Page 19
6. Continued
(h) Recommend an approach that would likely provide a better fit to the historical
pattern of snowfall than any of the three in (f). Justify your recommendation.
Commentary on Question:
In general, candidates performed poorly on this question. Many candidates
recommended a method to project snowfall pattern, while the question asked for
an approach to fit historical data.
Recommend: A regime-switching model:
High and low snowfalls appear to happen in batches, and a regime-switching
model may provide a better fit for high and low snowfall periods.
CFE FD Spring 2015 Solutions Page 20
7. Learning Objectives: 3. The candidate will understand how and when to apply various stochastic
techniques to situations which have uncertain financial outcomes.
5. The candidate will understand how to identify and recommend appropriate risk
assessment and monitoring techniques for financial risk management.
Learning Outcomes:
(3a) Explain the mathematical foundation of stochastic simulation.
(5a) Evaluate the methods and processes for measuring and monitoring market risk
positions.
(5b) Describe the types of models and the sources of model risk.
(5e) Interpret the results of back-testing.
Sources:
Dowd, Measuring Market Risk 2nd ed, Ch 6
Dowd, Measuring Market Risk 2nd ed, Ch 7
Commentary on Question:
Commentary listed underneath question component.
Solution:
(a) List one advantage and one disadvantage of constructing a parametric model of
daily profit/loss using each of the following distributions:
(i) Normal
(ii) t with 5 degrees of freedom
(iii) Levy with alpha = 1.5
Commentary on Question:
In general, candidates did well on this part. No credit was given for stating the t-
distribution is a complicated distribution. Candidates only need to state one
advantage and one disadvantage to receive full credit.
Advantages of normal distribution:
Requires only two independent parameters
Disadvantages of normal distribution:
Most financial returns have excessive kurtosis/fatter than normal tails

CFE FD Spring 2015 Solutions Page 21
7. Continued
Advantages of t distribution:
Accommodates excess kurtosis through the choice of the degrees of freedom
Disadvantages of t distribution:
Fails to limit maximum possible losses
Advantages of Levy distribution:
Accommodates fat tails of financial return data
Disadvantages of Levy distribution:
Variance of non-normal Levy is infinite, widespread evidence on financial returns
suggests they are finite
(b) Recommend a type of distribution from (a) to fit data with a mean of 3, variance
of 4, and kurtosis of 5. Justify your answer.
Commentary on Question:
This is a comprehension question. Most candidates were able to justify why the
normal distribution was not appropriate. Few candidates correctly identified the
infinite variance when Levy has alpha less than 2.
Recommend the use of the t distribution over the normal and Levy.
A kurtosis of 5 means that there is a presence of excess kurtosis in the sample
data. This suggests that a distribution with fat tails should be utilized. This
eliminates the normal distribution due to its limited kurtosis.
The presence of a finite variance of 4 suggests that the Levy distribution would be
inappropriate. With an alpha less than 2, the distribution would yield an infinite
variance. This would not yield an appropriate fit.
(c) Calculate the following. Show your work.
(i) Expected daily portfolio return
(ii) Five-day portfolio VaR(95)
Commentary on Question:
In general, candidates did not do well on (i). Most candidates did not multiply by
portfolio value to get the expected portfolio return. Most candidates received only
partial credit for part (ii) because they did not perform the covariance matrix
math or the VaR section, or both, correctly.
CFE FD Spring 2015 Solutions Page 22
7. Continued
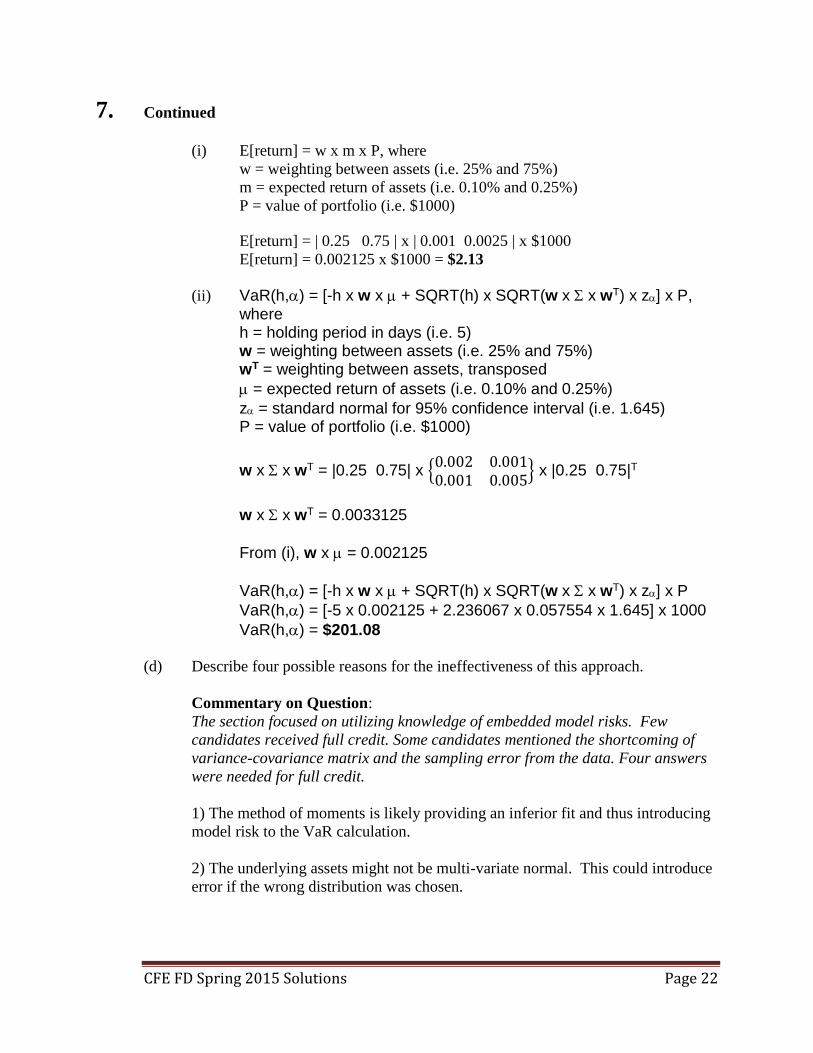
(i) E[return] = w x m x P, where
w = weighting between assets (i.e. 25% and 75%)
m = expected return of assets (i.e. 0.10% and 0.25%) P = value of portfolio (i.e. $1000)
E[return] = | 0.25 0.75 | x | 0.001 0.0025 | x $1000
E[return] = 0.002125 x $1000 = $2.13
(ii) VaR(h,) = [-h x w x + SQRT(h) x SQRT(w x x wT) x z] x P, where h = holding period in days (i.e. 5) w = weighting between assets (i.e. 25% and 75%) wT = weighting between assets, transposed
= expected return of assets (i.e. 0.10% and 0.25%)
z = standard normal for 95% confidence interval (i.e. 1.645) P = value of portfolio (i.e. $1000)
w x x wT = |0.25 0.75| x {0.002 0.0010.001 0.005
} x |0.25 0.75|T
w x x wT = 0.0033125
From (i), w x = 0.002125
VaR(h,) = [-h x w x + SQRT(h) x SQRT(w x x wT) x z] x P
VaR(h,) = [-5 x 0.002125 + 2.236067 x 0.057554 x 1.645] x 1000
VaR(h,) = $201.08
(d) Describe four possible reasons for the ineffectiveness of this approach.
Commentary on Question:
The section focused on utilizing knowledge of embedded model risks. Few
candidates received full credit. Some candidates mentioned the shortcoming of
variance-covariance matrix and the sampling error from the data. Four answers
were needed for full credit.
1) The method of moments is likely providing an inferior fit and thus introducing
model risk to the VaR calculation.
2) The underlying assets might not be multi-variate normal. This could introduce
error if the wrong distribution was chosen.

CFE FD Spring 2015 Solutions Page 23
7. Continued
3) Variance-covariance matrix might be inferior to copula approaches; or
covariance variance might be misestimated.
4) Sampling error. Covariance or variance on the underlying asset is higher than
the underlying data.
(e) Recommend two ways to improve the forecast of extreme losses.
Commentary on Question:
This is a knowledge utilization question. Most candidates were awarded partial
credit. Few received the full credit. Partial credit was awarded for
recommending CTE. Two correct answers were needed for full credit.
1) Use a copula approach to estimate the dependence structure from the joint
distribution functions, instead of using a variance-covariance matrix. This is a
more fundamentally valid approach.
2) Utilize extreme value theory and fit the distribution to tail values above the
95% confidence interval. This will focus on providing a quality fit in the upper
tail of the distribution which is the focus of how this is being used.

CFE FD Spring 2015 Solutions Page 24
8. Learning Objectives: 1. The candidate will understand how a business enterprise funds its activities with
considerations for its business model, and the cost and constraints of the sources
of capital.
Learning Outcomes:
(1a) Describe the steps to procuring capital funding (treasury function).
(1b) Assess the various features and implications of various sources of capital funding
and recommend the optimal approach for funding.
(1d) Assess whether the risky return from a new project or ongoing business is
sufficient to employ investor capital
(1e) Evaluate the return on employed capital using NPV, IRR and Payback period.
(1f) Apply real options analysis to recommend and evaluate firm decisions on capital
utilization.
Sources:
Berk, Ch 22, Real Options
Berk, Ch 23, Raising Equity Capital
Commentary on Question:
This question tested candidates understanding of decision tree analysis, valuing
companies, evaluating real options, and understanding the IPO process. Many
candidates understood the concepts of the question but failed to calculate the values
correctly.
Solution:
(a) Calculate the value of CEC.
Commentary on Question:
Candidates generally performed well on this comprehension section. Successful
candidates recognized that the CEC free cash flow needed to be increased by 8%
in the present value calculation.
Last year's Free Cash Flow = 2.6M
Value of CEC = 50%*2.6M*(1.08)/(12%-8%) = 35M

CFE FD Spring 2015 Solutions Page 25
8. Continued
(b)
(i) Sketch the decision tree associated with this decision.
(ii) Calculate the value of the option to delay your decision.
(iii) Recommend whether to delay your decision or invest immediately.
Support your recommendation.
Commentary on Question:
Candidates generally performed poorly on this question. Successful candidates
were able to diagram all decision and information nodes, which aided in setting
up the value of the deal with the option.
(i) In order to get full credit, the candidates had to show a distinction
between decision nodes and information nodes.
(ii) A common error was attempting to subtract the first year's cash flow that
was given up upon taking the option. Furthermore, some candidates did
not complete this last step and stated that the value of the option was the
value of the deal with the option.
Value of the deal without the option = Value of CEC from part (a) minus
the sale price: $35M - $30M = $5M
The cash flows from CEC 1 year from now will be $2.6M*1.08^2, so the
value of CEC if purchased at time 2 and it hasn’t gone bankrupt is:
($2.6M*1.08^2)/(12%-8%) = $75.816M
Purchase or Delay
Purchase
Cost (-$30M)
50% Good
Value ($70M)
50% Bad
Value ($0)
Delay
Cost ($0)
50% Good
Purchase
Value ($23M)
50% Bad
Abandon
Value ($0)

CFE FD Spring 2015 Solutions Page 26
8. Continued
Value of the purchase discounted back to time zero and applying the 50%
probability of bankruptcy:
($75.816-$50M)*50% = $11.5M
Value of the deal with the option = $11.5M
Value of the option is the value of the deal with the option minus the value
of the deal without the option:
$11.5M – $5M = $6.5M
(iii) It is recommended to delay the investment decision because the expected
present value with the option is $11.5M compared to $5M without the
option. The option has positive value.
(c)
(i) List two costs and two benefits to CEC’s current owners of an IPO.
(ii) List two methods an underwriter may use to value a firm for an IPO.
Commentary on Question:
Candidates generally performed well in identifying the costs and benefits of an
IPO in this retrieval question. Candidates generally did not perform well in
identifying how to value an IPO.
Candidates were not given credit for reasons other than the first two of costs,
benefits, and methods. Explanations were not required.
Costs:
Loss of control
Increased regulation, such as by the SEC
Benefits:
Increased liquidity, especially for the original owners, who are able to get
some of their invested money out of the company
Better access to capital
Many candidates mistakenly listed ways to execute or launch an IPO, not how to
value one. While the answers they gave were true, they were not what the
question was asking.
Ways to Value:
Present value of future cash flows
Examine comparable companies
CFE FD Spring 2015 Solutions Page 27
9. Learning Objectives: 2. The candidate will understand how an enterprise’s structure and policies allow its
management to prioritize and select among projects or business activities that are
competing for scarce capital resources.
Learning Outcomes:
(2e) Describe considerations for the risk borne by capital employed.
(2f) Design a risk management plan to optimize the risk reward trade off of capital
employed.
(2g) Evaluate human behavioral biases in the decision making processes
Sources:
Berk Ch 29, Corporate Governance
Berk Ch 30, Risk Management
F-116-14, High Risks of Short Term Management
Commentary on Question:
Commentary listed underneath question component.
Solution:
(a) Critique the appropriateness of the discount rate used to value the VFPP.
Commentary on Question:
Most candidates recognized the VFPP is riskier but few identified the size of the
project could also affect the discount rate.
Discount rate seems appropriate given size and riskiness of the project.
Riskiness: Although there are 20 other projects being undertaken this year, this
project is in risky Vietombia, which may mean the project-based WACC would
go up and this is a significant project relative to the other projects.
Size: This project is significantly larger than the other projects and has the
potential to cause financial distress.
(b) Describe three factors that investors should look for that would commonly be
found in companies with a long-term horizon.
Commentary on Question:
Candidates did not perform well on this retrieval question.

CFE FD Spring 2015 Solutions Page 28
9. Continued
Terminology Used on Earnings Calls - Companies with long-term time horizons
generally use language such as "long-term" or "years" on their conference calls if
they truly are investing long-term.
Lower than Average Volatility of Earnings/Stock Returns - Long-term companies
generally have a lower than average volatility of earnings and stock returns
Lower Estimated Cost of Equity Capital - Because long-term investing companies
are perceived as less risky, they generally have a lower equity cost of capital
(c)
(i) Demonstrate how the Vietombia bank can execute a currency hedge using
a cash-and-carry strategy. Show your work.
(ii) Contrast the advantages of hedging using a forward contract versus a cash-
and-carry strategy for the Vietombia bank.
Commentary on Question:
Most candidates could answer the major components of the cash-and-carry
strategy – borrow, exchange, invest, and repay. Some candidates did not use the
correct borrowing amount to accurately hedge the bank’s exposure. A common
error was to borrow $10m instead of $10m / 1.01% = $9.9m.
A common error in part (ii) was not linking the advantages of a forward contract
to the Vietombia bank.
(i) In one year, the bank will provide $10,000,000 * 0.717 = 7,170,000 R in
exchange for US dollars.
Borrow dollars today at the US Interest Rate. The bank can borrow
$10,000,000/1.01 = $9,900,990.10 and repay this in one year with the
money from the exchange.
Convert the dollars to Rubiaceae at today's spot rate, which results in
$9,900,990 * 0.70 R/$ = 6,930,693.07 R
Invest the Rubiaceae at the current Rubiaceae interest rate, to get the
necessary money = 6,930,693.07 R * 1.03453 = 7,170,000 R
In one year, the bank will have the Rubiaceae needed to give to Frenz to
pay VFPP, and the bank will receive $10,000,000, which will be used to
pay back the original loan.
CFE FD Spring 2015 Solutions Page 29
9. Continued
(ii) Vietombia is not a large bank with a stable currency so it would likely be
unable to execute a cash-and-carry at lower transaction costs. Cash-and-
carry is easier for large banks which can borrow easily and have low costs.
Forward contracts are simpler and so would be better for Vietombia bank
which may not have hedging experience. Cash-and-carry is more
complex.
Forward contracts are better for firms that are not able to borrow easily in
different currencies and may pay a higher interest rate if their credit
quality is poor - Vietombia bank may fit in this category.
Dodd-Frank constraints, such as clearing expenses or margin/collateral
requirements if U.S. counterparty.
CFE FD Spring 2015 Solutions Page 30
10. Learning Objectives: 1. The candidate will understand how a business enterprise funds its activities with
considerations for its business model, and the cost and constraints of the sources
of capital.
2. The candidate will understand how an enterprise’s structure and policies allow its
management to prioritize and select among projects or business activities that are
competing for scarce capital resources.
Learning Outcomes:
(1e) Evaluate the return on employed capital using NPV, IRR and Payback period.
(2a) Evaluate how the legal form of an organization, corporate governance and/or
compensation dynamics impact decision-making on projects or business
activities.
(2e) Describe considerations for the risk borne by capital employed.
(2f) Design a risk management plan to optimize the risk reward trade off of capital
employed.
Sources:
CFF-T114-14, Corporate Governance
CFF-T115-14, Risk Management
Commentary on Question:
This question tested candidates’ ability to analyze corporate structures and governance,
specifically with regards to vertically-structured companies, and identify and evaluate
the downsides of these structures to certain stakeholders.
Solution:
(a)
(i) Identify the strategy used by BJ Air when purchasing BJ Tire.
(ii) Describe the primary benefit to BJ Air of having BJ Tire as its sole
supplier.
(iii) Explain whether BJ Air’s strategy is beneficial to BJ Air’s minority
shareholders.

CFE FD Spring 2015 Solutions Page 31
10. Continued
Commentary on Question:
Candidates were generally successful in identifying that the strategy was vertical
integration, but many candidates failed to recognize that, based on Modigliani
and Miller, firms do not add value by hedging risks that the investors can hedge
for themselves. Blue Jay Air is attempting to hedge against commodity risk, but
investors could purchase shares in a tire company themselves.
(i) Blue Jay Air's purchase of Blue Jay Tire is a Vertical Integration purchase.
(ii) The primary benefit to Blue Jay Air is that purchasing Blue Jay Tire
serves as a natural hedge against increasing costs of production. Because
an increase in the price of the commodity (tires) raises Blue Jay Air's costs
and Blue Tire's revenues, Blue Jay Air offsets its risk by merging.
(iii) This transaction would not be beneficial to someone who owns Blue Jay
Air stock. According to Modigliani and Miller, firms add no value by
doing something investors can do for themselves. Investors concerned
about this commodity price risk can diversify by "vertically integrating"
their portfolios and buying shares of both Blue Jay Air and Blue Jay Tire.
(b)
(i) Describe two capital structures that allow a shareholder to own less than
50% of a company and control over 50% of the voting rights.
(ii) Explain the primary advantage of these structures to the controlling
shareholder.
(iii) Calculate the percent of any Seal-Tite dividends Ruiz will receive,
ignoring taxes on dividends. Show your work.
(iv) Describe the primary concern a minority shareholder in Seal-Tite would
have with this organizational structure.
Commentary on Question:
Candidates generally performed poorly on this question. Many candidates did not
describe both capital structures. Many candidates did not deduce that the ability
to “tunnel” profits would be the primary concern of minority shareholders.

CFE FD Spring 2015 Solutions Page 32
10. Continued
(i) Dual Class Shares - Dual class shares exists when a company has two
classes of shares in which one has superior voting rights over the other.
Pyramid Structures - In a pyramid structure, a group creates a company in
which it owns more than 50% of the shares and has a controlling interest.
That company then purchases a controlling interest (50% or more) in
another company.
(ii) Dual Class Shares - The primary advantage is that is allows shareholder of
the company to raise additional capital and acquire other companies
without diluting their own control.
Pyramid Structures - Primary advantage is that the controlling shareholder
has less ownership investment lower down in the pyramid but still remains
in complete control of all companies in the pyramid.
(iii) Ruiz will receive 0.37 * 0.35 * 0.80 = 10.36% (without tax considerations)
(iv) Primary concern would be that the structure creates a conflict of interest,
where Ruiz has an incentive to try and move profits away from Seal-Tite
and up to Blue Jay Air, so he receives a larger portion of the profits, which
is known as tunneling. Ruiz could accomplish this by having Blue Jay
Tire buy supplies from Seal-Tite at prices that are extremely favorable to
BJT but that hurt Seal-Tite.
(c)
(i) Describe the three main frictions that cause an insurance company’s
premium to be greater than the actuarially fair price.
(ii) Calculate the premiums for Policy I and Policy II.
Commentary on Question:
While many candidates were able to identify the main frictions, some failed to
provide adequate explanation to earn full credits. The model solution is more
comprehensive than what is needed for full credit. Many candidates did not
calculate reinsurance premiums correctly. Common errors were not discounting
and applying incorrect discount rates.
(i) Administrative and Overhead Costs of Insurance: The insurance company
must sell, underwrite, price, and administer the insurance contracts, which
requires personnel and physical resources. The costs of these expenses are
generally passed along to the customer in the premium cost.

CFE FD Spring 2015 Solutions Page 33
10. Continued
Adverse Selection: A person or a firm's desire to buy insurance may
signal that they are an above-average risk. If people/firms have private
information about how risky they are, insurance companies will ask to be
compensated for this anticipated additional risk.
Moral Hazard (Agency Costs): A person may change their behavior as a
result of having insurance. The increased likelihood of a claim due to
changes in policyholder behavior may be factored into the cost of
insurance.
(ii) Use CAPM to calculate cost of capital:
r(l) = r(f) +β(l) * (r(mkt) - r(f))
r(l) = 6% + (-1.5) * (9.0% - 6.0%) = 1.5%
Premium = (Loss * Probability of Loss) / (1 + Cost of Capital) *
(Insurance Company Surcharge)
Policy 1: [($30,000,000 * 0.03) / (1.015)] * 1.15 = $1,020,000
Policy 2: [($60,000,000 * 0.035) / (1.015)] * 1.15 = $2,379,000
(d) Determine which policy, if either, Seal-Tite should purchase assuming the
following actual risks of loss due to fire:
(i) 5.0%. Show your work.
(ii) 4.5%. Show your work.
Commentary on Question:
Many candidates did not apply the NPV technique to evaluate the reinsurance
contracts. Alternative methods that produced the correct answer were awarded
full credit.
(i) Formula: NPV = - (Premium) + [(Probability of Loss) * (Coverage)] / (1 +
Cost of Capital)
NPV(Policy 1) = -$1,019,704.43 + (0.05 * $30,000,000) / (1.015) =
$458,128.08
NPV(Policy 2) = -$2,379,310.34 + (0.05 * $60,000,000) / (1.015) =
$576,354.69
With a 5% true risk of loss, select Policy 2, as it has a higher Net Present
Value.

CFE FD Spring 2015 Solutions Page 34
10. Continued
(ii) Formula: NPV = - (Premium) + [(Probability of Loss) * (Coverage)] / (1 +
Cost of Capital)
NPV(Policy 1) = -$1,019,704.43 + (0.045 * $30,000,000) / (1.015) =
$310,344.83
NPV(Policy 2) = -$2,379,310.34 + (0.045 * $60,000,000) / (1.015) =
$280,788.18
With a 4.5% true risk of loss, select Policy 1, as it has a higher Net Present
Value.
CFE FD Spring 2015 Solutions Page 35
11. Learning Objectives: 4. The candidate will understand how to critique the appropriateness of advanced
risk assessment methods for a given situation.
Learning Outcomes:
(4f) Assess approaches to quantify risks when there is limited data.
Sources:
F-118-14, Modern Operational Risk Management
Recognizing When Black Swans Aren't
Commentary on Question:
Commentary listed underneath question component.
Solution:
(a) Contrast the traditional and modern approaches to operational risk management.
Commentary on Question:
This comprehension question asked candidates to identify differences between the
two main risk management frameworks, traditional and modern. Most candidates
did well on this part, although some did not identify more than one or two
differences.
Traditional Risk Management:
Begins with risk identification process
Focus is on high probability / high impact losses
Treats risks as if there is only one bad outcome
Requires a tactical solution
Modern Risk Management:
Evaluates risk in terms of risk / reward
Focus is on low probability / high impact losses
Uses actuarial methods to look at the probability and severity of potential
outcomes
Is related to strategic issues
(b) Describe the three elements of a “Black Swan” event, according to Nassim Taleb,
the author of The Black Swan.
Commentary on Question:
Candidates were expected to list and give a brief description of the three elements
that constitute a “Black Swan”. Most candidates were able to correctly identify at
least two elements for this retrieval question.

CFE FD Spring 2015 Solutions Page 36
11. Continued
1. Outlier - The event is beyond the realm of regular expectations
2. Extreme Impact - Result of the event has a large influence on the process
being observed
3. Retrospective Predictability - In spite of being an outlier, we are able to come
up with an explanation after the fact for why it should have been predicted
(c) Defend the statement: “A Black Swan event is relative to knowledge.”
Commentary on Question:
Most candidates were able to explain at least one reason for why a “Black Swan”
is relative to knowledge.
An event can only be a “Black Swan” if it is not part of one’s expectations.
Therefore, if you know or are aware that something is possible, it cannot be a
“Black Swan”. The inability to predict outliers is at the heart of the definition of a
“Black Swan” and knowledge of the possibility of a certain potential event makes
us able to prospectively predict that event.
(d) Explain four improvements to Brown’s reserving model that could help to move
rare events from “Black Swans” to “Large-Scale, Large-Impact Rare Events.”
Commentary on Question:
This analysis question tested candidates’ ability to understand how models can be
improved and apply it to a specific example from the case study. Many candidates
did not suggest model improvements or tie them back to the case study.
1. Better statistics and research will make help make events conceivable that
would otherwise be inconceivable. Every effort should be made to
continuously obtain the most robust and up-to-date solar panel data.
2. Pull apart the “black box” to truly understand what is going on instead of
blindly accepting results. The valuation model is based on the travel insurance
reserve engine and should be thoroughly understood and appropriately
updated or changed before being used.
3. Determine how and why a given change or accomplishment is likely to occur.
It is important to consider why all changes to the model are being
implemented while the model is in development.
4. Overlay results with common sense and experience. The model currently only
uses a limited number of risk factors and the parameters have been roughly
estimated. By analyzing model results and determining if they make sense we
can often detect if risk factors or parameters are off.
Other answers also received credit provided they were clear model improvements
and could be tied to the case study.

CFE FD Spring 2015 Solutions Page 37
11. Continued
(e) Support the plaintiff’s attorney’s statement that, “Although the failure of the Blue
Jay Tire was catastrophic for the Franklin family, it was definitely not a ‘Black
Swan’ event.”
Commentary on Question:
This part of the question asked candidates to explain why a specific event that
occurred in the case study was not a “Black Swan”. Most candidates were able to
identify at least one reason to support the attorney’s statement.
1. It was prospectively predictable - Deserts are hot and long trips at fast speeds
are not uncommon.
2. It was not really outside the realm of regular expectations - The head engineer
wrote a memo noting defects in the tires’ manufacturing and safety issues
were mentioned by Paul Gosling as well.
3. This event is subject to risk reduction - Tire failure is not a random or
unknown event and the likelihood of occurrence can be reduced with better
manufacturing and testing processes.
(f) Explain why a traditional operational risk approach would have been unlikely to
mitigate the circumstances leading to the Smallville, Arizona, Tire Explosion
Case.
Commentary on Question:
Most candidates did well on this knowledge utilization question.
Traditional operational risk management focuses on high probability / high impact
events. The tire explosion was a low probability event and thus would have
received a low rating measure under the Traditional approach.

CFE FD Spring 2015 Solutions Page 38
12. Learning Objectives: 5. The candidate will understand how to identify and recommend appropriate risk
assessment and monitoring techniques for financial risk management.
Learning Outcomes:
(5a) Evaluate the methods and processes for measuring and monitoring market risk
positions.
(5b) Describe the types of models and the sources of model risk.
(5c) Assess the methods and process for quantifying and managing model risk within a
financial institution.
Sources:
Dowd Ch 2, Measures of Financial Risk
Huynh Ch 14, Risk Management and VaR
Commentary on Question:
Commentary listed underneath question component.
Solution:
(a)
(i) Describe four characteristics that cause model risk for Darwin.
(ii) Evaluate Darwin’s exposure to each characteristic.
Commentary on Question:
Candidates did poorly on this section. Most were able to describe and evaluate
two or three characteristics, but very few were able to provide complete answers
for four characteristics of model risk. Common mistakes included providing
redundant answers (such as including both data and parameter errors) and not
giving enough detail to be considered a complete evaluation of Darwin’s
exposure. A full credit solution included descriptions of four characteristics,
along with an evaluation of whether or not Darwin was exposed to this risk and
why.
1. Complexity – A model with a large number of inputs and complicated
formulas can lead to complexity risk. Darwin is not at risk because the
company only models rho and delta hedges on its IVA business.
2. Transparency – The more accessible the model, the more management can
rely on the results. Darwin has a high level of transparency risk because only
Tim Jones and his small team are responsible for the hedging model, which is
isolated from the rest of the organization.

CFE FD Spring 2015 Solutions Page 39
12. Continued
3. Misspecification – A model with missing risk factors is subject to
misspecification modeling risk. Darwin is potentially at risk since it does not
model higher-order Greeks like vega and gamma. The company should test
these risks for materiality.
4. Application – A model may be correct but is misused for a particular purpose.
Darwin has some application model risk because even though they may be
comfortable that the hedge model is correct, they do not rebalance their
hedges as often as they could, which could lead to basis risk in the hedge
model.
(b) Evaluate the potential impact on shareholder value from Darwin’s individual
variable annuity (IVA) business due to the following market risks:
(i) Rho
(ii) Delta
(iii) Vega
(iv) Gamma
Commentary on Question:
This knowledge utilization question required candidates to simultaneously
describe a risk and its impact to Darwin. Most candidates were able to correctly
determine what impact the Greeks would have on shareholder value provided a
given movement. Complete answers included a description of what portion of
Darwin’s business was at risk for each Greek.
(i) Interest rate risk – A decrease in interest rates will increase the present
value of guarantees attached to the IVAs, which will decrease shareholder
value because of an increase in capital. A 50% rho hedge does not
completely eliminate interest rate risk.
(ii) Equity risk – A decrease in equity values will increase Darwin’s exposure
to the IVA’s guarantees even with a 90% delta hedge. This will cause an
increase in capital which will lower shareholder value.
(iii) Volatility risk – An increase in volatility will increase hedging costs and
can put the IVA guarantees in the money. Between increased costs and
higher capital requirements, shareholder value would be lowered from
adverse vega movement.

CFE FD Spring 2015 Solutions Page 40
12. Continued
(iv) Gamma risk – Equities are delta hedged, but gamma is unhedged. Since
hedge effectiveness is only evaluated quarterly the delta hedge alone may
not cover significant swings in equity values, which would cause a
decrease in shareholder value due to an increase in capital requirements.
(c) Critique the statement made by Mr. Jones from the perspective of:
(i) Darwin’s IVA business
(ii) RPPC’s Risk Management Framework
Commentary on Question:
This knowledge utilization question required candidates to critique a statement on
the use and results of stress testing from differing viewpoints of the business unit
and ERM program overall. Most candidates were able to come up with at least
one valid critique of Mr. Jones’ statement from both Darwin’s and RPPC’s
perspectives.
(i) Reduced exposure to interest rate risk in the IVA business will decrease
volatility in the business’ earnings, making them more predictable.
However, the increased hedge may lower earnings because of the
increased hedging costs required by the increased hedge amount.
(ii) Increased rho hedging can reduce earnings volatility and bring the IVA
line within the risk tolerance of the overall ERM program. However, this
may be an overhedge if RPPC is doing a macro hedge or depending on
multi-line diversification to mitigate rho risk across the company as a
whole.
(d) Recommend three improvements to RPPC’s Risk Management Framework.
Commentary on Question:
Recommendations without the proper support or that weren’t related to the case
study did not receive full credit. Candidates generally did well on this knowledge
utilization question.
1. Integrate the market assumption-setting process across the various business
lines. This creates transparency for management (instead of just the hedge
team understanding the assumptions), consistency, and provides a view of the
overall ERM impact of a change in assumptions.

CFE FD Spring 2015 Solutions Page 41
12. Continued
2. Implement dynamic policyholder behavior assumptions. Because of the static
assumption, the ERM program may be under-protected as policyholder
behavior may change during adverse market scenarios for several products
(IVA, ULSG, etc.).
3. Perform more frequent stress tests and include hypothetical scenarios rather
than focusing so much on historical events.
Other improvements received full credit provided they were applicable to the case
study and were improvements for RPPC as a whole, not just Darwin.

CFE FD Spring 2015 Solutions Page 42
13. Learning Objectives: 4. The candidate will understand how to critique the appropriateness of advanced
risk assessment methods for a given situation.
Learning Outcomes:
(4b) Evaluate the risk margin as a cost of risk capital within a risk valuation
framework.
Sources:
F-107-13, A Market Cost of Capital Approach to Market Value Margins
Commentary on Question:
Commentary listed underneath question component.
Solution:
(a) Define the following terms:
(i) Market consistent value of liabilities (MVL)
(ii) Solvency capital requirement (SCR)
(iii) Market value margin (MVM)
Commentary on Question:
Most candidates were able to properly define the market consistent value of
liabilities and market value margin in this retrieval question. Most candidates
were not able to define the solvency capital requirement. While most candidates
were able to partially describe the SCR, they often did not provide the two
necessary key pieces of its definition. Some candidates also confused SCR with
MCR.
(i) Market Consistent Value of Liabilities:
MVL is the market consistent value at which the liabilities could be
transferred to a willing, rational, diversified counterparty in an arm’s
length transaction under normal business conditions.
Exact wording was not required. Credit was awarded for correct
equivalent wording.
(ii) Solvency Capital Requirement:
The SCR at time 0 is set at the 99.5% Value at Risk for non-hedgeable risk
types for a one year period.
CFE FD Spring 2015 Solutions Page 43
13. Continued
(iii) Market Value Margin
MVM is the cost of risk. It is a risk margin in addition to the expected
present value of cash flows required to manage the business on an ongoing
basis.
(b)
(i) List the five components of MVL.
(ii) Identify which components of MVL may be valued using available market
prices.
Commentary on Question:
Overall, candidates did well on this retrieval section. A majority of candidates
did not answer that the MVL is made up of the MVM for hedgable and non-
hedgable financial and non-financial risks. Most candidates left off “MVM” for
these 4 components and were not awarded full credit.
(i) Five components of MVL:
Present value of expected future cash flows or the best estimate
liability
MVM for hedgeable financial risks
MVM for hedgeable non-financial risks
MVM for non-hedgeable financial risks
MVM for non-hedgeable non-financial risks
(ii) May be valued with market prices:
Present value of expected future cash flows or the best estimate
liability
MVM for hedgeable financial risks
MVM for hedgeable non-financial risks
(c) Calculate the time 0 MVL for Wright’s term insurance business. Show your
work.
Commentary on Question:
Few candidates were awarded full credit on this comprehension question. Most
received significant partial credit. The most common errors were not discounting
the present value of the cost of capital charges correctly, including the premiums
in the present value of benefits calculation, and not recognizing that the SCR was
a percentage of the present value of benefits (15%) and calculating its different
values at each time step.

CFE FD Spring 2015 Solutions Page 44
13. Continued
Time step (end of year) 0 1 2 3 4
Premium 50,000 0 0 0 0
Claims & Expenses 0 15,000 15,000 15,000 0
PV of Benefits (at 3%) 42,429 28,702 14,563 0 0
SCR (= 15% * PV of Benefits) 6,364 4,305 2,184 0 0
Capital Charge at the end of year
(=10%*beginning of the year SCR) 0 636 431 218 0
MVM (sum of PV of CoC at 3%) 1,224
MVL = PV of Benefits + MVM = 42,429 + 1,224 = 43,653
(d) Explain the impact the following scenarios will have on MVM:
(i) Increased expected mortality
(ii) Increased operational risk
(iii) Greater asset-liability mismatch
(iv) Lower corporate income tax rate
Commentary on Question:
Candidates did well on parts (i) and (ii) of this analysis question, but not on parts
(iii) and (iv). Full credit answers contained the correct reasoning as well as
correct impacts.
(i) Impact: MVM will increase.
Explanation: increased mortality is non-hedgeable risk.
(ii) Impact: MVM will increase.
Explanation: Operational risk is non-hedgeable risk.
(iii) Impact: MVM will not change.
Explanation: Asset liability mismatching is hedgeable risk.
(iv) Impact: MVM will not change.
Explanation: MVM is calculated on a pre-tax basis.

CFE FD Spring 2015 Solutions Page 45
13. Continued
(e) Recommend whether Wright should vary MCoC by risk in its economic capital
calculation. Support your recommendation.
Commentary on Question:
Few candidates were able to get full credit for this analysis question. Most
candidates were awarded partial credit. In order to get full credit, the candidate
had to provide two reasons to support their recommendation. Since either
recommendation, to vary MCoC or not, is supported in the source, simply stating
a recommendation without support did not earn any credit. Well-reasoned
support was necessary for credit.
Recommend to not vary MCoC by risk:
I recommend Wright not vary the MCoC by risk. They should not do this because
the CRO forum suggests that in most cases, the MCoC should not vary by risk
type or business. Any difference in risk should be reflected in the SCR. Also,
they suggest the cost of capital for non-hedgeable risks be reviewed periodically.