ch 5 practical point pattern analysis spatial stats & data analysis by magdaléna dohnalová
TRANSCRIPT
Ch 5Ch 5Practical Point Pattern AnalysisPractical Point Pattern Analysis
Spatial Stats & Data Analysis
by by Magdaléna DohnalováMagdaléna Dohnalová
Problems of pure Spatial Statistical Analysis
Null Hypothesis: Is that IRP/CSR?
– Insufficient description
First-order influence
Process-Pattern Matching
– Either it does or it doesn’t
– Global technique
In fact, what we need to know is..
Where the pattern deviates from expectations
>>> >>> CLUSTER DETECTIONCLUSTER DETECTION
Where are the Clusters?
Case Study:Sellafield Leukemia Study, UK
Children leukemia deaths clustered around nuclear plant
Proved that THERE WAS a cluster, but missing evidence of linking cause– Apparent clusters occur naturally in many diseases
– The actual number in cluster was very low
– Similar clusters have been found around nonnuclear plants
Cluster analysis of Point Patterns
Problem with small clusters
Distance Rings
– Rates of occurrence
– Distance form the plant
Geographical Analysis Machine (GAM)
– Automated cluster detector for point patterns
GAM…how the heck?@!$#!@
Two dimensional gridSeries of different circles
– various size and density
Number of events within each circle Exceeds threshold? (Monte Carlo simulation of expected pattern)
– If YES, draw circle on the map
END RESULT: map of significant circles
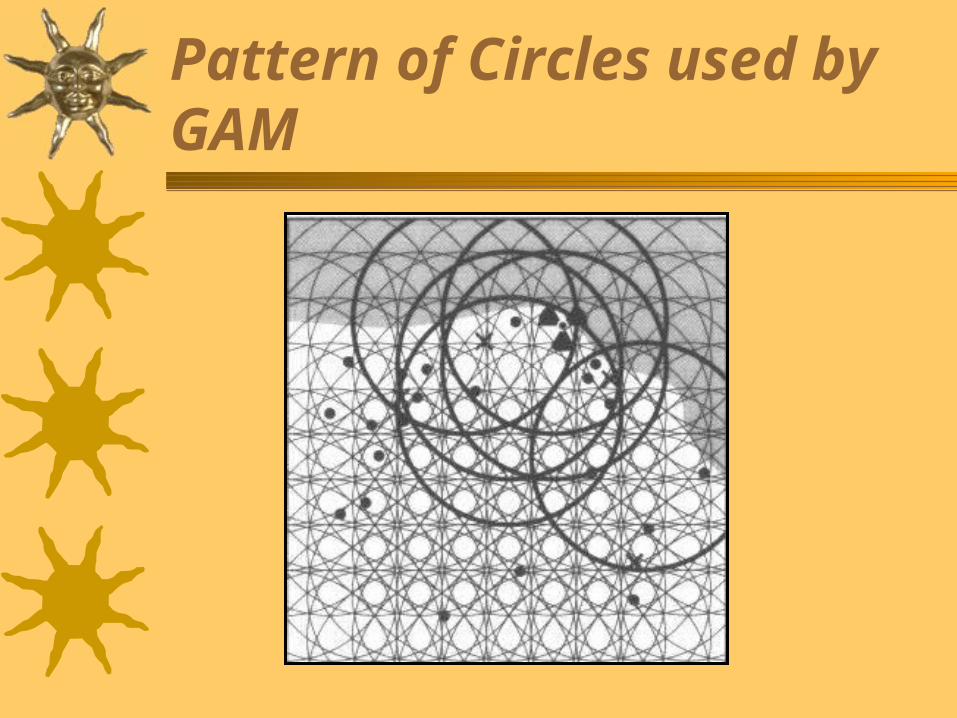
Pattern of Circles used by GAM
About Cluster Detectors
More recent genetic algorithms (intelligent)– Map Explorer (MAPEX) & Space Time Attribute
Creature (STAC)Data Availability
– When aggregate data -> MAUPVariation in Background Rate
– Assume uniform geography– Overlapping of significant circles
• not independent• Setting variable threshold!!!
Time problem– Snapshot effect– Aggregation over time, similar to MAUP
Extension of Basic Point PatternMultiple Sets of Events
– Contingency table analysis• Chi-Square Test • Discards location information
– Cross Functions (G and K functions)• Cumulative Nearest-Neighbor function • Distance from event in each pattern (G)• Events counts within in distance to the other (K)• Random if events are independent of each other
Extension of Basic Point PatternWhen was it Clustered?
– Clustering in space and time together!
– Knox test• Distance in space (near-far) and time (close-distant)
• Contingency table + Chi-square
• Threshold decision – similar to MAUP
– Mantel Test• Distance and space distance for all objects
– Modified K function• Combining two K functions in Contingency table
• Test difference between the two
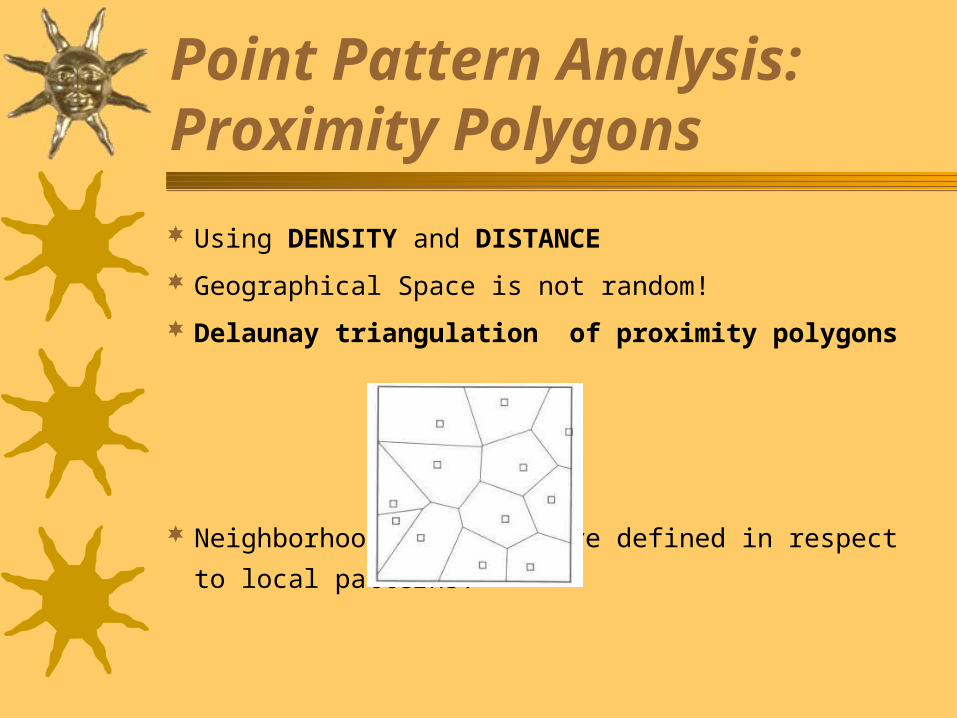
Point Pattern Analysis: Proximity Polygons
Using DENSITY and DISTANCE
Geographical Space is not random!
Delaunay triangulation of proximity polygons
Neighborhood relations are defined in respect to local
patterns!
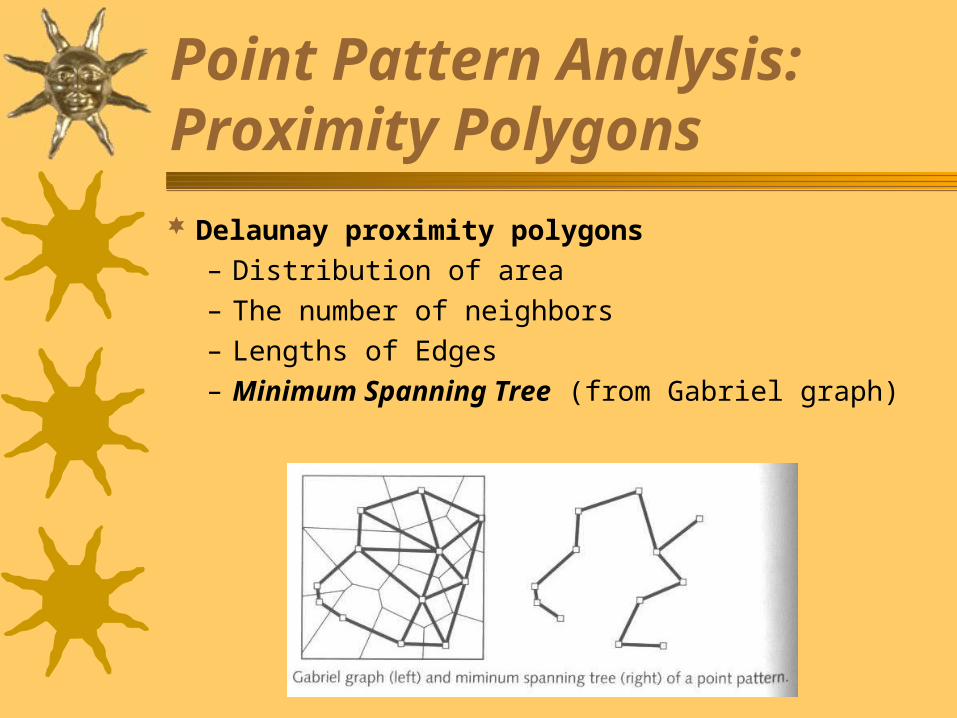
Point Pattern Analysis: Proximity Polygons
Delaunay proximity polygons
– Distribution of area
– The number of neighbors
– Lengths of Edges
– Minimum Spanning Tree (from Gabriel graph)
Point Pattern Analysis: Distance Based Methods
Distance Matrices
– Large amount of data (not the most efficient but
convenient for computer calculations)
– Underlines shortest distance (nearest neighbor & G
function)
Convert to Adjacency Matrices (K function)
Derived Matrices (F function)
Questions
What are the two major questions we ask about
clusters?
What is the final product of GAM?
What are the main challenges in cluster
detection?
What are the strengths of using Proximity
Polygons for cluster detection? Describe the
minimum spanning tree.