ch o ch o - food and agriculture organization...products based on the active s-enantiomer only....
TRANSCRIPT
methoprene 733
METHOPRENE (147)
First draft prepared by Dr Yibing He, Institute for the Control of Agrochemicals, Beijing, China
EXPLANATION
Methoprene, an insect growth regulator originally evaluated by the JMPR in 1984 and re-evaluated for residues several times up to 1989, is included in the CCPR Periodic Review Programme. At the 30th session of the CCPR (ALINORM 99/24, Appendix VII), methoprene was scheduled for periodic residue review by the 2003 JMPR but this was postponed until 2005.
The manufacturer supplied information on identity; metabolism and environmental fate; residue analysis; use pattern; residues resulting from supervised trials on wheat, maize, rice, sorghum, barley, and oats; and the fate of residues on wheat, maize and rice during storage and in processing. GAP information and enforcement methods were supplied by the manufacture and the government of Australia. In addition, methoprene is also recommended by WHO for treatment of drinking water.
IDENTITY
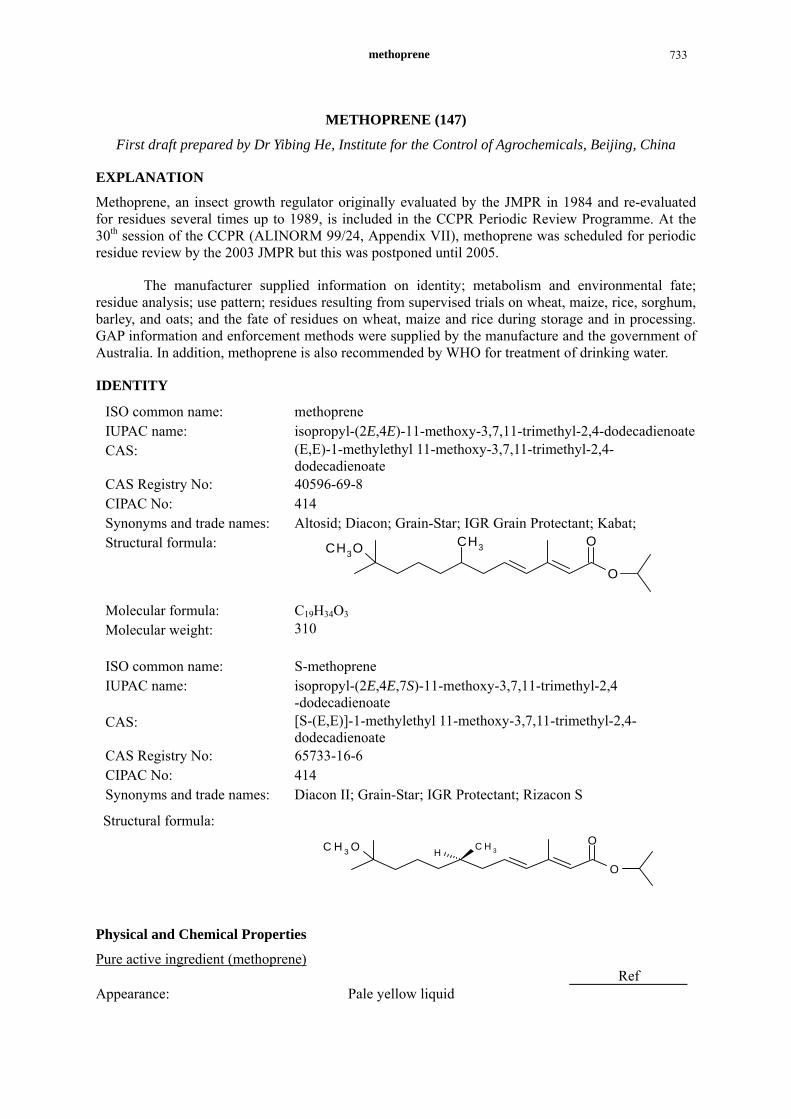
ISO common name: methoprene IUPAC name: isopropyl-(2E,4E)-11-methoxy-3,7,11-trimethyl-2,4-dodecadienoate CAS: (E,E)-1-methylethyl 11-methoxy-3,7,11-trimethyl-2,4-
dodecadienoate CAS Registry No: 40596-69-8 CIPAC No: 414 Synonyms and trade names: Altosid; Diacon; Grain-Star; IGR Grain Protectant; Kabat; Structural formula:
O
OCH3O CH3
Molecular formula: C19H34O3
Molecular weight: 310
ISO common name: S-methoprene IUPAC name: isopropyl-(2E,4E,7S)-11-methoxy-3,7,11-trimethyl-2,4
-dodecadienoate CAS: [S-(E,E)]-1-methylethyl 11-methoxy-3,7,11-trimethyl-2,4-
dodecadienoate CAS Registry No: 65733-16-6 CIPAC No: 414 Synonyms and trade names: Diacon II; Grain-Star; IGR Protectant; Rizacon S
Structural formula:
O
OC H 3 O C H 3H
Physical and Chemical Properties
Pure active ingredient (methoprene) Ref Appearance: Pale yellow liquid
Methoprene 734
Ref Vapour pressure: 3.16 × 10⁻³ Pa (2.37 × 10⁻⁵ mmHg)
at 25°C 2.13 × 10⁻² Pa (1.60 × 10⁻⁴ mmHg) at 40°C
Boiling point 100°C at 6.67 Pa (0.05 mmHg) Melting point Liquid state at room temperature Octanol-water partition coefficient: 10,000 Solubility in water 1.39 mg/L (temperature unknown) Solubility in organic solvents at 25°C: Miscible with all common organic
solvents
Relative density 0.9261 g/cm3 at 20°C Dissociation constant in water Hydrolysis (sterile solution) Extremely stable in sterile aqueous
solutions buffered at pH 5, 7, 9 at 20°C.
Schooley et al., 1975a
Photolysis in water Apparently less than 1 day (sunlight).
Quistad et al., 1975a
Technical material methoprene (% ai) Minimum purity: 92% Main impurity: Related isomers 2 ~ 5% Related impurities Solvent 1 ~ 2% Unidentified 2~1%
Pure active ingredient (S-methoprene). Ref Appearance: Clear yellow to light amber. Vapour pressure: 3.15 × 10⁻³ Pa at 25°C. Boiling point > 100°C at 6.67 Pa (0.05 mmHg). Melting point Liquid state at room temperature. Octanol-water partition coefficient: Due to the minimum solubility in
n-octanol, an estimation of the partition coefficient was calculated as greater than 1×10⁶ at pH 7 and 20°C.
Solubility in water 0.52 ± 0.06 mg/L. Solubility in organic solvents at 25°C: Miscible with all common organic
solvents.
Relative density 0.917~0.927 g/cm3 at 20°C. Dissociation constant in water No evidence of dissociation Hydrolysis (sterile solution) Stable for > 21 days in sterile aqueous
solutions buffered at pH 5, 7, 9 at 20°C.
Schooley et al., 1975a
Photolysis Thin film/sunlight, half life about 4 hours.
Technical material of S-methoprene (% ai) Minimum purity: 92% Main impurity: Cis-methoprene = max 5% Related impurities Max 3%
methoprene 735
Formulations
Methoprene is available in the following formulations:
EC methoprene only or combination with fenitrothion or chlorpyrifos-methyl or malathion or etrimphos
SC methoprene only or combination with fenitrothion or chlorpyrifos-methyl or malathion or etrimphos
S-methoprene is available in the following formulations:
EC S-methoprene only or combination with chlorpyrifos-methyl SC S-methoprene only or combination with chlorpyrifos-methyl
S-methoprene is the biologically active enantiomer in the racemic compound methoprene. Methoprene was first evaluated by JMPR in 1984 and Codex MRLs for it were established. In recent years it has become possible to manufacture S-methoprene on an industrial scale and to register products based on the active S-enantiomer only. Since, S-methoprene constitutes 50% of methoprene, investigations into the metabolism and fate of methoprene can legitimately be accepted as supporting metabolism and fate requirements of S-methoprene.
METABOLISM AND ENVIRONMENTAL FATE
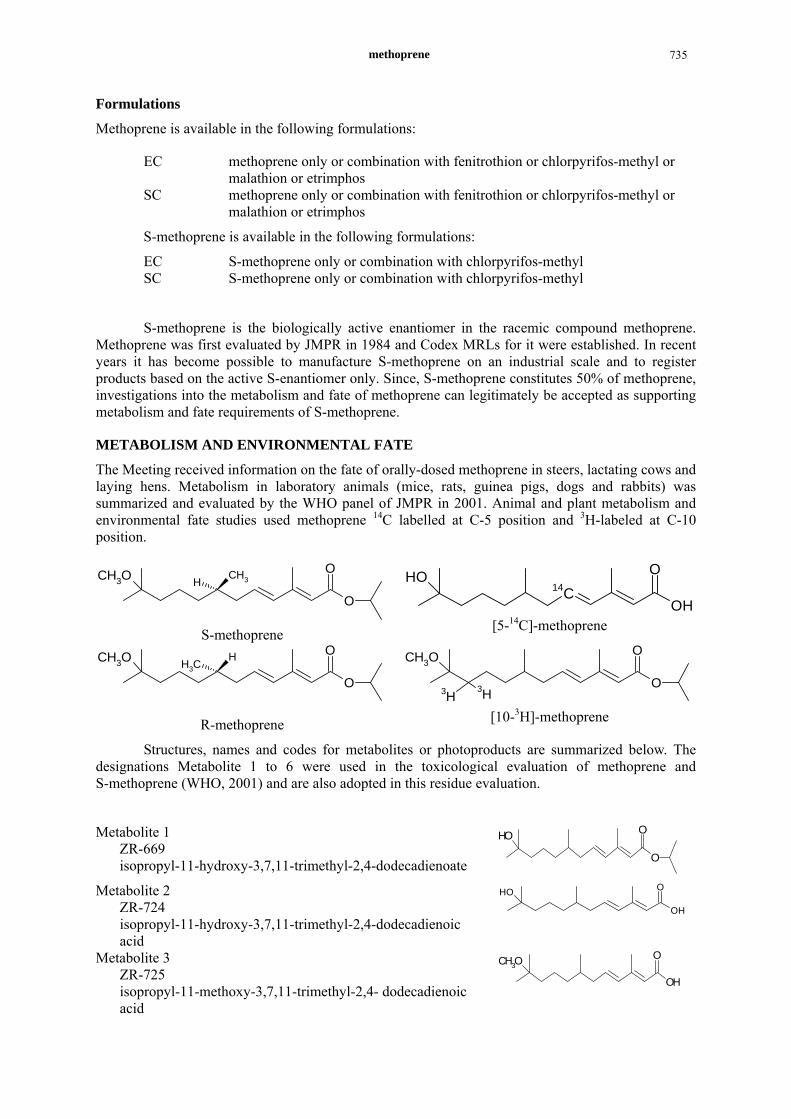
The Meeting received information on the fate of orally-dosed methoprene in steers, lactating cows and laying hens. Metabolism in laboratory animals (mice, rats, guinea pigs, dogs and rabbits) was summarized and evaluated by the WHO panel of JMPR in 2001. Animal and plant metabolism and environmental fate studies used methoprene 14C labelled at C-5 position and 3H-labeled at C-10 position.
O
OCH3O CH3H
S-methoprene
C14
OH
OOH
[5-14C]-methoprene
O
OCH3O HCH3
R-methoprene
O
OCH3O
H3 H3
[10-3H]-methoprene
Structures, names and codes for metabolites or photoproducts are summarized below. The designations Metabolite 1 to 6 were used in the toxicological evaluation of methoprene and S-methoprene (WHO, 2001) and are also adopted in this residue evaluation.
Metabolite 1
ZR-669 isopropyl-11-hydroxy-3,7,11-trimethyl-2,4-dodecadienoate O
OOH
Metabolite 2
ZR-724 isopropyl-11-hydroxy-3,7,11-trimethyl-2,4-dodecadienoic acid
OH
OOH
Metabolite 3 ZR-725 isopropyl-11-methoxy-3,7,11-trimethyl-2,4- dodecadienoic acid
OH
OCH3O

Methoprene 736
Metabolite 4 ZR-1564 7-methoxy-3,7-dimethyl-octanal (methoxycitronellal)
CH3O
H
O
Metabolite 5
ZR-1945 7-methoxy-3,7-dimethyloctanoic acid (7-methoxycitronellic acid)
CH3O
OH
O
Metabolite 6 ZR-1602 7-hydroxy-3,7-dimethyloctanoic acid (7-hydroxycitronellic acid)
OH
O H
O
Photoproduct 7 (2E)-4,5-epoxy-11-methoxy-3,7,11-trimethyl-2-dodecenoate O
OCH3O
O Photoproduct 8
8-methoxy-4,8-dimethyl-2-nonanone CH3O O
Photoproduct 9
methoxycitronellal dimethyl acetal C H 3 O O H 3 C
O H 3 C Metabolite 10
11-methoxy-3,7,11-trimethyldodecanoic acid (MTDA) CH3O
OH
O
Metabolite 11
11-hydro-3,7,11-trimethyldodecanoic acid (HTDA) OH
OH
O
Animal metabolism
Studies in steers, cows and chickens showed that methoprene was extensively metabolized to polar conjugates (glucuronides) and that the [5-14C]-molecule underwent rapid α and β oxidation to produce CO2 and acetate, which was incorporated into natural products such as triglycerides and cholesterol found in tissues, milk and eggs.
Numerous metabolites were identified resulting from hydrolysis, oxidation and demethylation of methoprene and subsequent conjugate formation.
Steers
A Hereford steer weighing 277 kg, housed in a metabolism room, was given a single oral dose of 2 g of [5-14C]-methoprene (purity, 96.9%), equal to 7.2 mg/kg bw. Urine and faeces were collected using standard methods for 2 weeks (Chamberlain et al., 1975). Room air samples were collected every 3 h for the first 2 days, every 6 h for the next 2 days and once a day for the next 10 days. Blood samples were taken regularly. After 14 days, the steer was slaughtered, and samples of tissues were collected for analysis of radioactive residues. Some selected tissues (fat, muscle, liver, lung, blood, and bile) were frozen for shipment by air freight and analysis (Quistad et al., 1975b).
The Hereford steer eliminated 22% of the administered radioactive dose via the urine and 39% via the faeces over a 2-week period (Table 1). In untreated urine sample (6–72 hours), 97-99% of the radioactivity recovered was associated with unidentified “conjugates and other polar compounds”. After treatment of urine with glucuronidase, Metabolites 2, 3 and 4 were identifiable (Table 3). These together amounted to a maximum of 15% of the radioactivity recovered in the urine. “Conjugates and polar compounds” accounted for the remaining radioactivity present in the urine. No unchanged methoprene could be detected in the urine untreated or treated with glucuronidase.
In the faeces, the major extractable radioactive compound was unchanged methoprene (about 40% of the 14C recovered in the faeces). Other compounds found included Metabolites 1, 2, 3 and 4 and “conjugates and other polar compounds” (Table 3). Although part of the radiolabel was reported to have been expired as 14CO2, the amount was not quantified.
methoprene 737
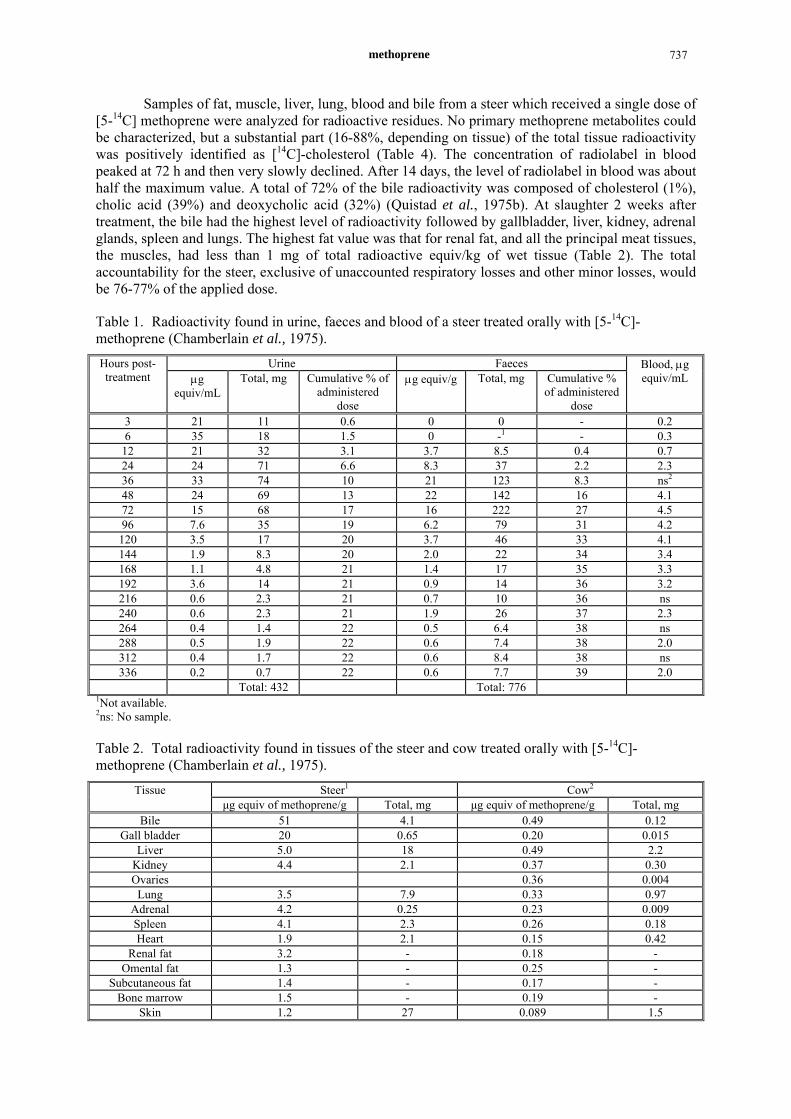
Samples of fat, muscle, liver, lung, blood and bile from a steer which received a single dose of [5-14C] methoprene were analyzed for radioactive residues. No primary methoprene metabolites could be characterized, but a substantial part (16-88%, depending on tissue) of the total tissue radioactivity was positively identified as [14C]-cholesterol (Table 4). The concentration of radiolabel in blood peaked at 72 h and then very slowly declined. After 14 days, the level of radiolabel in blood was about half the maximum value. A total of 72% of the bile radioactivity was composed of cholesterol (1%), cholic acid (39%) and deoxycholic acid (32%) (Quistad et al., 1975b). At slaughter 2 weeks after treatment, the bile had the highest level of radioactivity followed by gallbladder, liver, kidney, adrenal glands, spleen and lungs. The highest fat value was that for renal fat, and all the principal meat tissues, the muscles, had less than 1 mg of total radioactive equiv/kg of wet tissue (Table 2). The total accountability for the steer, exclusive of unaccounted respiratory losses and other minor losses, would be 76-77% of the applied dose.
Table 1. Radioactivity found in urine, faeces and blood of a steer treated orally with [5-14C]- methoprene (Chamberlain et al., 1975).
Urine Faeces Hours post- treatment μg
equiv/mL Total, mg Cumulative % of
administered dose
μg equiv/g Total, mg Cumulative % of administered
dose
Blood, μg equiv/mL
3 21 11 0.6 0 0 - 0.2 6 35 18 1.5 0 -1 - 0.3
12 21 32 3.1 3.7 8.5 0.4 0.7 24 24 71 6.6 8.3 37 2.2 2.3 36 33 74 10 21 123 8.3 ns2
48 24 69 13 22 142 16 4.1 72 15 68 17 16 222 27 4.5 96 7.6 35 19 6.2 79 31 4.2 120 3.5 17 20 3.7 46 33 4.1 144 1.9 8.3 20 2.0 22 34 3.4 168 1.1 4.8 21 1.4 17 35 3.3 192 3.6 14 21 0.9 14 36 3.2 216 0.6 2.3 21 0.7 10 36 ns 240 0.6 2.3 21 1.9 26 37 2.3 264 0.4 1.4 22 0.5 6.4 38 ns 288 0.5 1.9 22 0.6 7.4 38 2.0 312 0.4 1.7 22 0.6 8.4 38 ns 336 0.2 0.7 22 0.6 7.7 39 2.0
Total: 432 Total: 776 1Not available. 2ns: No sample.
Table 2. Total radioactivity found in tissues of the steer and cow treated orally with [5-14C]- methoprene (Chamberlain et al., 1975).
Steer1 Cow2Tissue μg equiv of methoprene/g Total, mg μg equiv of methoprene/g Total, mg
Bile 51 4.1 0.49 0.12 Gall bladder 20 0.65 0.20 0.015
Liver 5.0 18 0.49 2.2 Kidney 4.4 2.1 0.37 0.30 Ovaries 0.36 0.004 Lung 3.5 7.9 0.33 0.97
Adrenal 4.2 0.25 0.23 0.009 Spleen 4.1 2.3 0.26 0.18 Heart 1.9 2.1 0.15 0.42
Renal fat 3.2 - 0.18 - Omental fat 1.3 - 0.25 -
Subcutaneous fat 1.4 - 0.17 - Bone marrow 1.5 - 0.19 -
Skin 1.2 27 0.089 1.5

Methoprene 738
Steer1 Cow2Tissue μg equiv of methoprene/g Total, mg μg equiv of methoprene/g Total, mg
Brain 1.4 0.43 0.15 0.065 Pancreas -3 - 0.23 0.041 Thyroid - - 0.24 0.005 Foetus 0.16 2.1 Udder 0.16 1.2 Bone 0.40 - 0.066 -
Longissimus dorsi 0.88 - 0.062 - Semitendinosus 0.67 - 0.063 -
Triceps 0.53 - 0.077 - Tongue - - 0.14 0.058 Stomach - - 0.22 -
1Steer dosed with 2.0 g of [5-14C]- methoprene. 2Cow dosed with 0.21 g of [5-14C]- methoprene. 3Not available.
Table 3. Average amounts of radioactive metabolites1 in the urine and faeces extracts of a steer after oral administration of [5-14C]- methoprene at 7.2 mg/kg bw between 6-72 hours (Chamberlain et al., 1975).
Percentage of recovered radioactivity Faeces extracts
Metabolites Normal urine 6-hr H-1 glucuronidase
treated urine 24-hr methanol 36-72-hr methanol Conjugates and polar
compounds 97 85 25 15
Metabolites 2 and 4 1.5 6.2 24 4.8 Metabolite 3 1.3 8.9 7.1 12 Metabolite 1 1.0 0 18 26 Methoprene 0 0 27 42
1TLC system, benzene-pentane-methanol (2:1:1).
Table 4. Percentage of TRR (total radioactive residue) present as cholesterol in liver, fat, muscle and lung extracts of a steer after oral administration of [5-14C]- methoprene at 7.2 mg/kg bw at sacrifice 2 weeks after treatment (Quistad et al., 1975b).
Percentage of recovered radioactivity present as cholesterol Liver Fat Muscle Lung
Cholesterol 16 88 28 45
Cow
A Jersey cow weighing 338 kg was given a single oral dose of 208 mg of [5-14C]-methoprene, equal to 0.61 mg/kg bw, and urine, faeces and milk were collected for 7 days (Chamberlain et al., 1975). Expired air was sampled continuously for the first 4 h, for 1 h every fourth hour for the next 3 days, and for every 12th hour on days 4 through 7. All the urine and faeces were collected separately and the cow was hand milked at approximately 12 h intervals. Collected milk and urine were treated with 1 mL of 38% formaldehyde/500mL. Blood samples were taken 6 and 48 h and 7 days after treatment. After 7 days, the cow was slaughtered, and samples of tissues were collected for analysis of radioactive residues.
After 7 days, 73% of the radiolabel had been eliminated, with 20% in urine, 30% in faeces, 15% in expired air and 8% in the milk indicating that 27% may have remained in the body. The concentrations of radiolabel in expired air, urine, faeces and milk peaked about 24 to 48 hours after treatment (Tables 5 and 6). Maximum radioactivity occurred at 44 hour in the milk and thorough extraction of this sample revealed a trace of methoprene (0.015 mg/kg) but primary metabolites were not detectable (< 0.01 mg/kg for Metabolites 1-6). 1% of the radioactivity in the 44 hour milk sample was identified as methoprene and that meant only about 0.08% of the applied dose was excreted as
methoprene 739
methoprene in milk. After 7 days, the concentration present in the milk was only about 10% of the maximum value. By day 7 after treatment, the highest concentrations of radiolabel were found in bile, gall-bladder, liver, kidney, ovary, lung, spleen and omental fat. All muscles of the cow had less than 0.1mg radioactive equiv/kg of wet tissue (Table 2).
[5-14C]-methoprene was extensively metabolized by the lactating dairy cow to acetate. Radioactive acetate was incorporated into milk fat which was then degraded to radiolabeled saturated monoenoic and dienoic fatty acids. Radioactive lactose, lactalbumin and casein were also isolated from milk and represented 3.8, 2.5 and 11% of the total radiolabel in milk, respectively (Table 7). In a blood sample taken 7 days after dosing, the radioactivity was mainly associated with blood proteins (88.4% of the radioactivity recovered in blood, Table 8) but was also detected in cholesterol (5.3% TRR) and cholesterol esters (1.4% TRR) (Quistad et al., 1975c).
The total amounts of radioactivity in organs of the cow was 20% of the applied dose (Table 2) and the total accountability for the cow was about 93% of the applied dose.
The metabolism by the steer and the cow appeared to be similar because the data for relative levels of radioactive material in the tissues were comparable as shown in Table 2.
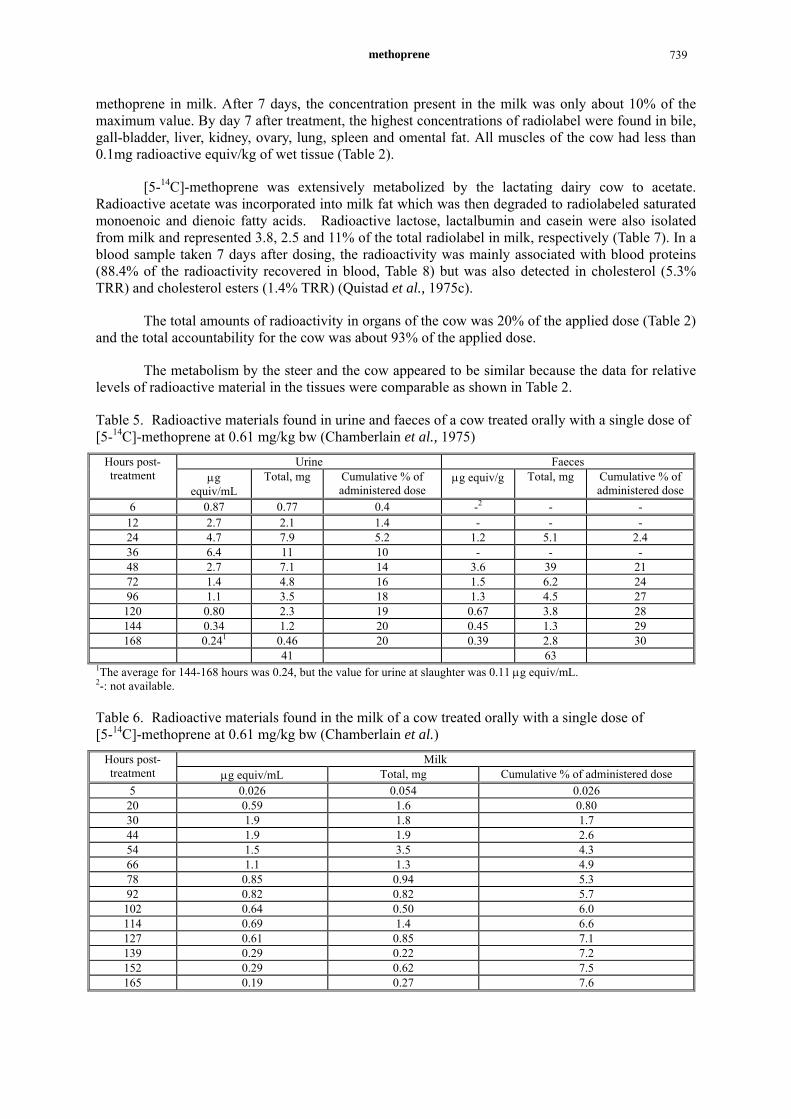
Table 5. Radioactive materials found in urine and faeces of a cow treated orally with a single dose of [5-14C]-methoprene at 0.61 mg/kg bw (Chamberlain et al., 1975)
Urine Faeces Hours post- treatment μg
equiv/mL Total, mg Cumulative % of
administered dose μg equiv/g Total, mg Cumulative % of
administered dose 6 0.87 0.77 0.4 -2 - -
12 2.7 2.1 1.4 - - - 24 4.7 7.9 5.2 1.2 5.1 2.4 36 6.4 11 10 - - - 48 2.7 7.1 14 3.6 39 21 72 1.4 4.8 16 1.5 6.2 24 96 1.1 3.5 18 1.3 4.5 27 120 0.80 2.3 19 0.67 3.8 28 144 0.34 1.2 20 0.45 1.3 29 168 0.241 0.46 20 0.39 2.8 30
41 63 1The average for 144-168 hours was 0.24, but the value for urine at slaughter was 0.11 μg equiv/mL. 2-: not available.
Table 6. Radioactive materials found in the milk of a cow treated orally with a single dose of [5-14C]-methoprene at 0.61 mg/kg bw (Chamberlain et al.)
Milk Hours post- treatment μg equiv/mL Total, mg Cumulative % of administered dose
5 0.026 0.054 0.026 20 0.59 1.6 0.80 30 1.9 1.8 1.7 44 1.9 1.9 2.6 54 1.5 3.5 4.3 66 1.1 1.3 4.9 78 0.85 0.94 5.3 92 0.82 0.82 5.7 102 0.64 0.50 6.0 114 0.69 1.4 6.6 127 0.61 0.85 7.1 139 0.29 0.22 7.2 152 0.29 0.62 7.5 165 0.19 0.27 7.6

Methoprene 740
Table 7. Distribution of total radioactivity in the components of milk (expressed as % of total in the milk) from a lactating dairy cow orally dosed with a single dose of [5-14C]- methoprene at 0.61 mg/kg bw at 44-hour post-treatment (Quistad et al., 1975c).
Lactalbumin Lactose Polar products Casein Aqueous phase
Fatty acids Primary metabolite
Methoprene
3.8 11 47 2.5 8.5 22 < 1.0 1.0
Table 8. Radiolabel distribution in whole blood of a cow orally dosed with a single dose of [5-14C]-methoprene at 0.61 mg/kg bw at 1 week post-treatment (Quistad et al., 1975c).
Fraction Whole blood
Organic extract
Aqueous soluble
Associated with blood proteins (precipitated)
Total radioactivity of whole blood 100% 7.8% 3.8% 88.4%
Hen
Colostomized or intact adult White Leghorn hens weighing 1.22 to 2.20 kg were orally administered with a single dose of [5-14C]-methoprene (purity, 95.9%) at 0.6~77 mg/kg bw. Excreta (separated into urine and faeces), expired air and eggs were collected from three hens for 14 days, and urine, faeces and expired air were collected from eight hens for 48 h, after which time tissue samples were taken for measurement of radiolabel (Davison, 1976; Quistad, et al., 1976).
The radiochemical content of eggs, excreta and tissues was determined by (combustion) LSC. Samples of urine and the KOH solution were assayed in Insta-Gel, and samples of the ethanolamine solution were assayed in a toluene cocktail (Davison, 1976). The average percentage elimination of 14C in the 0-48 hr period via respiration was 37 ± 3.0% (mean and standard deviation) when chickens were given low doses of methoprene (0.6~3.4 mg/kg bw) and 24 ± 3.5% when chickens were given high doses (31–64 mg/kg bw). The percentages of elimination of 14C within 48 hours via urine and faeces when chickens were given higher doses (59–64 mg/kg bw) were 34–39% and 17–19% respectively and were 12–25% and 9.9–11% when chickens given low doses (1.9–3.4 mg/kg bw). Relatively large amounts of radioactivity were eliminated in eggs. Over 14 days after administration, up to 19% of the 14C dose was eliminated in eggs, mainly in the yolk (Table 9). Most of the radioactivity in eggs was in the yolk (Table 10). The amount of 14C in the yolk peaked at 1 – 3% of the dose in the 2nd to 7th days and was less than 0.1% of the dose by the 13th day. After 48 h, most of the remaining radiolabel was found in liver, kidney, intestines and lungs (Table 11).
Table 9. Dosages and 0~48 h recoveries of carbon-14 given to colostomized chickens and laying hens as [5-14C]- methoprene (Davison, 1976).
[14C]methoprene dose, mg/kg bw 0.6 1.91 3.41 31 591 60 641 77
Materials examined
14C as % of dose Respired air 23, 39, 35, 38 44 42 17 25 21 33 NC2
Faeces 11 9.9 19 17 Urine 12 25 34 39 Excreta 51, 29, 27, 31 57 44 59 Eggs 2.43, 2.23, 11(12)4, 19(12)4 2.23 13(6)4 3.03
1Colostomized chickens 2NC=not collected 3Total for two eggs. 4Total for the number of eggs indicated in parentheses.

methoprene 741
Table 10. Distribution of 14C in eggs of hens given a single dose of [5-14C]-methoprene (Davison, 1976).
[14C]methoprene dose, mg/bird (mg/kg bw) 1 (0.6) 1 (0.6) 73 (60)
14C as % of dose
Day
Shell and white Yolk Shell and white Yolk Shell White and yolk
1 1.1 0.015 0.78 0.002 0.19 0.71 2 1.4 0.30 0.84 2.6 0.06 1.7 3 0.90 0.84 0.24 3.1 0.03 2.2 4 0.16 1.1 - - 0.02 2.4 5 -1 - 0.11 3.1 0.008 2.5 6 0.11 1.3 0.06 3.1 0.009 2.4 7 0.07 1.3 0.05 2.6 - - 8 0.05 0.98 0.03 1.5 - - 9 0.04 0.58 0.02 0.43 - - 10 0.03 0.32 0.02 0.14 - - 11 0.02 0.18 0.01 0.11 - - 12 0.02 0.15 - - 13 0.01 0.10 0.01 0.08 - - 14 - - 0.01 0.06 - - 1Not available.
Table 11. Concentration of radioactivity in tissues of laying hens from a single dose of [5-14C]- methoprene (Davison, 1976).
[14C]methoprene dose, mg/bird (mg/kg bw) 1 (0.6) 4.2 (1.9) 4.1 (3.4) 105 (59) 107 (64)
Tissues
Equivalents in tissue, μg/g of dry matter Adipose tissue 0.25 0.08 0.48 5.4 7.6 Adrenals NC1 0.80 NC NC 34.1 Breast 0.09 0.66 NC 7.6 12.0 Feathers 0.01 0.60 0.20 16.6 39.4 Femur, diaphysis 0.26 0.50 NC 11.3 10.8 Gizzard 0.30 0.95 3.19 18.6 20.5 Heart 0.45 1.36 2.44 19.7 34.5 Intestines2 0.47 2.11 5.21 36.1 71.6 Kidneys 1.68 3.35 NC 80.8 104.1 Liver 1.64 5.73 10.26 106.1 152.4 Lungs 0.46 1.05 3.90 30.5 39.2 Skin 0.13 0.48 NC 22.7 17.7 Carcass remains3 0.46 0.58 1.09 13.0 16.1 1NC=not collected. 2Include digesta. 3Carcass less viscera and feathers, whole organs listed, and samples of adipose tissue, breast, femur, and skin.
Methoprene and its metabolites were determined in the samples of faeces, muscle, fat, liver, urine, blood and nonlyophilized eggs (whites and yolks) (Quistad, et al., 1976). The major residue (39% total faecal 14C) in faeces was unmetabolized methoprene. The major metabolite was Metabolite 3, which accounted for 9% total faecal 14C. Metabolite 1 and 2 were found as minor metabolites. In urine, primary metabolites and methoprene were not found, but conjugated Metabolite 2 and 3 contributed 4 and 5% of the total urinary radiolabel respectively. 85% of the radiolabel in urine was assessed as polar, nonextractable unknowns. In blood, the major radioactive components were cholesterol and cholesteryl esters (1.2 and 0.1% of total blood radiolabel). Methoprene and Metabolites 1-6 were not detected (< 0.01 mg/kg).
Radiolabeled residues in egg white maximized at 2% applied 14C (total for eggs laid 0-48 h). Exhaustive extraction of egg white gave small amounts (< 0.1 mg/kg) of methoprene and primary metabolites only when the chicken was dosed at an exaggerated rate of 77 mg/kg bw. At doses of 0.6
Methoprene 742
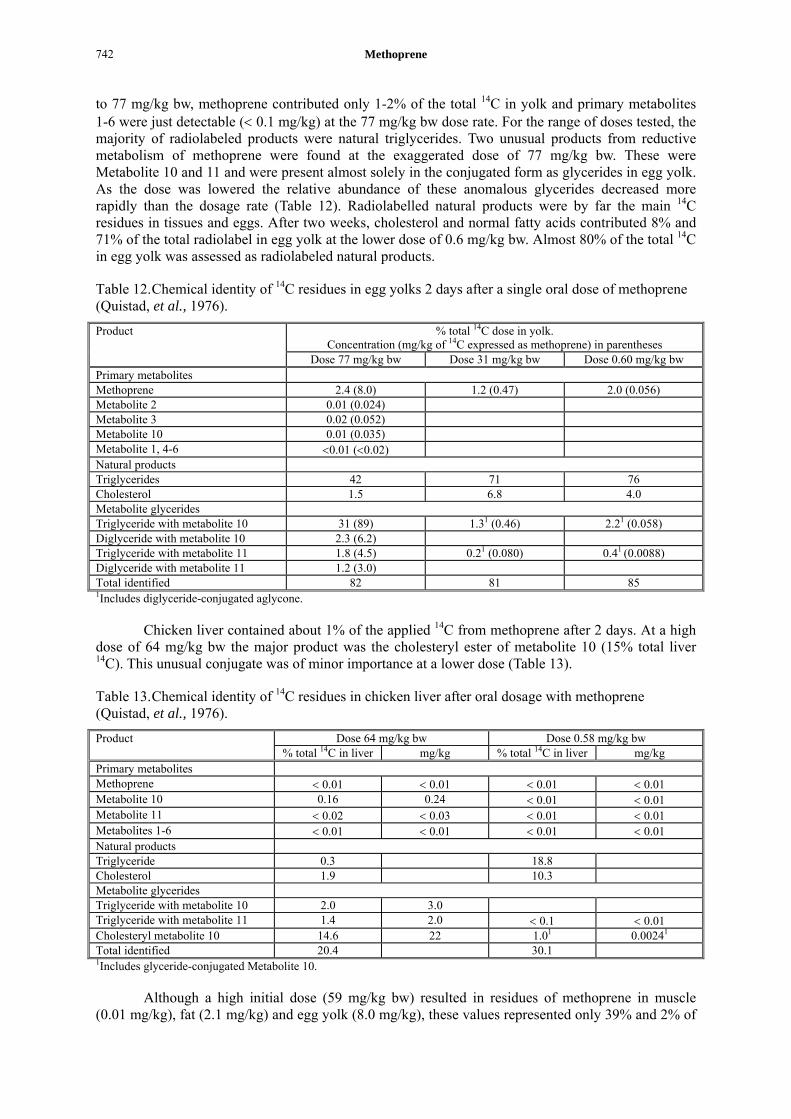
to 77 mg/kg bw, methoprene contributed only 1-2% of the total 14C in yolk and primary metabolites 1-6 were just detectable (< 0.1 mg/kg) at the 77 mg/kg bw dose rate. For the range of doses tested, the majority of radiolabeled products were natural triglycerides. Two unusual products from reductive metabolism of methoprene were found at the exaggerated dose of 77 mg/kg bw. These were Metabolite 10 and 11 and were present almost solely in the conjugated form as glycerides in egg yolk. As the dose was lowered the relative abundance of these anomalous glycerides decreased more rapidly than the dosage rate (Table 12). Radiolabelled natural products were by far the main 14C residues in tissues and eggs. After two weeks, cholesterol and normal fatty acids contributed 8% and 71% of the total radiolabel in egg yolk at the lower dose of 0.6 mg/kg bw. Almost 80% of the total 14C in egg yolk was assessed as radiolabeled natural products.
Table 12. Chemical identity of 14C residues in egg yolks 2 days after a single oral dose of methoprene (Quistad, et al., 1976).
% total 14C dose in yolk. Concentration (mg/kg of 14C expressed as methoprene) in parentheses
Product
Dose 77 mg/kg bw Dose 31 mg/kg bw Dose 0.60 mg/kg bw Primary metabolites Methoprene 2.4 (8.0) 1.2 (0.47) 2.0 (0.056) Metabolite 2 0.01 (0.024) Metabolite 3 0.02 (0.052) Metabolite 10 0.01 (0.035) Metabolite 1, 4-6 <0.01 (<0.02) Natural products Triglycerides 42 71 76 Cholesterol 1.5 6.8 4.0 Metabolite glycerides Triglyceride with metabolite 10 31 (89) 1.31 (0.46) 2.21 (0.058) Diglyceride with metabolite 10 2.3 (6.2) Triglyceride with metabolite 11 1.8 (4.5) 0.21 (0.080) 0.41 (0.0088) Diglyceride with metabolite 11 1.2 (3.0) Total identified 82 81 85 1Includes diglyceride-conjugated aglycone.
Chicken liver contained about 1% of the applied 14C from methoprene after 2 days. At a high dose of 64 mg/kg bw the major product was the cholesteryl ester of metabolite 10 (15% total liver 14C). This unusual conjugate was of minor importance at a lower dose (Table 13).
Table 13. Chemical identity of 14C residues in chicken liver after oral dosage with methoprene (Quistad, et al., 1976).
Dose 64 mg/kg bw Dose 0.58 mg/kg bw Product % total 14C in liver mg/kg % total 14C in liver mg/kg
Primary metabolites Methoprene < 0.01 < 0.01 < 0.01 < 0.01 Metabolite 10 0.16 0.24 < 0.01 < 0.01 Metabolite 11 < 0.02 < 0.03 < 0.01 < 0.01 Metabolites 1-6 < 0.01 < 0.01 < 0.01 < 0.01 Natural products Triglyceride 0.3 18.8 Cholesterol 1.9 10.3 Metabolite glycerides Triglyceride with metabolite 10 2.0 3.0 Triglyceride with metabolite 11 1.4 2.0 < 0.1 < 0.01 Cholesteryl metabolite 10 14.6 22 1.01 0.00241
Total identified 20.4 30.1 1Includes glyceride-conjugated Metabolite 10.
Although a high initial dose (59 mg/kg bw) resulted in residues of methoprene in muscle (0.01 mg/kg), fat (2.1 mg/kg) and egg yolk (8.0 mg/kg), these values represented only 39% and 2% of

methoprene 743
the total radiolabel in fat and egg yolk, respectively (Tables 12 and 14). Radiolabeled natural triglycerides and cholesterol also contributed major portions of the total 14C residue in fat.
Table 14. Radiolabeled constituents in fat and muscle of chicken dosed orally with methoprene at 59 mg/kg (Quistad, et al., 1976).
% total 14C mg/kg Fat
Primary metabolites Methoprene 39 2.1 Metabolite 1 2.3 0.12 Metabolite 2 0.3 0.013 Metabolites 3-6 < 0.3 < 0.01
Natural products Triglycerides 20 Cholesterol 1.9
Metabolite glycerides Triglycerides with metabolite 10 17 0.93
Total identified 81 Muscle (breast)
Methoprene 0.5 0.01 Primary metabolites (1-6) < 0.5 < 0.01
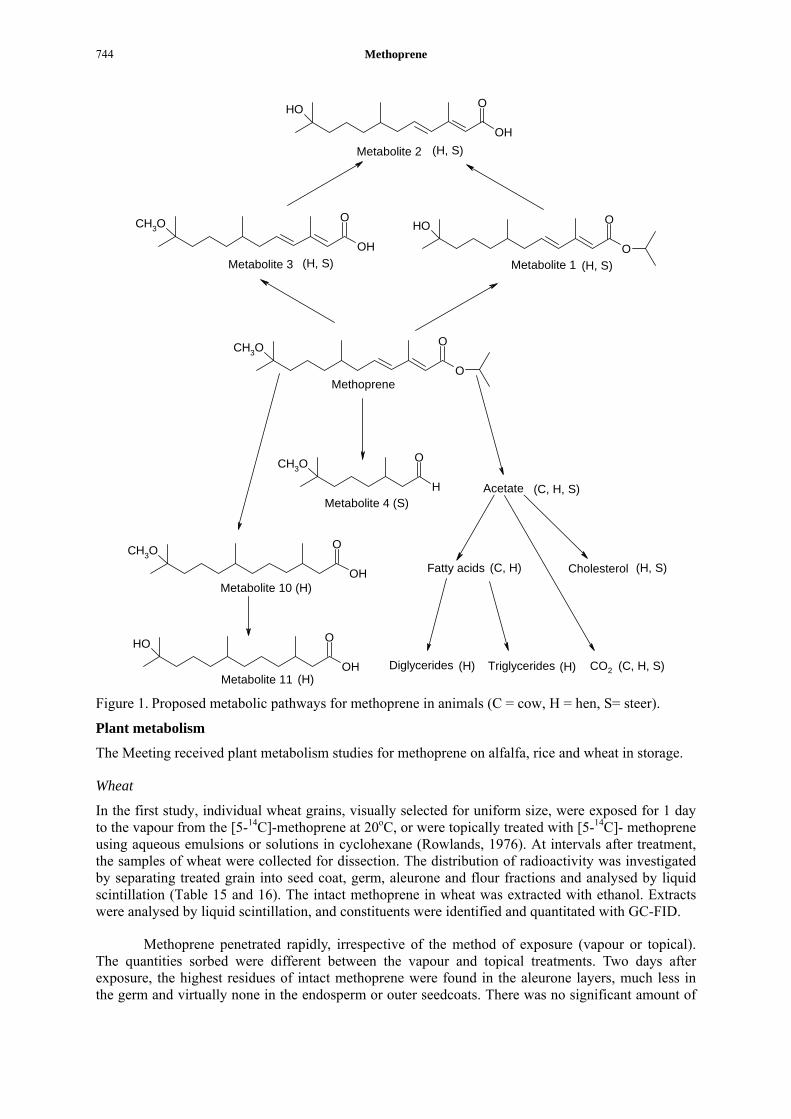
The proposed pathways of metabolism of methoprene in animals are shown in Figure 1.
Methoprene 744
O
OCH3O
O
OOH
OH
OCH3O
OH
OOH
CH3O
H
O
CH3O
OH
O
OH
OH
O
Methoprene
Acetate
Fatty acids
TriglyceridesDiglycerides
Metabolite 1Metabolite 3
Metabolite 2 (H, S)
(H, S) (H, S)
Metabolite 4 (S)
CO2
Metabolite 10
Metabolite 11
(H)
(H)
(C, H)
(C, H, S)
(H, S)
(H) (H) (C, H, S)
Cholesterol
Figure 1. Proposed metabolic pathways for methoprene in animals (C = cow, H = hen, S= steer).
Plant metabolism
The Meeting received plant metabolism studies for methoprene on alfalfa, rice and wheat in storage.
Wheat
In the first study, individual wheat grains, visually selected for uniform size, were exposed for 1 day to the vapour from the [5-14C]-methoprene at 20oC, or were topically treated with [5-14C]- methoprene using aqueous emulsions or solutions in cyclohexane (Rowlands, 1976). At intervals after treatment, the samples of wheat were collected for dissection. The distribution of radioactivity was investigated by separating treated grain into seed coat, germ, aleurone and flour fractions and analysed by liquid scintillation (Table 15 and 16). The intact methoprene in wheat was extracted with ethanol. Extracts were analysed by liquid scintillation, and constituents were identified and quantitated with GC-FID.
Methoprene penetrated rapidly, irrespective of the method of exposure (vapour or topical). The quantities sorbed were different between the vapour and topical treatments. Two days after exposure, the highest residues of intact methoprene were found in the aleurone layers, much less in the germ and virtually none in the endosperm or outer seedcoats. There was no significant amount of

methoprene 745
14C-activity associated with the high molecular weight fraction after either 1 week or 3 weeks storage at 20oC and 18% moisture content.
Table 15. Comparative uptake and redistribution by freshly-harvested wheat grains (19% moisture) after 1-day exposure to vapour of [5-14C]-methoprene (Rowlands, 1976).
Amounts ng Time in days Coat Germ Aleurone Flour Total intact
1 1.3 4.8 0.70 0.20 7.0 2 0.40 2.0 2.6 1.3 6.3 7 0.30 1.3 2.7 0.20 4.5
Table 16. Amounts of [5-14C]-methoprene in tissues of wheat grains during storage following topical application in cyclohexanone1 (Rowlands, 1976).
Days after Amounts in that tissue (ng) treatment Coat Germ Aleurone Flour Total μg in
whole grain Total mg/kg
(approx) 0 200 (184)2 20 (-) 20 (14) 8 (6) 248 (210) 10 (9) 1 49 (72) 22 (12) 148 (93) 10 (12) 227 (189) 9 (8) 2 10 (36) 45 (32) 150 (86) 10 (23) 215 (177) 8 (7) 7 22 (21) 28 (30) 108 (73) 9 ( 7) 167 (131) 7 (6) 21 12 12 73 6 103 4 35 7 11 30 4 52 2
1Each figure is mean of five replicates. 2Figure in parentheses are from topical application of aqueous emulsions.
In the second study, forty 25 g lots of wheat samples were dosed in screw-capped jars with 10 mL of a solution of methoprene in hexane, giving a final concentration of 10 mg/kg (Rowlands, 1976). The solvent was evaporated under nitrogen and the jars were sealed and stored in the dark at 20oC. The samples of wheat were collected and analysed at intervals.
Degradation is promoted by grain moisture. The residual half-life of methoprene in freshly harvested wheat of 19% moisture was 2–3 weeks. In the older wheat at 12% and 18% moisture contents, the respective half-lives are 6–7 weeks and 3–4 weeks (Table 17). The main metabolic changes observed were ether cleavage and hydrolysis of the ester grouping. Detectable metabolism was almost entirely to the free acid and could account for only 20–40% of the breakdown of methoprene. Traces of the hydroxy-compound and hydroxy-acid were found in the freshly harvested wheat. The possible pathway of methoprene metabolism in wheat is shown in Figure 2.
Table 17. Breakdown of [5-14C]-methoprene on stored wheat grains in screw-capped jars at 20oC (Rowlands, 1976)1.
Residue (mg/kg) in grain Storage time in weeks Fresh wheat (19% moisture) Old wheat (12% moisture) Older wheat (18% moisture)
0 9.6 9.8 9.6 1 7.2 9.2 7.7 2 5.5 7.9 6.3 3 4.4 7.6 5.0 4 3.4 7.0 4.3 5 2.2 6.2 3.2 6 1.4 5.1 2.1 7 0.5 4.2 1.4 8 0.2 3.2 0.5 9 0.1 2.4 0.4 10 nd2 1.5 0.2 1Results are mean of triplicate 25g samples, treated at 10 mg/kg (approx.). 2nd = not detected.
Methoprene 746
O
OCH3O
OH
OCH3O
OH
OOH
O
OOH
Metabolite 1Metabolite 3
Metabolite 2
Methoprene
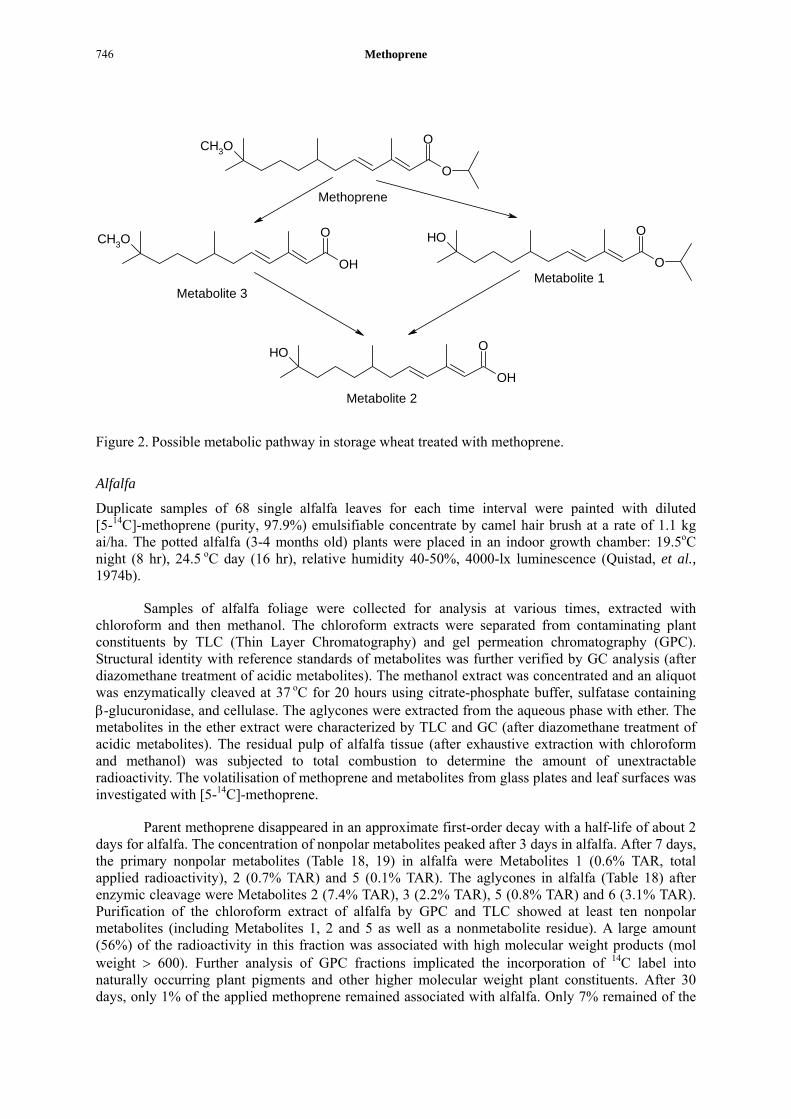
Figure 2. Possible metabolic pathway in storage wheat treated with methoprene.
Alfalfa
Duplicate samples of 68 single alfalfa leaves for each time interval were painted with diluted [5-14C]-methoprene (purity, 97.9%) emulsifiable concentrate by camel hair brush at a rate of 1.1 kg ai/ha. The potted alfalfa (3-4 months old) plants were placed in an indoor growth chamber: 19.5oC night (8 hr), 24.5 oC day (16 hr), relative humidity 40-50%, 4000-lx luminescence (Quistad, et al., 1974b).
Samples of alfalfa foliage were collected for analysis at various times, extracted with chloroform and then methanol. The chloroform extracts were separated from contaminating plant constituents by TLC (Thin Layer Chromatography) and gel permeation chromatography (GPC). Structural identity with reference standards of metabolites was further verified by GC analysis (after diazomethane treatment of acidic metabolites). The methanol extract was concentrated and an aliquot was enzymatically cleaved at 37 oC for 20 hours using citrate-phosphate buffer, sulfatase containing β-glucuronidase, and cellulase. The aglycones were extracted from the aqueous phase with ether. The metabolites in the ether extract were characterized by TLC and GC (after diazomethane treatment of acidic metabolites). The residual pulp of alfalfa tissue (after exhaustive extraction with chloroform and methanol) was subjected to total combustion to determine the amount of unextractable radioactivity. The volatilisation of methoprene and metabolites from glass plates and leaf surfaces was investigated with [5-14C]-methoprene.
Parent methoprene disappeared in an approximate first-order decay with a half-life of about 2 days for alfalfa. The concentration of nonpolar metabolites peaked after 3 days in alfalfa. After 7 days, the primary nonpolar metabolites (Table 18, 19) in alfalfa were Metabolites 1 (0.6% TAR, total applied radioactivity), 2 (0.7% TAR) and 5 (0.1% TAR). The aglycones in alfalfa (Table 18) after enzymic cleavage were Metabolites 2 (7.4% TAR), 3 (2.2% TAR), 5 (0.8% TAR) and 6 (3.1% TAR). Purification of the chloroform extract of alfalfa by GPC and TLC showed at least ten nonpolar metabolites (including Metabolites 1, 2 and 5 as well as a nonmetabolite residue). A large amount (56%) of the radioactivity in this fraction was associated with high molecular weight products (mol weight > 600). Further analysis of GPC fractions implicated the incorporation of 14C label into naturally occurring plant pigments and other higher molecular weight plant constituents. After 30 days, only 1% of the applied methoprene remained associated with alfalfa. Only 7% remained of the
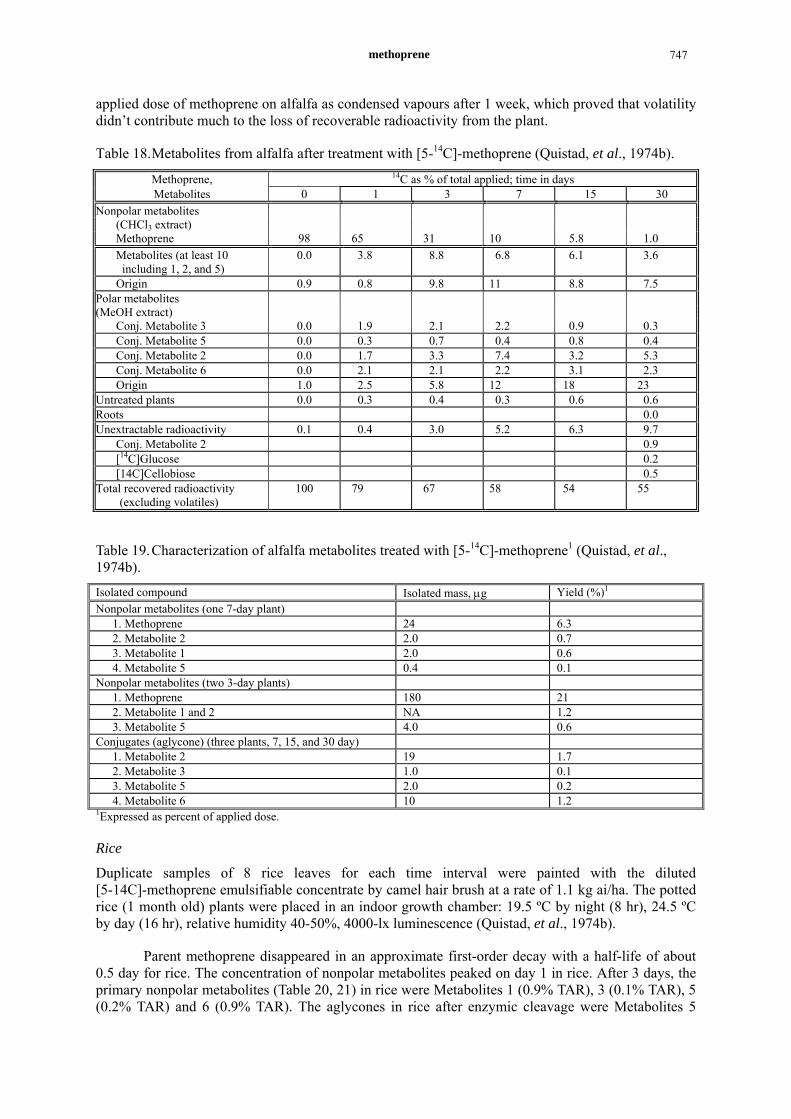
methoprene 747
applied dose of methoprene on alfalfa as condensed vapours after 1 week, which proved that volatility didn’t contribute much to the loss of recoverable radioactivity from the plant.
Table 18. Metabolites from alfalfa after treatment with [5-14C]-methoprene (Quistad, et al., 1974b).
Methoprene, 14C as % of total applied; time in days Metabolites 0 1 3 7 15 30
Nonpolar metabolites (CHCl3 extract) Methoprene 98 65 31 10 5.8 1.0 Metabolites (at least 10 including 1, 2, and 5)
0.0 3.8 8.8 6.8 6.1 3.6
Origin 0.9 0.8 9.8 11 8.8 7.5 Polar metabolites (MeOH extract)
Conj. Metabolite 3 0.0 1.9 2.1 2.2 0.9 0.3 Conj. Metabolite 5 0.0 0.3 0.7 0.4 0.8 0.4 Conj. Metabolite 2 0.0 1.7 3.3 7.4 3.2 5.3 Conj. Metabolite 6 0.0 2.1 2.1 2.2 3.1 2.3 Origin 1.0 2.5 5.8 12 18 23
Untreated plants 0.0 0.3 0.4 0.3 0.6 0.6 Roots 0.0 Unextractable radioactivity 0.1 0.4 3.0 5.2 6.3 9.7
Conj. Metabolite 2 0.9 [14C]Glucose 0.2 [14C]Cellobiose 0.5
Total recovered radioactivity (excluding volatiles)
100 79 67 58 54 55
Table 19. Characterization of alfalfa metabolites treated with [5-14C]-methoprene1 (Quistad, et al., 1974b).
Isolated compound Isolated mass, μg Yield (%)1
Nonpolar metabolites (one 7-day plant) 1. Methoprene 24 6.3 2. Metabolite 2 2.0 0.7 3. Metabolite 1 2.0 0.6 4. Metabolite 5 0.4 0.1
Nonpolar metabolites (two 3-day plants) 1. Methoprene 180 21 2. Metabolite 1 and 2 NA 1.2 3. Metabolite 5 4.0 0.6
Conjugates (aglycone) (three plants, 7, 15, and 30 day) 1. Metabolite 2 19 1.7 2. Metabolite 3 1.0 0.1 3. Metabolite 5 2.0 0.2 4. Metabolite 6 10 1.2
1Expressed as percent of applied dose.
Rice
Duplicate samples of 8 rice leaves for each time interval were painted with the diluted [5-14C]-methoprene emulsifiable concentrate by camel hair brush at a rate of 1.1 kg ai/ha. The potted rice (1 month old) plants were placed in an indoor growth chamber: 19.5 ºC by night (8 hr), 24.5 ºC by day (16 hr), relative humidity 40-50%, 4000-lx luminescence (Quistad, et al., 1974b).
Parent methoprene disappeared in an approximate first-order decay with a half-life of about 0.5 day for rice. The concentration of nonpolar metabolites peaked on day 1 in rice. After 3 days, the primary nonpolar metabolites (Table 20, 21) in rice were Metabolites 1 (0.9% TAR), 3 (0.1% TAR), 5 (0.2% TAR) and 6 (0.9% TAR). The aglycones in rice after enzymic cleavage were Metabolites 5
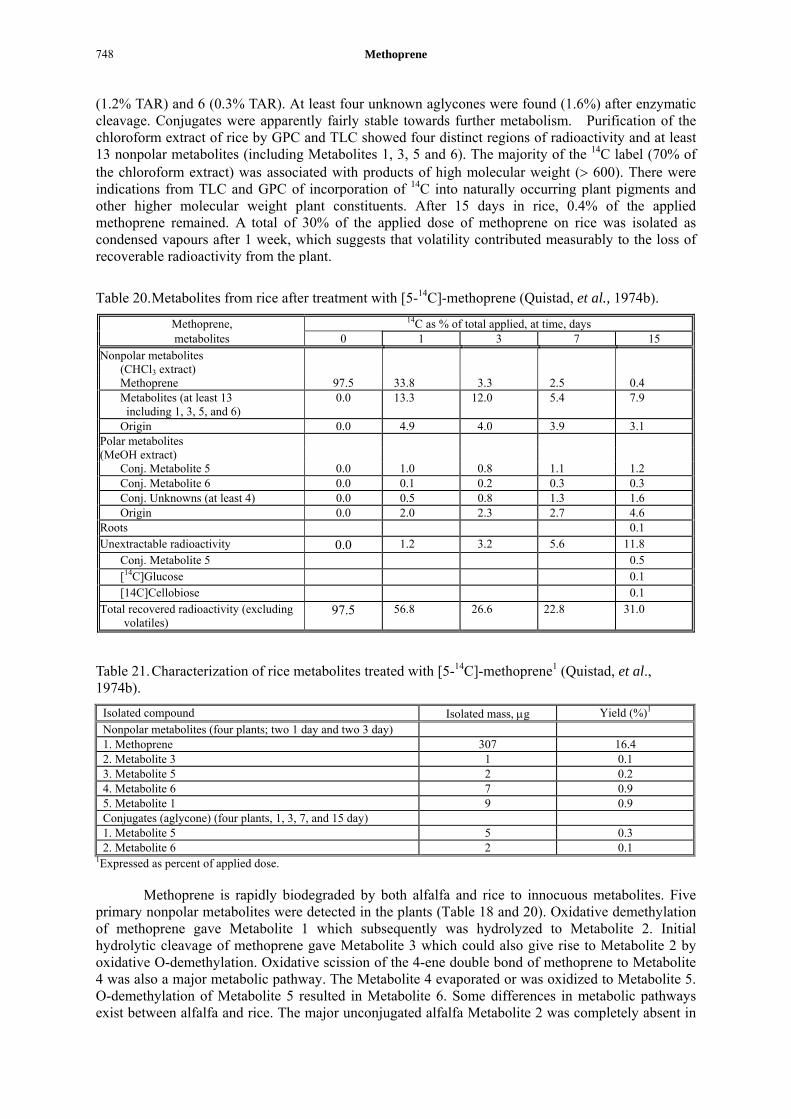
Methoprene 748
(1.2% TAR) and 6 (0.3% TAR). At least four unknown aglycones were found (1.6%) after enzymatic cleavage. Conjugates were apparently fairly stable towards further metabolism. Purification of the chloroform extract of rice by GPC and TLC showed four distinct regions of radioactivity and at least 13 nonpolar metabolites (including Metabolites 1, 3, 5 and 6). The majority of the 14C label (70% of the chloroform extract) was associated with products of high molecular weight (> 600). There were indications from TLC and GPC of incorporation of 14C into naturally occurring plant pigments and other higher molecular weight plant constituents. After 15 days in rice, 0.4% of the applied methoprene remained. A total of 30% of the applied dose of methoprene on rice was isolated as condensed vapours after 1 week, which suggests that volatility contributed measurably to the loss of recoverable radioactivity from the plant.
Table 20. Metabolites from rice after treatment with [5-14C]-methoprene (Quistad, et al., 1974b).
Methoprene, 14C as % of total applied, at time, days metabolites 0 1 3 7 15
Nonpolar metabolites (CHCl3 extract) Methoprene 97.5 33.8 3.3 2.5 0.4 Metabolites (at least 13 including 1, 3, 5, and 6)
0.0 13.3 12.0 5.4 7.9
Origin 0.0 4.9 4.0 3.9 3.1 Polar metabolites (MeOH extract)
Conj. Metabolite 5 0.0 1.0 0.8 1.1 1.2 Conj. Metabolite 6 0.0 0.1 0.2 0.3 0.3 Conj. Unknowns (at least 4) 0.0 0.5 0.8 1.3 1.6 Origin 0.0 2.0 2.3 2.7 4.6
Roots 0.1 Unextractable radioactivity 0.0 1.2 3.2 5.6 11.8
Conj. Metabolite 5 0.5 [14C]Glucose 0.1 [14C]Cellobiose 0.1
Total recovered radioactivity (excluding volatiles)
97.5 56.8 26.6 22.8 31.0
Table 21. Characterization of rice metabolites treated with [5-14C]-methoprene1 (Quistad, et al., 1974b).
Isolated compound Isolated mass, μg Yield (%)1
Nonpolar metabolites (four plants; two 1 day and two 3 day) 1. Methoprene 307 16.4 2. Metabolite 3 1 0.1 3. Metabolite 5 2 0.2 4. Metabolite 6 7 0.9 5. Metabolite 1 9 0.9 Conjugates (aglycone) (four plants, 1, 3, 7, and 15 day) 1. Metabolite 5 5 0.3 2. Metabolite 6 2 0.1
1Expressed as percent of applied dose.
Methoprene is rapidly biodegraded by both alfalfa and rice to innocuous metabolites. Five primary nonpolar metabolites were detected in the plants (Table 18 and 20). Oxidative demethylation of methoprene gave Metabolite 1 which subsequently was hydrolyzed to Metabolite 2. Initial hydrolytic cleavage of methoprene gave Metabolite 3 which could also give rise to Metabolite 2 by oxidative O-demethylation. Oxidative scission of the 4-ene double bond of methoprene to Metabolite 4 was also a major metabolic pathway. The Metabolite 4 evaporated or was oxidized to Metabolite 5. O-demethylation of Metabolite 5 resulted in Metabolite 6. Some differences in metabolic pathways exist between alfalfa and rice. The major unconjugated alfalfa Metabolite 2 was completely absent in
methoprene 749
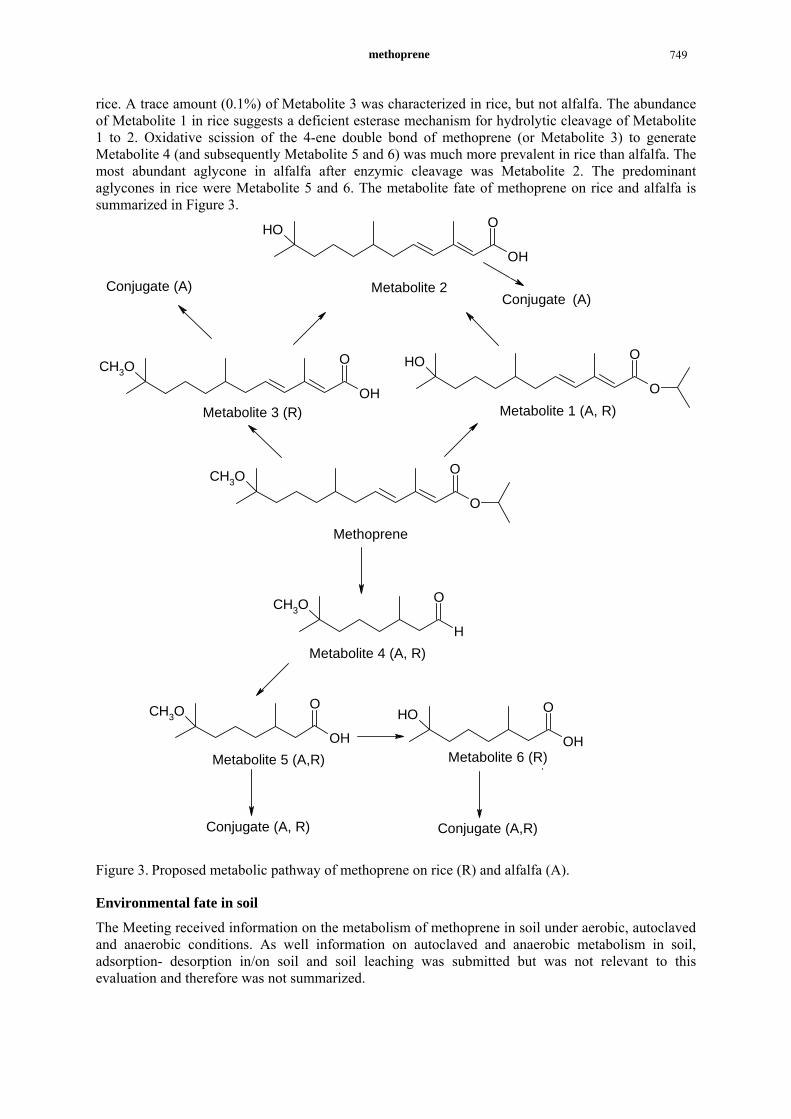
rice. A trace amount (0.1%) of Metabolite 3 was characterized in rice, but not alfalfa. The abundance of Metabolite 1 in rice suggests a deficient esterase mechanism for hydrolytic cleavage of Metabolite 1 to 2. Oxidative scission of the 4-ene double bond of methoprene (or Metabolite 3) to generate Metabolite 4 (and subsequently Metabolite 5 and 6) was much more prevalent in rice than alfalfa. The most abundant aglycone in alfalfa after enzymic cleavage was Metabolite 2. The predominant aglycones in rice were Metabolite 5 and 6. The metabolite fate of methoprene on rice and alfalfa is summarized in Figure 3.
O
OCH3O
CH3O
H
O
CH3O
OH
O
O
OOH
OH
OCH3O
OH
OOH
OH
OH
O
Methoprene
Metabolite 4 (A, R)
Metabolite 1 (A, R)Metabolite 3 (R)
Metabolite 2Conjugate (A)Conjugate (A)
Metabolite 5 (A,R) Metabolite 6 (R)
Conjugate (A, R) Conjugate (A,R)
Figure 3. Proposed metabolic pathway of methoprene on rice (R) and alfalfa (A).
Environmental fate in soil
The Meeting received information on the metabolism of methoprene in soil under aerobic, autoclaved and anaerobic conditions. As well information on autoclaved and anaerobic metabolism in soil, adsorption- desorption in/on soil and soil leaching was submitted but was not relevant to this evaluation and therefore was not summarized.

Methoprene 750
Aerobic soil metabolism
[5-14C]-methoprene (purity, 97.9%) emulsifiable concentrate was applied to samples of sandy loam and silt loam soils as drops as evenly as possible at dose rates of 1.0 kg ai/ha and 10 kg ai/ha. The treated samples were maintained for 60 days in an indoor plant growth chamber: 22oC by day (16 hr), 19 oC by night (8 hr), relative humidity about 50%, 4000 lx luminescence (Schooley, et al., 1975b). Samples of soil were extracted with methanol. Following methanol extraction, sandy loam soil samples were subjected to a humic-fulvic acid extraction and fractionation. The volatilisation of 14CO2 resulting from [5-14C]-methoprene on the soil surface was investigated at a dose rate of 0.7 kg ai/ ha. Moistened CO2-free air was drawn over the surface of the soil through two 5% aqueous KOH traps in series to collect 14CO2. Total contents of each KOH trap were changed and radioassayed at 1, 3, 7, 10, 14, 21, 28, 35, 49, 56 and 63 days after treatment.
On aerobic sandy loam, [5-14C]-methoprene showed an initial half-life of about 10 days at a surface treatment rate of 1 kg ai/ha. Recoveries of radioactivity from sandy loam soils ranged from 97 to >100% because 14CO2 collection was performed on different samples than those used in extraction-fractionation. At early time points (1-14 days), methoprene was found in the methanol extract and most of the radioactive degradation products on TLC were known primary metabolites of methoprene (such as Metabolites 1, 2 and 3). The only metabolite positively identified at 14-day in sandy loam (TLC, HPLC and GC-MS data) was Metabolite 1 resulting from O-demethylation (0.7% of the applied dose). At 60 days, almost half of the radioactive degradation products were polar and therefore remained at the origin of TLC plate. Substantial amounts of radioactivity from [5-14C]-methoprene were incorporated into humic acid, fulvic acid and humin fractions of sandy loam. In the volatile test, over 50% of applied dose was converted to 14CO2. As much as 5% of the volatile radioactivity could have been due to volatile acids other than 14CO2 in a few samples. It appears that not only does methoprene degrade rapidly in soil, but the traces of primary metabolites isolated are rapidly and very extensively metabolised. The metabolic fate of methoprene on aerobic soil is summarized in Figure 4.
O
OCH3O
O
OOH
Metabolite 1
Methoprene
Acetate CO2 Figure 4. Proposed metabolic pathway of methoprene on aerobic soil.

methoprene 751
Environmental fate in water/sediment systems
Hydrolysis
The stability [5-14C]-methoprene (purity, 97.9%) was investigated in sterile aqueous solutions (0.5 mg/L) at pH 5, 7 and 9 (Schooley, et al., 1975a). Test samples were maintained under sterile conditions in an incubator at 20 oC in the dark for 30 days. The samples of each solution were collected for analysis at 1, 3, 7, 14, 21 and 30 days. All samples were acidified with 2 M HCl, extracted with chloroform and then analyzed using TLC.
Aqueous solutions of methoprene (0.5mg/L) were found to be totally stable to hydrolysis for four weeks at pH 5, 7, and 9 at 20 oC. No degradation was seen for the duration of the experiment in sterile water, buffered at pH 7 and 9, and similar stability was noted at pH 5 through the 3 week sampling time. However, the pH 5 buffer accidentally became unsterile between the 21 and 30 day observations, and analysis revealed 59% degradation of methoprene had occurred in that 9 day interval. Such degradation of methoprene was undoubtedly due to microbial action.
Aqueous photolysis
The photolysis of [5-14C]-methoprene (at 0.01 mg/kg and 0.50 mg/kg) was investigated in autoclaved phosphate buffer (0.05 M, pH 7) (Quistad, et al., 1975a). Moistened CO2-free air was passed through the buffer which was then passed through two 5% aqueous KOH traps in series to collect 14CO2. The system was positioned in an area exposed to natural sunlight (through glass) for three weeks. Total contents of each KOH trap were radioassayed periodically. Samples of the aqueous photolysate were extracted with chloroform to follow the rate of methoprene photodecomposition. The temperature of aqueous photolysate was monitored with a temperature recorder.
Aqueous methoprene was rapidly decomposed at concentrations of 0.5 mg/kg and 0.01 mg/kg. The half-life of methoprene at both concentrations was apparently less than one day. After one week 12 and 5% of the applied methoprene remained in the 0.5 and 0.01 mg/kg solutions, respectively. After two weeks there was no detectable methoprene. With 94% of the total radioactivity recovered after three weeks, loss of photoproducts by volatilization was minor for the aqueous photodecomposition (Table 22). Since methoprene has limited water solubility (1.4 mg/L), it was difficult to collect enough of each photoproduct for detailed spectral analysis.
In a second study, an aqueous emulsion of methoprene labelled in the 5-14C was irradiated for 1 week and photolysis products isolated. The entire photolysate after 1 week was separated using a column of XAD-2 (Quistad, et al., 1975a). Of the 96% of the total radioactivity recovered, 9% was contained in the effluent water, 83% in the effluent methanol and 4% in the effluent acetone. After an aqueous emulsion of methoprene was irradiated for 1 week by sunlight through glass followed by methanol chromatographic work-up, four photolysis products (24% yield overall) were characterized as Metabolite 5 (7%), Photoproduct 7 (4%), Photoproduct 8 (4%) and Photoproduct 9 (9%). Untreated methoprene was not detectable and there were at least 46 other photoproducts but none represented more than 2% yield. The most abundant product was Metabolite 4 which was isolated as Photoproduct 9. The Photoproduct 9 was undoubtedly an artefact of the isolation procedure.
Table 22. Rate of methoprene photodecomposition in aqueous solution (0.5 mg/kg) (Quistad, et al., 1975a).
Extraction with CHCl3Days 14C in water (%)
Methoprene remaining
(%) 14C in CHCl3
(%) 14C in aq phase (%)
14CO2/%14C in KOH trap
Temperature (av daily high), oC
Total 14C recovered
0 100 96 100 0 0.0 39 100 1 96 23 87 13 0.0 39 96 3 97 17 82 18 0.2 37 97 7 92 12 81 19 0.9 36 93
14 93 1 75 25 2.2 40 95 21 91 0 70 30 3.4 - 94
Methoprene 752
Thin film photolysis
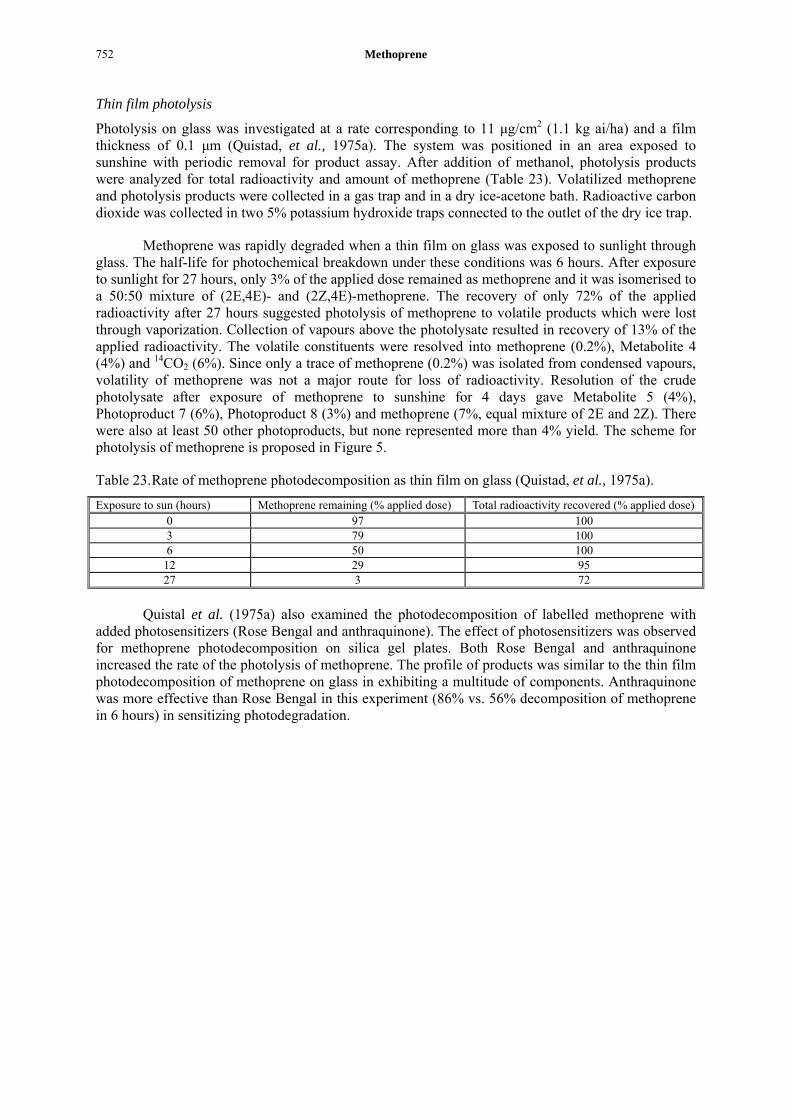
Photolysis on glass was investigated at a rate corresponding to 11 μg/cm2 (1.1 kg ai/ha) and a film thickness of 0.1 μm (Quistad, et al., 1975a). The system was positioned in an area exposed to sunshine with periodic removal for product assay. After addition of methanol, photolysis products were analyzed for total radioactivity and amount of methoprene (Table 23). Volatilized methoprene and photolysis products were collected in a gas trap and in a dry ice-acetone bath. Radioactive carbon dioxide was collected in two 5% potassium hydroxide traps connected to the outlet of the dry ice trap.
Methoprene was rapidly degraded when a thin film on glass was exposed to sunlight through glass. The half-life for photochemical breakdown under these conditions was 6 hours. After exposure to sunlight for 27 hours, only 3% of the applied dose remained as methoprene and it was isomerised to a 50:50 mixture of (2E,4E)- and (2Z,4E)-methoprene. The recovery of only 72% of the applied radioactivity after 27 hours suggested photolysis of methoprene to volatile products which were lost through vaporization. Collection of vapours above the photolysate resulted in recovery of 13% of the applied radioactivity. The volatile constituents were resolved into methoprene (0.2%), Metabolite 4 (4%) and 14CO2 (6%). Since only a trace of methoprene (0.2%) was isolated from condensed vapours, volatility of methoprene was not a major route for loss of radioactivity. Resolution of the crude photolysate after exposure of methoprene to sunshine for 4 days gave Metabolite 5 (4%), Photoproduct 7 (6%), Photoproduct 8 (3%) and methoprene (7%, equal mixture of 2E and 2Z). There were also at least 50 other photoproducts, but none represented more than 4% yield. The scheme for photolysis of methoprene is proposed in Figure 5.
Table 23. Rate of methoprene photodecomposition as thin film on glass (Quistad, et al., 1975a).
Exposure to sun (hours) Methoprene remaining (% applied dose) Total radioactivity recovered (% applied dose) 0 97 100 3 79 100 6 50 100
12 29 95 27 3 72
Quistal et al. (1975a) also examined the photodecomposition of labelled methoprene with
added photosensitizers (Rose Bengal and anthraquinone). The effect of photosensitizers was observed for methoprene photodecomposition on silica gel plates. Both Rose Bengal and anthraquinone increased the rate of the photolysis of methoprene. The profile of products was similar to the thin film photodecomposition of methoprene on glass in exhibiting a multitude of components. Anthraquinone was more effective than Rose Bengal in this experiment (86% vs. 56% decomposition of methoprene in 6 hours) in sensitizing photodegradation.

methoprene 753
O
OCH3O
CH3O
H
O
CH3O
OH
O
O
OCH3O
O
CH3OO
Methoprene
Metabolite 4 Photoproduct 7
Metabolite 5 Photoproduct 8
Figure 5. Proposed pathways of degradation of methoprene by photolysis.
Metabolism in pond water
Degradation studies of methoprene labelled in the 10-3H position (purity > 99%) and the 5-14C position (purity 97.9%; dose rate of 0.66 mg/were performed in pond water (Schooley, et al., 1975a). Test systems were placed outdoors where they would remain fully exposed to natural sunlight during the experiments. Three dose rates of [10-3H]-methoprene were equivalent to 0.001 mg/L, 0.01 mg/L and 0.42 mg/L, respectively. Samples from the 0.001 and 0.01 mg/L rates were collected at 0, 12, 24, 48 and 96 h; that for 0.42 mg/L at 66 hours. Solution containing 0.66 mg/L of [5-14C]-methoprene in pond water was also placed outdoors in full sunlight at ambient temperature. These flasks were sampled at 66, 136 and 312 h. All samples were extracted with chloroform and analyzed with TLC.
A time plot of remaining [10-3H]-methoprene in pond water showed a half-life of approximately 30 h at 0.001 mg/L and 40 h at 0.01 mg/L. Incubation of [10-3H]-methoprene for 66 hours at 0.42 mg/L generated three primary metabolites, the result of ester hydrolysis and/or O-demethylation. Extraction of the incubation gave 75% recovery of the administered tritium. The radioactivity in the chloroform extract was identified as methoprene (60% of applied dose), Metabolites 1 (7%), 2 (2.6%) and 3 (5.7%). The metabolites and recovered methoprene were photoequilibrium mixtures of 2-ene double bond isomers.
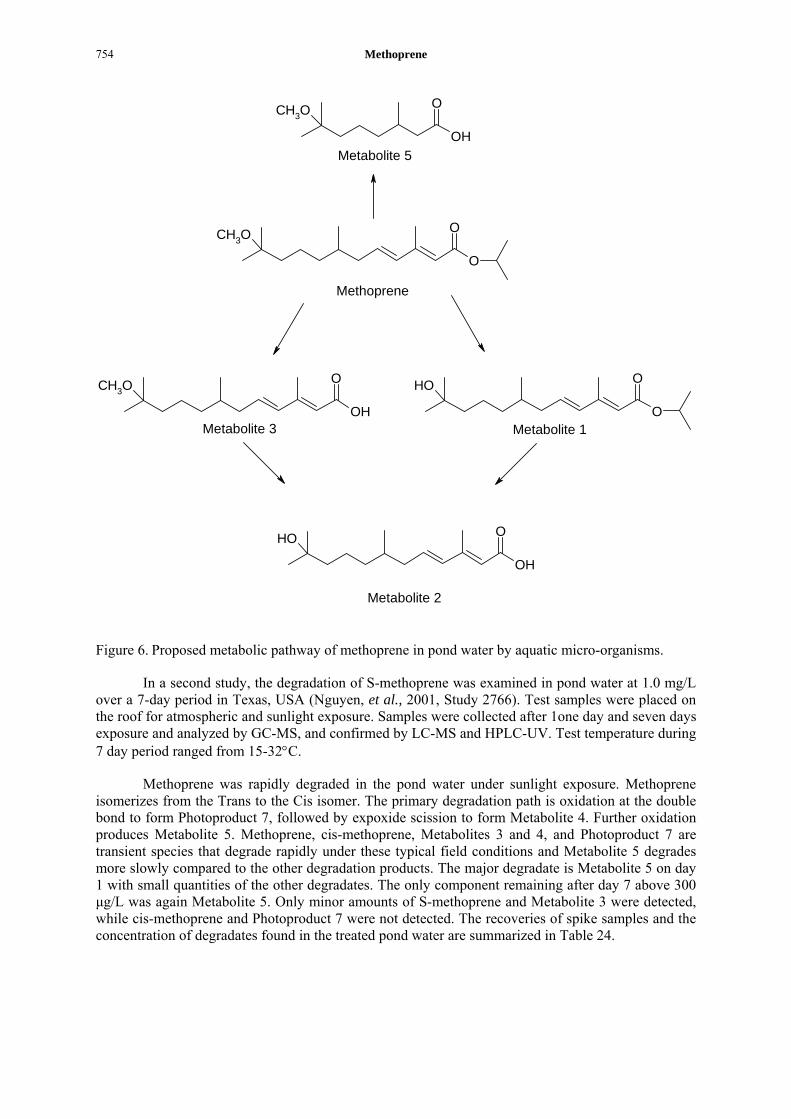
In the incubation experiment with [5-14C]-methoprene at 0.66 mg/L in a pond water sample with presumably different microflora, a completely different metabolic profile was observed with the sole identifiable metabolite resulting from oxidative scission of the 4-ene double bond. At 13 days, methoprene was not found in the active incubation, and the low recovery (48%) of administered radioactivity from the microbially active water may well reflect formation of 14CO2. The principal metabolite in the latter experiment was Metabolite 5 (29% of applied dose). The metabolite fate of methoprene in pond water is summarized in Figure 6.
Methoprene 754
O
OCH3O
CH3O
OH
O
OH
OCH3O
OH
OOH
O
OOH
Methoprene
Metabolite 5
Metabolite 1
Metabolite 2
Metabolite 3
Figure 6. Proposed metabolic pathway of methoprene in pond water by aquatic micro-organisms.
In a second study, the degradation of S-methoprene was examined in pond water at 1.0 mg/L over a 7-day period in Texas, USA (Nguyen, et al., 2001, Study 2766). Test samples were placed on the roof for atmospheric and sunlight exposure. Samples were collected after 1one day and seven days exposure and analyzed by GC-MS, and confirmed by LC-MS and HPLC-UV. Test temperature during 7 day period ranged from 15-32°C.
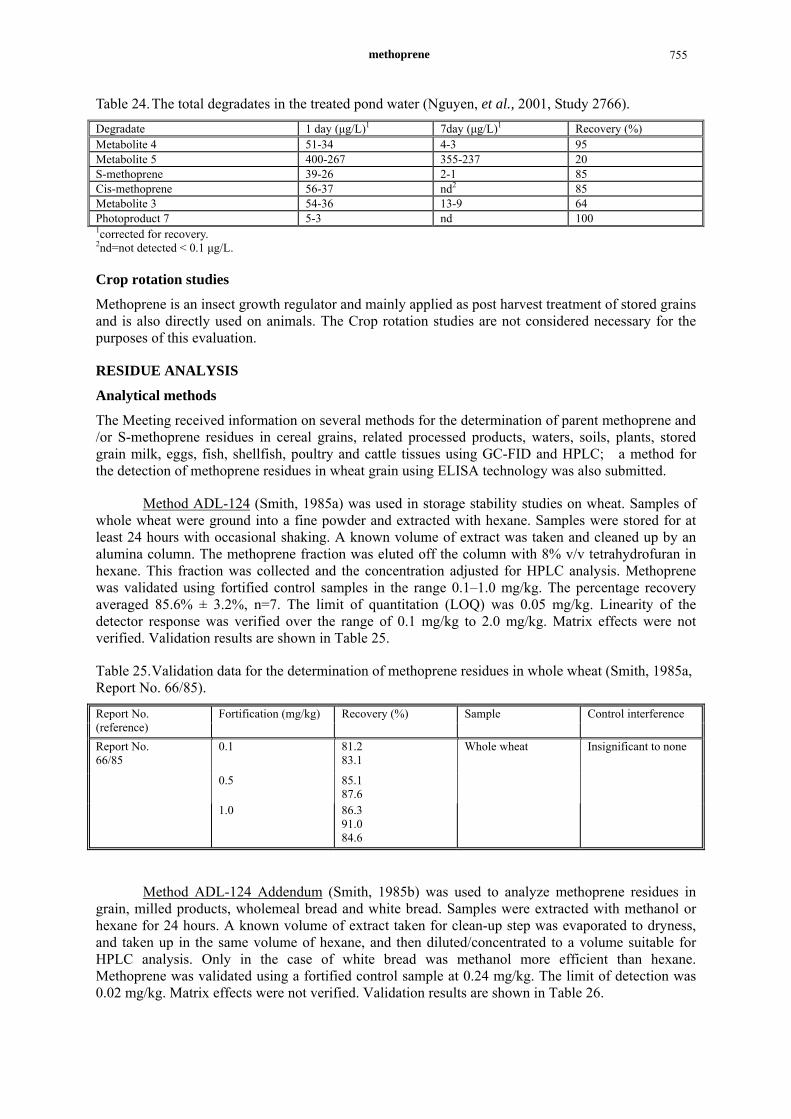
Methoprene was rapidly degraded in the pond water under sunlight exposure. Methoprene isomerizes from the Trans to the Cis isomer. The primary degradation path is oxidation at the double bond to form Photoproduct 7, followed by expoxide scission to form Metabolite 4. Further oxidation produces Metabolite 5. Methoprene, cis-methoprene, Metabolites 3 and 4, and Photoproduct 7 are transient species that degrade rapidly under these typical field conditions and Metabolite 5 degrades more slowly compared to the other degradation products. The major degradate is Metabolite 5 on day 1 with small quantities of the other degradates. The only component remaining after day 7 above 300 μg/L was again Metabolite 5. Only minor amounts of S-methoprene and Metabolite 3 were detected, while cis-methoprene and Photoproduct 7 were not detected. The recoveries of spike samples and the concentration of degradates found in the treated pond water are summarized in Table 24.
methoprene 755
Table 24. The total degradates in the treated pond water (Nguyen, et al., 2001, Study 2766).
Degradate 1 day (μg/L)1 7day (μg/L)1 Recovery (%) Metabolite 4 51-34 4-3 95 Metabolite 5 400-267 355-237 20 S-methoprene 39-26 2-1 85 Cis-methoprene 56-37 nd2 85 Metabolite 3 54-36 13-9 64 Photoproduct 7 5-3 nd 100 1corrected for recovery. 2nd=not detected < 0.1 μg/L.
Crop rotation studies
Methoprene is an insect growth regulator and mainly applied as post harvest treatment of stored grains and is also directly used on animals. The Crop rotation studies are not considered necessary for the purposes of this evaluation.
RESIDUE ANALYSIS
Analytical methods
The Meeting received information on several methods for the determination of parent methoprene and /or S-methoprene residues in cereal grains, related processed products, waters, soils, plants, stored grain milk, eggs, fish, shellfish, poultry and cattle tissues using GC-FID and HPLC; a method for the detection of methoprene residues in wheat grain using ELISA technology was also submitted.
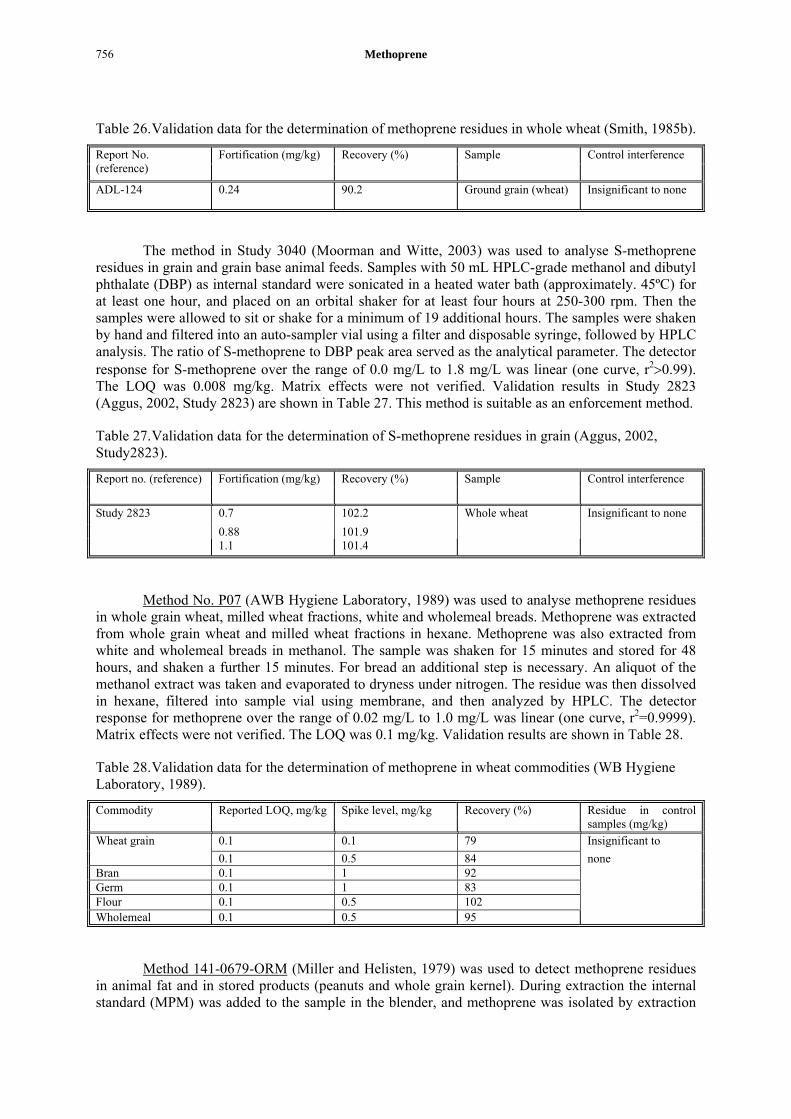
Method ADL-124 (Smith, 1985a) was used in storage stability studies on wheat. Samples of whole wheat were ground into a fine powder and extracted with hexane. Samples were stored for at least 24 hours with occasional shaking. A known volume of extract was taken and cleaned up by an alumina column. The methoprene fraction was eluted off the column with 8% v/v tetrahydrofuran in hexane. This fraction was collected and the concentration adjusted for HPLC analysis. Methoprene was validated using fortified control samples in the range 0.1–1.0 mg/kg. The percentage recovery averaged 85.6% ± 3.2%, n=7. The limit of quantitation (LOQ) was 0.05 mg/kg. Linearity of the detector response was verified over the range of 0.1 mg/kg to 2.0 mg/kg. Matrix effects were not verified. Validation results are shown in Table 25.
Table 25. Validation data for the determination of methoprene residues in whole wheat (Smith, 1985a, Report No. 66/85).
Report No. (reference)
Fortification (mg/kg) Recovery (%) Sample Control interference
Report No. 66/85
0.1 81.2 83.1
Whole wheat Insignificant to none
0.5 85.1 87.6
1.0 86.3 91.0 84.6
Method ADL-124 Addendum (Smith, 1985b) was used to analyze methoprene residues in grain, milled products, wholemeal bread and white bread. Samples were extracted with methanol or hexane for 24 hours. A known volume of extract taken for clean-up step was evaporated to dryness, and taken up in the same volume of hexane, and then diluted/concentrated to a volume suitable for HPLC analysis. Only in the case of white bread was methanol more efficient than hexane. Methoprene was validated using a fortified control sample at 0.24 mg/kg. The limit of detection was 0.02 mg/kg. Matrix effects were not verified. Validation results are shown in Table 26.
Methoprene 756
Table 26. Validation data for the determination of methoprene residues in whole wheat (Smith, 1985b).
Report No. (reference)
Fortification (mg/kg) Recovery (%) Sample Control interference
ADL-124 0.24 90.2 Ground grain (wheat) Insignificant to none
The method in Study 3040 (Moorman and Witte, 2003) was used to analyse S-methoprene residues in grain and grain base animal feeds. Samples with 50 mL HPLC-grade methanol and dibutyl phthalate (DBP) as internal standard were sonicated in a heated water bath (approximately. 45ºC) for at least one hour, and placed on an orbital shaker for at least four hours at 250-300 rpm. Then the samples were allowed to sit or shake for a minimum of 19 additional hours. The samples were shaken by hand and filtered into an auto-sampler vial using a filter and disposable syringe, followed by HPLC analysis. The ratio of S-methoprene to DBP peak area served as the analytical parameter. The detector response for S-methoprene over the range of 0.0 mg/L to 1.8 mg/L was linear (one curve, r2>0.99). The LOQ was 0.008 mg/kg. Matrix effects were not verified. Validation results in Study 2823 (Aggus, 2002, Study 2823) are shown in Table 27. This method is suitable as an enforcement method.
Table 27. Validation data for the determination of S-methoprene residues in grain (Aggus, 2002, Study2823).
Report no. (reference) Fortification (mg/kg) Recovery (%) Sample Control interference
Study 2823 0.7 102.2 Whole wheat Insignificant to none 0.88 101.9 1.1 101.4
Method No. P07 (AWB Hygiene Laboratory, 1989) was used to analyse methoprene residues in whole grain wheat, milled wheat fractions, white and wholemeal breads. Methoprene was extracted from whole grain wheat and milled wheat fractions in hexane. Methoprene was also extracted from white and wholemeal breads in methanol. The sample was shaken for 15 minutes and stored for 48 hours, and shaken a further 15 minutes. For bread an additional step is necessary. An aliquot of the methanol extract was taken and evaporated to dryness under nitrogen. The residue was then dissolved in hexane, filtered into sample vial using membrane, and then analyzed by HPLC. The detector response for methoprene over the range of 0.02 mg/L to 1.0 mg/L was linear (one curve, r2=0.9999). Matrix effects were not verified. The LOQ was 0.1 mg/kg. Validation results are shown in Table 28.
Table 28. Validation data for the determination of methoprene in wheat commodities (WB Hygiene Laboratory, 1989).
Commodity Reported LOQ, mg/kg Spike level, mg/kg Recovery (%) Residue in control samples (mg/kg)
Wheat grain 0.1 0.1 79 Insignificant to 0.1 0.5 84 none Bran 0.1 1 92 Germ 0.1 1 83 Flour 0.1 0.5 102 Wholemeal 0.1 0.5 95
Method 141-0679-ORM (Miller and Helisten, 1979) was used to detect methoprene residues in animal fat and in stored products (peanuts and whole grain kernel). During extraction the internal standard (MPM) was added to the sample in the blender, and methoprene was isolated by extraction
methoprene 757
with sodium sulfate and iso-octane. The difference between MPM and methoprene is one methylene addition in the aliphatic structure. The extract was filtered under vacuum and the filter cake was washed with iso-octane. The iso-octane filtrate was extracted twice with acetonitrile saturated with iso-octane. The iso-octane containing the fat was discarded and the two acetonitrile fractions containing the methoprene were pooled. The methoprene was partitioned into pentane against water, NaCl and the acetonitrile extract. The pentane was washed with water and dried over sodium sulfate. Following evaporation of the extract, column chromatography was performed on neutral alumina. Diethyl ether/pentane was used as the eluting solvent. The sample was concentrated to a volume suitable for GC-FID or HPLC for quantification. The identity of suspected residues was confirmed by alternative GC column and [14C]-methoprene. Recoveries of methoprene added to all samples ranged from 78–83%. The LOQ was 0.04 mg/kg. Linearity and matrix effects were not verified. Validation results are shown in Table 29.
Table 29. Validation data for the determination of methoprene in wheat, peanuts and bovine fat commodities (Miller and Helisten, 1979).
Recovery (%) based on Sample type Fat (%) Spike level based on MPM (mg/kg)
1Relative error [14C] MPM
2Relative error
Wheat grain 0.5 0.039 2.5 80 83 3.8 Peanuts 48 0.040 0 77 78 1.3 Bovine fat (20% connective tissue)
80 0.039 2.5 85 80 5.9
1Relative error, in parts per 100, expressing the degree of accuracy between the true value (0.04 mg/kg) and the mg/kg value calculated from the MPM internal standard. 2Relative error, expressing the degree of accuracy between the true percent recovery (the [14C] value) and the calculated percent recovery from the MPM internal standard.
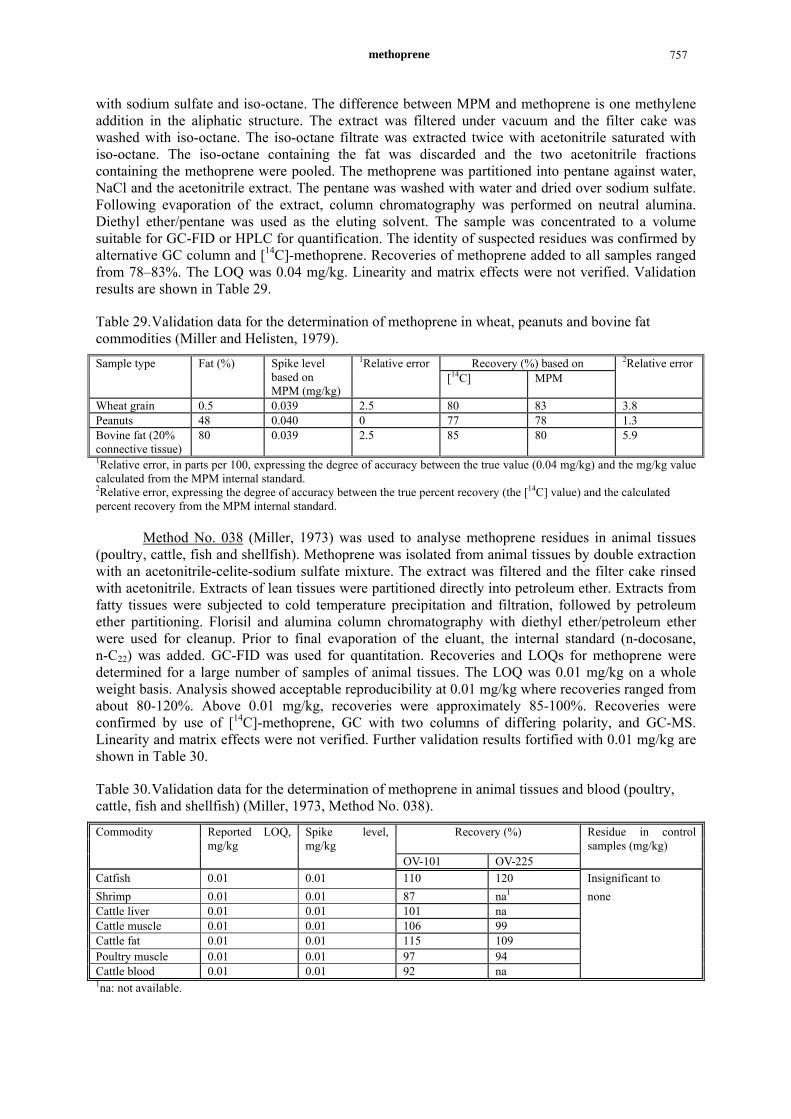
Method No. 038 (Miller, 1973) was used to analyse methoprene residues in animal tissues (poultry, cattle, fish and shellfish). Methoprene was isolated from animal tissues by double extraction with an acetonitrile-celite-sodium sulfate mixture. The extract was filtered and the filter cake rinsed with acetonitrile. Extracts of lean tissues were partitioned directly into petroleum ether. Extracts from fatty tissues were subjected to cold temperature precipitation and filtration, followed by petroleum ether partitioning. Florisil and alumina column chromatography with diethyl ether/petroleum ether were used for cleanup. Prior to final evaporation of the eluant, the internal standard (n-docosane, n-C22) was added. GC-FID was used for quantitation. Recoveries and LOQs for methoprene were determined for a large number of samples of animal tissues. The LOQ was 0.01 mg/kg on a whole weight basis. Analysis showed acceptable reproducibility at 0.01 mg/kg where recoveries ranged from about 80-120%. Above 0.01 mg/kg, recoveries were approximately 85-100%. Recoveries were confirmed by use of [14C]-methoprene, GC with two columns of differing polarity, and GC-MS. Linearity and matrix effects were not verified. Further validation results fortified with 0.01 mg/kg are shown in Table 30.
Table 30. Validation data for the determination of methoprene in animal tissues and blood (poultry, cattle, fish and shellfish) (Miller, 1973, Method No. 038).
Recovery (%) Commodity Reported LOQ, mg/kg
Spike level, mg/kg
OV-101 OV-225
Residue in control samples (mg/kg)
Catfish 0.01 0.01 110 120 Insignificant to Shrimp 0.01 0.01 87 na1 none Cattle liver 0.01 0.01 101 na Cattle muscle 0.01 0.01 106 99 Cattle fat 0.01 0.01 115 109 Poultry muscle 0.01 0.01 97 94 Cattle blood 0.01 0.01 92 na 1na: not available.

Methoprene 758
Method No. 039 (Miller, 1973) was developed for determination of methoprene residues in all types of cows’ whole milk. Methoprene was extracted from cows’ milk by blending with an acetonitrile-celite mixture. The extract is filtered, and methoprene was partitioned into petroleum ether. Florisil and alumina column chromatography with diethyl ether/petroleum ether were used for cleanup. GC-FID was used for quantitation. Recoveries and LOQs for methoprene were determined for all types of cows’ milk, including homogenized, pasteurized, skim and fresh raw milk. Analysis showed acceptable reproducibility at 0.01 mg/kg where recoveries ranged from about 85-100%. Above 0.01 mg/kg, recoveries were approximately 90-100%. The identity of suspected residues was confirmed by alternative GC column and GC-MS. The LOQ was 0.01 mg/kg on whole weight basis. Linearity and matrix effects were not verified.
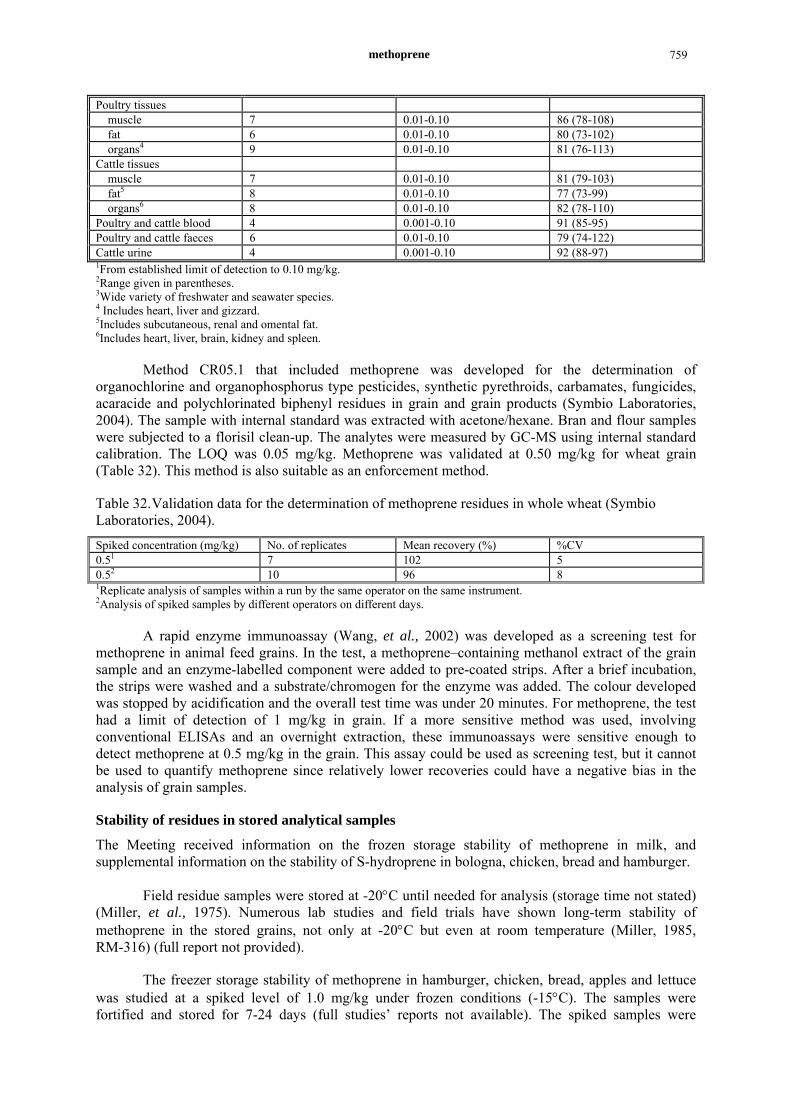
Miller et al. (1975) developed a GC-FID method for determination of methoprene residues in waters, soils, plants, stored grain and corn, milk, eggs, fish, shellfish, poultry and cattle tissues, blood, urine and faeces. Acetonitrile was the primary extraction solvent for all samples. Residues were extracted by high-speed blending followed by vacuum filtration. Fatty extracts were subjected to cold-temperature precipitation and filtration. Samples were cleaned up by petroleum ether partitioning and followed by Florisil and neutral alumina columns. Prior to final evaporation of the eluent, the internal standard (n-docosane, n-C22) was added. The concentrated eluent were analyzed by GC-FID on columns of differing polarity. The identity of suspected residues was confirmed by alternative GC column, GC-MS and [14C]-methoprene. The lower limits of detection were: water, 0.0004-0.001 mg/L; soils, blood, and urine, 0.001 mg/kg; forage grasses, forage legumes, and rice foliage, 0.005 mg/kg; and milk, eggs, stored grain and corn kernel, fish, shellfish, poultry and cattle tissues, and faeces, 0.01 mg/kg. Linearity and matrix effects were not verified. Validation results fortified from limit of detection to 0.1 mg/kg are shown in Table 31.
Table 31.Validation data for the determination of methoprene in waters, soils, plants, stored grain and corn, milk, eggs, fish, shellfish, poultry and cattle tissues, blood, urine and faeces (Miller, et al., 1975).
Sample Number of determinations Fortification range1 (mg/kg) Average recovery2 (%) Waters
tap 20 0.0004-0.10 95 (85-115) lake 7 0.0004-0.10 92 (86-101) river 6 0.0004-0.10 88 (84-98) pond 7 0.0004-0.10 94 (86-121) pasture 16 0.001-0.10 91 (78-120) primary sewage effluent 8 0.001-0.10 103 (79-125)
Soils sandy 18 0.001-0.10 88 (86-113) silty 12 0.001-0.10 91 (78-118) clay 10 0.001-0.10 87 (76-123) peat and muck 8 0.001-0.10 85 (75-103)
Plant tissues forage grasses 25 0.005-0.10 86 (80-115) forage legumes 25 0.005-0.10 81 (78-125) rice foliage 16 0.005-0.10 80 (78-118)
Grain and corm kernel rice 9 0.01-0.10 86 (79-117) wheat 8 0.01-0.10 91 (78-112) oats 4 0.01-0.10 84 (77-102) barley 4 0.01-0.10 82 (73-98) rye 4 0.01-0.10 88 (81-114) yellow corn 4 0.01-0.10 93 (89-101)
Milk (cows’) raw 8 0.01-0.10 91 (87-114) pasteurized 3 0.01-0.10 89 (79-108) powdered (reconstituted) 3 0.01-0.10 79 (73-96)
Eggs (poultry) 9 0.01-0.10 85 (74-102) Fish3 16 0.01-0.10 78 (73-124) Shellfish3 12 0.01-0.10 88 (77-109)
methoprene 759
Poultry tissues muscle 7 0.01-0.10 86 (78-108) fat 6 0.01-0.10 80 (73-102) organs4 9 0.01-0.10 81 (76-113)
Cattle tissues muscle 7 0.01-0.10 81 (79-103) fat5 8 0.01-0.10 77 (73-99) organs6 8 0.01-0.10 82 (78-110)
Poultry and cattle blood 4 0.001-0.10 91 (85-95) Poultry and cattle faeces 6 0.01-0.10 79 (74-122) Cattle urine 4 0.001-0.10 92 (88-97) 1From established limit of detection to 0.10 mg/kg. 2Range given in parentheses. 3Wide variety of freshwater and seawater species. 4 Includes heart, liver and gizzard. 5Includes subcutaneous, renal and omental fat. 6Includes heart, liver, brain, kidney and spleen.
Method CR05.1 that included methoprene was developed for the determination of organochlorine and organophosphorus type pesticides, synthetic pyrethroids, carbamates, fungicides, acaracide and polychlorinated biphenyl residues in grain and grain products (Symbio Laboratories, 2004). The sample with internal standard was extracted with acetone/hexane. Bran and flour samples were subjected to a florisil clean-up. The analytes were measured by GC-MS using internal standard calibration. The LOQ was 0.05 mg/kg. Methoprene was validated at 0.50 mg/kg for wheat grain (Table 32). This method is also suitable as an enforcement method.
Table 32. Validation data for the determination of methoprene residues in whole wheat (Symbio Laboratories, 2004).
Spiked concentration (mg/kg) No. of replicates Mean recovery (%) %CV 0.51 7 102 5 0.52 10 96 8 1Replicate analysis of samples within a run by the same operator on the same instrument. 2Analysis of spiked samples by different operators on different days.
A rapid enzyme immunoassay (Wang, et al., 2002) was developed as a screening test for methoprene in animal feed grains. In the test, a methoprene–containing methanol extract of the grain sample and an enzyme-labelled component were added to pre-coated strips. After a brief incubation, the strips were washed and a substrate/chromogen for the enzyme was added. The colour developed was stopped by acidification and the overall test time was under 20 minutes. For methoprene, the test had a limit of detection of 1 mg/kg in grain. If a more sensitive method was used, involving conventional ELISAs and an overnight extraction, these immunoassays were sensitive enough to detect methoprene at 0.5 mg/kg in the grain. This assay could be used as screening test, but it cannot be used to quantify methoprene since relatively lower recoveries could have a negative bias in the analysis of grain samples.
Stability of residues in stored analytical samples
The Meeting received information on the frozen storage stability of methoprene in milk, and supplemental information on the stability of S-hydroprene in bologna, chicken, bread and hamburger.
Field residue samples were stored at -20°C until needed for analysis (storage time not stated) (Miller, et al., 1975). Numerous lab studies and field trials have shown long-term stability of methoprene in the stored grains, not only at -20°C but even at room temperature (Miller, 1985, RM-316) (full report not provided).
The freezer storage stability of methoprene in hamburger, chicken, bread, apples and lettuce was studied at a spiked level of 1.0 mg/kg under frozen conditions (-15°C). The samples were fortified and stored for 7-24 days (full studies’ reports not available). The spiked samples were
Methoprene 760
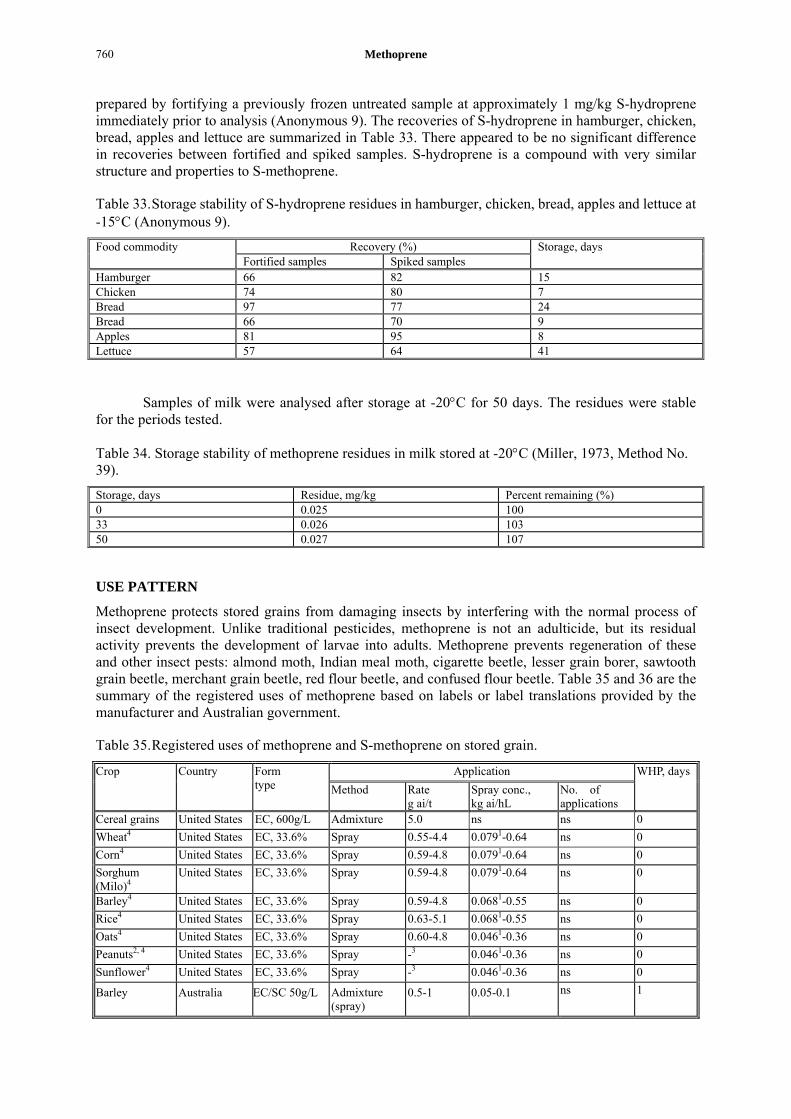
prepared by fortifying a previously frozen untreated sample at approximately 1 mg/kg S-hydroprene immediately prior to analysis (Anonymous 9). The recoveries of S-hydroprene in hamburger, chicken, bread, apples and lettuce are summarized in Table 33. There appeared to be no significant difference in recoveries between fortified and spiked samples. S-hydroprene is a compound with very similar structure and properties to S-methoprene.
Table 33. Storage stability of S-hydroprene residues in hamburger, chicken, bread, apples and lettuce at -15°C (Anonymous 9).
Recovery (%) Food commodity Fortified samples Spiked samples
Storage, days
Hamburger 66 82 15 Chicken 74 80 7 Bread 97 77 24 Bread 66 70 9 Apples 81 95 8 Lettuce 57 64 41
Samples of milk were analysed after storage at -20°C for 50 days. The residues were stable for the periods tested.
Table 34. Storage stability of methoprene residues in milk stored at -20°C (Miller, 1973, Method No. 39).
Storage, days Residue, mg/kg Percent remaining (%) 0 0.025 100 33 0.026 103 50 0.027 107
USE PATTERN
Methoprene protects stored grains from damaging insects by interfering with the normal process of insect development. Unlike traditional pesticides, methoprene is not an adulticide, but its residual activity prevents the development of larvae into adults. Methoprene prevents regeneration of these and other insect pests: almond moth, Indian meal moth, cigarette beetle, lesser grain borer, sawtooth grain beetle, merchant grain beetle, red flour beetle, and confused flour beetle. Table 35 and 36 are the summary of the registered uses of methoprene based on labels or label translations provided by the manufacturer and Australian government.
Table 35. Registered uses of methoprene and S-methoprene on stored grain.
Application Crop Country Form type Method Rate
g ai/t Spray conc., kg ai/hL
No. of applications
WHP, days
Cereal grains United States EC, 600g/L Admixture 5.0 ns ns 0 Wheat4 United States EC, 33.6% Spray 0.55-4.4 0.0791-0.64 ns 0 Corn4 United States EC, 33.6% Spray 0.59-4.8 0.0791-0.64 ns 0 Sorghum (Milo)4
United States EC, 33.6% Spray 0.59-4.8 0.0791-0.64 ns 0
Barley4 United States EC, 33.6% Spray 0.59-4.8 0.0681-0.55 ns 0 Rice4 United States EC, 33.6% Spray 0.63-5.1 0.0681-0.55 ns 0 Oats4 United States EC, 33.6% Spray 0.60-4.8 0.0461-0.36 ns 0 Peanuts2, 4 United States EC, 33.6% Spray -3 0.0461-0.36 ns 0 Sunflower4 United States EC, 33.6% Spray -3 0.0461-0.36 ns 0
Barley Australia EC/SC 50g/L Admixture (spray)
0.5-1 0.05-0.1 ns 1

methoprene 761
Application Crop Country Form type Method Rate
g ai/t Spray conc., kg ai/hL
No. of applications
WHP, days
Barley Australia EC/SC 200g/L Admixture (spray)
0.5-1 0.05-0.1 ns 1
Millets Australia EC/SC 50g/L Admixture (spray)
0.5-1 0.05-0.1 ns 1
Millet Australia EC/SC 200g/L Admixture (spray)
0.5-1 0.05-0.1 ns 1
Oats Australia EC/SC 50g/L Admixture (spray)
0.5-1 0.05-0.1 ns 1
Oats Australia EC/SC 200g/L Admixture (spray)
0.5-1 0.05-0.1 ns 1
Rice Australia EC/SC 50g/L Admixture (spray)
0.5-1 0.05-0.1 ns 1
Rice Australia EC/SC 200g/L Admixture (spray)
0.5-1 0.05-0.1 ns 1
Sorghum Australia EC/SC 50g/L Admixture (spray)
0.5-1 0.05-0.1 ns 1
Sorghum Australia EC/SC 200g/L Admixture (spray)
0.5-1 0.05-0.1 ns 1
Wheat Australia EC/SC 50g/L Admixture (spray)
0.5-1 0.05-0.1 ns 1
Wheat Australia EC/SC 200g/L Admixture (spray)
0.5-1 0.05-0.1 ns 1
Cereals4 Australia EC/SC 30g/L Admixture (spray)
0.6 0.06 ns 0
Cereals4 Australia EC/SC5 30g/L Admixture (spray)
0.6 0.06 ns 0
Cereals4 Australia EC/SC 300g/L Admixture (spray)
0.6 0.06 ns 0
1the lowest application rate for commodities stored ≤6 months. 2use water solution only. 3no bushel size data. 4S-methoprene. 5also contains 500g/L chlorpyrifos-methyl. ns: not stated. WHP: withholding period.
Table 36. Registered uses of S-methoprene on animals with feed through.
Application Animal Country Form Method Rate
WHP slaughter or milk, days
Beef and dairy cattle USA Cattle Custom Blending Premix, 10.5%
Oral dose 0.017-0.033 mg/kg bw. day 0
Beef and dairy cattle USA IGR Custom, 2% Oral dose 0.025 mg/kg bw. day 0 Beef and dairy cattle USA IGR 2%
Manufacturing Use Product
Oral dose 0.025 mg/kg bw. day 0
Beef and dairy cattle USA Cattle Concentrate, 0.4%
Oral dose 0.017-0.033 mg/kg bw. day 0
Beef cattle USA Cattle Mineral 8 AFC, 0.005%
Oral dose 0.025 mg/kg bw. day 0
Beef and dairy cattle USA IGR Mineral, 0.01%
Oral dose 0.025 mg/kg bw. day 0
Cattle USA Mineral Block, 0.02%
Oral dose 0.017-0.033 mg/kg bw. day 0
WHP: withholding period.
Methoprene 762
RESIDUES RESULTING FROM SUPERVISED TRIALS
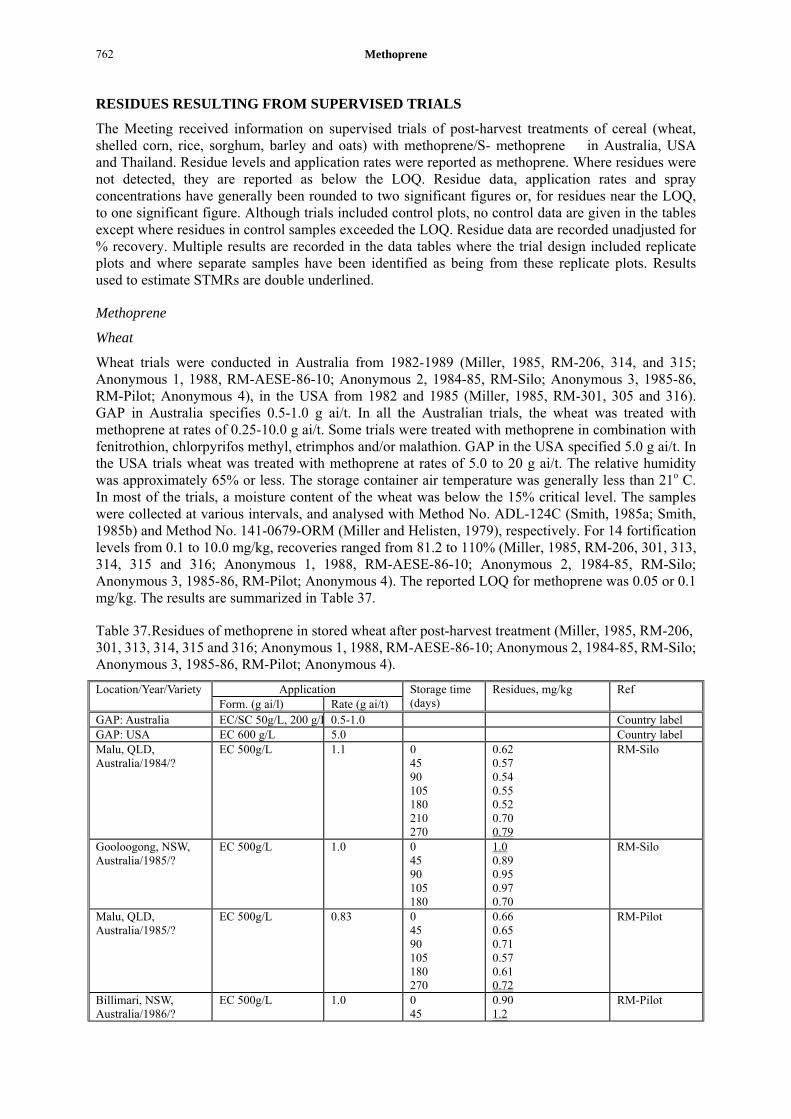
The Meeting received information on supervised trials of post-harvest treatments of cereal (wheat, shelled corn, rice, sorghum, barley and oats) with methoprene/S- methoprene in Australia, USA and Thailand. Residue levels and application rates were reported as methoprene. Where residues were not detected, they are reported as below the LOQ. Residue data, application rates and spray concentrations have generally been rounded to two significant figures or, for residues near the LOQ, to one significant figure. Although trials included control plots, no control data are given in the tables except where residues in control samples exceeded the LOQ. Residue data are recorded unadjusted for % recovery. Multiple results are recorded in the data tables where the trial design included replicate plots and where separate samples have been identified as being from these replicate plots. Results used to estimate STMRs are double underlined.
Methoprene
Wheat
Wheat trials were conducted in Australia from 1982-1989 (Miller, 1985, RM-206, 314, and 315; Anonymous 1, 1988, RM-AESE-86-10; Anonymous 2, 1984-85, RM-Silo; Anonymous 3, 1985-86, RM-Pilot; Anonymous 4), in the USA from 1982 and 1985 (Miller, 1985, RM-301, 305 and 316). GAP in Australia specifies 0.5-1.0 g ai/t. In all the Australian trials, the wheat was treated with methoprene at rates of 0.25-10.0 g ai/t. Some trials were treated with methoprene in combination with fenitrothion, chlorpyrifos methyl, etrimphos and/or malathion. GAP in the USA specified 5.0 g ai/t. In the USA trials wheat was treated with methoprene at rates of 5.0 to 20 g ai/t. The relative humidity was approximately 65% or less. The storage container air temperature was generally less than 21o C. In most of the trials, a moisture content of the wheat was below the 15% critical level. The samples were collected at various intervals, and analysed with Method No. ADL-124C (Smith, 1985a; Smith, 1985b) and Method No. 141-0679-ORM (Miller and Helisten, 1979), respectively. For 14 fortification levels from 0.1 to 10.0 mg/kg, recoveries ranged from 81.2 to 110% (Miller, 1985, RM-206, 301, 313, 314, 315 and 316; Anonymous 1, 1988, RM-AESE-86-10; Anonymous 2, 1984-85, RM-Silo; Anonymous 3, 1985-86, RM-Pilot; Anonymous 4). The reported LOQ for methoprene was 0.05 or 0.1 mg/kg. The results are summarized in Table 37.
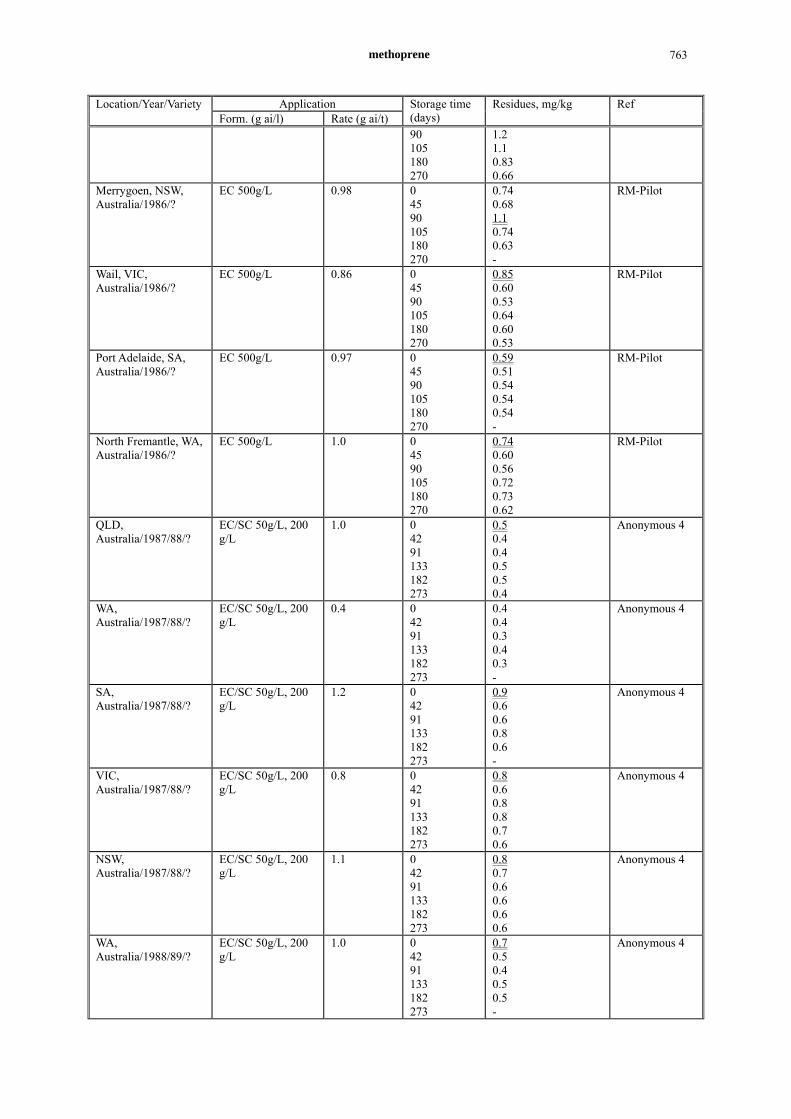
Table 37. Residues of methoprene in stored wheat after post-harvest treatment (Miller, 1985, RM-206, 301, 313, 314, 315 and 316; Anonymous 1, 1988, RM-AESE-86-10; Anonymous 2, 1984-85, RM-Silo; Anonymous 3, 1985-86, RM-Pilot; Anonymous 4).
Application Location/Year/Variety Form. (g ai/l) Rate (g ai/t)
Storage time (days)
Residues, mg/kg Ref
GAP: Australia EC/SC 50g/L, 200 g/L 0.5-1.0 Country label GAP: USA EC 600 g/L 5.0 Country label Malu, QLD, Australia/1984/?
EC 500g/L 1.1 0 45 90 105 180 210 270
0.62 0.57 0.54 0.55 0.52 0.70 0.79
RM-Silo
Gooloogong, NSW, Australia/1985/?
EC 500g/L 1.0 0 45 90 105 180
1.0 0.89 0.95 0.97 0.70
RM-Silo
Malu, QLD, Australia/1985/?
EC 500g/L 0.83 0 45 90 105 180 270
0.66 0.65 0.71 0.57 0.61 0.72
RM-Pilot
Billimari, NSW, Australia/1986/?
EC 500g/L 1.0 0 45
0.90 1.2
RM-Pilot
methoprene 763
Application Location/Year/Variety Form. (g ai/l) Rate (g ai/t)
Storage time (days)
Residues, mg/kg Ref
90 105 180 270
1.2 1.1 0.83 0.66
Merrygoen, NSW, Australia/1986/?
EC 500g/L 0.98 0 45 90 105 180 270
0.74 0.68 1.1 0.74 0.63 -
RM-Pilot
Wail, VIC, Australia/1986/?
EC 500g/L 0.86 0 45 90 105 180 270
0.85 0.60 0.53 0.64 0.60 0.53
RM-Pilot
Port Adelaide, SA, Australia/1986/?
EC 500g/L 0.97 0 45 90 105 180 270
0.59 0.51 0.54 0.54 0.54 -
RM-Pilot
North Fremantle, WA, Australia/1986/?
EC 500g/L 1.0 0 45 90 105 180 270
0.74 0.60 0.56 0.72 0.73 0.62
RM-Pilot
QLD, Australia/1987/88/?
EC/SC 50g/L, 200 g/L
1.0 0 42 91 133 182 273
0.5 0.4 0.4 0.5 0.5 0.4
Anonymous 4
WA, Australia/1987/88/?
EC/SC 50g/L, 200 g/L
0.4 0 42 91 133 182 273
0.4 0.4 0.3 0.4 0.3 -
Anonymous 4
SA, Australia/1987/88/?
EC/SC 50g/L, 200 g/L
1.2 0 42 91 133 182 273
0.9 0.6 0.6 0.8 0.6 -
Anonymous 4
VIC, Australia/1987/88/?
EC/SC 50g/L, 200 g/L
0.8 0 42 91 133 182 273
0.8 0.6 0.8 0.8 0.7 0.6
Anonymous 4
NSW, Australia/1987/88/?
EC/SC 50g/L, 200 g/L
1.1 0 42 91 133 182 273
0.8 0.7 0.6 0.6 0.6 0.6
Anonymous 4
WA, Australia/1988/89/?
EC/SC 50g/L, 200 g/L
1.0 0 42 91 133 182 273
0.7 0.5 0.4 0.5 0.5 -
Anonymous 4
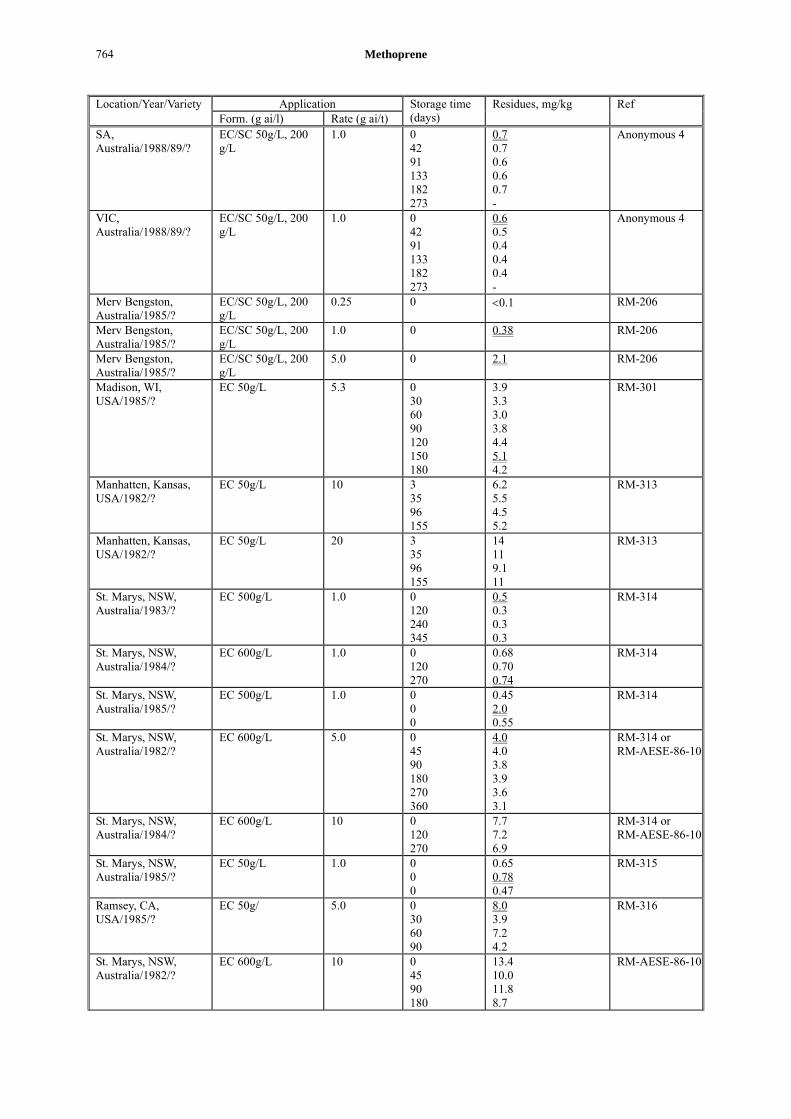
Methoprene 764
Application Location/Year/Variety Form. (g ai/l) Rate (g ai/t)
Storage time (days)
Residues, mg/kg Ref
SA, Australia/1988/89/?
EC/SC 50g/L, 200 g/L
1.0 0 42 91 133 182 273
0.7 0.7 0.6 0.6 0.7 -
Anonymous 4
VIC, Australia/1988/89/?
EC/SC 50g/L, 200 g/L
1.0 0 42 91 133 182 273
0.6 0.5 0.4 0.4 0.4 -
Anonymous 4
Merv Bengston, Australia/1985/?
EC/SC 50g/L, 200 g/L
0.25 0 <0.1 RM-206
Merv Bengston, Australia/1985/?
EC/SC 50g/L, 200 g/L
1.0 0 0.38 RM-206
Merv Bengston, Australia/1985/?
EC/SC 50g/L, 200 g/L
5.0 0 2.1 RM-206
Madison, WI, USA/1985/?
EC 50g/L 5.3 0 30 60 90 120 150 180
3.9 3.3 3.0 3.8 4.4 5.1 4.2
RM-301
Manhatten, Kansas, USA/1982/?
EC 50g/L 10 3 35 96 155
6.2 5.5 4.5 5.2
RM-313
Manhatten, Kansas, USA/1982/?
EC 50g/L 20 3 35 96 155
14 11 9.1 11
RM-313
St. Marys, NSW, Australia/1983/?
EC 500g/L 1.0 0 120 240 345
0.5 0.3 0.3 0.3
RM-314
St. Marys, NSW, Australia/1984/?
EC 600g/L 1.0 0 120 270
0.68 0.70 0.74
RM-314
St. Marys, NSW, Australia/1985/?
EC 500g/L 1.0 0 0 0
0.45 2.0 0.55
RM-314
St. Marys, NSW, Australia/1982/?
EC 600g/L 5.0 0 45 90 180 270 360
4.0 4.0 3.8 3.9 3.6 3.1
RM-314 or RM-AESE-86-10
St. Marys, NSW, Australia/1984/?
EC 600g/L 10 0 120 270
7.7 7.2 6.9
RM-314 or RM-AESE-86-10
St. Marys, NSW, Australia/1985/?
EC 50g/L 1.0 0 0 0
0.65 0.78 0.47
RM-315
Ramsey, CA, USA/1985/?
EC 50g/ 5.0 0 30 60 90
8.0 3.9 7.2 4.2
RM-316
St. Marys, NSW, Australia/1982/?
EC 600g/L 10 0 45 90 180
13.4 10.0 11.8 8.7
RM-AESE-86-10
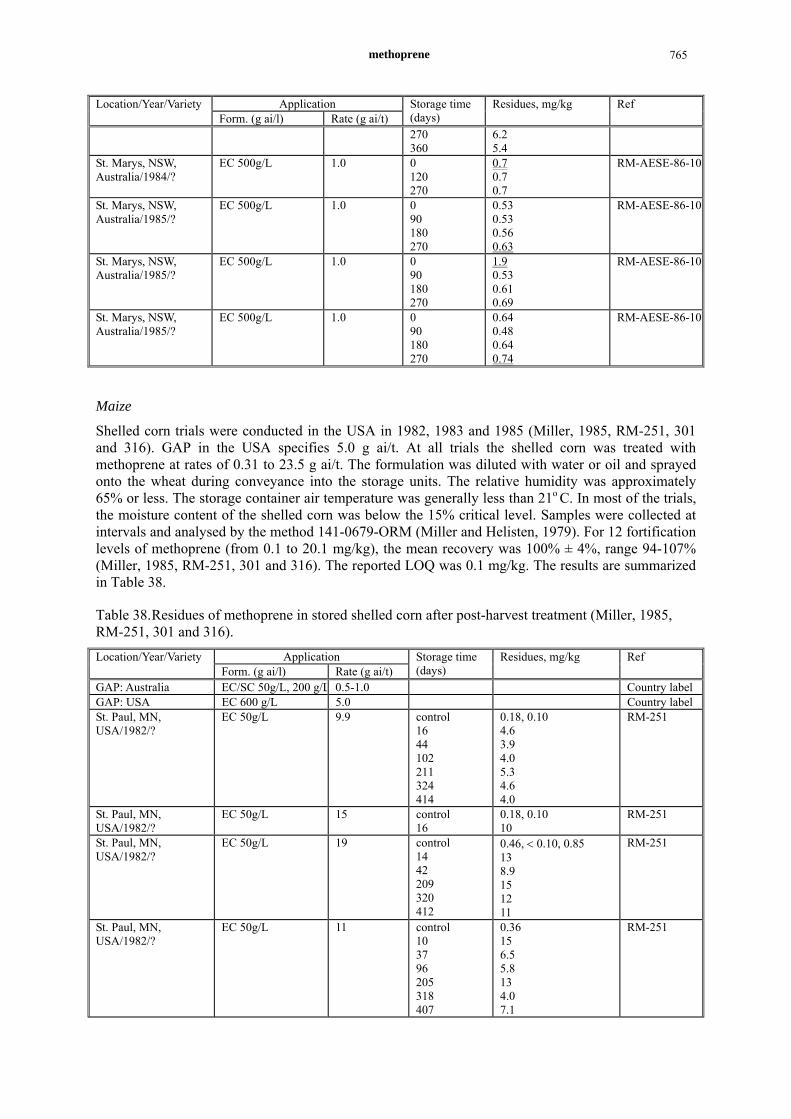
methoprene 765
Application Location/Year/Variety Form. (g ai/l) Rate (g ai/t)
Storage time (days)
Residues, mg/kg Ref
270 360
6.2 5.4
St. Marys, NSW, Australia/1984/?
EC 500g/L 1.0 0 120 270
0.7 0.7 0.7
RM-AESE-86-10
St. Marys, NSW, Australia/1985/?
EC 500g/L 1.0 0 90 180 270
0.53 0.53 0.56 0.63
RM-AESE-86-10
St. Marys, NSW, Australia/1985/?
EC 500g/L 1.0 0 90 180 270
1.9 0.53 0.61 0.69
RM-AESE-86-10
St. Marys, NSW, Australia/1985/?
EC 500g/L 1.0 0 90 180 270
0.64 0.48 0.64 0.74
RM-AESE-86-10
Maize
Shelled corn trials were conducted in the USA in 1982, 1983 and 1985 (Miller, 1985, RM-251, 301 and 316). GAP in the USA specifies 5.0 g ai/t. At all trials the shelled corn was treated with methoprene at rates of 0.31 to 23.5 g ai/t. The formulation was diluted with water or oil and sprayed onto the wheat during conveyance into the storage units. The relative humidity was approximately 65% or less. The storage container air temperature was generally less than 21o C. In most of the trials, the moisture content of the shelled corn was below the 15% critical level. Samples were collected at intervals and analysed by the method 141-0679-ORM (Miller and Helisten, 1979). For 12 fortification levels of methoprene (from 0.1 to 20.1 mg/kg), the mean recovery was 100% ± 4%, range 94-107% (Miller, 1985, RM-251, 301 and 316). The reported LOQ was 0.1 mg/kg. The results are summarized in Table 38.
Table 38. Residues of methoprene in stored shelled corn after post-harvest treatment (Miller, 1985, RM-251, 301 and 316).
Application Location/Year/Variety Form. (g ai/l) Rate (g ai/t)
Storage time (days)
Residues, mg/kg Ref
GAP: Australia EC/SC 50g/L, 200 g/L 0.5-1.0 Country label GAP: USA EC 600 g/L 5.0 Country label St. Paul, MN, USA/1982/?
EC 50g/L 9.9 control 16 44 102 211 324 414
0.18, 0.10 4.6 3.9 4.0 5.3 4.6 4.0
RM-251
St. Paul, MN, USA/1982/?
EC 50g/L 15 control 16
0.18, 0.10 10
RM-251
St. Paul, MN, USA/1982/?
EC 50g/L 19 control 14 42 209 320 412
0.46, < 0.10, 0.85 13 8.9 15 12 11
RM-251
St. Paul, MN, USA/1982/?
EC 50g/L 11 control 10 37 96 205 318 407
0.36 15 6.5 5.8 13 4.0 7.1
RM-251
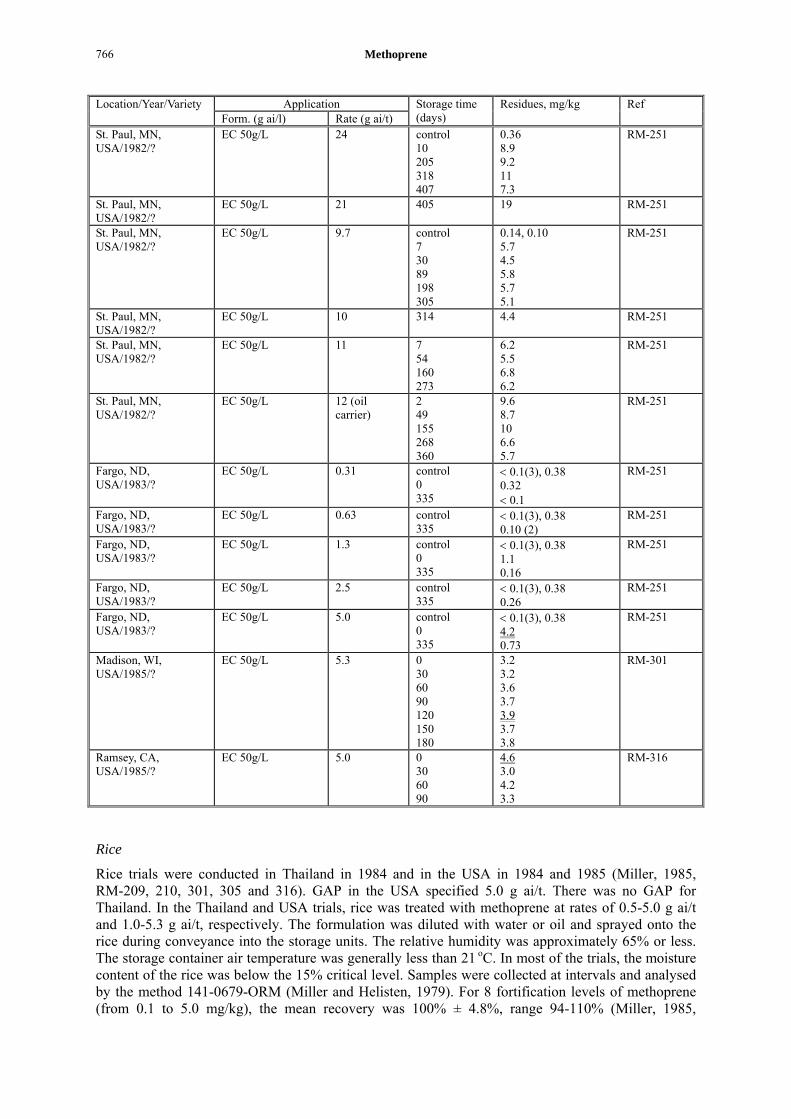
Methoprene 766
Application Location/Year/Variety Form. (g ai/l) Rate (g ai/t)
Storage time (days)
Residues, mg/kg Ref
St. Paul, MN, USA/1982/?
EC 50g/L 24 control 10 205 318 407
0.36 8.9 9.2 11 7.3
RM-251
St. Paul, MN, USA/1982/?
EC 50g/L 21 405 19 RM-251
St. Paul, MN, USA/1982/?
EC 50g/L 9.7 control 7 30 89 198 305
0.14, 0.10 5.7 4.5 5.8 5.7 5.1
RM-251
St. Paul, MN, USA/1982/?
EC 50g/L 10 314 4.4 RM-251
St. Paul, MN, USA/1982/?
EC 50g/L 11 7 54 160 273
6.2 5.5 6.8 6.2
RM-251
St. Paul, MN, USA/1982/?
EC 50g/L 12 (oil carrier)
2 49 155 268 360
9.6 8.7 10 6.6 5.7
RM-251
Fargo, ND, USA/1983/?
EC 50g/L 0.31 control 0 335
< 0.1(3), 0.38 0.32 < 0.1
RM-251
Fargo, ND, USA/1983/?
EC 50g/L 0.63 control 335
< 0.1(3), 0.38 0.10 (2)
RM-251
Fargo, ND, USA/1983/?
EC 50g/L 1.3 control 0 335
< 0.1(3), 0.38 1.1 0.16
RM-251
Fargo, ND, USA/1983/?
EC 50g/L 2.5 control 335
< 0.1(3), 0.38 0.26
RM-251
Fargo, ND, USA/1983/?
EC 50g/L 5.0 control 0 335
< 0.1(3), 0.38 4.2 0.73
RM-251
Madison, WI, USA/1985/?
EC 50g/L 5.3 0 30 60 90 120 150 180
3.2 3.2 3.6 3.7 3.9 3.7 3.8
RM-301
Ramsey, CA, USA/1985/?
EC 50g/L 5.0 0 30 60 90
4.6 3.0 4.2 3.3
RM-316
Rice
Rice trials were conducted in Thailand in 1984 and in the USA in 1984 and 1985 (Miller, 1985, RM-209, 210, 301, 305 and 316). GAP in the USA specified 5.0 g ai/t. There was no GAP for Thailand. In the Thailand and USA trials, rice was treated with methoprene at rates of 0.5-5.0 g ai/t and 1.0-5.3 g ai/t, respectively. The formulation was diluted with water or oil and sprayed onto the rice during conveyance into the storage units. The relative humidity was approximately 65% or less. The storage container air temperature was generally less than 21 oC. In most of the trials, the moisture content of the rice was below the 15% critical level. Samples were collected at intervals and analysed by the method 141-0679-ORM (Miller and Helisten, 1979). For 8 fortification levels of methoprene (from 0.1 to 5.0 mg/kg), the mean recovery was 100% ± 4.8%, range 94-110% (Miller, 1985,

methoprene 767
RM-209, 210, 301, 305 and 316). The reported LOQ was 0.1 mg/kg. The results are summarized in Table 39.
Table 39. Residues of methoprene in stored rice after post-harvest treatment (Miller, 1985, RM-209, 210, 301, 305 and 316).
Application Location/Year/Variety Form. (g ai/l) Rate (g ai/t)
Storage time (days)
Residues, mg/kg Ref
GAP: Thailand None(use USA GAP) GAP: USA EC 600 g/L 5.0 Country label
0.5 83 0.15 1.0 83 0.66, < 0.1 2.0 83 1.7
Kitty Rice Facility, Bangkok, Thailand/ 1984/?
EC 50g/L
5.0 83 2.9
RM-209
Pleasant Grove, CA, USA/1984/?
EC 50g/L 1.0-1.2 0 0.39 RM-210
Madison, WI, USA/1985/?
EC 50g/L 5.3 0 30 60 90 120 150 180
4.6 3.6 3.3 4.3 3.9 5.0 6.8
RM-301
Williams, CA, USA/1985/?
EC 50g/L 1.0 132 0.42 RM-305
Ramsey, CA, USA/1985/?
EC 50g/L 5.0 (ULV in oil) 0 30 60 90
6.5 3.1 8.1 4.0
RM-316
Sorghum
Sorghum trials were conducted in Australia in 1985 and in the USA in 1984 and 1985 (Miller, 1985, RM-301 and RM-316; Anonymous 1, 1988, RM-AESE-86-10). GAP in Australia specifies 0.5-1.0 g ai/t; in the USA, 5.0 g ai/t. In the trial data from Australia and the USA, sorghum was treated with methoprene at a rate of 1.0 g ai/t and 5.0 g ai/t, respectively. The formulation was diluted with water or oil and sprayed onto the sorghum grain during conveyance into the storage units. Two trials in Australia were treated with methoprene in combination with chlorpyrifos methyl (10 g ai/t) and etrimphos (8.0 g ai/t), respectively. The relative humidity was generally 65% or less. The storage container air temperature was approximately 21 o
C during the trial period. In most of the trials, the moisture content of the rice was below the 15% critical level. Samples were collected at intervals and analysed by the method 141-0679-ORM (Miller and Helisten, 1979) and Method ADL-124C (Smith, 1985a). For 5 fortification levels (from 0.1 to 5.0 mg/kg), the mean recovery was 100% ± 3.9%, range 94-104% (Miller, 1985, RM-301 and RM-316). The reported LOQ for methoprene was 0.1 mg/kg (Miller and Helisten, 1979). The overall recovery from fortification ranging from 0.1 to 1.0 mg/kg was 85.6% ± 3.2%, n=7 for wheat (Smith, 1985a). The reported LOQ for methoprene was 0.05 mg/kg. The results are summarized in Table 40.
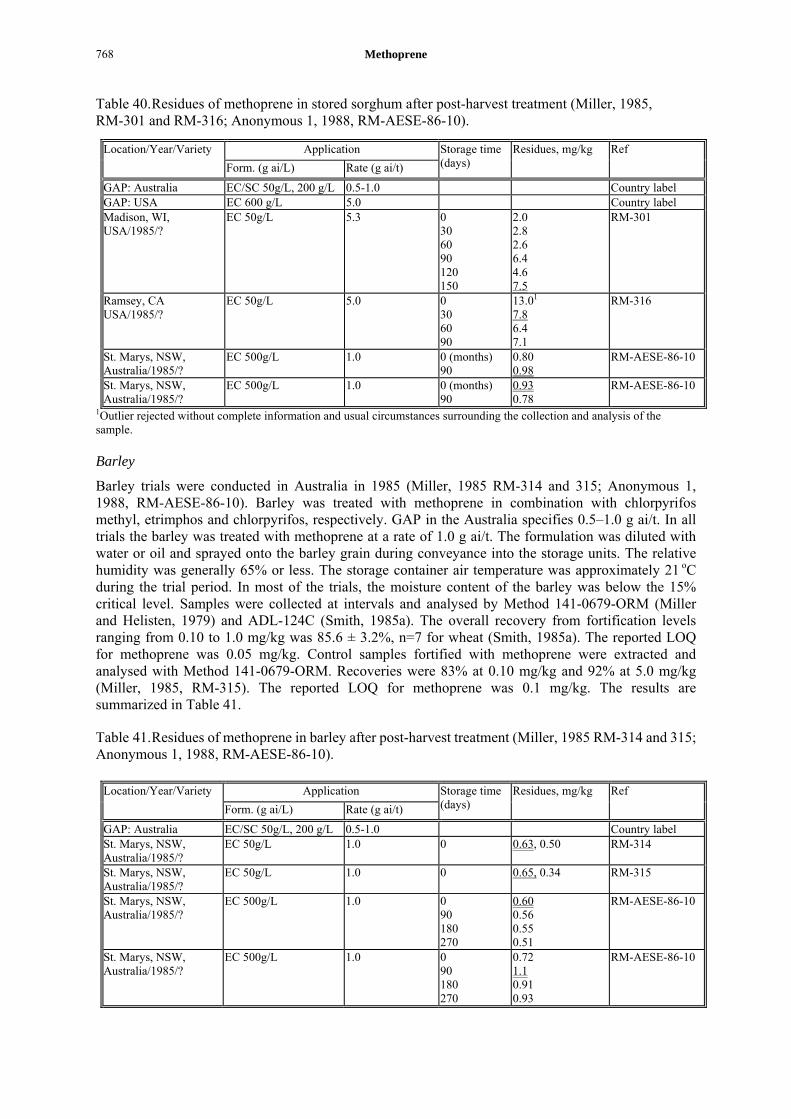
Methoprene 768
Table 40. Residues of methoprene in stored sorghum after post-harvest treatment (Miller, 1985, RM-301 and RM-316; Anonymous 1, 1988, RM-AESE-86-10).
Application Location/Year/Variety Form. (g ai/L) Rate (g ai/t)
Storage time (days)
Residues, mg/kg Ref
GAP: Australia EC/SC 50g/L, 200 g/L 0.5-1.0 Country label GAP: USA EC 600 g/L 5.0 Country label
1Outlier rejected without complete information and usual circumstances surrounding the collection and analysis of the sample.
Barley
Barley trials were conducted in Australia in 1985 (Miller, 1985 RM-314 and 315; Anonymous 1, 1988, RM-AESE-86-10). Barley was treated with methoprene in combination with chlorpyrifos methyl, etrimphos and chlorpyrifos, respectively. GAP in the Australia specifies 0.5–1.0 g ai/t. In all trials the barley was treated with methoprene at a rate of 1.0 g ai/t. The formulation was diluted with water or oil and sprayed onto the barley grain during conveyance into the storage units. The relative humidity was generally 65% or less. The storage container air temperature was approximately 21 oC during the trial period. In most of the trials, the moisture content of the barley was below the 15% critical level. Samples were collected at intervals and analysed by Method 141-0679-ORM (Miller and Helisten, 1979) and ADL-124C (Smith, 1985a). The overall recovery from fortification levels ranging from 0.10 to 1.0 mg/kg was 85.6 ± 3.2%, n=7 for wheat (Smith, 1985a). The reported LOQ for methoprene was 0.05 mg/kg. Control samples fortified with methoprene were extracted and analysed with Method 141-0679-ORM. Recoveries were 83% at 0.10 mg/kg and 92% at 5.0 mg/kg (Miller, 1985, RM-315). The reported LOQ for methoprene was 0.1 mg/kg. The results are summarized in Table 41.
Table 41. Residues of methoprene in barley after post-harvest treatment (Miller, 1985 RM-314 and 315; Anonymous 1, 1988, RM-AESE-86-10).
Madison, WI, USA/1985/?
EC 50g/L 5.3 0 30 60 90 120
2.0 2.8 2.6 6.4 4.6 7.5
RM-301
150 13.01
7.8 6.4
Ramsey, CA USA/1985/?
EC 50g/L 5.0 0 30 60
7.1
RM-316
90 St. Marys, NSW, Australia/1985/?
EC 500g/L 1.0 0 (months) 0.80 0.98
RM-AESE-86-10 90
St. Marys, NSW, Australia/1985/?
EC 500g/L 1.0 0 (months) 0.93 0.78
RM-AESE-86-10 90
Application Location/Year/Variety Form. (g ai/L) Rate (g ai/t)
Storage time (days)
Residues, mg/kg Ref
GAP: Australia EC/SC 50g/L, 200 g/L 0.5-1.0 Country label St. Marys, NSW, Australia/1985/?
EC 50g/L 1.0 0 0.63, 0.50 RM-314
St. Marys, NSW, Australia/1985/?
EC 50g/L 1.0 0 0.65, 0.34 RM-315
St. Marys, NSW, Australia/1985/?
EC 500g/L 1.0 0 90 180
0.60 0.56 0.55 0.51
RM-AESE-86-10
270 St. Marys, NSW, Australia/1985/?
EC 500g/L 1.0 0 90 180
0.72 1.1 0.91
270 0.93
RM-AESE-86-10

methoprene 769
Oats
Oat trials were conducted in Australia in 1985 (Miller, 1985, RM-314 and 315; Anonymous 1, 1988, RM-AESE-86-10). GAP in Australia specifies 0.5-1.0 g ai/t. Oats were treated with methoprene in combination with chlorpyrifos methyl, etrimphos and chlorpyrifos, respectively. In all trials oats were treated with methoprene at a rate of 1.0 g ai/t. The formulation was diluted with water or oil and sprayed onto the oats during conveyance into the storage units. The relative humidity was generally 65% or less. The storage container air temperature was approximately 21 oC during the trial period. In most of the trials, the moisture content of the oats was below the 15% critical level. Samples were collected at intervals and analysed by the method 141-0679-ORM (Miller and Helisten, 1979) and ADL-124C (Smith, 1985a). The overall recovery from fortification levels ranging from 0.10 to 1.0 mg/kg was 85.6 ± 3.2%, n=7 for wheat (Smith, 1985, Report No. 66/85). The reported LOQ for methoprene was 0.05 mg/kg. Control samples fortified with methoprene were extracted and analysed with Method 141-0679-ORM. Recoveries were 70% at 0.10 mg/kg and106% at 5.0 mg/kg (Miller, 1985, RM-315). The reported LOQ for methoprene was 0.1 mg/kg. The results are summarized in Table 42.
Table 42. Residues of methoprene in whole oats grain after post-harvest treatment (Miller, 1985, RM-314 and 315; Anonymous 1, 1988, RM-AESE-86-10).
Application Location/Year/Variety Form. (g ai/L) Rate (g ai/t)
Storage time (days)
Residues, mg/kg Ref
GAP: Australia EC/SC 50g/L, 200 g/L 0.5-1.0 Country label St. Marys, NSW, Australia/1985/?
EC 50g/L 1.0 0 0.96, 0.65 RM-314
St. Marys, NSW, Australia/1985/?
EC 50g/L 1.0 0 0.77, 0.51 RM-315
St. Marys, NSW, Australia/1985/?
EC 500g/L 1.0 0 90 180
1.0 0.58 0.65 0.94
RM-AESE-86-10
270 St. Marys, NSW, Australia/1985/?
EC 500g/L 1.0 0 90 180
0.74 0.53 0.96
270 1.0
RM-AESE-86-10
S-methoprene
Silo scale trials were conducted in Australia in 1986 and 1987 (Anonymous 4) and in the USA in 1985 (Miller, 1985, RM-317). Laboratory studies simulating commercial practice were performed in USA in 2003 (Van Gundy, 2003, Study 3040). GAP in Australia specifies 0.6g ai/t. In two Australian trials wheat was treated at rates of 0.51–0.59 g ai/t in combination with fenitrothion (12 g ai/t) in 1986 and 1987 (full report not provided). GAP in the USA specifies 0.60-5.0 g ai/t. In the first study, wheat was treated using an acetone carrier in 1985 (Miller, 1985, RM-317) at a rate of 2.5 mg/kg. In the second study, wheat was sprayed using a lab modified air brush capable of applying low volumes of the correct dilution of the 33.6% EC (Van Gundy, 2003, Study 3040). The replicate samples were sprayed separately and placed in labelled glass container at either 27 oC or 32 oC. The wheat samples were collected at various intervals, and analysed with the method in Study 3040 (Moorman and Witte, 2003, Study 3040), AWB Method No P07 (AWB Hygiene Laboratory, 1989) and Method No. 141-0679-ORM (Miller and Helisten, 1979), respectively. For 7 fortification levels (from 0.1 to 1.1 mg/kg), the mean recovery was 95% ± 9%, range 79-102% (Miller, 1985, RM-317; Van Gundy, 2003, Study 3040; and Anonymous 4). The reported LOQ with Method No. 141-0679-ORM and AWB Method No P07 (Anonymous 4) was 0.1 mg/kg. The LOQ with the method in Study 3040 (Van Gundy, 2003, Study 3040) was 0.008 mg/kg. Results are shown in Table 43.

Methoprene 770
Table 43. Residues of methoprene in stored wheat after post-harvest treatment with S-methoprene (Miller, 1985, RM-317; Van Gundy, 2003, Study 3040; and Anonymous 4).
Application Location/Year/Variety Form. (g ai/L) Rate (g ai/t)
Storage time (days)
Residues, mg/kg Ref
GAP: Australia EC/SC 30 g/L, 300 g/L
0.60 Country label
GAP: USA EC, 33.6% 0.60-5.0 Country label NSW, Australia/1986/?
EC/SC 30g/L, 300 g/L
0.59 0 42 91 133 182 273
0.54 0.35 0.26 0.22 0.27 0.24
Anonymous 4
WA, Australia/1986/? EC/SC 30g/L, 300 g/L
0.51 0 42 91 133 182 273
0.33 0.31 0.21 0.26 0.22 0.20
Anonymous 4
Manhattan, KS, USA/1985/Newton
Acetone carrier 2.5 37 2.8 RM-317
Dallas, TX, USA/2003/?
EC, 33.6% 0.50 0 90 180 270 360 450
0.52 0.39 0.19 0.23 0.19 0.25
Study 3040 (27℃)
Dallas, TX, USA/2003/?
EC, 33.6% 0.50 0 90 180 270 360 450
0.54 0.33 0.20 0.21 0.30 0.27
Study 3040 (32℃)
Dallas, TX, USA/2003/?
EC, 33.6% 1.2 0 90 180 270 360 450
0.86 0.51 0.34 0.39 0.48 0.47
Study 3040 (27℃)
Dallas, TX, USA/2003/?
EC, 33.6% 1.2 0 90 180 270 360 450
0.88 0.66 0.36 0.34 0.47 0.48
Study 3040 (32℃)
FATE OF RESIDUES IN STORAGE AND PROCESSING
The meeting received information on the fate of methoprene residues during simulated processing of stored wheat (milling), stored rice (polishing and cooking) and stored corn (extraction and refinement of maize oil).
Fate in processing
Effect of milling and baking on residues in stored wheat
Processing studies were performed in Australia in 1988 and 1989 on milling products generated from wheat that was involved post-harvest treatment with methoprene (Anonymous 4). In the first study, 200 tonnes of Australian Standard White (ASW) wheat were treated at Billimari on 25th March 1988 with 1.25 g ai/t methoprene and 11 g ai/t chlorpyrifos methyl; and a trial milling took place at the BRI (Bread Research Institute of Australia) in May and June 1988 (processing time not stated). In a second study, a commercial milling trial involving participation by two flour mills and the pilot mill was set
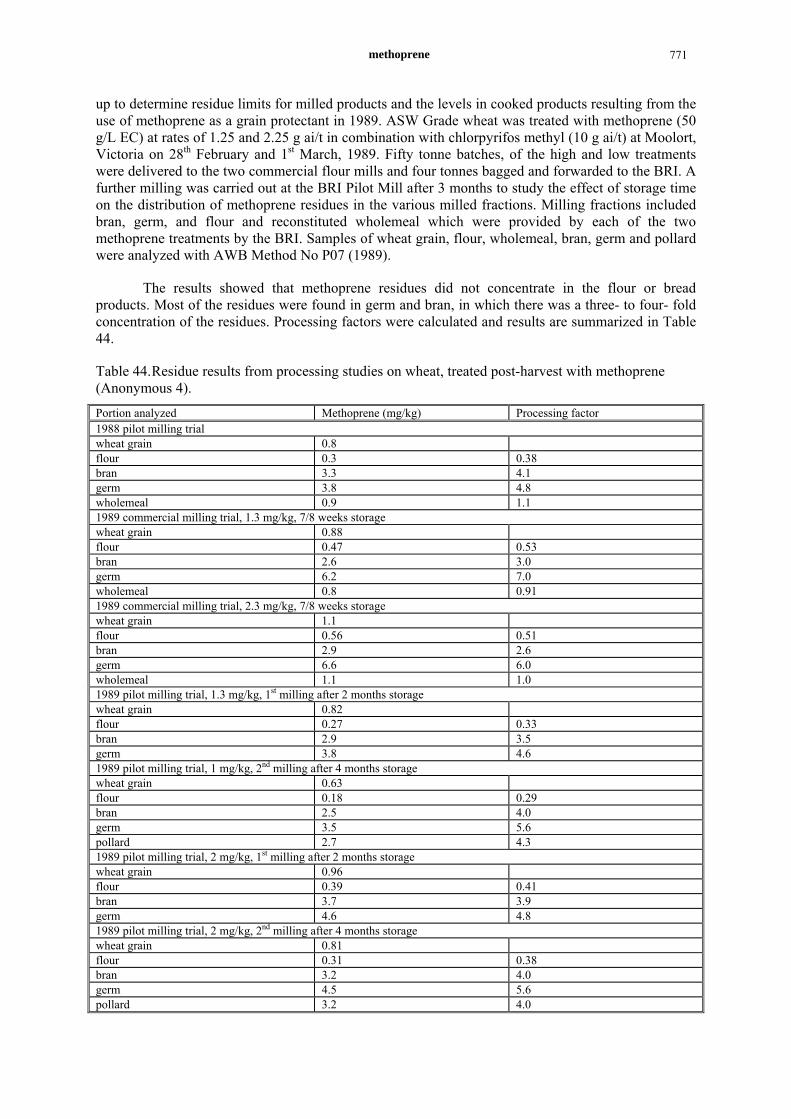
methoprene 771
up to determine residue limits for milled products and the levels in cooked products resulting from the use of methoprene as a grain protectant in 1989. ASW Grade wheat was treated with methoprene (50 g/L EC) at rates of 1.25 and 2.25 g ai/t in combination with chlorpyrifos methyl (10 g ai/t) at Moolort, Victoria on 28th February and 1st March, 1989. Fifty tonne batches, of the high and low treatments were delivered to the two commercial flour mills and four tonnes bagged and forwarded to the BRI. A further milling was carried out at the BRI Pilot Mill after 3 months to study the effect of storage time on the distribution of methoprene residues in the various milled fractions. Milling fractions included bran, germ, and flour and reconstituted wholemeal which were provided by each of the two methoprene treatments by the BRI. Samples of wheat grain, flour, wholemeal, bran, germ and pollard were analyzed with AWB Method No P07 (1989).
The results showed that methoprene residues did not concentrate in the flour or bread products. Most of the residues were found in germ and bran, in which there was a three- to four- fold concentration of the residues. Processing factors were calculated and results are summarized in Table 44.
Table 44. Residue results from processing studies on wheat, treated post-harvest with methoprene (Anonymous 4).
Portion analyzed Methoprene (mg/kg) Processing factor 1988 pilot milling trial wheat grain 0.8 flour 0.3 0.38 bran 3.3 4.1 germ 3.8 4.8 wholemeal 0.9 1.1 1989 commercial milling trial, 1.3 mg/kg, 7/8 weeks storage wheat grain 0.88 flour 0.47 0.53 bran 2.6 3.0 germ 6.2 7.0 wholemeal 0.8 0.91 1989 commercial milling trial, 2.3 mg/kg, 7/8 weeks storage wheat grain 1.1 flour 0.56 0.51 bran 2.9 2.6 germ 6.6 6.0 wholemeal 1.1 1.0 1989 pilot milling trial, 1.3 mg/kg, 1st milling after 2 months storage wheat grain 0.82 flour 0.27 0.33 bran 2.9 3.5 germ 3.8 4.6 1989 pilot milling trial, 1 mg/kg, 2nd milling after 4 months storage wheat grain 0.63 flour 0.18 0.29 bran 2.5 4.0 germ 3.5 5.6 pollard 2.7 4.3 1989 pilot milling trial, 2 mg/kg, 1st milling after 2 months storage wheat grain 0.96 flour 0.39 0.41 bran 3.7 3.9 germ 4.6 4.8 1989 pilot milling trial, 2 mg/kg, 2nd milling after 4 months storage wheat grain 0.81 flour 0.31 0.38 bran 3.2 4.0 germ 4.5 5.6 pollard 3.2 4.0
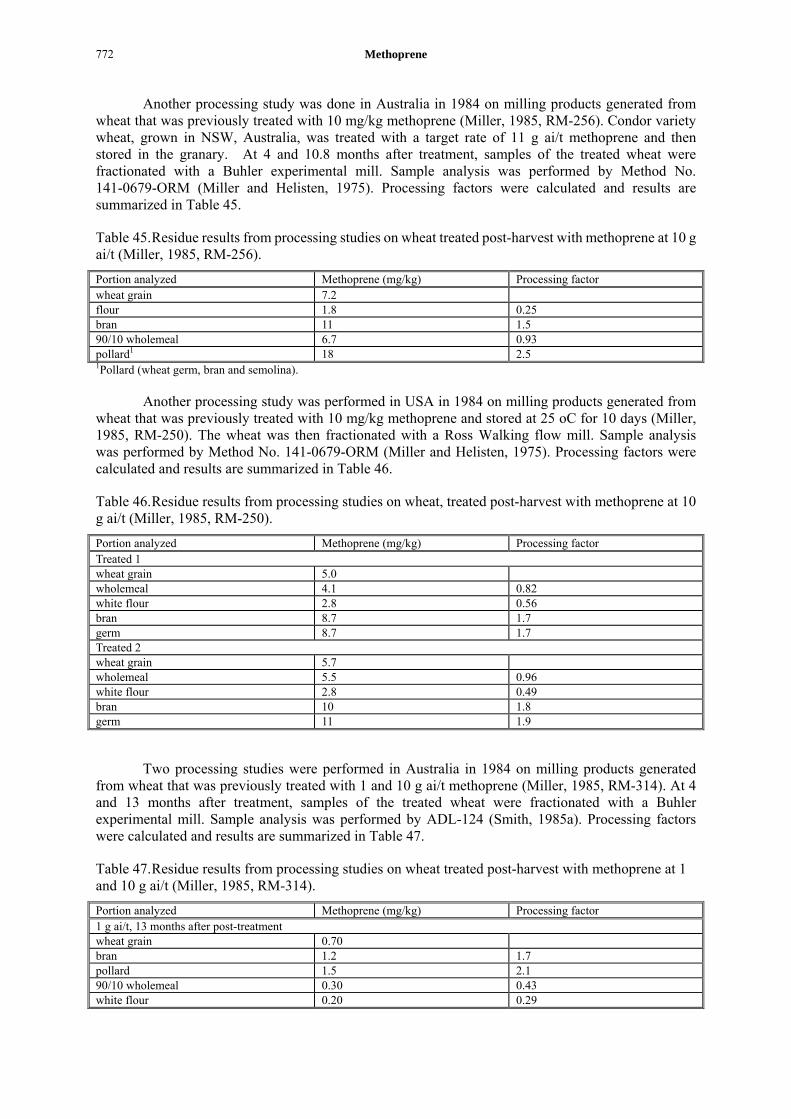
Methoprene 772
Another processing study was done in Australia in 1984 on milling products generated from wheat that was previously treated with 10 mg/kg methoprene (Miller, 1985, RM-256). Condor variety wheat, grown in NSW, Australia, was treated with a target rate of 11 g ai/t methoprene and then stored in the granary. At 4 and 10.8 months after treatment, samples of the treated wheat were fractionated with a Buhler experimental mill. Sample analysis was performed by Method No. 141-0679-ORM (Miller and Helisten, 1975). Processing factors were calculated and results are summarized in Table 45.
Table 45. Residue results from processing studies on wheat treated post-harvest with methoprene at 10 g ai/t (Miller, 1985, RM-256).
Portion analyzed Methoprene (mg/kg) Processing factor wheat grain 7.2 flour 1.8 0.25 bran 11 1.5 90/10 wholemeal 6.7 0.93 pollard1 18 2.5 1Pollard (wheat germ, bran and semolina).
Another processing study was performed in USA in 1984 on milling products generated from wheat that was previously treated with 10 mg/kg methoprene and stored at 25 oC for 10 days (Miller, 1985, RM-250). The wheat was then fractionated with a Ross Walking flow mill. Sample analysis was performed by Method No. 141-0679-ORM (Miller and Helisten, 1975). Processing factors were calculated and results are summarized in Table 46.
Table 46. Residue results from processing studies on wheat, treated post-harvest with methoprene at 10 g ai/t (Miller, 1985, RM-250).
Portion analyzed Methoprene (mg/kg) Processing factor Treated 1 wheat grain 5.0 wholemeal 4.1 0.82 white flour 2.8 0.56 bran 8.7 1.7 germ 8.7 1.7 Treated 2 wheat grain 5.7 wholemeal 5.5 0.96 white flour 2.8 0.49 bran 10 1.8 germ 11 1.9
Two processing studies were performed in Australia in 1984 on milling products generated from wheat that was previously treated with 1 and 10 g ai/t methoprene (Miller, 1985, RM-314). At 4 and 13 months after treatment, samples of the treated wheat were fractionated with a Buhler experimental mill. Sample analysis was performed by ADL-124 (Smith, 1985a). Processing factors were calculated and results are summarized in Table 47.
Table 47. Residue results from processing studies on wheat treated post-harvest with methoprene at 1 and 10 g ai/t (Miller, 1985, RM-314).
Portion analyzed Methoprene (mg/kg) Processing factor 1 g ai/t, 13 months after post-treatment wheat grain 0.70 bran 1.2 1.7 pollard 1.5 2.1 90/10 wholemeal 0.30 0.43 white flour 0.20 0.29

methoprene 773
Portion analyzed Methoprene (mg/kg) Processing factor 10 g ai/t, 4 months after post-treatment wheat grain 7.2 bran 17 2.4 pollard 10 1.4 90/10 wholemeal 4.6 0.64 white flour 0.90 0.13
Two additional processing studies were performed in Australia in 1985 and 1986 on milling products generated from wheat that was previously treated with 1 g ai/t methoprene (Anonymous 2, 1984/85, RM-Silo; Anonymous 3, 1985/86, RM-Pilot). At 9 months after treatment, samples of the treated wheat were fractionated with a mill. Sample analysis was performed by Method ADL-124 (Smith, 1985a). Processing factors were calculated and results are summarized in Table 48.
Table 48. Residue results from processing studies on wheat treated post-harvest with methoprene at 1.0 g ai/t (Anonymous 2, 1984/85, RM-Silo; Anonymous 3, 1985/86, RM-Pilot).
Portion analyzed Methoprene (mg/kg) Processing factor RM-Silo wheat grain 0.61 bran 1.6 2.6 pollard 2.4 3.9 wholemeal 0.57 0.93 white flour 0.20 0.33 RM-Pilot wheat grain 0.60 bran 1.8 3.0 pollard 2.4 4.0 white flour 0.12 0.20
Numerous studies on methoprene applications to various grains indicated that residues remained predominantly in the outer bran layers, even after long time periods of storage of the treated grain, and therefore residues concentrated in the outer bran, aleurone and germ fractions.
Maize, meal and oil
A processing study was performed in the USA in 1985 on milling products generated from whole corn that were previously treated with 5.3 mg/kg methoprene (Miller, 1985, RM-301). At 30 day intervals, up to 180 days, corn composites were removed from the granary and were extracted for crude and refined oil. Figure 7 illustrates the flow diagram for the processing of corn. Yields of crude oil ranged from 2.8 to 4.9%. The samples were analysed with Method No. 141-0679-ORM (Miller and Helisten, 1979). Residues appeared high in the crude oil because of extraction and concentration into the small amounts of oil. Methoprene was stable in the maize on storage, but it was less efficiently extracted by industrial processes as the maize aged. The yield of crude oil also decreased with storage time. During the refining process, residues were removed, with no residues detectable in edible maize oil at the 0.2 mg/kg limit of detection. Refining processes converting crude to refined oil involve rather harsh treatment of the oils; evidently this treatment removes all methoprene residues. Processing factors were calculated and results are summarized in Table 49.
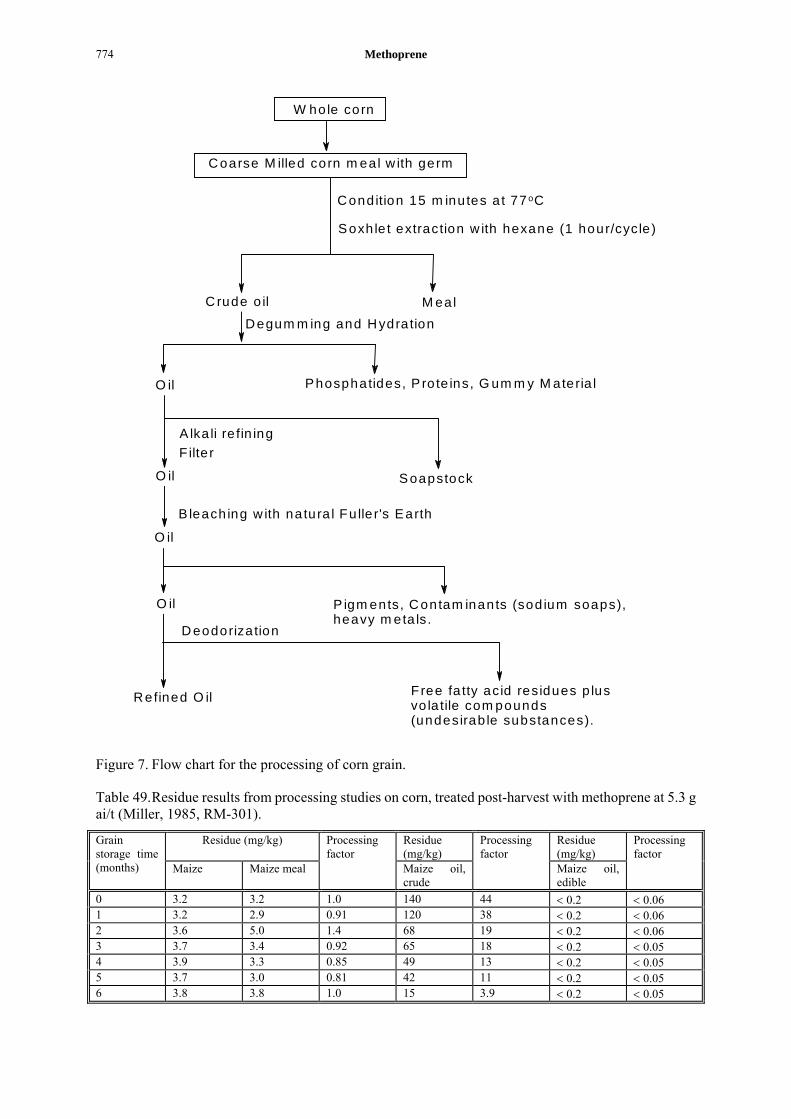
Methoprene 774
W hole corn
C oarse M illed corn m eal w ith germ
C ondition 15 m inutes a t 77 oC
S oxh le t extraction w ith hexane (1 hour/cycle )
C rude o il M ea lD egum m ing and H ydra tion
Phosphatides, P ro te ins, G um m y M ateria lO il
O il P igm ents, C ontam inants (sod ium soaps),heavy m eta ls.
R efined O il F ree fa tty acid residues p lus vo la tile com pounds(undesirab le substances).
A lka li re fin ing
O il
F ilte r
B leach ing w ith na tura l Fu lle r's Earth
O il
D eodoriza tion
S oapstock
Figure 7. Flow chart for the processing of corn grain.
Table 49. Residue results from processing studies on corn, treated post-harvest with methoprene at 5.3 g ai/t (Miller, 1985, RM-301).
Residue (mg/kg) Residue (mg/kg)
Residue (mg/kg)
Grain storage time (months) Maize Maize meal
Processing factor
Maize oil, crude
Processing factor
Maize oil, edible
Processing factor
0 3.2 3.2 1.0 140 44 < 0.2 < 0.06 1 3.2 2.9 0.91 120 38 < 0.2 < 0.06 2 3.6 5.0 1.4 68 19 < 0.2 < 0.06 3 3.7 3.4 0.92 65 18 < 0.2 < 0.05 4 3.9 3.3 0.85 49 13 < 0.2 < 0.05 5 3.7 3.0 0.81 42 11 < 0.2 < 0.05 6 3.8 3.8 1.0 15 3.9 < 0.2 < 0.05

methoprene 775
Rice and milled rice fractions
A processing study was performed in the USA in 1985 on rice that was previously treated with 5.3 mg/kg methoprene (Miller, 1985, RM-301). At 30 day intervals, up to 180 days, rice composites were removed from the granary and were processed into hulls, hulled rice and polished rice using industrial rice milling machinery. The predominance of methoprene in the outer hulls resulted in low residues in the hulled rice. During the polishing process residues were not detectable in polished rice at the 0.1 mg/kg limit of detection. The Samples were analysed with Method No. 141-0679-ORM (Miller and Helisten, 1979). Processing factors were calculated and results are summarized in Table 50.
Table 50. Residue results from processing studies on rice treated post-harvest with methoprene at 5.3 g ai/t (Miller, 1985, RM-301).
Residue (mg/kg) Residue (mg/kg) Residue (mg/kg) Grain storage time (months)
Rice Rice, husked Processing factor Hulls
Processing factor Rice polished
Processing factor
0 4.6 0.53 0.12 21 4.6 < 0.1 < 0.02 1 3.6 0.82 0.23 < 0.1 < 0.03 2 3.3 0.82 0.25 < 0.1 < 0.03 3 4.3 0.80 0.19 < 0.1 < 0.02 4 3.9 1.0 0.26 < 0.1 < 0.03 5 5.0 1.1 0.22 < 0.1 < 0.02 6 6.8 1.0 0.15 < 0.1 < 0.01
Residues in the edible portion of food commodities
No data were available.
RESIDUES IN ANIMAL COMMODITIES
Direct animal treatments
Methoprene is not used for direct animal treatments.
Farm animal feeding studies
Ruminants
The Meeting received a lactating dairy cow feeding study which provided information on likely residues resulting in animal tissues and milk from residues in the animal diet.
Lactating Holstein dairy cows (3-6 years old, 420-692 kg bw, 2-7 lactating months) were administered methoprene for 28 days at the levels of 0.1, 0.3 and 1.0 ppm (Kearley, 1973). Fourteen cows were used in this feeding study: two control cows were compared to 12 cows fed three levels of methoprene. At 28 days one control cow and two cows from each treatment level were slaughtered for body tissue samples. At Day 35 the remaining control cow and one cow from each treatment level were slaughtered for tissue samples. Furthermore, on Day 42 the remaining cow in each treatment level was slaughtered. Samples of tissues were collected for analysis immediately after the cows were sacrificed (Table 51). Samples of milk were collected on days 0 (pre-dose) to 42 for analysis. Each milk sample was collected immediately after milking. Formalin was added at 0.5 mL per 500 mL of milk sample. Milk production by individual animals during the course of the study ranged from 3.2 to 26.3 kg/day.
No methoprene residues were found in the hip, shoulder or rear leg muscle at any of the three treatment levels at the limits of detection (0.01 mg/kg). There were residues of methoprene in the renal and omental fat at all treatment levels. At the low treatment level the methoprene residues in renal fat and omental fat disappeared after 7 days post treatment. This is indicative of metabolism of methoprene and minimizes the likelihood of residues in animals occasionally exposed to methoprene.
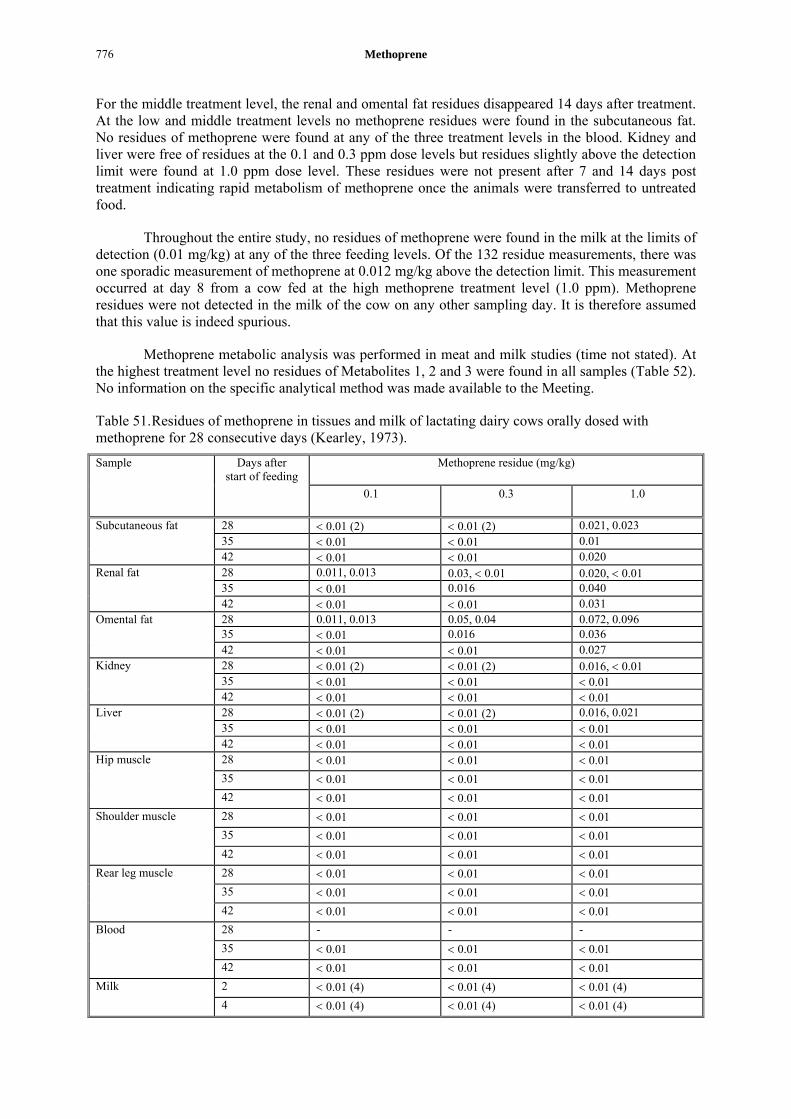
Methoprene 776
For the middle treatment level, the renal and omental fat residues disappeared 14 days after treatment. At the low and middle treatment levels no methoprene residues were found in the subcutaneous fat. No residues of methoprene were found at any of the three treatment levels in the blood. Kidney and liver were free of residues at the 0.1 and 0.3 ppm dose levels but residues slightly above the detection limit were found at 1.0 ppm dose level. These residues were not present after 7 and 14 days post treatment indicating rapid metabolism of methoprene once the animals were transferred to untreated food.
Throughout the entire study, no residues of methoprene were found in the milk at the limits of detection (0.01 mg/kg) at any of the three feeding levels. Of the 132 residue measurements, there was one sporadic measurement of methoprene at 0.012 mg/kg above the detection limit. This measurement occurred at day 8 from a cow fed at the high methoprene treatment level (1.0 ppm). Methoprene residues were not detected in the milk of the cow on any other sampling day. It is therefore assumed that this value is indeed spurious.
Methoprene metabolic analysis was performed in meat and milk studies (time not stated). At the highest treatment level no residues of Metabolites 1, 2 and 3 were found in all samples (Table 52). No information on the specific analytical method was made available to the Meeting.
Table 51. Residues of methoprene in tissues and milk of lactating dairy cows orally dosed with methoprene for 28 consecutive days (Kearley, 1973).
Methoprene residue (mg/kg) Sample Days after start of feeding
0.1 0.3 1.0
28 < 0.01 (2) < 0.01 (2) 0.021, 0.023 35 < 0.01 < 0.01 0.01
Subcutaneous fat
42 < 0.01 < 0.01 0.020 28 0.011, 0.013 0.03, < 0.01 0.020, < 0.01 35 < 0.01 0.016 0.040
Renal fat
42 < 0.01 < 0.01 0.031 28 0.011, 0.013 0.05, 0.04 0.072, 0.096 35 < 0.01 0.016 0.036
Omental fat
42 < 0.01 < 0.01 0.027 28 < 0.01 (2) < 0.01 (2) 0.016, < 0.01 35 < 0.01 < 0.01 < 0.01
Kidney
42 < 0.01 < 0.01 < 0.01 28 < 0.01 (2) < 0.01 (2) 0.016, 0.021 35 < 0.01 < 0.01 < 0.01
Liver
42 < 0.01 < 0.01 < 0.01 28 < 0.01 < 0.01 < 0.01 35 < 0.01 < 0.01 < 0.01
Hip muscle
42 < 0.01 < 0.01 < 0.01 28 < 0.01 < 0.01 < 0.01 35 < 0.01 < 0.01 < 0.01
Shoulder muscle
42 < 0.01 < 0.01 < 0.01 28 < 0.01 < 0.01 < 0.01 35 < 0.01 < 0.01 < 0.01
Rear leg muscle
42 < 0.01 < 0.01 < 0.01 28 - - - 35 < 0.01 < 0.01 < 0.01
Blood
42 < 0.01 < 0.01 < 0.01 2 < 0.01 (4) < 0.01 (4) < 0.01 (4) Milk 4 < 0.01 (4) < 0.01 (4) < 0.01 (4)
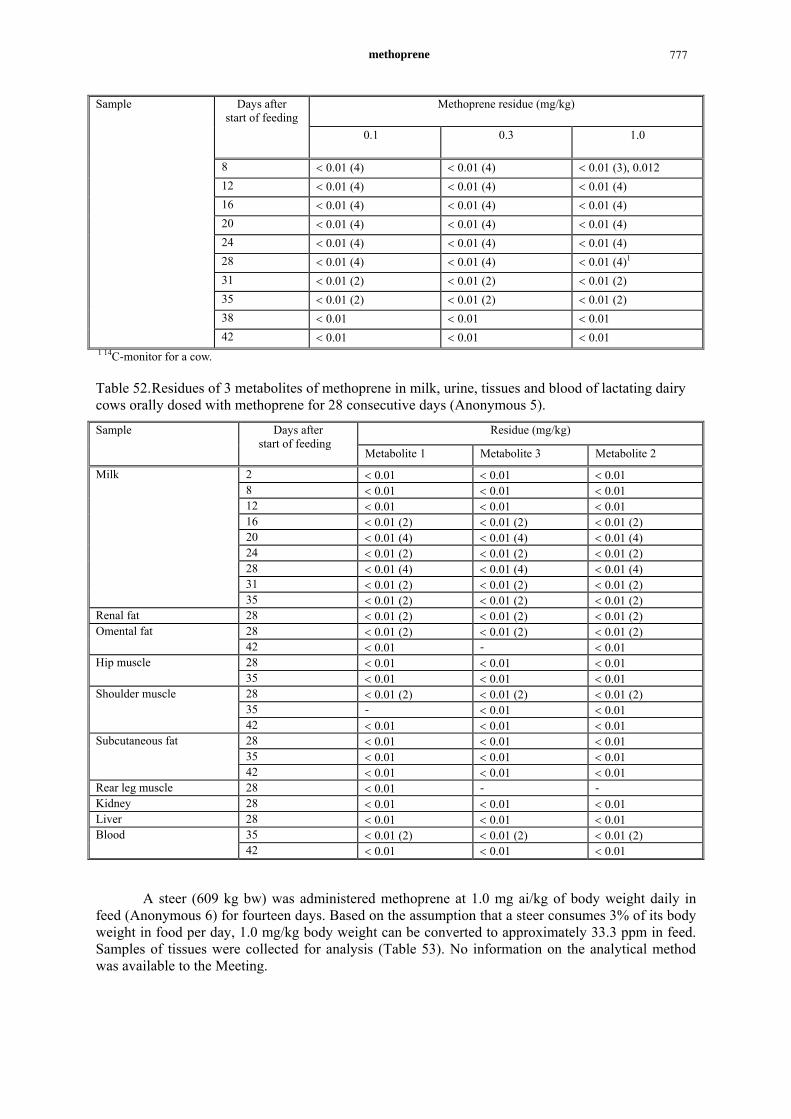
methoprene 777
Methoprene residue (mg/kg) Sample Days after start of feeding
0.1 0.3 1.0
8 < 0.01 (4) < 0.01 (4) < 0.01 (3), 0.012 12 < 0.01 (4) < 0.01 (4) < 0.01 (4) 16 < 0.01 (4) < 0.01 (4) < 0.01 (4) 20 < 0.01 (4) < 0.01 (4) < 0.01 (4) 24 < 0.01 (4) < 0.01 (4) < 0.01 (4) 28 < 0.01 (4) < 0.01 (4) < 0.01 (4)1
31 < 0.01 (2) < 0.01 (2) < 0.01 (2) 35 < 0.01 (2) < 0.01 (2) < 0.01 (2) 38 < 0.01 < 0.01 < 0.01
42 < 0.01 < 0.01 < 0.01 1 14C-monitor for a cow.
Table 52. Residues of 3 metabolites of methoprene in milk, urine, tissues and blood of lactating dairy cows orally dosed with methoprene for 28 consecutive days (Anonymous 5).
Residue (mg/kg) Sample Days after start of feeding
Metabolite 1 Metabolite 3 Metabolite 2
2 < 0.01 < 0.01 < 0.01 8 < 0.01 < 0.01 < 0.01 12 < 0.01 < 0.01 < 0.01 16 < 0.01 (2) < 0.01 (2) < 0.01 (2) 20 < 0.01 (4) < 0.01 (4) < 0.01 (4) 24 < 0.01 (2) < 0.01 (2) < 0.01 (2) 28 < 0.01 (4) < 0.01 (4) < 0.01 (4) 31 < 0.01 (2) < 0.01 (2) < 0.01 (2)
Milk
35 < 0.01 (2) < 0.01 (2) < 0.01 (2) Renal fat 28 < 0.01 (2) < 0.01 (2) < 0.01 (2)
28 < 0.01 (2) < 0.01 (2) < 0.01 (2) Omental fat 42 < 0.01 - < 0.01 28 < 0.01 < 0.01 < 0.01 Hip muscle 35 < 0.01 < 0.01 < 0.01 28 < 0.01 (2) < 0.01 (2) < 0.01 (2) 35 - < 0.01 < 0.01
Shoulder muscle
42 < 0.01 < 0.01 < 0.01 28 < 0.01 < 0.01 < 0.01 35 < 0.01 < 0.01 < 0.01
Subcutaneous fat
42 < 0.01 < 0.01 < 0.01 Rear leg muscle 28 < 0.01 - - Kidney 28 < 0.01 < 0.01 < 0.01 Liver 28 < 0.01 < 0.01 < 0.01
35 < 0.01 (2) < 0.01 (2) < 0.01 (2) Blood 42 < 0.01 < 0.01 < 0.01
A steer (609 kg bw) was administered methoprene at 1.0 mg ai/kg of body weight daily in feed (Anonymous 6) for fourteen days. Based on the assumption that a steer consumes 3% of its body weight in food per day, 1.0 mg/kg body weight can be converted to approximately 33.3 ppm in feed. Samples of tissues were collected for analysis (Table 53). No information on the analytical method was available to the Meeting.

Methoprene 778
Table 53. Residues of methoprene in tissues of a steer orally dosed with methoprene at 1.0 mg ai/kg bw for 14 consecutive days (Anonymous 6).
Sample Methoprene residue (mg/kg) Visceral fat 2.3 Spleen 0.04 Liver 0.01 Kidney 0.04 Heart 0.06 Omental fat 2.2 Inside round muscle 0.05 Brain 0.025 Back fat 1.8 Rib muscle -1
Shoulder muscle 0.10 Outside round muscle 0.08 Renal fat 1.3 1not available.
One control and two steers (455 kg bw) were administered methoprene at rates of 0.5, 1.0 and 5.0 mg/kg of body weight daily in feed (Anonymous 6) for fourteen days. Based on the assumption that a steer consumes 3% of its body weight in food per day, 0.5, 1.0 and 5.0 mg/kg body weight can be converted to approximately 16.7, 33.3 and 167 ppm in feed. One control steer was compared to six steers fed 3 levels of methoprene. Samples of tissues were collected for analysis (Table 54). No information on the analytical method was available to the Meeting.
Table 54. Residues of methoprene in tissues of steers orally dosed with methoprene for 14 consecutive days (Anonymous 6).
Methoprene residue (mg/kg) Sample
0.5 mg ai/kg bw 1.0 mg ai/kg bw 5.0 mg ai/kg bw
Subcutaneous fat 0.17, 0.20 1.1, 0.51 4.3, 6.1 Renal fat 0.19, 0.37 0.59, 0.45 5.6, 6.0 Omental fat 0.23, 0.33 0.69, 0.62 5.6, 7.9 Gracilis muscle 0.015, <0.01 0.10, 0.025 0.36, 0.39 Kidney 0.033, 0.045 0.10, 0.088 0.92, 0.47 Brain <0.01, <0.01 <0.01, <0.01 <0.01, <0.01 Liver <0.01, <0.01 <0.01, <0.01 <0.01, <0.01 Shank muscle 0.013, 0.04 0.05, 0.04 0.15, 0.21 Heart <0.01, <0.01 <0.01, 0.012 0.14, 0.62
A mature lactating dairy cow (609 kg) was administered methoprene at a rate of 2.5 mg/kg of body weight daily in feed (Anonymous 8) for almost 4 consecutive months. Based on the same assumption of consumption as above, 2.5 mg/kg body weight can be converted to approximately 83 ppm in feed. Samples of milk were collected for analysis with Method No. 039 (Miller, 1973). The residue data in milk is presented in the table 55.
Table 55. Residues of methoprene in milk of dairy cow orally dosed with methoprene at a rate of 2.5 mg/kg of body weight daily for 4 consecutive months (Anonymous 8).
Day of feeding
0 7 14 21 28 35 42 49 56 63 70 77 84 91
Residue (mg/kg)
0.0 0.51 0.32 - 0.45 0.41 0.42 0.60 0.72 0.52 0.55 0.29 0.29 0.52
-: not available.
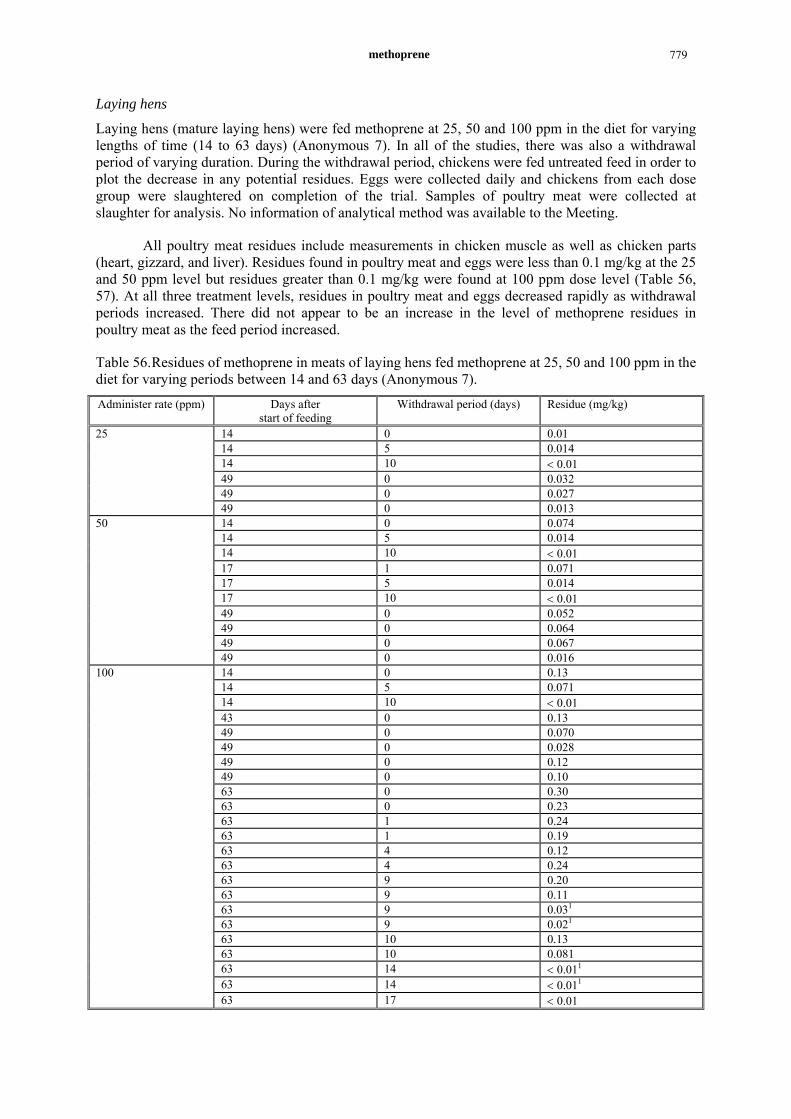
methoprene 779
Laying hens
Laying hens (mature laying hens) were fed methoprene at 25, 50 and 100 ppm in the diet for varying lengths of time (14 to 63 days) (Anonymous 7). In all of the studies, there was also a withdrawal period of varying duration. During the withdrawal period, chickens were fed untreated feed in order to plot the decrease in any potential residues. Eggs were collected daily and chickens from each dose group were slaughtered on completion of the trial. Samples of poultry meat were collected at slaughter for analysis. No information of analytical method was available to the Meeting.
All poultry meat residues include measurements in chicken muscle as well as chicken parts (heart, gizzard, and liver). Residues found in poultry meat and eggs were less than 0.1 mg/kg at the 25 and 50 ppm level but residues greater than 0.1 mg/kg were found at 100 ppm dose level (Table 56, 57). At all three treatment levels, residues in poultry meat and eggs decreased rapidly as withdrawal periods increased. There did not appear to be an increase in the level of methoprene residues in poultry meat as the feed period increased.
Table 56. Residues of methoprene in meats of laying hens fed methoprene at 25, 50 and 100 ppm in the diet for varying periods between 14 and 63 days (Anonymous 7).
Administer rate (ppm) Days after start of feeding
Withdrawal period (days) Residue (mg/kg)
14 0 0.01 14 5 0.014 14 10 < 0.01 49 0 0.032 49 0 0.027
25
49 0 0.013 14 0 0.074 14 5 0.014 14 10 < 0.01 17 1 0.071 17 5 0.014 17 10 < 0.01 49 0 0.052 49 0 0.064 49 0 0.067
50
49 0 0.016 14 0 0.13 14 5 0.071 14 10 < 0.01 43 0 0.13 49 0 0.070 49 0 0.028 49 0 0.12 49 0 0.10 63 0 0.30 63 0 0.23 63 1 0.24 63 1 0.19 63 4 0.12 63 4 0.24 63 9 0.20 63 9 0.11 63 9 0.031
63 9 0.021
63 10 0.13 63 10 0.081 63 14 < 0.011
63 14 < 0.011
100
63 17 < 0.01

Methoprene 780
1Chicken parts (heart, liver, gizzard)
Table 57. Residues of methoprene in eggs of laying hens fed methoprene at 25, 50 and 100 ppm in the diet for varying periods between 14 and 63 days (Anonymous 7).
Methoprene residue (mg/kg) Sample1 Total days treated Withdrawal period (days) 25 ppm in feed 50 ppm in feed 100 ppm in feed
2 1 0 <0.01 <0.01 <0.011
3 2 0 <0.01 <0.01 <0.011
4 3 0 0.010 0.022 0.026 5 4 0 0.014 0.014 - 6 5 0 0.015 0.024 0.050 7 6 0 0.010 0.020 0.043 8 7 0 0.016 0.024 0.063 9 8 0 0.014 0.031 0.083 10 9 0 0.016 0.033 0.081 11 10 0 0.022 0.038 0.083 12 11 0 0.011 0.039 0.070 13 13 0 0.045 0.050 0.16 14 14 0 0.011 - - 15 15 0 - - 0.201 16 16 0 0.026 0.040 0.20 17 19 0 0.027 0.047 0.055 18 20 0 0.040 0.041 0.13 19 21 0 0.036 0.032 0.087 20 25 0 0.032 0.054 0.092 21 28 0 0.026 0.052 0.14 22 31 0 0.036 0.035 0.10 23 33 0 0.017 0.048 0.12 24 36 0 0.020 0.043 0.080 25 47 0 0.030 0.052 0.090 26 48 0 0.024 0.046 0.13 27 49 0 0.036 0.033 0.12 28 51 0 0.017 0.020 0.030 29 53 0 0.022 0.009 0.061 30 55 0 0.01 0.010 0.032 31 57 0 <0.01 <0.01 <0.01 32 59 0 <0.01 <0.01 <0.01 33 61 0 <0.01 <0.01 <0.01 34 63 0 <0.01 <0.01 <0.01 1Recovery is 20%.
RESIDUES IN FOOD IN COMMERCE OR AT CONSUMPTION
Methoprene was included in the list of analytes examined in foods in the 20th Australian Total Diet Survey (ATDS) of 2003 (Table 58). All estimated dietary intakes of methoprene were less than 0.01% of the ADI in ATDS 20 (2003).
Table 58. Mean estimated daily dietary exposure of methoprene as a percentage of the ADI (0.4 mg/kg bw) (Simpson and Hamilton, 2005).
Adult males, 25-35 years
Adult females, 25-35 years
Boys, 12 years Girls, 12 years Toddlers, 2 years Infants, 9 months
< 0.01 < 0.01 < 0.01 < 0.01 < 0.01 < 0.01
The National Residue Survey (NRS) of Australia monitors pesticide residues in many commodities exported from Australia (Hughes, 2005). In the NRS of 2003, methoprene residues were regularly detected in cereals and their products in those cases where methoprene was used as a post-harvest grain protectant. Tables (Table 59, 60, 61 and 62) below provided a summary of the

methoprene 781
residues of the insect growth regulator, methoprene, found on grain samples destined for export from Australia. Only one residue in wheat bran exceeded the MRL in 2003 NRS.
Table 59. Methoprene residue detections on cereal grains in the 2003 calendar year (Hughes, 2005).
Grain Samples Tested
Nil Residues 1
Residue detections 2
MRL 3 LOR4 - 0.2 MRL3
> 0.2 - 0.5 MRL3
> 0.5 - 1.0 MRL3
>1.0 MRL3
Raw grain Wheat 581 5
56
95.7% 25 4.3% 2.0 23 4.0% 2 0.3%
Barley 226 210
92.9% 16 7.1% 2.0 11 4.9% 2 0.9% 3 1.3%
Oats 32 26
81.3% 6 18.8% 2.0 3 9.4% 3 9.4%
Sorghum 81 74
91.4% 7 8.6% 2.0 5 6.2% 2 2.5%
Milled products
Wheat 35 22
62.9% 13 37.1% 2.0 11 31.4% 1 2.9% 1 2.9%
Flour 35 28
80.0% 7 20.0% 2.0 6 17.1% 1 2.9%
Bran 35 20
57.1% 15 42.9% 5.0 9 25.7% 5 14.3% 1 2.9%
TOTAL 444 380
85.6% 64 14.4% 45 10.1% 13 2.9% 5 1.1% 1 0.2%
1'Nil residues' refers to non-quantifiable methoprene residue levels below the limit of reporting (LOR) of 0.1 mg/kg. 2'Residue detections' refers to quantifiable methoprene residue levels above the limit or reporting (LOR). 3MRLs refer to Australian Food Standards adopted into the Food Standards Codes. 4LOR refers to the level set by NRS at which analytical laboratories must quantify the level of residues.
Table 60. Methoprene residue detections in each grain from 1 January 1994 to 31 December 2003 (Hughes, 2005).
wheat flour bran barley oat sorghum lupin pea canola TOTAL
Residue detections 973 53 161 174 26 99 0 0 0 1486
violations 0 0 1 0 0 0 0 0 0 1
total samples 9246 356 358 2541 283 1034 641 400 524 15383
Table 61. Methoprene residue detections and violations for each year from 1994 to 2003 (Hughes, 2005).
1994 1995 1996 1997 1998 1999 2000 2001 2002 2003 TOTAL
residue detections 14 58 172 255 200 156 232 145 165 89 1486
violations 0 0 0 0 0 0 0 0 0 1 1
total samples 401 1057 2053 2205 1915 1739 1603 1521 1463 1426 15383
Table 62. Methoprene residue detections for each year from 1994 to 2003 (export, domestic and milled products figures) (Hughes, 2005).
1994 1995 1996 1997 1998 1999 2000 2001 2002 2003 TOTAL
export program 14 20 123 225 179 117 144 69 99 13 1003
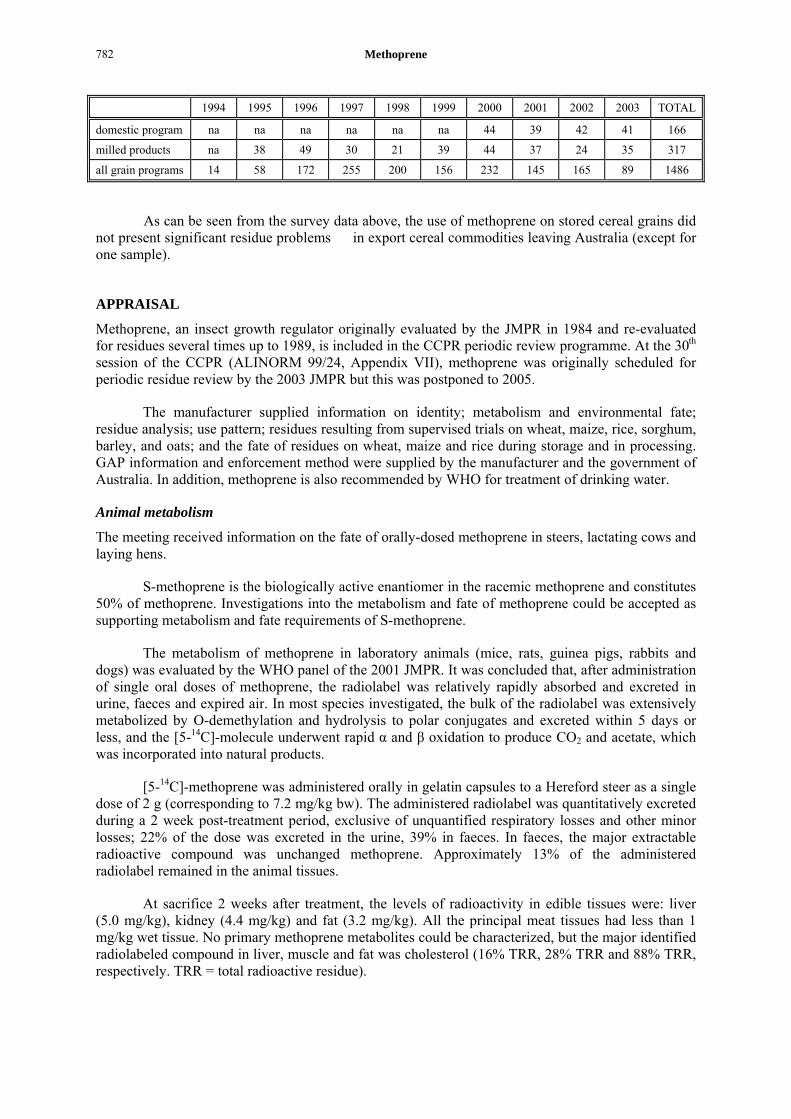
Methoprene 782
1994 1995 1996 1997 1998 1999 2000 2001 2002 2003 TOTAL
domestic program na na na na na na 44 39 42 41 166
milled products na 38 49 30 21 39 44 37 24 35 317
all grain programs 14 58 172 255 200 156 232 145 165 89 1486
As can be seen from the survey data above, the use of methoprene on stored cereal grains did not present significant residue problems in export cereal commodities leaving Australia (except for one sample).
APPRAISAL
Methoprene, an insect growth regulator originally evaluated by the JMPR in 1984 and re-evaluated for residues several times up to 1989, is included in the CCPR periodic review programme. At the 30th session of the CCPR (ALINORM 99/24, Appendix VII), methoprene was originally scheduled for periodic residue review by the 2003 JMPR but this was postponed to 2005.
The manufacturer supplied information on identity; metabolism and environmental fate; residue analysis; use pattern; residues resulting from supervised trials on wheat, maize, rice, sorghum, barley, and oats; and the fate of residues on wheat, maize and rice during storage and in processing. GAP information and enforcement method were supplied by the manufacturer and the government of Australia. In addition, methoprene is also recommended by WHO for treatment of drinking water.
Animal metabolism
The meeting received information on the fate of orally-dosed methoprene in steers, lactating cows and laying hens.
S-methoprene is the biologically active enantiomer in the racemic methoprene and constitutes 50% of methoprene. Investigations into the metabolism and fate of methoprene could be accepted as supporting metabolism and fate requirements of S-methoprene.
The metabolism of methoprene in laboratory animals (mice, rats, guinea pigs, rabbits and dogs) was evaluated by the WHO panel of the 2001 JMPR. It was concluded that, after administration of single oral doses of methoprene, the radiolabel was relatively rapidly absorbed and excreted in urine, faeces and expired air. In most species investigated, the bulk of the radiolabel was extensively metabolized by O-demethylation and hydrolysis to polar conjugates and excreted within 5 days or less, and the [5-14C]-molecule underwent rapid α and β oxidation to produce CO2 and acetate, which was incorporated into natural products.
[5-14C]-methoprene was administered orally in gelatin capsules to a Hereford steer as a single dose of 2 g (corresponding to 7.2 mg/kg bw). The administered radiolabel was quantitatively excreted during a 2 week post-treatment period, exclusive of unquantified respiratory losses and other minor losses; 22% of the dose was excreted in the urine, 39% in faeces. In faeces, the major extractable radioactive compound was unchanged methoprene. Approximately 13% of the administered radiolabel remained in the animal tissues.
At sacrifice 2 weeks after treatment, the levels of radioactivity in edible tissues were: liver (5.0 mg/kg), kidney (4.4 mg/kg) and fat (3.2 mg/kg). All the principal meat tissues had less than 1 mg/kg wet tissue. No primary methoprene metabolites could be characterized, but the major identified radiolabeled compound in liver, muscle and fat was cholesterol (16% TRR, 28% TRR and 88% TRR, respectively. TRR = total radioactive residue).
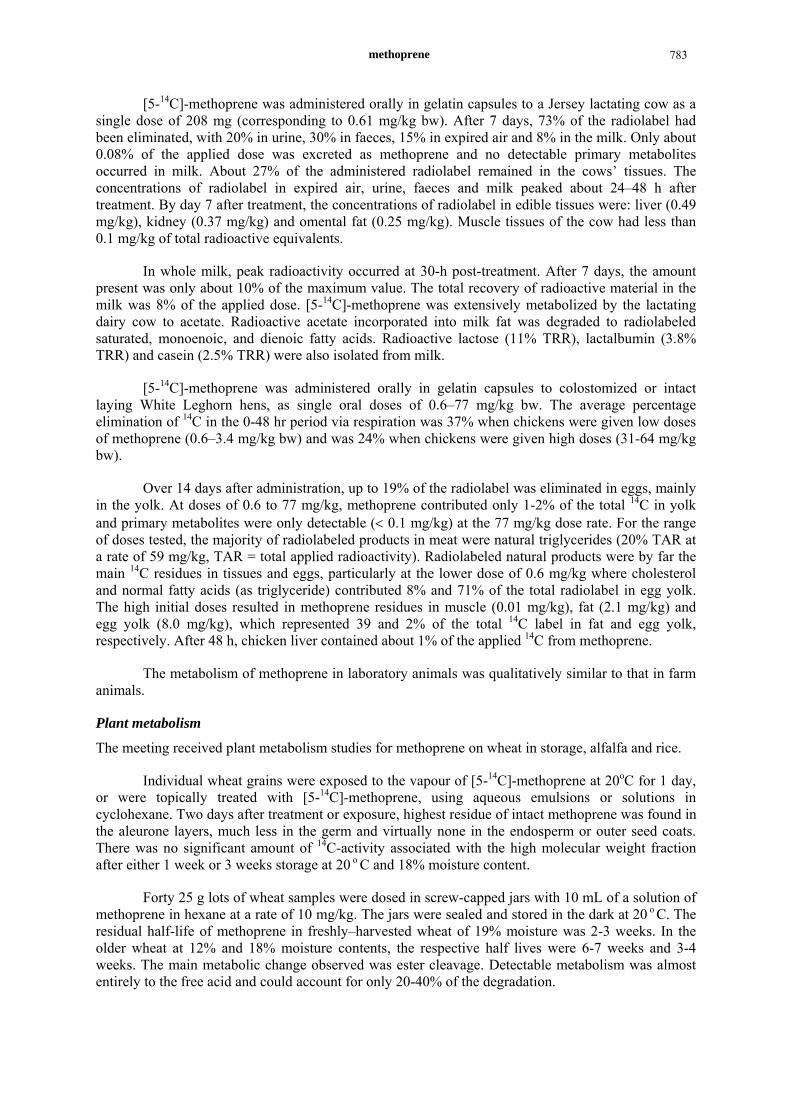
methoprene 783
[5-14C]-methoprene was administered orally in gelatin capsules to a Jersey lactating cow as a single dose of 208 mg (corresponding to 0.61 mg/kg bw). After 7 days, 73% of the radiolabel had been eliminated, with 20% in urine, 30% in faeces, 15% in expired air and 8% in the milk. Only about 0.08% of the applied dose was excreted as methoprene and no detectable primary metabolites occurred in milk. About 27% of the administered radiolabel remained in the cows’ tissues. The concentrations of radiolabel in expired air, urine, faeces and milk peaked about 24–48 h after treatment. By day 7 after treatment, the concentrations of radiolabel in edible tissues were: liver (0.49 mg/kg), kidney (0.37 mg/kg) and omental fat (0.25 mg/kg). Muscle tissues of the cow had less than 0.1 mg/kg of total radioactive equivalents.
In whole milk, peak radioactivity occurred at 30-h post-treatment. After 7 days, the amount present was only about 10% of the maximum value. The total recovery of radioactive material in the milk was 8% of the applied dose. [5-14C]-methoprene was extensively metabolized by the lactating dairy cow to acetate. Radioactive acetate incorporated into milk fat was degraded to radiolabeled saturated, monoenoic, and dienoic fatty acids. Radioactive lactose (11% TRR), lactalbumin (3.8% TRR) and casein (2.5% TRR) were also isolated from milk.
[5-14C]-methoprene was administered orally in gelatin capsules to colostomized or intact laying White Leghorn hens, as single oral doses of 0.6–77 mg/kg bw. The average percentage elimination of 14C in the 0-48 hr period via respiration was 37% when chickens were given low doses of methoprene (0.6–3.4 mg/kg bw) and was 24% when chickens were given high doses (31-64 mg/kg bw).
Over 14 days after administration, up to 19% of the radiolabel was eliminated in eggs, mainly in the yolk. At doses of 0.6 to 77 mg/kg, methoprene contributed only 1-2% of the total 14C in yolk and primary metabolites were only detectable (< 0.1 mg/kg) at the 77 mg/kg dose rate. For the range of doses tested, the majority of radiolabeled products in meat were natural triglycerides (20% TAR at a rate of 59 mg/kg, TAR = total applied radioactivity). Radiolabeled natural products were by far the main 14C residues in tissues and eggs, particularly at the lower dose of 0.6 mg/kg where cholesterol and normal fatty acids (as triglyceride) contributed 8% and 71% of the total radiolabel in egg yolk. The high initial doses resulted in methoprene residues in muscle (0.01 mg/kg), fat (2.1 mg/kg) and egg yolk (8.0 mg/kg), which represented 39 and 2% of the total 14C label in fat and egg yolk, respectively. After 48 h, chicken liver contained about 1% of the applied 14C from methoprene.
The metabolism of methoprene in laboratory animals was qualitatively similar to that in farm animals.
Plant metabolism
The meeting received plant metabolism studies for methoprene on wheat in storage, alfalfa and rice.
Individual wheat grains were exposed to the vapour of [5-14C]-methoprene at 20oC for 1 day, or were topically treated with [5-14C]-methoprene, using aqueous emulsions or solutions in cyclohexane. Two days after treatment or exposure, highest residue of intact methoprene was found in the aleurone layers, much less in the germ and virtually none in the endosperm or outer seed coats. There was no significant amount of 14C-activity associated with the high molecular weight fraction after either 1 week or 3 weeks storage at 20 o C and 18% moisture content.
Forty 25 g lots of wheat samples were dosed in screw-capped jars with 10 mL of a solution of methoprene in hexane at a rate of 10 mg/kg. The jars were sealed and stored in the dark at 20 o C. The residual half-life of methoprene in freshly–harvested wheat of 19% moisture was 2-3 weeks. In the older wheat at 12% and 18% moisture contents, the respective half lives were 6-7 weeks and 3-4 weeks. The main metabolic change observed was ester cleavage. Detectable metabolism was almost entirely to the free acid and could account for only 20-40% of the degradation.
Methoprene 784
Leaves of potted alfalfa were painted with the diluted [5-14C]-methoprene emulsifiable concentrate at a rate equivalent to 1.1 kg ai/ha. Parent methoprene disappeared in approximate first-order decay with a half-life of about 2 days for alfalfa. Volatility was a minor pathway for loss. The concentration of nonpolar metabolites maximized after 3 days in alfalfa. The primary nonpolar metabolites in alfalfa after 7 days constituted only approximately 1% of TAR. The aglycones in alfalfa after enzymic cleavage constituted approximately 10% of TAR as identifiable metabolites. A large amount (56%) of the radioactivity in chloroform extract fraction was associated with high molecular weight products (mol weight > 600). Further analysis of GPC fractions supported the incorporation of 14C label into naturally occurring plant pigments and other higher molecular weight plant constituents. After 30 days in alfalfa, 1% of the applied methoprene was retrieved as methoprene.
Leaves of potted rice were painted with the diluted [5-14C]-methoprene emulsifiable concentrate at a rate equivalent to 1.1 kg ai/ha. Parent methoprene disappeared in an approximate first-order decay with a half-life of about 0.5 day for rice. A total of 30% of the applied dose of methoprene on rice was isolated as condensed vapours after 1 week, which proved that volatility was a major path of elimination. The concentration of nonpolar metabolites maximized after 1 day in rice. The primary nonpolar metabolites in rice after 3 days constituted approximately 2% of TAR. The aglycones in rice after enzymic cleavage constituted approximately 1.5% of TAR. After 15 days in rice, 0.4% of the applied methoprene was retrieved as methoprene.
In both animals and plants, methoprene undergoes ester hydrolysis, O-demethylation, and oxidative scission of the 4-ene double bond. Further metabolism results in the corporation of methoprene-derived fragments into natural products.
Environmental fate in soil
The meeting received information on aerobic degradation in soil.
The aerobic degradation of [5-14C]-methoprene was studied in sandy loam and silt loam soils for 60 days at dose rates of 0.7, 1.0 and 10 kg ai/ha. The residual half-life of methoprene in sandy loam was about 10 days at a surface treatment rate of 1 kg ai/ha. By day 14 only 0.7% of TAR could be identified as known metabolites of methoprene.
Environmental fate in water/sediment systems
The Meeting received information on sterile aqueous hydrolysis, photolysis, thin film photolysis and metabolism in pond water.
Sterile aqueous solutions of methoprene (0.5 mg/L), buffered at various pH values (pH5, 7 and 9), were found to be extremely stable to hydrolysis over four weeks at 20°C in the dark. No degradation was seen for the duration of the experiment in sterile water buffered at pH 7 and 9, and similar stability was observed in pH 5 buffer for 21 days.
In the first study of photolysis, photodecomposition of [5-14C]-methoprene was investigated in the autoclaved phosphate buffer (0.05 M, pH 7) at 0.01 mg/kg and 0.50 mg/kg. Methoprene was rapidly decomposed with both concentrations giving half-lives of apparently less than 1 day. In a second study of photolysis after 1 week, four photoproducts (24% yield overall) were characterized as metabolites of methoprene. Parent methoprene was not detectable and there were at least 46 other photoproducts but none represented more than 2% yield.
Photolysis on glass was investigated at a rate corresponding to 11 μg/cm2 (1.1 kg ai/ha) and film thickness of 0.1 μm. Methoprene was rapidly degraded when a thin film on glass was exposed to sunlight through glass. The half-life for photochemical breakdown under these conditions was 6 h. The recovery of only 72% of TAR after 27 h suggested photolysis of methoprene to volatile products which were lost by vaporization. Collection of vapours above the photolysate resulted in recovery of

methoprene 785
13% of TAR, of which only 0.2% was methoprene and 6%, 14CO2. Resolution of the crude photolysate after exposure of methoprene to sunshine for 4 days gave methoprene (7%, equal mixture of 2E and 2Z) and at least 50 other metabolites and photoproducts, but none represented more than 6% of TAR.
In the first study, the degradation studies of methoprene labelled in the 10-3H (purity > 99%) and the 5-14C (purity 97.9%) were performed in the pond water. The half-lives of [10-3H]methoprene at 0.001 mg/kg and at 0.01 mg/kg were approximately 30 h and 40 h, respectively.
Methods of analysis
The Meeting received information on several methods for the determination of parent methoprene and /or S-methoprene residues in cereal grains, related processed products, stored grain and corn, milk, eggs, poultry and cattle tissues using GC-FID and HPLC, and on a method for the detection of methoprene residues in wheat grain with ELISA.
Residues of methoprene are first extracted with solvents (acetonitrile, acetone/hexane, hexane, methanol, and iso-octane). Fatty extracts are subjected to cold-temperature precipitation and filtration to remove fat. Solvent partitioning and/or column chromatography (florisil, alumina and silica column) are used for clean-up. Methoprene was analysed by GC with FID or HPLC-UV. The identity of suspected residues was confirmed by alternative GC column, GC-MS, and [14C]-methoprene. The lower limits of quantification (LOQs) are: soils, blood and urine, 0.001-0.01 mg/kg; forage grasses, forage legumes and rice foliage, 0.005 mg/kg; milk, eggs, stored grain and corn kernels, fish, shellfish, poultry and cattle tissues and faeces, 0.01 mg/kg; cereal grains and processed products 0.01-0.2 mg/kg. The LOQ’s and recoveries were validated by analysis of laboratory and field samples fortified with 14C-methoprene in some methods. Two methods (LOQ: 0.008 mg/kg and 0.05 mg/kg, respectively) are considered suitable for enforcement for grain and grain products.
A rapid enzyme immunoassay was used as a screening test for methoprene in animal feed grains, and sensitive enough to detect methoprene at 0.5 ppm in the grain. This assay can be used as a screening test, but cannot be used for quantitative detection of methoprene.
Stability of pesticide residues in stored analytical samples
The Meeting received information on the stability of methoprene in milk, and supplemental information on the stability of S-hydroprene in bologna, chicken, bread and hamburger.
Information on storage stability of methoprene in cereal grains was not submitted. However, field residue samples were stored at -20°C until needed for analysis (storage time not stated). Numerous lab studies and field trials have shown long-term stability of methoprene in stored grains, not only at -20°C but even at room temperature.
Stability of S-hydroprene was demonstrated in hamburger, chicken, bread, apples and lettuce at -15°C for 7 to 24 days. S-hydroprene is a compound with very similar structure and properties to S-methoprene. It is therefore likely that S-methoprene was also stable in animal commodities at -15°C
The Meeting concluded that methoprene would be stable in cereal grains and animal commodities when stored frozen.
Definition of the residue
Methoprene was rapidly and extensively metabolized by animals and plants. There was 8% of TRR in whole cow milk. 0.015 mg/kg of methoprene was detected, but primary metabolites were not detected (< 0.01 mg/kg). [5-14C]-methoprene was extensively metabolized to acetate by the lactating dairy cow.
Methoprene 786
In steer tissues, no primary methoprene metabolites were found, and the major identified radioactivity (16–88%, depending on tissue) was [14C]-cholesterol.
At doses of 0.6 to 77 mg/kg, methoprene contributed only 1–2% of the total 14C in yolk and primary metabolites were only detectable (< 0.1 mg/kg) at the 77 mg/kg dose rate. Higher initial doses resulted in detectable residues of methoprene in muscle, fat and egg yolk. Radiolabeled natural triglycerides and cholesterol also contributed major portions of the total 14C residue in fat.
In the animal metabolism studies, the concentration of residue was substantially higher in fat and egg yolk than that in muscle and egg white. The values of log Pow (4 for methoprene, approximate 6 for S-methoprene) also indicate that methoprene is a fat-soluble compound. However, methoprene was metabolized quickly and extensively by animals, so its accumulation in fat was just temporary.
After the pre-harvest treatment of alfalfa and rice, five primary non-polar metabolites were found. Methoprene which remained in alfalfa and rice was a minor part of the residue. However, after post-harvest treatment of wheat grains, the residue consisted mainly of methoprene.
The primary metabolites were not toxicologically significant compounds, which were evaluated by the WHO panel of 2001 JMPR. The Meeting agreed that methoprene is suitable for enforcement in plant and animal commodities and is also the compound of interest for estimation of dietary risk.
Definition of residue (for compliance with the MRL and for estimation of dietary intake): methoprene.
The residue is fat-soluble.
Results of supervised trials on crops
The Meeting received information on supervised trials of post-harvest treatments of methoprene/S- methoprene in wheat grain, shelled corn, rice, sorghum grain, barley grain and oats grain in USA, Australia and Thailand. This data was generated from large-scale storage trials with the exception of four laboratory studies on S-methoprene in 2003; most of the trials were conducted in Australia and the USA.
Methoprene
Wheat
Thirty-one trials were conducted on wheat in Australia (GAP: 0.50~1.0 g ai/t) in 1982~89. In twenty-four trials conducted at the maximum GAP, the highest concentrations during sampling were 0.38, 0.50 (2), 0.59, 0.60, 0.63, 0.70 (3), 0.72, 0.74 (3), 0.78, 0.79, 0.80 (2), 0.85, 0.90, 1.0, 1.1, 1.2, 1.9 and 2.0 mg/kg.
Four trials on wheat were conducted in the USA (GAP: 5.0 g ai/t) in 1982~85. Two USA trials and two Australian trials were conducted against the maximum GAP (USA), and the highest concentrations during sampling were 2.1, 4.0, 5.1 and 8.0 mg/kg.
Maize
Seventeen trials were conducted on maize in the USA (GAP: 5.0 g ai/t) in 1982~85. In three trials conducted at the maximum GAP, the highest concentrations during sampling were 3.9, 4.2 and 4.6 mg/kg.

methoprene 787
Rice
Eight trials on rice were conducted in the USA (GAP: 5.0 g ai/t) in 1984~1985, and in Thailand (no GAP; uses that of the USA) in 1984. In three trials conducted at the maximum GAP (USA), the highest concentrations were 2.9, 6.8, and 8.1 mg/kg.
Sorghum
Two trials were conducted on sorghum at GAP in Australia (GAP: 0.50~1.0 g ai/t) in 1984. The highest concentrations of methoprene residues found during storage were 0.93 and 0.98 mg/kg.
Two trials were conducted on sorghum at the maximum in the USA (GAP: 5.0 g ai/t) in 1985. The highest concentrations of methoprene residues found during storage were 7.5 and 7.8 mg/kg.
Barley
Four trials on barley were conducted on barley grain in Australia (GAP: 0.50~1.0 g ai/t) in 1985. In three trials conducted at the maximum GAP, the highest concentrations were 0.60, 0.63, 0.65 and 1.1 mg/kg.
Oats
Four trials were conducted on oats grain in Australia (GAP: 0.50–1.0 g ai/t) in 1985. The highest concentrations of methoprene residues found during storage were 0.77, 0.96 and 1.0 (2) mg/kg.
The Meeting considered the combined data sufficient for cereal grains. The data from Australia and the USA were considered to represent different populations. The Meeting decided to evaluate the USA trials and other trials against the critical GAP in USA (5.0 g ai/t). The concentrations of residues in trials conducted (4 trials on wheat, 3 trials on maize, 3 trials on rice and 2 trials on sorghum) were, in ranked order: 2.1, 2.9, 3.9, 4.0, 4.2, 4.6, 5.1, 6.8, 7.5, 7.8, 8.0 and 8.1 mg/kg. The Meeting estimated an STMR value of 4.85 mg/kg, a highest residue of 8.1 mg/kg and a maximum residue level of 10 mg/kg for cereal grains. The recommendation for a maximum residue level of 10 mg/kg for cereal grains replaces the previous recommendation of 5 mg/kg.
S-Methoprene
Wheat
Two trials were conducted on wheat grain at the maximum GAP in Australia (GAP: 0.60 g ai/t) in 1986. The highest concentrations of S-methoprene residues found during storage were 0.33 and 0.54 mg/kg.
One trial and four laboratory studies were conducted on wheat grain in the USA (GAP: 0.60–4.4 g ai/t) in 1985 and 2003, but none of trials were conducted at the maximum GAP.
As residues arising from S-methoprene were covered by those from methoprene, the Meeting agreed not to recommend a maximum residue level for S-methoprene in wheat after post harvest treatment.
Fate of residues during processing
The meeting received information on the fate of residue of methoprene and S-methoprene during simulated processing of stored wheat (milling), stored rice (husking and polishing) and stored maize (extraction and refinement of maize oil).
In processing
Wheat with various storage times after post-harvest treatment with methoprene was milled. The parent compound was determined in processed products. Processing factors derived from stored wheat
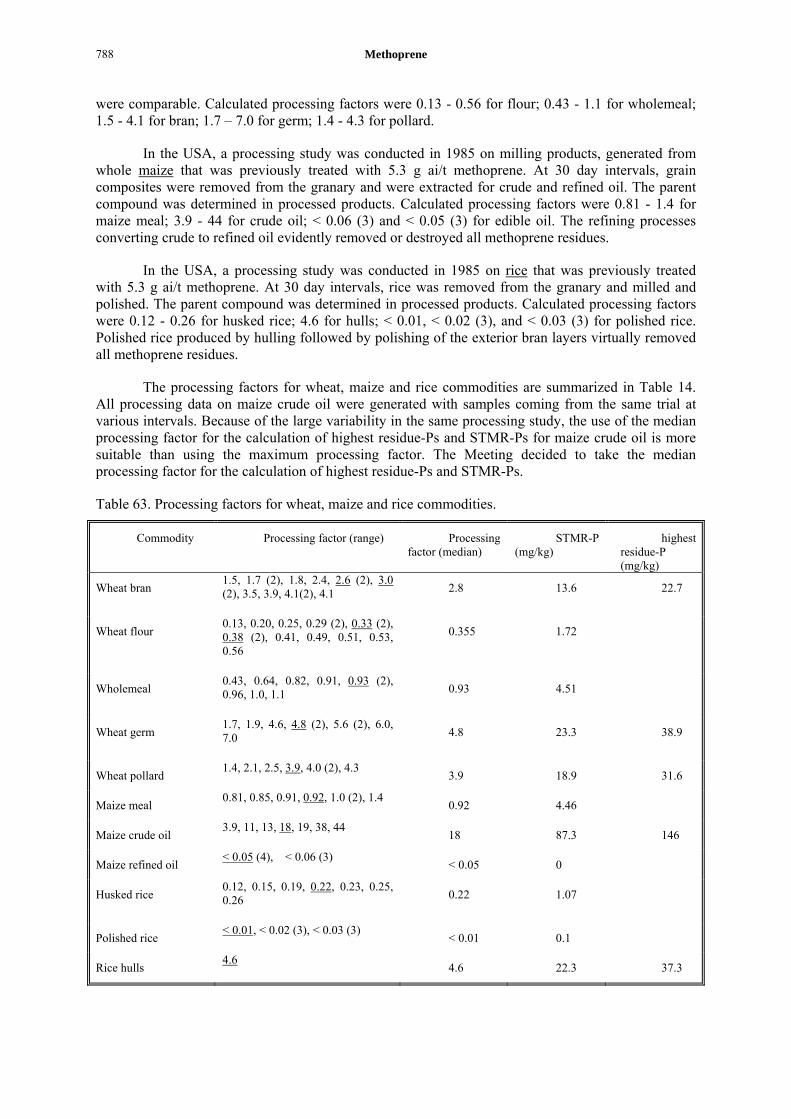
Methoprene 788
were comparable. Calculated processing factors were 0.13 - 0.56 for flour; 0.43 - 1.1 for wholemeal; 1.5 - 4.1 for bran; 1.7 – 7.0 for germ; 1.4 - 4.3 for pollard.
In the USA, a processing study was conducted in 1985 on milling products, generated from whole maize that was previously treated with 5.3 g ai/t methoprene. At 30 day intervals, grain composites were removed from the granary and were extracted for crude and refined oil. The parent compound was determined in processed products. Calculated processing factors were 0.81 - 1.4 for maize meal; 3.9 - 44 for crude oil; < 0.06 (3) and < 0.05 (3) for edible oil. The refining processes converting crude to refined oil evidently removed or destroyed all methoprene residues.
In the USA, a processing study was conducted in 1985 on rice that was previously treated with 5.3 g ai/t methoprene. At 30 day intervals, rice was removed from the granary and milled and polished. The parent compound was determined in processed products. Calculated processing factors were 0.12 - 0.26 for husked rice; 4.6 for hulls; < 0.01, < 0.02 (3), and < 0.03 (3) for polished rice. Polished rice produced by hulling followed by polishing of the exterior bran layers virtually removed all methoprene residues.
The processing factors for wheat, maize and rice commodities are summarized in Table 14. All processing data on maize crude oil were generated with samples coming from the same trial at various intervals. Because of the large variability in the same processing study, the use of the median processing factor for the calculation of highest residue-Ps and STMR-Ps for maize crude oil is more suitable than using the maximum processing factor. The Meeting decided to take the median processing factor for the calculation of highest residue-Ps and STMR-Ps.
Table 63. Processing factors for wheat, maize and rice commodities.
Commodity Processing factor (range) Processing factor (median)
STMR-P (mg/kg)
highest residue-P (mg/kg)
Wheat bran 1.5, 1.7 (2), 1.8, 2.4, 2.6 (2), 3.0 (2), 3.5, 3.9, 4.1(2), 4.1 2.8 13.6 22.7
Wheat flour 0.13, 0.20, 0.25, 0.29 (2), 0.33 (2), 0.38 (2), 0.41, 0.49, 0.51, 0.53, 0.56
0.355 1.72
Wholemeal 0.43, 0.64, 0.82, 0.91, 0.93 (2), 0.96, 1.0, 1.1 0.93 4.51
Wheat germ 1.7, 1.9, 4.6, 4.8 (2), 5.6 (2), 6.0, 7.0 4.8 23.3 38.9
Wheat pollard 1.4, 2.1, 2.5, 3.9, 4.0 (2), 4.3
3.9 18.9 31.6
Maize meal 0.81, 0.85, 0.91, 0.92, 1.0 (2), 1.4
0.92 4.46
Maize crude oil 3.9, 11, 13, 18, 19, 38, 44
18 87.3 146
Maize refined oil < 0.05 (4), < 0.06 (3)
< 0.05 0
Husked rice 0.12, 0.15, 0.19, 0.22, 0.23, 0.25, 0.26 0.22 1.07
Polished rice < 0.01, < 0.02 (3), < 0.03 (3)
< 0.01 0.1
Rice hulls 4.6
4.6 22.3 37.3
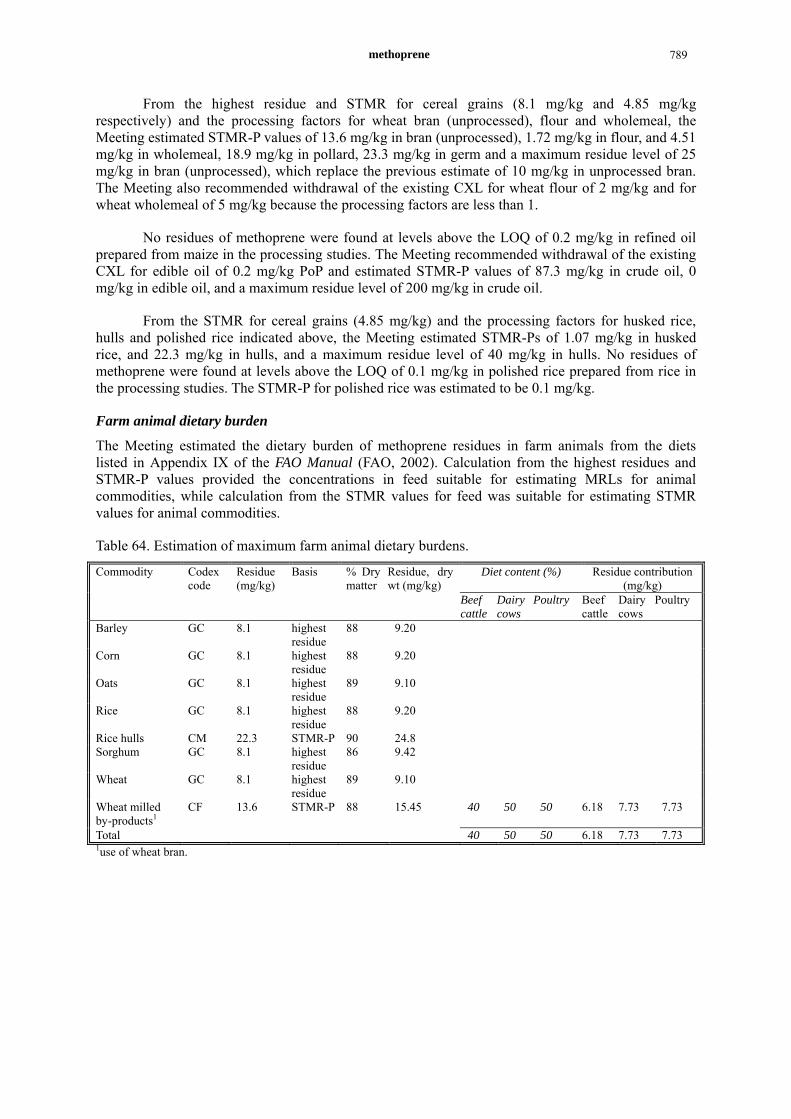
methoprene 789
From the highest residue and STMR for cereal grains (8.1 mg/kg and 4.85 mg/kg respectively) and the processing factors for wheat bran (unprocessed), flour and wholemeal, the Meeting estimated STMR-P values of 13.6 mg/kg in bran (unprocessed), 1.72 mg/kg in flour, and 4.51 mg/kg in wholemeal, 18.9 mg/kg in pollard, 23.3 mg/kg in germ and a maximum residue level of 25 mg/kg in bran (unprocessed), which replace the previous estimate of 10 mg/kg in unprocessed bran. The Meeting also recommended withdrawal of the existing CXL for wheat flour of 2 mg/kg and for wheat wholemeal of 5 mg/kg because the processing factors are less than 1.
No residues of methoprene were found at levels above the LOQ of 0.2 mg/kg in refined oil prepared from maize in the processing studies. The Meeting recommended withdrawal of the existing CXL for edible oil of 0.2 mg/kg PoP and estimated STMR-P values of 87.3 mg/kg in crude oil, 0 mg/kg in edible oil, and a maximum residue level of 200 mg/kg in crude oil.
From the STMR for cereal grains (4.85 mg/kg) and the processing factors for husked rice, hulls and polished rice indicated above, the Meeting estimated STMR-Ps of 1.07 mg/kg in husked rice, and 22.3 mg/kg in hulls, and a maximum residue level of 40 mg/kg in hulls. No residues of methoprene were found at levels above the LOQ of 0.1 mg/kg in polished rice prepared from rice in the processing studies. The STMR-P for polished rice was estimated to be 0.1 mg/kg.
Farm animal dietary burden
The Meeting estimated the dietary burden of methoprene residues in farm animals from the diets listed in Appendix IX of the FAO Manual (FAO, 2002). Calculation from the highest residues and STMR-P values provided the concentrations in feed suitable for estimating MRLs for animal commodities, while calculation from the STMR values for feed was suitable for estimating STMR values for animal commodities.
Table 64. Estimation of maximum farm animal dietary burdens.
Diet content (%) Residue contribution (mg/kg)
Commodity Codex code
Residue (mg/kg)
Basis % Dry matter
Residue, dry wt (mg/kg)
Beef cattle
Dairy cows
Poultry Beef cattle
Dairy cows
Poultry
Barley GC 8.1 highest residue
88 9.20
Corn GC 8.1 highest residue
88 9.20
Oats GC 8.1 highest residue
89 9.10
Rice GC 8.1 highest residue
88 9.20
Rice hulls CM 22.3 STMR-P 90 24.8 Sorghum GC 8.1 highest
residue 86 9.42
Wheat GC 8.1 highest residue
89 9.10
Wheat milled by-products1
CF 13.6 STMR-P 88 15.45 40 50 50 6.18 7.73 7.73
Total 40 50 50 6.18 7.73 7.73 1use of wheat bran.

Methoprene 790
Table 65. Estimation of median farm animal dietary burdens.
Diet content (%) Residue contribution (mg/kg)
Commodity Codex code
Residue (mg/kg)
Basis % Dry matter
Residue, dry wt (mg/kg)
Beef cattle
Dairy cows
Poultry Beef cattle
Dairy cows
Poultry
Barley GC 4.85 STMR 88 5.51 Corn GC 4.85 STMR 88 5.51 Oats GC 4.85 STMR 89 5.45 Rice GC 4.85 STMR 88 5.51 Rice hulls CM 22.3 STMR-P 90 24.8 Sorghum GC 4.85 STMR 86 5.64 Wheat GC 4.85 STMR 89 5.45 Wheat milled by-products1
CF 13.6 STMR-P 88 15.45 40 50 50 6.18 7.73 7.73
Total 40 50 50 6.18 7.73 7.73 1use of wheat bran.
Farm animal feeding studies
The Meeting received information on residues in the tissues of several steers and a cow, in the milk of lactating cows, and in the egg of laying hens orally administered with [5-14C]-methoprene through the feed.
Lactating dairy cows have been fed methoprene in their feed for 28 days at the levels of 0.1, 0.3 and 1.0 ppm. No residues were found in the muscle tissues at any of the three treatment levels at the limits of detection (0.01 mg/kg). The residues found in kidney, liver, fat (subcutaneous, renal and omental) ranging from < 0.01 – 0.096 mg/kg. No residues of methoprene were found in the milk at the limits of quantitation (0.01 mg/kg) 2 to 28 days after beginning the feeding. No residue data in cream were provided.
A lactating dairy cow was administered methoprene at a rate of 83 ppm daily in feed for four months. Residues were found in milk ranging from 0.29 – 0.72 mg/kg (mean 0.47mg/kg).
A steer was administered methoprene at a rate of 33 ppm daily in feed for fourteen days. Residues were found in fat, muscle and edible offal (liver, kidney, spleen and heart) (1.3 – 2.3 mg/kg in fat, 0.05–0.10 mg/kg in muscle, 0.01–0.06 mg/kg in edible offal).
Three groups of two steers were administered methoprene at rates of 16.7, 33.3 and 167 ppm in feed for fourteen days. No residues were found in liver at any of the three treatment levels at the LOQ (0.01 mg/kg). The residues found in edible offal, muscle, fat ranging from <0.01 – 0.92 mg/kg, <0.01 – 0.39 mg/kg and 0.17 –7.9mg/kg, respectively.
Laying hens were fed methoprene at 25, 50 and 100 ppm in the diet for varying periods between 14 and 63 days. At these three administered rates, residues found in poultry meat ranged from < 0.01 – 0.032 mg/kg, < 0.01 – 0.074 mg/kg, and < 0.01–0.302 mg/kg, respectively. The residues found in egg ranging from < 0.01 – 0.045 mg/kg, < 0.01 – 0.054 mg/kg and < 0.01 – 0.201 mg/kg, respectively. In all of the studies, there was also a withdrawal period of varying duration. At all three treatment levels, residues in poultry meat and egg decreased rapidly as withdrawal periods increased.
Animal commodity maximum residue levels
The dietary burden for the dairy cow was 7.73 mg/kg, below the feeding level (83 ppm) and the dietary burden for the steers was 6.18 mg/kg, below the lowest level in the feeding study (16.7 ppm in the feed). Therefore the resulting residues in milk and steer tissues were calculated by applying the respective transfer factors (transfer factor = residue level in tissue or milk ÷ residue level in feed) to the estimated dietary burden. In the feeding study the highest residue levels in tissues were used to calculate the highest likely mammal commodity residue levels and mean residue levels in milk and tissues were used to estimate the mammal commodity STMRs (Table 66).
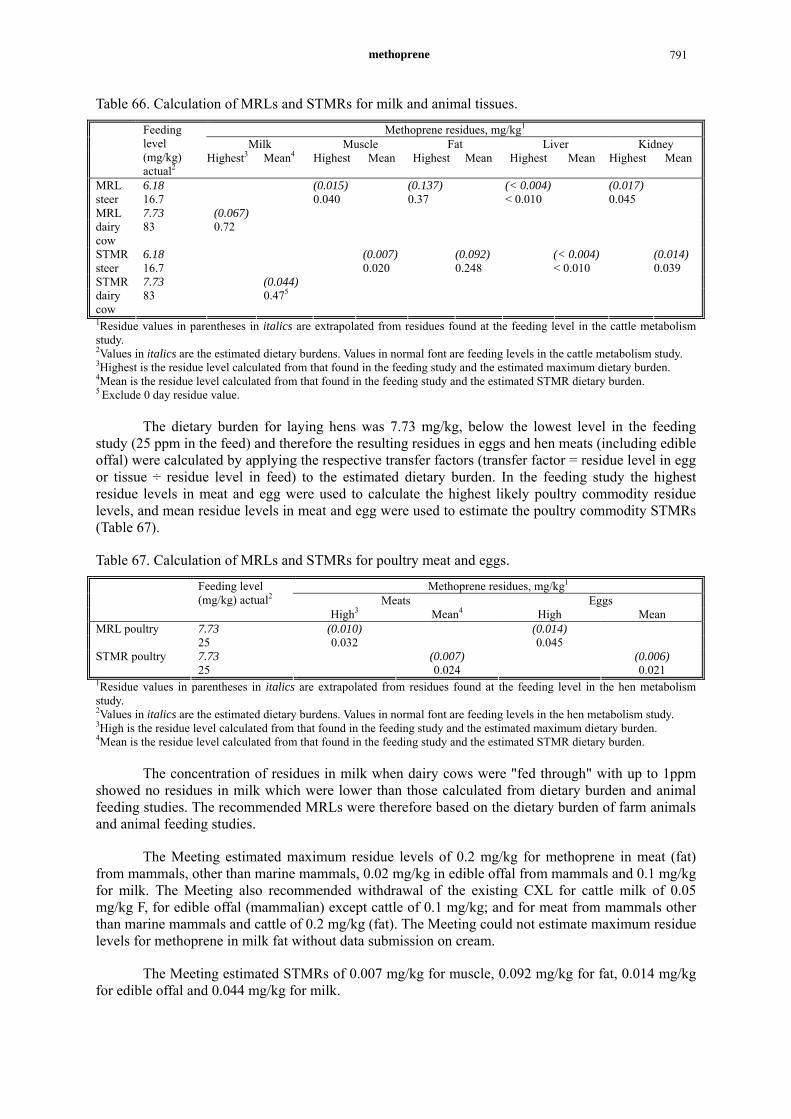
methoprene 791
Table 66. Calculation of MRLs and STMRs for milk and animal tissues.
Methoprene residues, mg/kg1
Milk Muscle Fat Liver Kidney Feeding
level (mg/kg) actual2
Highest3 Mean4 Highest Mean Highest Mean Highest Mean Highest Mean
6.18 (0.015) (0.137) (< 0.004) (0.017) MRL steer 16.7 0.040 0.37 < 0.010 0.045
7.73 (0.067) MRL dairy cow
83 0.72
6.18 (0.007) (0.092) (< 0.004) (0.014) STMR steer 16.7 0.020 0.248 < 0.010 0.039
7.73 (0.044) STMR dairy cow
83 0.475
1Residue values in parentheses in italics are extrapolated from residues found at the feeding level in the cattle metabolism study. 2Values in italics are the estimated dietary burdens. Values in normal font are feeding levels in the cattle metabolism study. 3Highest is the residue level calculated from that found in the feeding study and the estimated maximum dietary burden. 4Mean is the residue level calculated from that found in the feeding study and the estimated STMR dietary burden. 5 Exclude 0 day residue value.
The dietary burden for laying hens was 7.73 mg/kg, below the lowest level in the feeding study (25 ppm in the feed) and therefore the resulting residues in eggs and hen meats (including edible offal) were calculated by applying the respective transfer factors (transfer factor = residue level in egg or tissue ÷ residue level in feed) to the estimated dietary burden. In the feeding study the highest residue levels in meat and egg were used to calculate the highest likely poultry commodity residue levels, and mean residue levels in meat and egg were used to estimate the poultry commodity STMRs (Table 67).
Table 67. Calculation of MRLs and STMRs for poultry meat and eggs.
Methoprene residues, mg/kg1
Meats Eggs Feeding level
(mg/kg) actual2
High3 Mean4 High Mean 7.73 (0.010) (0.014) MRL poultry 25 0.032 0.045 7.73 (0.007) (0.006) STMR poultry 25 0.024 0.021
1Residue values in parentheses in italics are extrapolated from residues found at the feeding level in the hen metabolism study. 2Values in italics are the estimated dietary burdens. Values in normal font are feeding levels in the hen metabolism study. 3High is the residue level calculated from that found in the feeding study and the estimated maximum dietary burden. 4Mean is the residue level calculated from that found in the feeding study and the estimated STMR dietary burden.
The concentration of residues in milk when dairy cows were "fed through" with up to 1ppm showed no residues in milk which were lower than those calculated from dietary burden and animal feeding studies. The recommended MRLs were therefore based on the dietary burden of farm animals and animal feeding studies.
The Meeting estimated maximum residue levels of 0.2 mg/kg for methoprene in meat (fat) from mammals, other than marine mammals, 0.02 mg/kg in edible offal from mammals and 0.1 mg/kg for milk. The Meeting also recommended withdrawal of the existing CXL for cattle milk of 0.05 mg/kg F, for edible offal (mammalian) except cattle of 0.1 mg/kg; and for meat from mammals other than marine mammals and cattle of 0.2 mg/kg (fat). The Meeting could not estimate maximum residue levels for methoprene in milk fat without data submission on cream.
The Meeting estimated STMRs of 0.007 mg/kg for muscle, 0.092 mg/kg for fat, 0.014 mg/kg for edible offal and 0.044 mg/kg for milk.
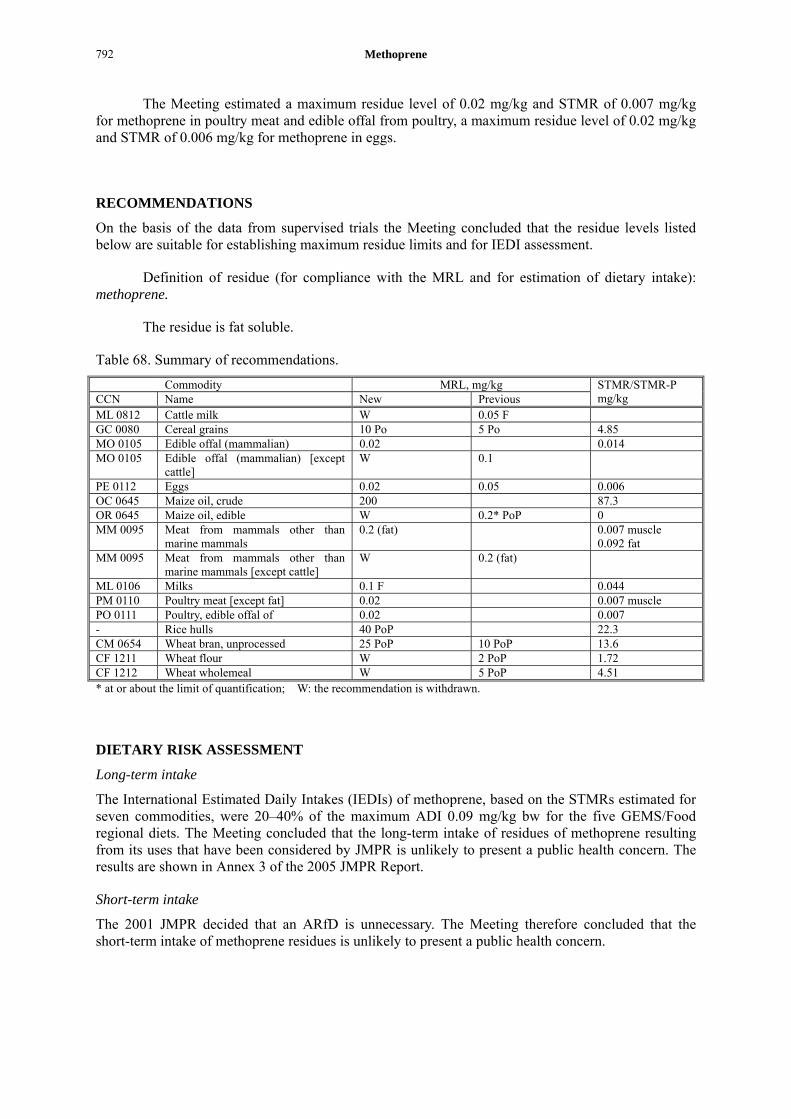
Methoprene 792
The Meeting estimated a maximum residue level of 0.02 mg/kg and STMR of 0.007 mg/kg for methoprene in poultry meat and edible offal from poultry, a maximum residue level of 0.02 mg/kg and STMR of 0.006 mg/kg for methoprene in eggs.
RECOMMENDATIONS
On the basis of the data from supervised trials the Meeting concluded that the residue levels listed below are suitable for establishing maximum residue limits and for IEDI assessment.
Definition of residue (for compliance with the MRL and for estimation of dietary intake): methoprene.
The residue is fat soluble.
Table 68. Summary of recommendations.
Commodity MRL, mg/kg CCN Name New Previous
STMR/STMR-P mg/kg
ML 0812 Cattle milk W 0.05 F GC 0080 Cereal grains 10 Po 5 Po 4.85 MO 0105 Edible offal (mammalian) 0.02 0.014 MO 0105 Edible offal (mammalian) [except
cattle] W 0.1
PE 0112 Eggs 0.02 0.05 0.006 OC 0645 Maize oil, crude 200 87.3 OR 0645 Maize oil, edible W 0.2* PoP 0 MM 0095 Meat from mammals other than
marine mammals 0.2 (fat) 0.007 muscle
0.092 fat MM 0095 Meat from mammals other than
marine mammals [except cattle] W 0.2 (fat)
ML 0106 Milks 0.1 F 0.044 PM 0110 Poultry meat [except fat] 0.02 0.007 muscle PO 0111 Poultry, edible offal of 0.02 0.007 - Rice hulls 40 PoP 22.3 CM 0654 Wheat bran, unprocessed 25 PoP 10 PoP 13.6 CF 1211 Wheat flour W 2 PoP 1.72 CF 1212 Wheat wholemeal W 5 PoP 4.51 * at or about the limit of quantification; W: the recommendation is withdrawn.
DIETARY RISK ASSESSMENT
Long-term intake
The International Estimated Daily Intakes (IEDIs) of methoprene, based on the STMRs estimated for seven commodities, were 20–40% of the maximum ADI 0.09 mg/kg bw for the five GEMS/Food regional diets. The Meeting concluded that the long-term intake of residues of methoprene resulting from its uses that have been considered by JMPR is unlikely to present a public health concern. The results are shown in Annex 3 of the 2005 JMPR Report.
Short-term intake
The 2001 JMPR decided that an ARfD is unnecessary. The Meeting therefore concluded that the short-term intake of methoprene residues is unlikely to present a public health concern.
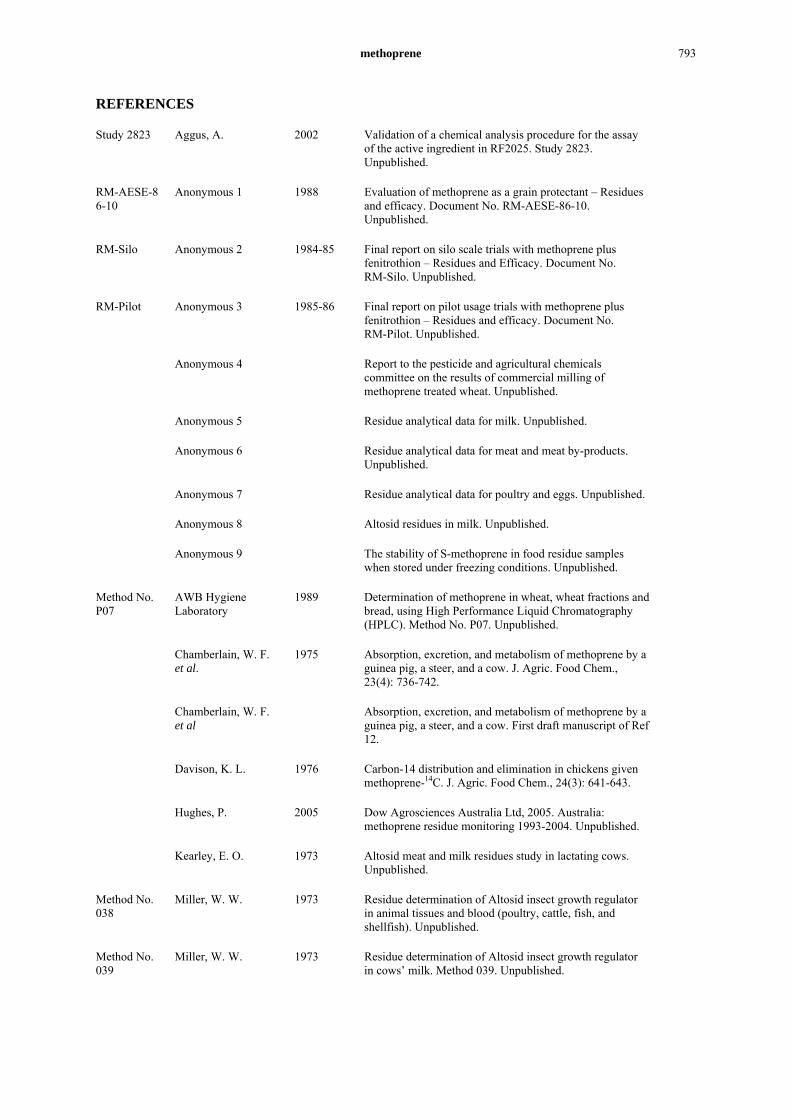
methoprene 793
REFERENCES
Study 2823 Aggus, A. 2002 Validation of a chemical analysis procedure for the assay of the active ingredient in RF2025. Study 2823. Unpublished.
RM-AESE-86-10
Anonymous 1 1988 Evaluation of methoprene as a grain protectant – Residues and efficacy. Document No. RM-AESE-86-10. Unpublished.
RM-Silo Anonymous 2 1984-85 Final report on silo scale trials with methoprene plus fenitrothion – Residues and Efficacy. Document No. RM-Silo. Unpublished.
RM-Pilot Anonymous 3 1985-86 Final report on pilot usage trials with methoprene plus fenitrothion – Residues and efficacy. Document No. RM-Pilot. Unpublished.
Anonymous 4 Report to the pesticide and agricultural chemicals committee on the results of commercial milling of methoprene treated wheat. Unpublished.
Anonymous 5 Residue analytical data for milk. Unpublished.
Anonymous 6 Residue analytical data for meat and meat by-products. Unpublished.
Anonymous 7 Residue analytical data for poultry and eggs. Unpublished.
Anonymous 8 Altosid residues in milk. Unpublished.
Anonymous 9 The stability of S-methoprene in food residue samples when stored under freezing conditions. Unpublished.
Method No. P07
AWB Hygiene Laboratory
1989 Determination of methoprene in wheat, wheat fractions and bread, using High Performance Liquid Chromatography (HPLC). Method No. P07. Unpublished.
Chamberlain, W. F. et al.
1975 Absorption, excretion, and metabolism of methoprene by a guinea pig, a steer, and a cow. J. Agric. Food Chem., 23(4): 736-742.
Chamberlain, W. F. et al
Absorption, excretion, and metabolism of methoprene by a guinea pig, a steer, and a cow. First draft manuscript of Ref 12.
Davison, K. L. 1976 Carbon-14 distribution and elimination in chickens given methoprene-14C. J. Agric. Food Chem., 24(3): 641-643.
Hughes, P. 2005 Dow Agrosciences Australia Ltd, 2005. Australia: methoprene residue monitoring 1993-2004. Unpublished.
Kearley, E. O. 1973 Altosid meat and milk residues study in lactating cows. Unpublished.
Method No. 038
Miller, W. W. 1973 Residue determination of Altosid insect growth regulator in animal tissues and blood (poultry, cattle, fish, and shellfish). Unpublished.
Method No. 039
Miller, W. W. 1973 Residue determination of Altosid insect growth regulator in cows’ milk. Method 039. Unpublished.
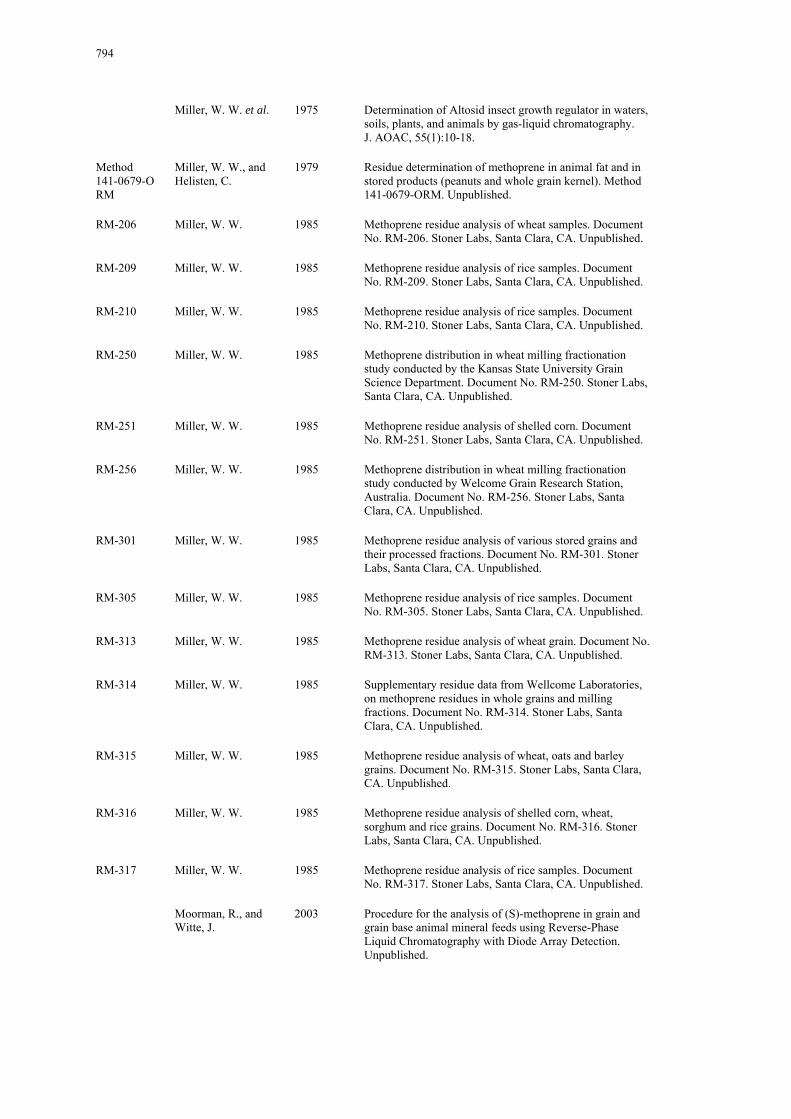
794
Miller, W. W. et al. 1975 Determination of Altosid insect growth regulator in waters, soils, plants, and animals by gas-liquid chromatography. J. AOAC, 55(1):10-18.
Method 141-0679-ORM
Miller, W. W., and Helisten, C.
1979 Residue determination of methoprene in animal fat and in stored products (peanuts and whole grain kernel). Method 141-0679-ORM. Unpublished.
RM-206 Miller, W. W. 1985 Methoprene residue analysis of wheat samples. Document No. RM-206. Stoner Labs, Santa Clara, CA. Unpublished.
RM-209 Miller, W. W. 1985 Methoprene residue analysis of rice samples. Document No. RM-209. Stoner Labs, Santa Clara, CA. Unpublished.
RM-210 Miller, W. W. 1985 Methoprene residue analysis of rice samples. Document No. RM-210. Stoner Labs, Santa Clara, CA. Unpublished.
RM-250 Miller, W. W. 1985 Methoprene distribution in wheat milling fractionation study conducted by the Kansas State University Grain Science Department. Document No. RM-250. Stoner Labs, Santa Clara, CA. Unpublished.
RM-251 Miller, W. W. 1985 Methoprene residue analysis of shelled corn. Document No. RM-251. Stoner Labs, Santa Clara, CA. Unpublished.
RM-256 Miller, W. W. 1985 Methoprene distribution in wheat milling fractionation study conducted by Welcome Grain Research Station, Australia. Document No. RM-256. Stoner Labs, Santa Clara, CA. Unpublished.
RM-301 Miller, W. W. 1985 Methoprene residue analysis of various stored grains and their processed fractions. Document No. RM-301. Stoner Labs, Santa Clara, CA. Unpublished.
RM-305 Miller, W. W. 1985 Methoprene residue analysis of rice samples. Document No. RM-305. Stoner Labs, Santa Clara, CA. Unpublished.
RM-313 Miller, W. W. 1985 Methoprene residue analysis of wheat grain. Document No. RM-313. Stoner Labs, Santa Clara, CA. Unpublished.
RM-314 Miller, W. W. 1985 Supplementary residue data from Wellcome Laboratories, on methoprene residues in whole grains and milling fractions. Document No. RM-314. Stoner Labs, Santa Clara, CA. Unpublished.
RM-315 Miller, W. W. 1985 Methoprene residue analysis of wheat, oats and barley grains. Document No. RM-315. Stoner Labs, Santa Clara, CA. Unpublished.
RM-316 Miller, W. W. 1985 Methoprene residue analysis of shelled corn, wheat, sorghum and rice grains. Document No. RM-316. Stoner Labs, Santa Clara, CA. Unpublished.
RM-317 Miller, W. W. 1985 Methoprene residue analysis of rice samples. Document No. RM-317. Stoner Labs, Santa Clara, CA. Unpublished.
Moorman, R., and Witte, J.
2003 Procedure for the analysis of (S)-methoprene in grain and grain base animal mineral feeds using Reverse-Phase Liquid Chromatography with Diode Array Detection. Unpublished.
methoprene 795
Study No. 2766
Nguyen, J., et al. 2001 Analysis of methoprene and its potential degradates in methoprene treated pond water after exposure to natural sunlight and atmospheric conditions. Study No. 2766. Unpublished.
Quistad, G. B., et al. 1974a Cholesterol and bile acids via acetate from the insect juvenile hormone analog methoprene. Life Sci., 15: 1797-1804.
Quistad, G. B., et al. 1974b Environmental degradation of the insect growth regulator methoprene (isopropyl (2E,4E)-11-methoxy-3,7,11-trimethyl-2,4-dodecadienoate). III. Metabolism by alfalfa and rice. J. Agric. Food Chem., 22(4): 582-589.
Quistad, G. B., et al. 1975a Environmental degradation of the insect growth regulator methoprene (isopropyl (2E,4E)-11-methoxy-3,7,11- trimethyl-2,4-dodecadienoate). III. Photodecomposition. J. Agric. Food Chem., 23(2): 299-303.
Quistad, G. B., et al. 1975b Environmental degradation of the insect growth regulator methoprene. VII. Bovine metabolism to cholesterol and related natural products. J. Agric. Food Chem., 23(4): 743-749.
Quistad, G. B., et al. 1975c Environmental degradation of the insect growth regulator methoprene. VIII. Bovine metabolism to natural products in milk and blood. J. Agric. Food Chem., 23(4): 750-753.
Quistad, G. B., et al. 1976 Environmental degradation of the insect growth regulator methoprene. X. Chicken metabolism. J. Agric. Food Chem., 24(3): 644-648.
Rowlands, D. G. 1976 The uptake and metabolism by stored wheat grains of an insect juvenile hormone and two insect hormone mimics. J. Stored Prod. Res., 12: 35-41.
Schooley, D. A. et al. 1975a Environmental degradation of the insect growth regulator methoprene (isopropyl (2E,4E)-11-methoxy-3,7,11- trimethyl-2,4- dodecadienoate). II. Metabolism by aquatic microorganisms. J. Agric. Food Chem., 23(2): 293-298.
Schooley, D. A. et al. 1975b Environmental degradation of the insect growth regulator isopropyl (2E,4E)-11-methoxy-3,7,11-trimethyl-2,4-dodecadienoate (methoprene). IV. Soil metabolism. J. Agric. Food Chem., 23(3): 369-373.
Simpson, P. and Hamilton, D.
2005 Methoprene. Queensland Department of Primary Industries & Fisheries Submission for JMPR 2005. Unpublished.
Method ADL-124
Smith, B. 1985a Determination of methoprene residues in stored products (whole grain). Method ADL-124. Report No. 66/85. Unpublished.
Method ADL-124, III. Addendum
Smith, B. 1985b Official methods and method validations for analysis of methoprene in stored grains and their processed fractions (Australian studies). Method ADL-124, III. Addendum (Methanol extraction of bread—preferred method). Unpublished.

796
Method CR05.1
Symbio Laboratories 2004 Determination of organophosphorus and organochlorine type pesticides, synthetic pyrethroids, carbamates, fungicides, acaracides and polychlorinated biphenyls in grain and grain products by gas chromatography. Method CR05.1, Australia. Unpublished.
Study 3040 Van Gundy, D. 2003 Residue analysis of methoprene treated wheat. Study 3040. Unpublished
Wang, S., et al. 2002 Rapid enzyme immunoassays for the detection of carbaryl and methoprene in grains. J. Environ. Sci. Health. B37 (6): 521-53.