ch6. small signal analysis of llc resonant converter yang chapter 6. small signal analysis of llc...
TRANSCRIPT

Bo Yang Chapter 6. Small signal analysis of LLC resonant converter
187
Chapter 6
Small signal analysis and control design of LLC converter
6.1 Introduction
In previous chapters, the characteristic, design and advantages of LLC
resonant converter were discussed. As demonstrated in chapter 3, LLC resonant
converter has very low switching loss. Because of low voltage stress on secondary
rectifier, low voltage rated diodes could be used, conduction loss is also much
reduced compared with PWM converter. With DC analysis and understanding of
the operation of LLC resonant converter, power stage parameters could be
designed to meet given specifications.
To use LLC resonant converter as front end DC/DC converter, still another
important issue need to be investigated: small signal characteristic. Small signal
characteristic is essential for the feedback loop design. For front end DC/DC
converter, feedback control is needed to provide a tight regulation of output
voltage with load and input variation, which happens all the time for front end
DC/DC converter. In Figure 6.1, the whole converter with control circuit is
shown. For LLC resonant converter, variable frequency control is used. To
achieve variable frequency control, instead of PWM comparator in PWM
controller, a Voltage Controlled Oscillator (VCO) is used to convert control

Bo Yang Chapter 6. Small signal analysis of LLC resonant converter
188
voltage Vc to the variable frequency square wave, which is used to drive the
switches. To design the compensator, we have to know the small signal
characteristic of the converter. In this part, the small signal characteristic of LLC
resonant converter with VCO will be investigated. Base on the small signal
characteristic of LLC resonant converter, the compensator design will be
investigated later.
Figure 6.1 LLC resonant converter with feedback control
For PWM converter, state space average method has been widely used. State
space average method provides simple and accurate solution for up to half
switching frequency. It has been verified and the theoretical system has been well
established. With the small signal model derived from state space average
method, small signal characteristic of PWM converter can be studied and control
circuit can be designed accordingly.

Bo Yang Chapter 6. Small signal analysis of LLC resonant converter
189
Unfortunately, state space averaging method cannot be applied for frequency
controlled resonant converter. This is because of the totally different ways of
energy processing methods for these two kinds of power converter. For PWM
converter, the natural frequency of the linear network (output filter) is much lower
than the switching frequency. The modulation of the converter is achieved
through the low frequency content in the control signal. With this character, the
average method can provide approximate linear solution of the nonlinear state
equations. The derived model has a continuous form and is accurate up to half of
switching frequency. However, for resonant converter, the switching frequency is
close to the natural frequency of the linear network (resonant tank). The states
contain mainly switching frequency harmonics instead of low frequency content
in PWM converter. The modulation of the resonant converter is achieved by the
interaction between switching frequency and resonant frequency. Since average
method will eliminate the information of switching frequency, it cannot predict
the dynamic performance of resonant converter [D-6][D-7].
In the past, several methods were tried to solve this problem. Among these
methods, some made too many simplifications that the results cannot match with
test results. Some of them are very complex and difficult to use [D-8][D-9].
In this dissertation, two methods were used. One is Extended Describing
Function method developed by Dr. Eric X. Yang. This method is a simplified
version of describing function method. A software package in Matlab is also

Bo Yang Chapter 6. Small signal analysis of LLC resonant converter
190
developed to realize this method. With the software package, small signal
characteristic of a converter could be derived with short simulation time.
Another method used in this dissertation is a simulation-based method. This
method uses simulation tools to emulate the function of impedance analyzer to get
the small signal response of the converter. The method is based on time domain
switching model simulation, which is a necessary for every converter design. So
no extra modeling effort is needed for this method. It could be used to any
periodical operating converter. It is a very effective method to deal with complex
topology, which is difficult to deal with conventional method. Also, the impact of
parasitic could also be easily included into this method.
This chapter is organized in following way. First, two methods: extended
describing function method and simulation-based method, will be introduced.
With these two methods, small signal characteristic of LLC resonant converter
will be studied. Load impact, and resonant tank value impact will be studied with
these tools. Finally, the results from these two methods will be compared with test
results.
With the information of small signal characteristic of LLC resonant converter,
the design of the compensator will be discussed.

Bo Yang Chapter 6. Small signal analysis of LLC resonant converter
191
6.2 Extended Describing Function analysis
Dr. Eric X. Yang published extended describing function method in [D-12].
This method is a simplified modeling method based on the describing function
method published by J. O. Groves [D-9]. With this method, the small signal
model of a periodical operating converter could be derived with any order of
harmonics of switching frequency taken into consideration. This method could be
used for PWM converter. With only DC components of state variables taken into
consideration, it is same as state space averaging method. For resonant converter,
since switching frequency and its harmonics also play important roles in the
power transfer process. State space averaging method could not be applied. With
extended describing function, high order harmonics could be included so that an
accurate model could be derived. The detail of extended describing function
method and introduction of the software package could be found in [D-12]. The
process of building the model for extended describing function is discussed in
Appendix D. The model file of LLC resonant converter needed to perform the
analysis are attached in Appendix D too.
In next part, the small signal characteristic of LLC resonant converter will be
discussed using extended describing function method. The circuit parameters used
for this analysis is shown in Figure 6.2.

Bo Yang Chapter 6. Small signal analysis of LLC resonant converter
192
Figure 6.2 Circuit parameters for extended describing function analysis
For extended describing function method, the order of harmonics needed for
accurate model is one thing needs to be determined before doing the analysis. For
traditional resonant topologies like SRC and PRC, only the fundamental harmonic
of switching frequency will be sufficient to provide an accurate small signal
model [D-11][D-12]. For LLC resonant converter, though, it is a multi resonant
converter. The fundamental component of switching frequency might not be
enough.
In Figure 6.3, the control to output transfer function is shown for region 1
(switching frequency higher than series resonant frequency). As seen from the
graph, in region 1, fundamental component seems to be enough. With higher
order of harmonics took into consideration, the model will not be improved
significantly. This is understandable since in region 1, LLC converter operates
very similar to SRC.

Bo Yang Chapter 6. Small signal analysis of LLC resonant converter
193
Figure 6.3 Impact of harmonic order on the accuracy of EDF method in region 1
In Figure 6.4, same analysis was done in region 2 (switching frequency lower
than series resonant frequency). In region 2, fundamental component is not
enough. With more harmonics considered, the model will be different from only
consider the fundamental component. But after the 5th harmonic, include more
harmonics doesn't make any significant difference anymore. In the later
simulation, we will use 1st, 3rd and 5th harmonic for analysis. This result is also
reasonable because in region 2, LLC resonant converter is working as a multi
resonant converter. During each switching cycle, the resonant frequency changes
as topology modes progress.

Bo Yang Chapter 6. Small signal analysis of LLC resonant converter
194
Figure 6.4 Impact of harmonic order on the accuracy of EDF method in region 2
With up to 5th harmonic take into consideration; the small signal characteristic
of LLC resonant converter is derived with extended describing function method.
With this requirement, the simulation time is extended.
Another problem with extended describing function method is that to build the
model, every operating modes of the circuit need to be identified. For LLC
resonant converter, it has many different operating modes as shown in Appendix
B. It would be very difficult to build the model file. Next, time domain
simulation-based method will be discussed, which could solve these problems.

Bo Yang Chapter 6. Small signal analysis of LLC resonant converter
195
6.3 Time domain simulation method
This method uses brute force simulation to derive the small signal
characteristic of LLC resonant converter. It emulates the function of a network
analyzer. To perform this analysis, only the switching model of the converter is
needed, there is no other model needed, which makes this method very attractive.
The procedure of this method is shown in Figure 6.5.
Figure 6.5 Procedure for simulation method to analyze small signal characteristic
First step of this method is to simulate the converter at given operating point
(Load condition, switching frequency and input voltage) without perturbation as
shown in Figure 6.6. After simulate to steady state, record all the information
needed as the base information.
Second step is to simulate the converter with perturbation added to where
interested. For example, to investigate the control to output characteristic, a
perturbation will be added to the control voltage as shown in Figure 6.7. This

Bo Yang Chapter 6. Small signal analysis of LLC resonant converter
196
perturbation will be a small amplitude sinusoidal signal with known phase
information. The amplitude is small so that the converter operation modes will not
change with perturbation added. With perturbation injected, make another time
domain simulation to steady state and record all the information interested.
Figure 6.6 Circuit setup for first step simulation
Figure 6.7 Circuit setup for second step simulation

Bo Yang Chapter 6. Small signal analysis of LLC resonant converter
197
Next, the results of previous two simulations will be compared. The impact of
the injected perturbation on output variable could be derived. This will give us the
small signal characteristic of the converter at one perturbation frequency. Repeat
above steps for the frequency range interested, a complete small signal
characteristic at given operating condition could be extracted. If other operating
point is interested, change the switching circuit model so that the converter is
operated at new operating point.
As can be seen, this method asks for extensive simulation power. Fortunately,
with advanced software and computer, this is not so time consuming a method.
First, with Simplis software, above process could be automated. The software
could do the sweeping of frequency and operating condition as set. It also
performs the extraction of small signal characteristic after each simulation. With
this software, one bode plot of the converter at given operating condition could be
simulated in two hours.
With simulation method, a SRC was analyzed. The results were shown in
Appendix C.
6.3.1 Small signal characteristic of LLC resonant converter
With extended describing function method, the characteristic in region 1 is
shown in Figure 6.8. It is a three poles and one zero system.

Bo Yang Chapter 6. Small signal analysis of LLC resonant converter
198
As seen from the graph, in region 1, there are one beat frequency double pole,
one low frequency pole and one ESR zero. As switching frequency moves close
to resonant frequency, the beat frequency double pole will move to lower
frequency. When the switching frequency is very close to resonant frequency, the
beat frequency double pole will eventually split and becomes two real poles. One
moves to higher frequency and one move to lower frequency as switching
frequency continuous move close to resonant frequency. Finally, the pole moves
to low frequency will combine with the low frequency pole caused by the output
filter and form a double pole. This characteristic is same as could be observed in
SRC converter. In this analysis, the ESR of output capacitor is considered. This
ESR will introduce an ESR zero at fixed frequency.
Figure 6.8 System poles and zeros of LLC in region 1 with different switching frequency

Bo Yang Chapter 6. Small signal analysis of LLC resonant converter
199
Audio susceptibility, input conductance and output impedance in region 1 are
also shown in Figure 6.9, Figure 6.10, and Figure 6.11.
Figure 6.9 Input conductance of LLC converter in region 1
Figure 6.10 Output impedance of LLC resonant converter in region 1

Bo Yang Chapter 6. Small signal analysis of LLC resonant converter
200
Figure 6.11 Audio susceptibility of LLC converter in region 1
The characteristic in region 2 is shown in Figure 6.12. In this region, the
system has some very different characteristic. A Right Half Plane Zero is
observable in this region. This RHZ moves with switching frequency.
Fortunately, this RHZ doesn’t shift to very low frequency region even when
switching frequency is very low. This is good since it is not easy to deal with the
RHZ.
In left half plane, there are three poles and one zero. They are pretty stable
compared with poles and zero in region 1. In region 1, when switching frequency
moves close to resonant frequency, one pole moves to higher frequency. When
the converter runs into region 2, as switching frequency further reduces, this pole
will move back to lower frequency, but not so much. In this region, the switching
frequency has less impact on the double pole at low frequency and no impact on
the ESR zero.

Bo Yang Chapter 6. Small signal analysis of LLC resonant converter
201
Figure 6.12 System poles and zeros of LLC converter in region 2
Audio susceptibility, input conductance and output impedance in region 2 are
also shown in Figure 6.13, Figure 6.14, and Figure 6.15.
Figure 6.13 Input conductance of LLC resonant converter in region 2

Bo Yang Chapter 6. Small signal analysis of LLC resonant converter
202
Figure 6.14 Output impedance of LLC resonant converter in region 2
Figure 6.15 Audio susceptibility of LLC resonant converter in region 2

Bo Yang Chapter 6. Small signal analysis of LLC resonant converter
203
From above analysis results, the small signal model of LLC resonant
converter could be extracted. In region 1, this converter is very similar to the
series resonant converter. In region 2, though, it is very different. One RHZ could
be observed in region 2. The poles and zero in left half plane are very stable with
the changing of switching frequency, which is very different from normal
resonant converter.
The problem of this method is that to get accurate small signal model of the
converter, a good model file is needed. This is a very time consuming process
especially when the converter could run into many different operating modes.
Another problem is that the accuracy is depends on the order of harmonics took
into consideration. With higher order of harmonics, the simulation time and
convergence problem will be difficult to deal with. Due to the difficulties to build
the model file, it is not easy to take the parasitic components into consideration. In
next part, the time domain simulation method will be discussed.
Next, simulation based method will be used. The simulation is performed on
LLC resonant converter as shown in Figure 6.16. The resonant frequency of Cr
and Lr is designed at 250kHz. Here full load condition is used to analyze the
small signal characteristic. Later load impact will be investigated.

Bo Yang Chapter 6. Small signal analysis of LLC resonant converter
204
Figure 6.16 LLC converter setup for small signal analysis
In Figure 6.18, the small signal characteristic of LLC resonant converter is
shown. The simulation is performed for a switching frequency range from
100kHz to 400kHz to cover all three operating regions. In the small signal
characteristic of LLC resonant converter, three distinctive regions exist
correspond to the three operating regions shown in the DC characteristic. Next the
characteristic of these three regions will be discussed in detail.
For region 1, the converter operates similar as a series resonant converter. The
small signal characteristic is also very similar to SRC. Low frequency pole and
beat frequency double pole could be observed in this region.

Bo Yang Chapter 6. Small signal analysis of LLC resonant converter
205
Figure 6.17 Operating region of LLC resonant converter
Figure 6.18 Bode plot of control to output transfer function for LLC resonant converter

Bo Yang Chapter 6. Small signal analysis of LLC resonant converter
206
Figure 6.19 Bode plot of control to output transfer function of LLC resonant converter in region 1

Bo Yang Chapter 6. Small signal analysis of LLC resonant converter
207
Figure 6.20 Bode plot of control to output transfer function of LLC resonant converter in region 2

Bo Yang Chapter 6. Small signal analysis of LLC resonant converter
208
The characteristic in region 2 is shown in Figure 6.20. Region 2 is a very
interesting region. In this region, the DC characteristic is like a PRC. But for the
small signal characteristic of LLC resonant converter is very stable in this region.
As seen in the graph, there is no beat frequency double pole. As switching
frequency changes, the characteristic doesn't change much.
At low frequency, instead of single pole, now it is a double pole. This double
pole moves as switching frequency changes. Since the switching frequency range
is not so wide, with in region 2, this double pole doesn't move too much.
There is a sign of a right half plane zero exists in this region though. From the
graph, it can be seen that at 30k to 40kHz frequency range, the magnitude of the
characteristic changes slope from -40dB/Dec to -20dB/Dec while the phase is
continue reducing. For front-end application, the bandwidth is normally designed
at 2 to 5kHz. This right half plane zero shouldn't impact too much on the feedback
loop design.
Region 3 is ZCS region, which is not a desired operating region for this
application.
From the simulation results, following observation could be made:
1. There is no beat frequency dynamic problem at the boundary between
region 1 and region 2. This gives us opportunity to operate the converter right at

Bo Yang Chapter 6. Small signal analysis of LLC resonant converter
209
the resonant frequency of Cr and Lr, which is boundary point between region 1
and region 2.
2. In region 1, the converter behaves very similar to SRC. Beat frequency
double pole and low frequency pole could be observed.
3. In region 2, the small signal characteristic of the converter is pretty stable
with switching frequency change.
4. Between region 2 and region 3, beat frequency dynamic could be observed.
The phase of small signal characteristic will jump for 180 degree across the
boundary.
Above analysis is performed at given load. Next the impact of load change on
the small signal characteristic will be investigated.
6.3.2 Impact of load variation on small signal characteristic
In this part, the impact of load variation on the small signal characteristic of
LLC resonant converter will be investigated. The simulations were performed in
region 1 and region 2.
The small signal characteristic of LLC resonant converter with different load
in region 1 (fs=300kHz > fr=250kHz) is shown in Figure 6.21.

Bo Yang Chapter 6. Small signal analysis of LLC resonant converter
210
Figure 6.21 Bode plot of control to output transfer function of LLC resonant converter with load
variation in region 1(fr=250kHz, fs=300kHz)

Bo Yang Chapter 6. Small signal analysis of LLC resonant converter
211
Figure 6.22 Bode plot of control to output transfer function of LLC resonant converter with load
variation in region 1(fr=250kHz, fs=300kHz) (full load to 25% load)

Bo Yang Chapter 6. Small signal analysis of LLC resonant converter
212
Figure 6.23 Bode plot of control to output transfer function of LLC resonant converter with load
variation in region 1(fr=250kHz, fs=300kHz) (25% to no load)

Bo Yang Chapter 6. Small signal analysis of LLC resonant converter
213
From the graph, several things could be observed. With load changes, the
small signal characteristic of LLC resonant converter could be divided into two
regions as shown in Figure 6.22 and Figure 6.23. In the first region, the
characteristic doesn't change much. Within the region, the converter still works in
continuous conduction mode. When load reduced to some level, the converter will
run into DCM as discussed in Appendix B. Then the low frequency pole will
move to lower frequency and beat frequency double pole will move to higher
frequency. At light load, LLC resonant converter could be treated as a first order
system in very wide frequency range.
The small signal characteristic of LLC resonant converter with different load
in region 2 is shown in Figure 6.24. It could be divided into three load ranges
according to different trends in the moving direction of poles and zeros as shown
in Figure 6.25, Figure 6.26 and Figure 6.27.
In first load range, as load decreases, the Q of low frequency double pole will
reduce. The right half plane zero tends to move to higher frequency and
eventually move out of half switching frequency range.
In the second load range, however, the quality factor of low frequency double
pole will increase as load further decrease.
As load continue reduce, the characteristic will come into load range 3. In
load range 3, the low frequency double pole will split. One move to low

Bo Yang Chapter 6. Small signal analysis of LLC resonant converter
214
frequency and one move to high frequency, just as could be observed in PWM
converter.
Figure 6.24 Bode plot of control to output transfer function of LLC resonant converter with load
variation in region 2(fr=250kHz, fs=200kHz)

Bo Yang Chapter 6. Small signal analysis of LLC resonant converter
215
Figure 6.25 Bode plot of control to output transfer function of LLC resonant converter with load
variation in region 2(fr=250kHz, fs=200kHz) (full load to 25% load)

Bo Yang Chapter 6. Small signal analysis of LLC resonant converter
216
Figure 6.26 Bode plot of control to output transfer function of LLC resonant converter with load
variation in region 2(fr=250kHz, fs=200kHz) (25% to 10% load)

Bo Yang Chapter 6. Small signal analysis of LLC resonant converter
217
Figure 6.27 Bode plot of control to output transfer function of LLC resonant converter with load
variation in region 2(fr=250kHz, fs=200kHz) (10% to no load)

Bo Yang Chapter 6. Small signal analysis of LLC resonant converter
218
From above simulation results, one conclusion is that with light load, one low
frequency pole will exist. This needs to be considered when design the
compensator.
6.4 Impact of circuit parameters
In this part, the impact of some components value on the small signal
characteristic of LLC resonant converter will be shown. The components will be
investigated include: output filter capacitor, magnetizing inductance Lm, and
resonant tank impedance.
6.4.1 Impact of output capacitance
In this part, the small signal characteristic of LLC resonant converter with
different Co will be simulated.
Figure 6.28 Simulation setup for output capacitor impact on small signal characteristic
The converter is shown in Figure 6.28, the resonant frequency is 250kHz. The
simulation will be performed in two switching frequency. One frequency is in
region 1 at 300kHz as shown in Figure 6.29. The other simulation is performed in
region 2, with switching frequency at 200kHz as shown in Figure 6.30.

Bo Yang Chapter 6. Small signal analysis of LLC resonant converter
219
From both simulation, Co only impact the low frequency pole and doesn’t
affect high frequency poles.
Figure 6.29 Bode plot of control to output transfer function with different output capacitance with
switching frequency 300kHz(region 1)

Bo Yang Chapter 6. Small signal analysis of LLC resonant converter
220
Figure 6.30 Bode plot of control to output transfer function with different output capacitance with
switching frequency 200kHz(region 2)

Bo Yang Chapter 6. Small signal analysis of LLC resonant converter
221
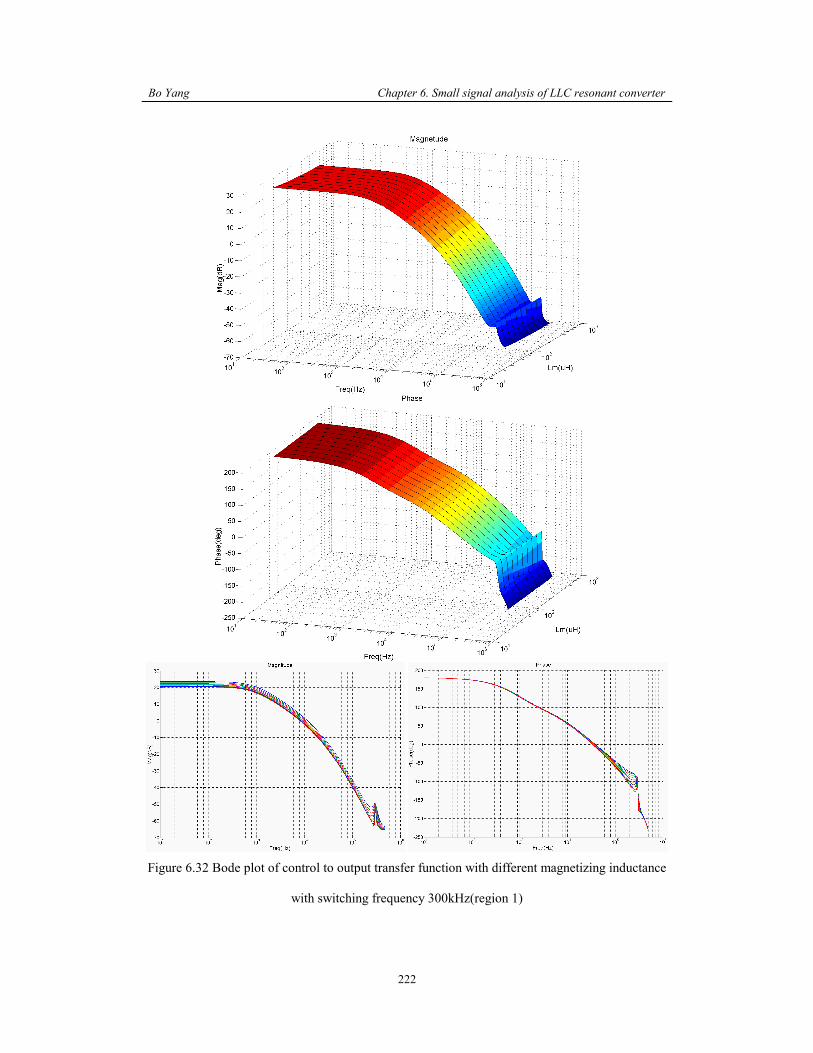
6.4.2 Impact of magnetizing inductance
In this part, the small signal characteristic of LLC resonant converter with
different Lm will be simulated.
The converter been simulated is shown in Figure 6.31, the resonant frequency
is 250kHz. Same as for previous case, two switching frequency points will be
choose. One frequency is in region 1 at 300kHz as shown in Figure 6.32. The
other simulation is performed in region 2, with switching frequency at 200kHz as
shown in Figure 6.33.
Figure 6.31 Simulation setup for magnetizing inductance impact on small signal characteristic
From the simulation in region 1, Lm doesn’t affect the small signal
characteristic in this region at all. With Lm changed by 10 times, the small signal
characteristic is almost constant. In region 2, Lm has great impact on the DC gain
of the small signal characteristic. With larger Lm, the right half plane zero also
tends to shift to lower frequency.
Bo Yang Chapter 6. Small signal analysis of LLC resonant converter
222
Figure 6.32 Bode plot of control to output transfer function with different magnetizing inductance
with switching frequency 300kHz(region 1)

Bo Yang Chapter 6. Small signal analysis of LLC resonant converter
223
Figure 6.33 Bode plot of control to output transfer function with different magnetizing inductance
with switching frequency 200kHz(region 2)

Bo Yang Chapter 6. Small signal analysis of LLC resonant converter
224
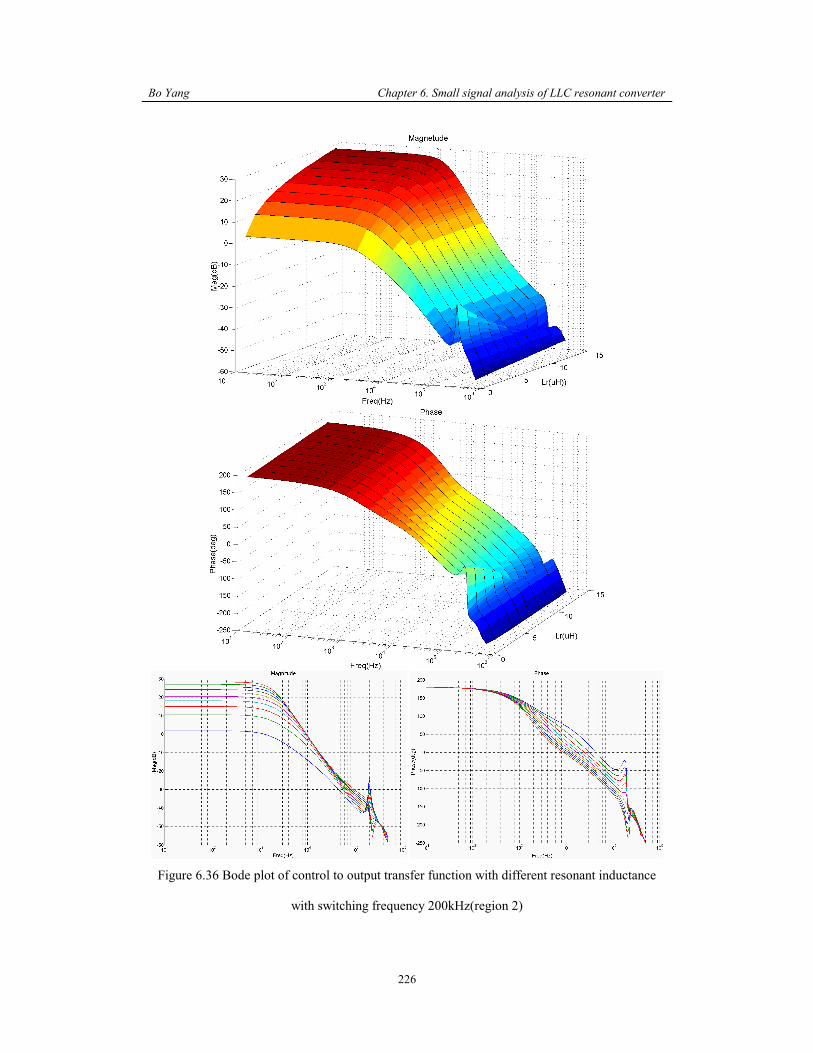
6.4.3 Impact of resonant tank impedance
In this part, the small signal characteristic of LLC resonant converter with
different resonant tank impedance will be simulated. The resonant frequency is
kept constant in the simulation. The converter been simulated is shown in Figure
6.34, the resonant frequency is kept constant at 250kHz, which means as Lr been
changed, Cr will be changed accordingly. Same as for previous case, two
switching frequency points will be choose. The 300kHz case is shown in Figure
6.35. The 200kHz case is shown in Figure 6.36.
Figure 6.34 Simulation setup for resonant tank impedance impact on small signal characteristic
As from the simulation, in region 1, as impedance of resonant tank increases,
which means increase Lr and reduce Cr, the DC gain will increase. This is
understandable since with higher impedance, the Q with given load will increase,
then the slope of the DC characteristic will have larger value, which is the DC
gain in small signal characteristic. Another interesting thing is that the first pole
will move with different resonant tank impedance, which means in LLC resonant
converter, the lowest pole is not determined by output filter only. In region 2, the

Bo Yang Chapter 6. Small signal analysis of LLC resonant converter
225
similar impact on DC gain could be observed. With larger Lr, one low frequency
pole also moves to higher frequency.
Figure 6.35 Bode plot of control to output transfer function with different resonant inductance
with switching frequency 300kHz(region 1)
Bo Yang Chapter 6. Small signal analysis of LLC resonant converter
226
Figure 6.36 Bode plot of control to output transfer function with different resonant inductance
with switching frequency 200kHz(region 2)

Bo Yang Chapter 6. Small signal analysis of LLC resonant converter
227
6.5 Test verification
In this part, a test circuit was built with same parameters as used in the
analysis. The test setup is shown in Figure 6.37.
Figure 6.37 Test setup up for small signal characterization of LLC converter
In Figure 6.38, the results in region 1 with full load are shown for three
methods: test, simulation and extended describing function. From the comparison,
these three results match each other very good.
In Figure 6.39, the results in region 2 with full load are shown for three
methods: test, simulation and extended describing function. From the comparison,
these three results match each other very good.
From the verifications, both methods match test results very well. These two
methods have their pros and cons. For simulation method, it is easy to implement.
With powerful computer and software, it is also fast. The problem is lacking of

Bo Yang Chapter 6. Small signal analysis of LLC resonant converter
228
insight of the model of the converter. It just gives the bode plot of the
characteristic of the converter. If more information is needed, extended describing
function method could be helpful. With extended describing function method,
more information about the small signal characteristic of the converter could be
derived. The drawback is that to build the model, a thorough understanding of the
converter is critical. When the operating modes of the converter are too complex,
this will be a painful process.
Figure 6.38 Bode plot of control to output transfer function at full load in region 1

Bo Yang Chapter 6. Small signal analysis of LLC resonant converter
229
Figure 6.39 Bode plot of control to output transfer function at full load in region 2
6.6 Compensator design for LLC resonant converter
From above analysis, we have a complete picture of the small signal model of
LLC resonant converter. Base on this information, the compensator could be
designed.
First, as seen in the characteristic of LLC resonant converter, the phase at DC
is 180-degree instead of 0-degree as seen for PWM converter. This means from
the control voltage point of view, LLC resonant converter is an inverter. As

Bo Yang Chapter 6. Small signal analysis of LLC resonant converter
230
control voltage increases, output voltage will decrease. This is because of the fact
that for resonant converter to work under ZVS condition, the output voltage will
decrease when switching frequency increases. For voltage-controlled oscillator,
when its input voltage increases, the frequency will increase. For PWM converter,
duty cycle will increase as control voltage increases, which will increase the
output voltage. For PWM converter, the compensator is a negative feedback as
shown in Figure 6.40. For LLC resonant converter, a positive input compensator
is needed as shown in Figure 6.41 because of the negative transfer function of the
converter.
11 12
oc VZZV −=
Figure 6.40 Compensator for PWM converter
22 12
oc VZZV =
Figure 6.41 Compensator structures for LLC resonant converter

Bo Yang Chapter 6. Small signal analysis of LLC resonant converter
231
For LLC resonant converter, its designed operating region is region 2
(switching frequency lower than series resonant frequency). In this region, the
small signal characteristic of LLC resonant converter is pretty stable with
changing of switching frequency. Although a RHZ exists in this region, it never
moves to very low frequency. The more significant impact is the load change.
With light load, one pole will move to very low frequency. With integrator in the
compensator, this might introduce conditional stable situation.
Figure 6.42 Small signal characteristic of LLC converter in region 2
Figure 6.43 Load impact on small signal characteristic of LLC converter in region 2

Bo Yang Chapter 6. Small signal analysis of LLC resonant converter
232
Although region 2 is the designed operating region, converter might operate in
region 1 due to the fact that the intermediate bus is loosely regulated. Load or AC
line transient could cause this voltage rise to as high as 430V. During those
conditions, the converter will operate in region 1. So the characteristic in region 1
also needs to be considered during compensator design. In region 1, the converter
will have a beat frequency double pole and one low frequency pole.
Figure 6.44 Small signal characteristic of LLC converter in region 1
As load changes in region 1, similar phenomenon could be observed as in
region 2. The double pole will split and one moves to high frequency, one moves
to very low frequency.

Bo Yang Chapter 6. Small signal analysis of LLC resonant converter
233
Figure 6.45 Load impact on small signal characteristic of LLC converter in region 1
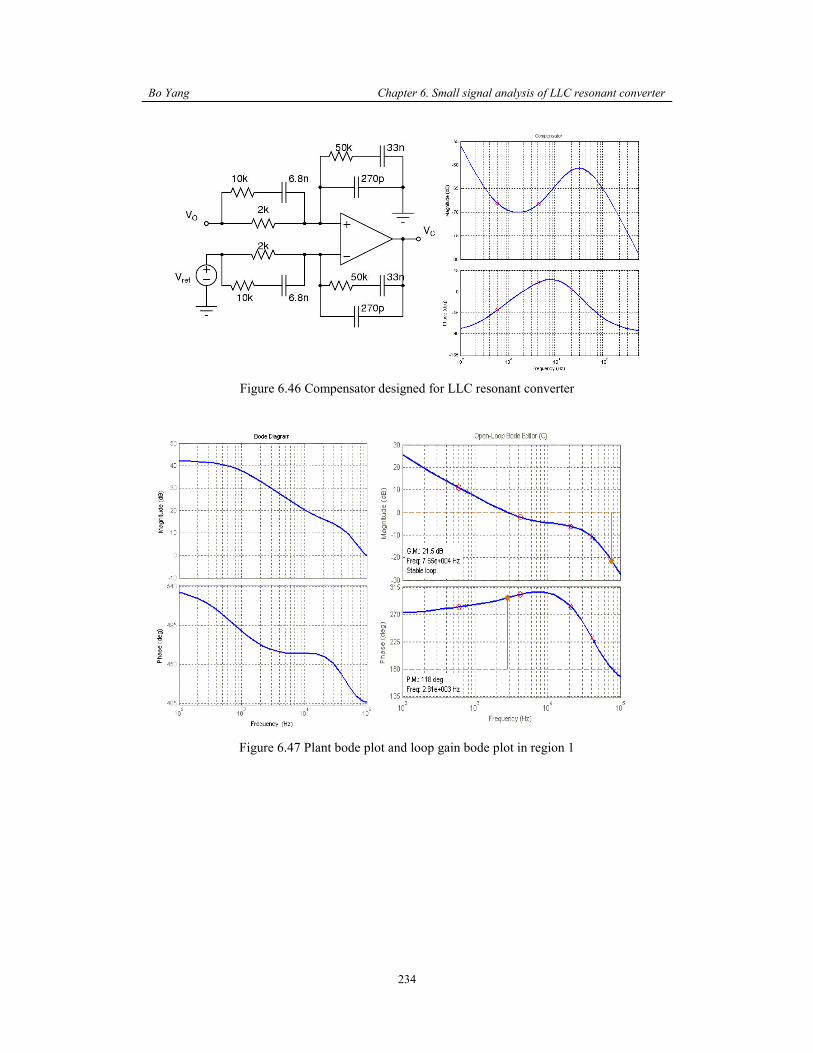
With above information, the compensator could be designed. Since the RHZ
is at pretty high frequency, it will not impact the compensator design so much.
What need to be dealt with are one double pole and one ESR zero. At light load
condition, as one pole will move to low frequency, the low frequency pole need to
be considered. To compensate this system, a compensator with one integrator, 2
poles and 2 zeros is used. The two zeros are placed to compensate the double pole
exists in the system. Another consideration is the low frequency pole due to light
load. With these two considerations, one zero is placed at low frequency to
prevent conditional stable from happening. Another zero is placed around the
double pole. The poles are placed to compensate the ESR zero and provide more
attenuation at switching frequency. The compensator is shown in Figure 6.46.
With this compensator, the loop gain in different operating regions is shown in
Figure 6.47 and Figure 6.48. The test results of LLC resonant converter under
load change are shown in Figure 6.49 and Figure 6.50. The output voltage is
within 5% regulation window during full range load step.
Bo Yang Chapter 6. Small signal analysis of LLC resonant converter
234
Figure 6.46 Compensator designed for LLC resonant converter
Figure 6.47 Plant bode plot and loop gain bode plot in region 1

Bo Yang Chapter 6. Small signal analysis of LLC resonant converter
235
Figure 6.48 Plant bode plot and loop gain bode plot in region 2
Figure 6.49 Test result of load change from no load to full load
Figure 6.50 Test result of load change from full load to no load

Bo Yang Chapter 6. Small signal analysis of LLC resonant converter
236
6.7 Summary
In this chapter, small signal characteristic of LLC resonant converter is been
investigated. Two methods were used to perform the analysis: simulation and
extended describing function method. With simulation, the small signal
characteristic of the converter could be covered with any operation mode. The
drawback is lack of insight of the characteristic. With extended describing
function method, more information could be obtained. The drawback is the needs
of develop the model file, which is not an easy task to cover all operating points.
The best way is to combine the power of these two methods. Then a more
accurate, more efficient and more comprehensive characteristic of any converter
could be obtained.
The results of these two methods match very well. They were also been
verified with test setup.
Base on this information, the compensator could be designed and the front end
DC/DC converter is a complete system now.