ch8.education 2015
TRANSCRIPT
Children in Egypt
2015
A STATISTICAL DIGEST
Chapter 8
Education

Children in Egypt 2015 is a statistical digest produced by UNICEF Egypt to present updated and quality data on
major dimensions of child well-being. This chapter contains statistics on all elements of pre-university education
in Egypt, including information on access and participation, retention and progress, quality of education and
gender equality.
The statistics featured in this chapter are from national official sources. The appendix contains data from
international databases. Data presented in this chapter are those available to UNICEF Egypt up to June 2015
and refer to 2015 and/or previous years.
The data may be used for private study, research and teaching purposes, or for use in non-commercial products
or services, using the following citation:
UNICEF (2015) Children in Egypt: a statistical digest, UNICEF Egypt, Cairo, Egypt
The complete publication can be accessed at: www.unicef.org/egypt
© United Nations Children's Fund, Egypt.
June 2015
United Nations Children's Fund, Egypt
87, Misr Helwan Agricultural Road, Maadi, Cairo, Egypt Cover Photo: ©UNICEF/2006/Giacomo Pirozzi
Telephone: (20-2) 25265083-7
Fax: (20-2) 25264218 :
Website: www.unicef.org/egypt
The content presented in this publication does not imply the expression of any opinion on the part of the United
Nations Children’s Fund
Children in Egypt 2015

1
Education System
Figure 8.1: The Structure of the Education System in Egypt
Figure 8.2: Correspondence of the Egyptian pre-university education system structure to the International
Standard Classification of Education (ISCED)
Literacy and Educational Attainment
Table 8.01: Adult and youth literacy rates, 2006, 2010 and 2011
Education Access and Participation
Table 8.02: Total number of students enrolled in different levels of education, by gender, Ministry of Education
and Al-Azhar schools combined, 2008/09-2014/15
Table 8.03: Total number of students enrolled in different levels of education, by gender, Ministry of Education
schools, 2008/09-2014/15
Table 8.04: Total number of students enrolled in the different programmes of secondary education, by gender,
Ministry of Education schools, 2008/09-2014/15
Table 8.05: Total number of students enrolled in different levels of education, by gender, Al-Azhar schools,
2008/09-2014/15
Table 8.06: Total number of students enrolled in different levels of education, by urban/rural location, Ministry
of Education schools, 2008/09-2014/15
Table 8.07: Total number of students enrolled in the different programmes of secondary education, by urban/
rural location, Ministry of Education schools, 2008/09-2014/15
Table 8.08: Gross enrolment ratios for different levels of education, by gender, 2008/09-2014/15
Table 8.09: Gross enrolment ratios for different programmes of secondary education, by gender, 2008/09-
2014/15
Table 8.10: Net enrolment rates for different levels of education, by gender, 2008/09-2014/15
Table 8.11: Net enrolment rates for different programmes of secondary education, 2008/09-2014/15
Table 8.12: Total number of new entrants to first grade for different levels of education, by urban/rural location,
2008/09-2014/15
Table 8.13: Total number of new entrants to the first grade of different programmes of secondary education, by
urban/rural location, 2008/09-2014/15
Table 8.14: Intake ratio in the first grade of primary education, (gross and net), by gender, 2008/09-2014/15
Table 8.15: Proportion of students enrolled in private schools for different levels of education, by urban/rural
location, 2008/09-2014/15
School Retention and Progress
Table 8.16: Total absolute number and percentage of drop-outs in primary and preparatory education, by gen-
der, 2008/09-2013/14
Table 8.17: Proportion of students passing examinations for different levels of education by urban/rural areas,
2007/08-2013/14
List of Tables
EDUCATION
2
Table 8.18: Proportion of students passing examinations for different levels of education, by gender, 2007/08-
2013/14
Table 8.19: Proportion of repeaters for different levels of education, by urban/rural location, 2008/09-2014/15
Table 8.20: Proportion of repeaters in different programmes of secondary education, by urban/rural location,
2008/09-2014/15
Table 8.21: Transition rates from primary to preparatory education, by location and gender, 2011/12-2014/15
Table 8.22: Primary school completion rates, by gender, 2008/09-2011/12
Quality of Education
Table 8.23: Class density for different levels of education, by urban/rural location, 2008/09-2014/15
Table 8.24: Class density for different levels of education, Al Azhar schools, 2008/09-2014/15
Table 8.25: Pupil to teacher ratio for different levels of education, by urban/rural location, 2008/09-2014/15
Table 8.26: Pupil to teacher ratio for different levels of education, Al-Azhar schools, 2008/09-2014/15
Table 8.27: Total number of students enrolled in double-shift schools for different levels of education, by urban/
rural location, 2010/11-2014/15
Table 8.28: Percentage distribution of school teachers by their education attainment, 2008/09-2011/12
Table 8.29: Percentage of teachers with a pedagogic university qualification, by school level and urban/rural
location of the school, 2008/09-2014/15
Gender Equality in the Education System
Table 8.30: Gender parity index in gross and net enrolment rates for different levels of education, 2008/09-
2014/15
Table 8.31: Proportion of female teachers for different levels of education, by urban/rural location, 2008/09-
2014/15
Community Schools
Table 8.32: Total number of community schools and students enrolled, by urban/rural residence, 2008/09-2014/15
Table 8.33: Class density and students to teacher ratio in community schools, by urban/rural location, 2008/09-
2014/15
Appendix: Data from UNESCO Institute for Statistics and other international sources
Illiteracy
Table 8.34: Illiteracy rate among young people and adult population, by gender, 2005-2012
Education Access and Participation
Table 8.35.: Absolute numbers and rate of primary out of school children, by gender, 1999/2000-2010/11
Table 8.36: Gross school enrolment ratios for different levels of education, by gender, 1999/2000-2011/12
Table 8.37: Net enrolment rates in pre-primary and primary education by gender, 1999/2000-2011/12
Table 8.38: Proportion of students enrolled in private schools, 1999/2000 and 2004/2005
Children in Egypt 2015

School Retention and Progress
Table 8.39: Progression through primary school grades and transition to lower secondary, by gender, 1999/2000 and 2008/09
Table 8.40: School ‘life expectancy’ for primary and secondary education, by gender, 1999/2000-2011/12
Quality of Education
Table 8.41: Education achievements in international comparisons: competency of eighth Grade students in mathematics and science, in Trends in International Mathematics and Science Study (TIMSS), 2007
Table 8.42: Instructional time in public institutions for different levels of education (hours per year, and weeks per year), 2006 and 2010
Table 8.43: Information and Communication Technology (ICT) infrastructure in primary and secondary (upper and lower) schools, 2010
Table 8.44: Information and Communication Technology qualification among teachers in primary and secondary (lower and upper) education, 2012
Gender Equality in the Education System
Table 8.45: Gender parity index in enrolment rates for different levels of education, 1999/2000-2009/2010
Table 8.46: Proportion of female teachers for different levels of education, 1999/2000-2009/10
EDUCATION
3

The Structure of the Education System in Egypt
Correspondence of the Egyptian pre-university education system structure to the International Standard Classification of Education (ISCED)
EDUCATION SYSTEM
Figure 8.1
Figure 8.2
Age Egyptian Classification ISCED level ISCED Classification
4-5 Pre-primary education 0 Pre-primary education
6-11 Primary education 1 Primary education
12-14 Preparatory education 2 Lower Secondary
15-17 Secondary education (General and
technical secondary) 3 Upper Secondary
Source: UNESCO, ISCED Mapping 2011, Egypt.
Children in Egypt 2015
Source: National Strategic plan for Pre-University Education Reform in Egypt 2007/08-2011/12, Ministry of Education (MoE). The Egyptian Education system is composed of two entities; the Ministry of Education and Al-Azhar Al Sharif (religious education system).
4

Adult and youth literacy rates, 2006, 2010 and 2011
Table 8.01
LITERACY AND EDUCATIONAL ATTAINMENT
2006 2010 2011
(percentage)
Adult Literacy Rate (aged 15+)
Total 66.4 70.0 70.1
Males 74.6 78.3 78.4
Females 57.8 61.4 61.5
Youth Literacy Rate (aged 15-24)
Total 84.9 89.1 89.8
Males 87.9 91.1 91.6
Females 81.8 86.8 87.8
Source: CAPMAS, Indicators of Social Statistics database. The data for 2006 are derived from the Population Census; the data for 2010 and 2011 are calculated from the Labour Force Survey. Accessed in May 2015. Note: The literacy rate is the percentage of individuals (in the given age group) who can read and write.
EDUCATION
5
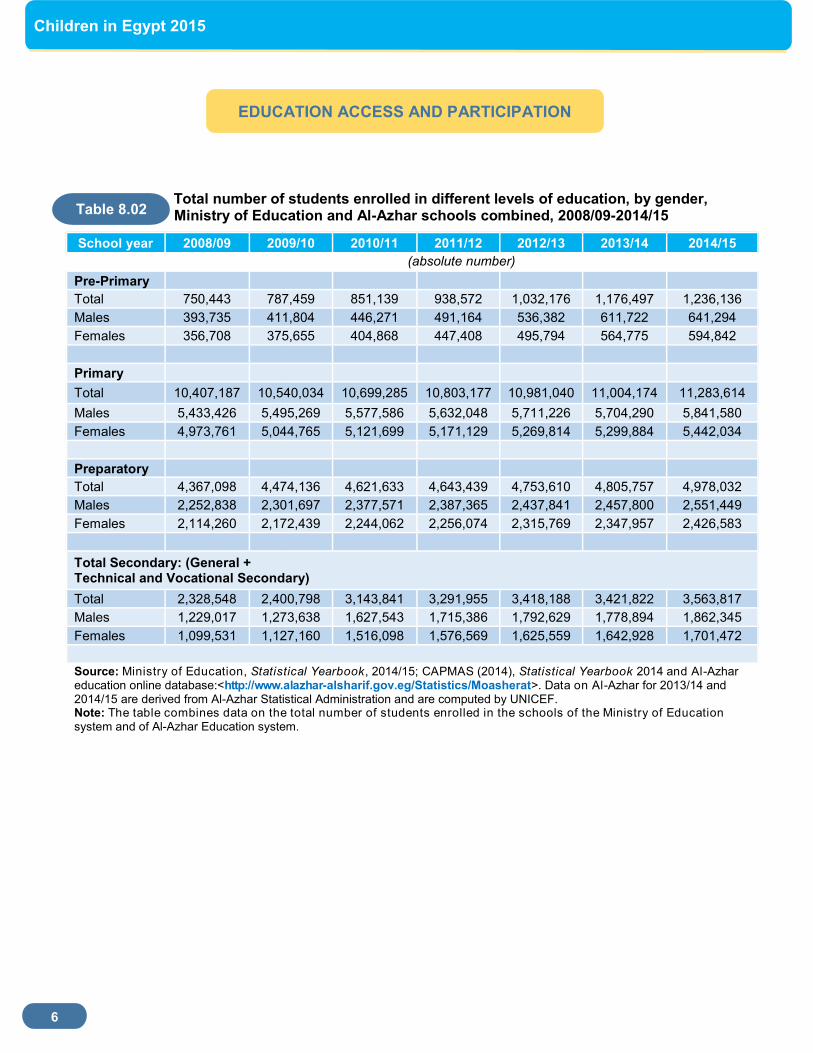
Total number of students enrolled in different levels of education, by gender, Ministry of Education and Al-Azhar schools combined, 2008/09-2014/15
Table 8.02
EDUCATION ACCESS AND PARTICIPATION
School year 2008/09 2009/10 2010/11 2011/12 2012/13 2013/14 2014/15
(absolute number)
Pre-Primary
Total 750,443 787,459 851,139 938,572 1,032,176 1,176,497 1,236,136
Males 393,735 411,804 446,271 491,164 536,382 611,722 641,294
Females 356,708 375,655 404,868 447,408 495,794 564,775 594,842
Primary
Total 10,407,187 10,540,034 10,699,285 10,803,177 10,981,040 11,004,174 11,283,614
Males 5,433,426 5,495,269 5,577,586 5,632,048 5,711,226 5,704,290 5,841,580
Females 4,973,761 5,044,765 5,121,699 5,171,129 5,269,814 5,299,884 5,442,034
Preparatory
Total 4,367,098 4,474,136 4,621,633 4,643,439 4,753,610 4,805,757 4,978,032
Males 2,252,838 2,301,697 2,377,571 2,387,365 2,437,841 2,457,800 2,551,449
Females 2,114,260 2,172,439 2,244,062 2,256,074 2,315,769 2,347,957 2,426,583
Total Secondary: (General + Technical and Vocational Secondary)
Total 2,328,548 2,400,798 3,143,841 3,291,955 3,418,188 3,421,822 3,563,817
Males 1,229,017 1,273,638 1,627,543 1,715,386 1,792,629 1,778,894 1,862,345
Females 1,099,531 1,127,160 1,516,098 1,576,569 1,625,559 1,642,928 1,701,472
Source: Ministry of Education, Statistical Yearbook, 2014/15; CAPMAS (2014), Statistical Yearbook 2014 and Al-Azhar education online database:<http://www.alazhar-alsharif.gov.eg/Statistics/Moasherat>. Data on Al-Azhar for 2013/14 and 2014/15 are derived from Al-Azhar Statistical Administration and are computed by UNICEF. Note: The table combines data on the total number of students enrolled in the schools of the Ministry of Education system and of Al-Azhar Education system.
Children in Egypt 2015
6

Total number of students enrolled in different levels of education, by gender, Ministry of Education schools, 2008/09-2014/15
Table 8.03
School year 2008/09 2009/10 2010/11 2011/12 2012/13 2013/14 2014/15
(absolute number)
Pre-Primary
Total 750,443 727,835 851,139 874,730 972,078 1,110,318 1,176,764
Males 393,735 381,218 446,271 457,955 505,362 577,412 611,165
Females 356,708 346,617 404,868 416,775 466,716 532,906 565,599
Primary
Total 9,207,323 9,334,322 9,506,363 9,644,456 9,832,516 9,906,249 10,255,297
Males 4,757,771 4,825,942 4,920,738 4,999,044 5,087,613 5,111,434 5,288,234
Females 4,449,552 4,508,380 4,585,625 4,645,412 4,744,903 4,794,815 4,967,063
Preparatory
Total 3,964,948 4,041,072 4,153,142 4,158,845 4,279,909 4,337,705 4,523,102
Males 2,014,037 2,049,909 2,105,980 2,107,054 2,168,036 2,194,688 2,295,188
Females 1,950,911 1,991,163 2,047,162 2,051,791 2,111,873 2,143,017 2,227,914
Secondary
Total 2,050,142 2,122,940 2,838,860 2,952,608 3,077,121 3,065,351 3,180,814
Males 1,053,145 1,102,735 1,443,346 1,517,089 1,594,622 1,574,123 1,641,165
Females 996,997 1,020,205 1,395,514 1,435,519 1,482,499 1,491,228 1,539,649
Source: Ministry of Education, Statistical Yearbook, 2014/15. Note: The data in this table refer exclusively to students enrolled in the Ministry of Education system (public and pri-vate) and do not include students enrolled in the Al-Azhar education system.
EDUCATION
7

Total number of students enrolled in different programmes of secondary education, by gender, Ministry of Education schools, 2008/09-2014/15
Table 8.04
School year 2008/09 2009/10 2010/11 2011/12 2012/13 2013/14 2014/15
(absolute number)
General Secondary
Total 797,711 862,147 1,231,735 1,324,440 1,390,262 1,455,472 1,535,064
Males 376,226 402,737 565,019 612,364 643,115 673,614 712,934
Females 421,485 459,410 666,716 712,076 747,147 781,858 822,130
Vocational Secondary
Total 1,252,431 1,260,793 1,607,125 1,628,168 1,686,859 1,609,879 1,645,750
Males 676,919 699,998 878,327 904,725 951,507 900,509 928,231
Females 575,512 560,795 728,798 723,443 735,352 709,370 717,519
Vocational Secondary by type
Industrial
Total 665,489 667,075 839,413 837,052 856,126 794,215 809,093
Males 413,965 425,010 526,437 530,628 550,101 504,425 518,338
Females 251,524 242,065 312,976 306,424 306,025 289,790 290,755
Agricultural
Total 123,482 125,464 161,665 169,734 179,013 165,513 168,705
Males 96,498 101,522 127,789 137,127 145,779 135,062 137,687
Females 26,984 23,942 33,876 32,607 33,234 30,451 31,018
Commercial
Total 463,460 468,254 606,047 621,382 651,720 650,151 667,952
Males 166,456 173,466 224,101 236,970 255,627 261,022 272,206
Females 297,004 294,788 381,946 384,412 396,093 389,129 395,746
Source: Ministry of Education, Statistical Yearbook, 2014/15. Note: The data in this table refer exclusively to students enrolled in the Ministry of Education system (public and private) and do not include students enrolled in the Al-Azhar education system.
Children in Egypt 2015
8

Total number of students enrolled in different levels of education, by gender, Al-Azhar schools, 2008/09-2014/15
Table 8.05
School year 2008/09 2009/10 2010/11 2011/12 2012/13 2013/14 2014/15
(absolute number)
Pre-primary
Total - 59,624 - 63,842 60,098 66,179 59,372
Males - 30,586 - 33,209 31,020 34,310 30,129
Females - 29,038 - 30,633 29,078 31,869 29,243
Primary
Total 1,199,864 1,205,712 1,192,922 1,158,721 1,148,524 1,097,925 1,028,317
Males 675,655 669,327 656,848 633,004 623,613 592,856 553,346
Females 524,209 536,385 536,074 525,717 524,911 505,069 474,971
Preparatory
Total 402,150 433,064 468,491 484,594 473,701 468,052 454,930
Males 238,801 251,788 271,591 280,311 269,805 263,112 256,261
Females 163,349 181,276 196,900 204,283 203,896 204,940 198,669
General secondary
Total 278,406 277,858 304,981 339,347 341,067 356,471 383,003
Males 175,872 170,903 184,197 198,297 198,007 204,771 221,180
Females 102,534 106,955 120,584 141,050 143,060 151,700 161,823
Source: CAPMAS (2013), Statistical Yearbook 2013 and Al-Azhar education online database:<http://www.alazhar-alsharif.gov.eg/Statistics/Moasherat>. Data for 2013/14 and 2014/15 are derived from Al-Azhar Education Statistical Admin-istration. Note: The data in this table refer exclusively to students enrolled in the Al -Azhar education system. Al-Azhar secondary education provides only the general secondary programme.
EDUCATION
9

Total number of students enrolled in different levels of education, by urban/ rural location, Ministry of Education schools, 2008/09-2014/15
Table 8.06
School year 2008/09 2009/10 2010/11 2011/12 2012/13 2013/14 2014/15
(absolute number)
Pre-Primary
Total 750,443 727,835 851,139 874,730 972,078 1,110,318 1,176,764
Urban 443,801 442,896 506,600 517,148 557,488 621,109 654,403
Rural 306,642 284,939 344,539 357,582 414,590 489,209 522,361
Primary
Total 9,207,323 9,334,322 9,506,363 9,644,456 9,832,516 9,906,249 10,255,297
Urban 3,740,171 4,250,606 4,280,815 4,286,585 4,352,424 4,356,986 4,542,870
Rural 5,467,152 5,083,716 5,225,548 5,357,871 5,480,092 5,549,263 5,712,427
Preparatory
Total 3,964,948 4,041,072 4,153,142 4,158,845 4,279,909 4,337,705 4,523,102
Urban 1,694,412 1,881,320 1,937,745 1,940,581 2,000,642 1,999,368 2,082,473
Rural 2,270,536 2,159,752 2,215,397 2,218,264 2,279,267 2,338,337 2,440,629
Secondary
Total 2,050,124 2,122,940 2,838,860 2,952,608 3,077,121 3,065,351 3,180,814
Urban 1,539,540 1,604,711 2,151,737 2,237,743 2,319,101 2,283,869 2,348,293
Rural 510,602 518,229 687,123 714,865 758,020 781,482 832,521
Source: Ministry of Education, Statistical Yearbook, 2014/15. Note: Enrolment data refer to the beginning of the school year. Data include both public and private schools under the Ministry of Education system, and exclude Al Azhar schools.
Children in Egypt 2015
10

Total number of students enrolled in the different programmes of secondary education, by urban/rural location, Ministry of Education schools, 2008/09-2014/15
Table 8.07
School year 2008/09 2009/10 2010/11 2011/12 2012/13 2013/14 2014/15
(absolute number)
General Secondary
Total 797,711 862,147 1,231,735 1,324,440 1,390,262 1,455,472 1,535,064
Urban 564,601 623,044 898,302 968,092 1,012,878 1,055,457 1,099,310
Rural 233,110 239,103 333,433 356,348 377,384 400,015 435,754
Vocational Secondary
Total 1,252,413 1,260,793 1,607,125 1,628,168 1,686,859 1,609,879 1,645,750
Urban 974,939 981,667 1,253,435 1,269,651 1,306,223 1,228,412 1,248,983
Rural 277,492 279,126 353,690 358,517 380,636 381,467 396,767
Vocational Secondary by type:
Industrial
Total 665,489 667,075 839,413 837,052 856,126 794,215 809,093
Urban 552,782 545,445 689,028 683,919 695,088 639,836 648,616
Rural 112,707 121,630 150,385 153,133 161,038 154,379 160,477
Agricultural
Total 123,482 125,464 161,665 169,734 179,013 165,513 168,705
Urban 96,345 98,608 122,941 128,821 137,600 123,635 123,157
Rural 27,137 26,856 38,724 40,913 41,413 41,878 45,548
Commercial
Total 463,460 468,254 606,047 621,382 651,720 650,151 667,952
Urban 325,812 337,614 441,466 456,911 473,535 464,941 477,210
Rural 137,648 130,640 164,581 164,471 178,185 185,210 190,742
Source: Ministry of Education, Statistical Yearbook, 2014/15. Note: Secondary education is composed of the general programme and the vocational programmes. Vocational sec-ondary education includes i) industrial secondary, ii) agricultural secondary and iii) commercial secondary education. Enrolment data refer to the beginning of the school year. The data in this table refer exclusively to students enrolled in the Ministry of Edu-cation system (public and private) and do not include students enrolled in the Al-Azhar education system.
EDUCATION
11

Gross enrolment ratios for different levels of education, by gender, 2008/09-2014/15
Table 8.08
School year 2008/09 2009/10 2010/11 2011/12 2012/13 2013/14 2014/15
(percentage)
Pre-Primary
Total 23.2 22.1 23.7 24.3 26.6 29.6 31.3
Males 23.7 22.7 24.3 24.9 26.5 29.6 31.3
Females 22.7 21.5 23.1 23.7 26.6 29.6 31.3
Primary
Total 96.0 95.6 101.2 100.1 96.9 95.2 94.9
Males 96.0 96.3 102.5 101.5 96.6 94.8 94.3
Females 96.1 94.8 99.8 98.5 97.2 95.7 95.5
Preparatory
Total 80.5 81.1 91.9 92.1 93.0 91.9 94.8
Males 79.0 79.4 91.6 91.7 91.1 90.0 93.0
Females 82.2 82.9 92.2 92.6 95.0 94.0 96.8
Secondary
Total 56.9 59.4 61.5 64.3 66.5 64.6 68.2
Males 57.9 60.0 61.9 65.2 66.8 64.4 68.2
Females 56.1 58.9 61.1 63.5 66.3 64.8 68.2
Source: Ministry of Education, Statistical Yearbook, 2008/09-2014/15. Note: The gross enrolment ratio is calculated as the number of children enrolled in the specific education level, regard-less of age, divided by the age group population of the same education level. The data in this table refer exclusively to students enrolled in the Ministry of Education system (public and private) and do not include students enrolled in the Al-Azhar education system.
Children in Egypt 2015
12

Gross enrolment ratios for different programmes of secondary education, by gender, 2008/09-2014/15
Table 8.09
School year 2008/09 2009/10 2010/11 2011/12 2012/13 2013/14 2014/15
(percentage)
General Secondary
Total 22.5 24.1 26.5 28.9 30.0 30.7 32.9
Males 20.7 21.9 24.0 26.3 26.9 27.6 29.6
Females 24.5 26.5 29.1 31.5 33.4 34.0 36.4
Vocational Secondary
Total 34.4 35.3 35.0 35.4 36.5 33.9 35.3
Males 37.2 38.1 37.9 38.9 39.9 36.8 38.6
Females 31.6 32.4 32.0 32.0 32.9 30.8 31.8
Vocational Secondary by type:
Industrial
Total 18.3 18.7 18.1 18.2 18.5 16.7 17.4
Males 22.8 23.1 22.4 22.8 23.1 20.6 21.6
Females 13.8 14.0 13.7 13.6 13.7 12.6 12.9
Agricultural
Total 3.4 3.5 3.8 3.7 3.9 3.5 3.6
Males 5.3 5.5 6.0 5.9 6.1 5.5 5.7
Females 1.5 1.4 1.6 1.4 1.5 1.3 1.4
Commercial
Total 12.7 13.1 13.1 13.5 14.1 13.7 14.3
Males 9.2 9.4 9.5 10.2 10.7 10.7 11.3
Females 16.3 17.0 16.7 17.0 17.7 16.9 17.5
Source: Ministry of Education, Statistical Yearbook, 2008/09-2014/15. Note: The gross enrolment ratio is calculated as the number of children enrolled in the specific education level, re-gardless of age, divided by the age group population of the same education level. Secondary education is composed of the general programme and the vocational programmes. Vocational secondary education includes i) industrial secondary, ii) agri-cultural secondary and iii) commercial secondary education. The data in this table refer exclusively to students enrolled in the Ministry of Education system (public and private) and do not include students enrolled in the Al-Azhar education system.
EDUCATION
13

Net enrolment rates for different levels of education, by gender, 2008/09-2014/15
Table 8.10
School year 2008/09 2009/10 2010/11 2011/12 2012/13 2013/14 2014/15
(percentage)
Pre-Primary
Total 20.5 18.4 20.5 21.4 23.7 26.4 27.7
Males 21.0 18.9 21.0 21.9 23.7 26.5 27.7
Females 20.0 17.9 20.0 20.9 23.7 26.3 27.6
Primary
Total 88.6 89.7 95.4 94.1 93.3 90.6 91.1
Males 88.1 90.1 96.1 94.6 92.4 89.6 90.0
Females 89.2 89.3 94.7 93.5 94.3 91.7 92.2
Preparatory
Total 66.3 65.8 77.8 81.7 83.7 80.9 83.8
Males 64.1 64.2 76.4 79.8 80.4 77.4 80.8
Females 68.6 67.5 79.3 83.7 87.2 84.6 87.1
Secondary
Total 36.8 38.9 52.4 57.3 58.2 57.2 60.3
Males 36.3 37.3 51.6 56.4 56.6 55.2 57.9
Females 37.3 40.5 53.2 58.2 60.1 59.3 62.7
Source: Ministry of Education, Statistical Yearbook, 2008/09-2014/15. Note: The net enrolment rate is calculated as the number of children enrolled in a specific level of school (for example, primary education) who belong to the age group that corresponds officially to that level of schooling (e.g. 6-11 year-olds), divid-ed by the total population of the same age group. The data in this table refer exclusively to students enrolled in the Ministry of Education system (public and private) and do not include students enrolled in the Al-Azhar education system.
Children in Egypt 2015
14
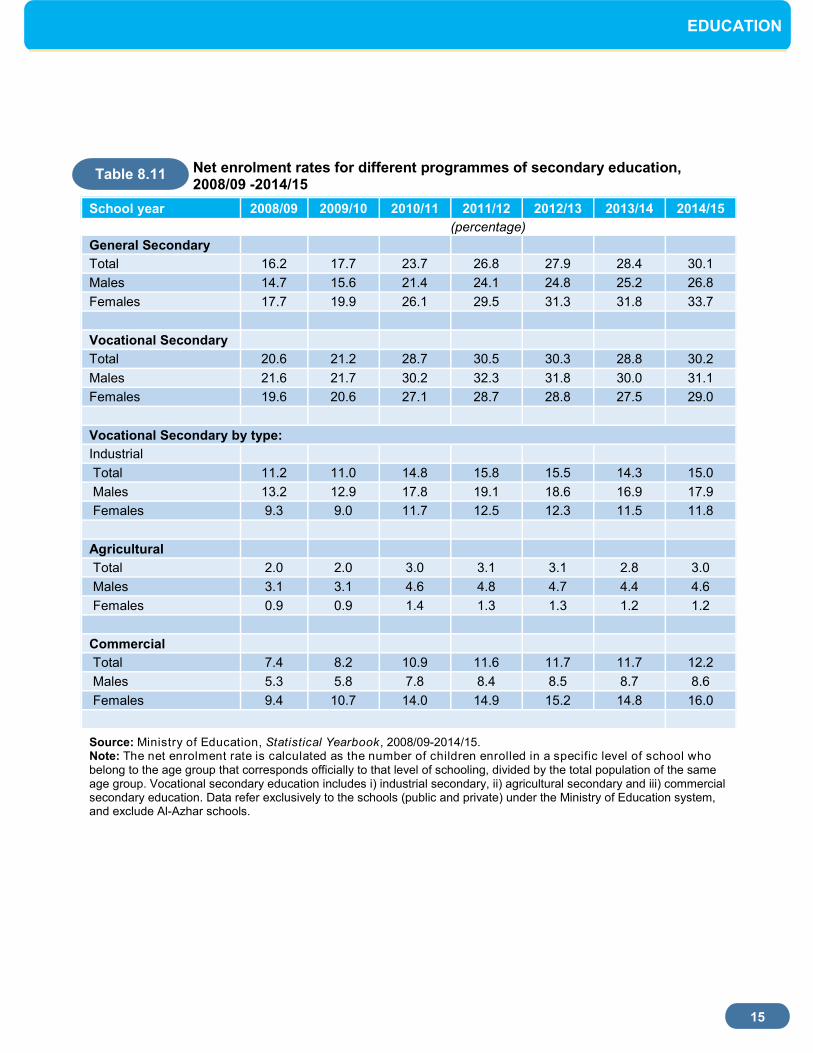
Net enrolment rates for different programmes of secondary education, 2008/09 -2014/15
Table 8.11
School year 2008/09 2009/10 2010/11 2011/12 2012/13 2013/14 2014/15
(percentage)
General Secondary
Total 16.2 17.7 23.7 26.8 27.9 28.4 30.1
Males 14.7 15.6 21.4 24.1 24.8 25.2 26.8
Females 17.7 19.9 26.1 29.5 31.3 31.8 33.7
Vocational Secondary
Total 20.6 21.2 28.7 30.5 30.3 28.8 30.2
Males 21.6 21.7 30.2 32.3 31.8 30.0 31.1
Females 19.6 20.6 27.1 28.7 28.8 27.5 29.0
Vocational Secondary by type:
Industrial
Total 11.2 11.0 14.8 15.8 15.5 14.3 15.0
Males 13.2 12.9 17.8 19.1 18.6 16.9 17.9
Females 9.3 9.0 11.7 12.5 12.3 11.5 11.8
Agricultural
Total 2.0 2.0 3.0 3.1 3.1 2.8 3.0
Males 3.1 3.1 4.6 4.8 4.7 4.4 4.6
Females 0.9 0.9 1.4 1.3 1.3 1.2 1.2
Commercial
Total 7.4 8.2 10.9 11.6 11.7 11.7 12.2
Males 5.3 5.8 7.8 8.4 8.5 8.7 8.6
Females 9.4 10.7 14.0 14.9 15.2 14.8 16.0
Source: Ministry of Education, Statistical Yearbook, 2008/09-2014/15. Note: The net enrolment rate is calculated as the number of children enrolled in a specific level of school who belong to the age group that corresponds officially to that level of schooling, divided by the total population of the same age group. Vocational secondary education includes i) industrial secondary, ii) agricultural secondary and iii) commercial secondary education. Data refer exclusively to the schools (public and private) under the Ministry of Education system, and exclude Al-Azhar schools.
EDUCATION
15

Total number of new entrants to first grade for different levels of education, by urban/rural location, 2008/09-2014/15
Table 8.12
School year 2008/09 2009/10 2010/11 2011/12 2012/13 2013/14 2014/15
(absolute number)
Pre-Primary
Total 355,942 342,303 412,779 391,796 445,718 520,016 537,772
Urban 207,207 203,587 244,248 229,275 251,692 288,988 297,045
Rural 148,735 138,716 168,531 162,521 194,026 231,028 240,727
Primary
Total 1,528,147 1,549,166 1,598,646 1,594,956 1,666,078 1,743,494 1,852,574
Urban 620,758 708,266 718,505 708,899 740,757 769,246 816,991
Rural 907,389 840,900 880,141 886,057 925,321 974,248 1,035,583
Preparatory
Total 1,321,954 1,344,245 1,423,411 1,307,459 1,414,535 1,473,854 1,530,541
Urban 571,547 629,709 670,932 616,988 656,059 672,631 691,647
Rural 750,407 714,536 752,479 690,471 758,476 801,223 838,894
Secondary
Total 897,702 966,165 1,013,122 952,417 1,010,939 1,035,656 1,068,797
Urban 672,354 725,005 766,118 720,280 758,418 764,999 783,960
Rural 225,348 241,160 247,004 232,137 252,521 270,657 284,831
Source: Ministry of Education, Statistical Yearbook, 2012 /13, 2013/14 and 2014/15. Note: Data refer exclusively to the schools (public and private) under the Ministry of Education system, and exclude Al-Azhar schools.
Children in Egypt 2015
16

Total number of new entrants to the first grade of different programmes of secondary education, by urban/rural location, 2008/09-2014/15
Table 8.13
School year 2008/09 2009/10 2010/11 2011/12 2012/13 2013/14 2014/15
(absolute number)
General Secondary
Total 397,858 417,688 429,300 454,306 482,554 492,850 513,535
Urban 282,727 301,723 312,338 332,161 350,544 354,312 363,429
Rural 115,131 115,965 116,962 122,145 132,010 138,538 150,106
Vocational Secondary
Total 499,844 548,477 583,822 498,111 528,385 542,806 555,262
Urban 389,627 423,282 453,780 388,119 407,874 410,687 420,531
Rural 110,217 125,195 130,042 109,992 120,511 132,119 134,725
Vocational Secondary by type:
Industrial
Total 271,524 274,341 305,534 248,579 255,449 259,593 279,094
Urban 225,199 222,541 249,467 200,735 205,807 209,321 223,794
Rural 46,325 51,800 56,067 47,844 49,642 50,272 55,300
Agricultural
Total 49,467 58,819 63,991 56,165 60,143 57,046 61,000
Urban 38,655 46,459 48,151 43,392 47,700 41,609 44,940
Rural 10,812 12,360 15,840 12,773 12,443 15,437 16,060
Commercial
Total 178,853 215,317 214,297 193,367 212,793 226,167 215,168
Urban 125,773 154,282 156,162 143,992 154,367 159,757 151,797
Rural 53,080 61,035 58,135 49,375 58,426 66,410 63,365
Source: Ministry of Education, Statistical Yearbook, 2012 /13, 2013/14 and 2014/15. Note: Data refer exclusively to the schools (public and private) under the Ministry of Education system, and exclude Al-Azhar schools. Data on vocational education include only the 3-year vocational secondary education programme composed of i) industrial secondary, ii) agricultural secondary and iii) commercial secondary education.
EDUCATION
17

Intake ratio in the first grade of primary education, (gross and net), by gender, 2008/09-2014/15
Proportion of students enrolled in private schools for different levels of education, by urban/rural location, 2008/09-2014/15
Table 8.14
School year 2008/09 2009/10 2010/11 2011/12 2012/13 2013/14 2014/15
(percentage)
Gross Intake
Total 95.9 95.1 96.8 92.2 89.7 91.5 100.3
Males 94.7 95.1 96.4 92.0 88.2 89.9 102.2
Females 97.2 95.2 97.2 92.4 91.3 93.3 90.0
Net Intake
Total 85.2 81.4 82.0 77.8 85.1 80.7 88.5
Males 85.0 81.7 82.0 78.0 83.9 79.4 98.6
Females 85.4 81.0 82.0 77.7 86.4 82.2 87.2
Source: Ministry of Education, Statistical Yearbook, 2008/09-2014/15. Note: Data refer to the number of new entrants in the first grade of primary education regardless of age, expressed as a percentage of the population of the official primary entrance age. Data include students enrolled in community or one-class schools and refer exclusively to the schools (public and private) under the Ministry of Education system, and exclude Al-Azhar schools.
Table 8.15
School year 2008/09 2009/10 2010/11 2011/12 2012/13 2013/14 2014/15
(percentage)
Pre-Primary
Total 27.6 27.2 26.0 25.4 25.3 24.4 24.4
Urban 43.9 41.8 40.6 39.6 40.2 38.5 38.2
Rural 4.0 4.5 4.5 4.7 5.3 6.4 7.1
Primary
Total 8.3 8.4 8.6 8.7 8.9 9.1 9.2
Urban 18.6 17.1 17.7 18.0 18.3 18.8 19.0
Rural 1.2 1.1 1.2 1.3 1.4 1.4 1.5
Preparatory
Total 5.7 5.9 6.2 6.3 6.5 6.6 6.7
Urban 12.3 11.9 12.5 12.7 13.0 13.3 13.6
Rural 0.7 0.6 0.6 0.7 0.8 0.8 0.8
Secondary
Total 6.5 7.1 8.3 9.0 9.0 9.3 9.1
Urban 7.4 8.2 9.6 10.5 10.6 11.1 11.2
Rural 3.8 3.6 4.2 4.4 4.2 4.0 3.2
Source: Ministry of Education, Statistical Yearbook, 2009/10-2014/15. Note: This table reflects the number of students enrolled in private schools expressed as a percentage of all students enrolled in the respective education level (public or private). Data refers exclusively to the schools (public and pri-vate) under the Ministry of Education system, and exclude Al-Azhar schools.
Children in Egypt 2015
18

Total absolute number and percentage of drop-outs in primary and preparatory education, by gender, 2008/09-2013/14
Table 8.16
SCHOOL RETENTION AND PROGRESS
School year 2008/09- 2009/10
2009/10- 2010/11
2010/11-2011/12
2011/12-2012/13
2012/13- 2013/14
absolute
number %
absolute
number %
absolute
number %
absolute
number %
absolute
number %
Primary
Total 11,697 0.2 28,841 0.4 26,093 0.3 73,289 0.8 53,238 0.6
Males 5,882 0.2 10,035 0.3 6,133 0.2 45,521 1.0 32,527 0.7
Females 5,815 0.2 18,806 0.5 19,960 0.5 27,768 0.6 20,711 0.5
Preparatory
Total 136,988 5.4 130,564 5.1 161,195 6.0 187,641 4.9 174,967 4.5
Males 78,426 6.2 70,831 5.5 87,276 6.5 94,589 4.9 85,726 4.4
Females 58,562 4.7 59,733 4.7 73,919 5.6 93,052 4.9 89,241 4.6
Source: Ministry of Education, Statistical Yearbook, 2009/10-2014/15. Note: The drop-out rate is the proportion of students in any grade in given school year who no longer attend school in the following school year. Data refer exclusively to the schools (public and private) under the Ministry of Education system, and exclude Al-Azhar schools.
EDUCATION
19
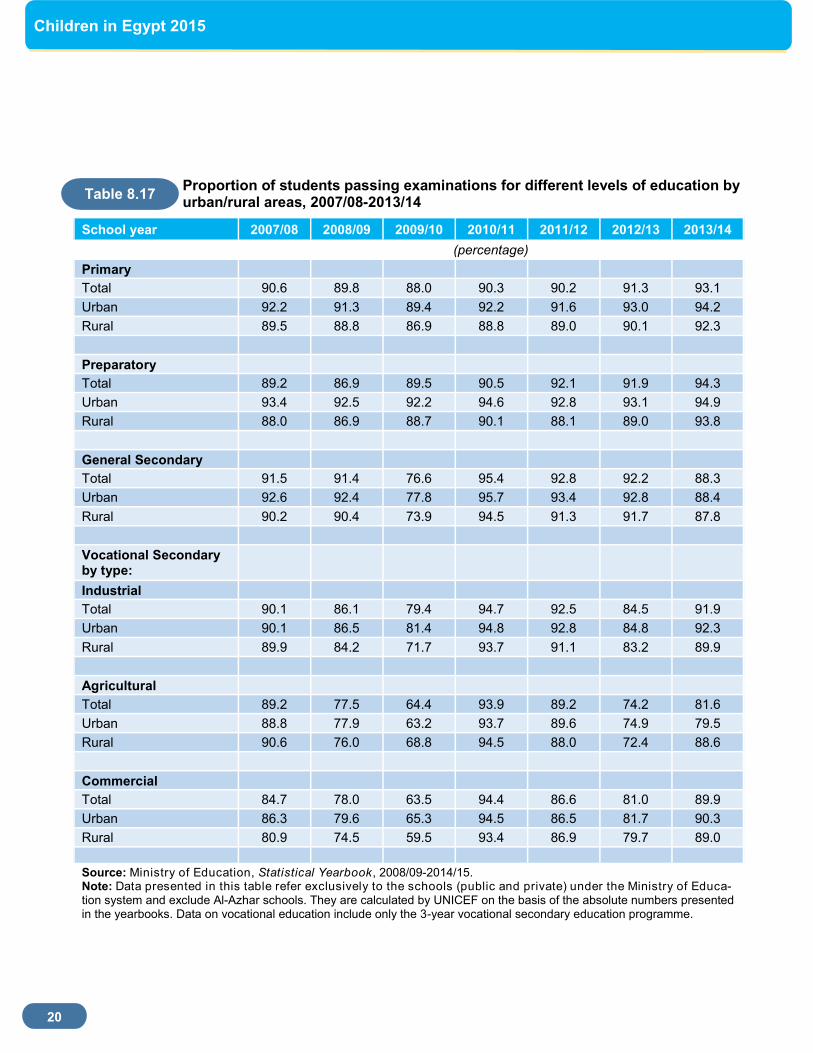
Proportion of students passing examinations for different levels of education by urban/rural areas, 2007/08-2013/14
Table 8.17
School year 2007/08 2008/09 2009/10 2010/11 2011/12 2012/13 2013/14
(percentage)
Primary
Total 90.6 89.8 88.0 90.3 90.2 91.3 93.1
Urban 92.2 91.3 89.4 92.2 91.6 93.0 94.2
Rural 89.5 88.8 86.9 88.8 89.0 90.1 92.3
Preparatory
Total 89.2 86.9 89.5 90.5 92.1 91.9 94.3
Urban 93.4 92.5 92.2 94.6 92.8 93.1 94.9
Rural 88.0 86.9 88.7 90.1 88.1 89.0 93.8
General Secondary
Total 91.5 91.4 76.6 95.4 92.8 92.2 88.3
Urban 92.6 92.4 77.8 95.7 93.4 92.8 88.4
Rural 90.2 90.4 73.9 94.5 91.3 91.7 87.8
Vocational Secondary by type:
Industrial
Total 90.1 86.1 79.4 94.7 92.5 84.5 91.9
Urban 90.1 86.5 81.4 94.8 92.8 84.8 92.3
Rural 89.9 84.2 71.7 93.7 91.1 83.2 89.9
Agricultural
Total 89.2 77.5 64.4 93.9 89.2 74.2 81.6
Urban 88.8 77.9 63.2 93.7 89.6 74.9 79.5
Rural 90.6 76.0 68.8 94.5 88.0 72.4 88.6
Commercial
Total 84.7 78.0 63.5 94.4 86.6 81.0 89.9
Urban 86.3 79.6 65.3 94.5 86.5 81.7 90.3
Rural 80.9 74.5 59.5 93.4 86.9 79.7 89.0
Source: Ministry of Education, Statistical Yearbook, 2008/09-2014/15. Note: Data presented in this table refer exclusively to the schools (public and private) under the Ministry of Educa-tion system and exclude Al-Azhar schools. They are calculated by UNICEF on the basis of the absolute numbers presented in the yearbooks. Data on vocational education include only the 3-year vocational secondary education programme.
Children in Egypt 2015
20

Proportion of students passing examinations for different levels of education, by gender, 2007/08-2013/14
Table 8.18
School year 2007/08 2008/09 2009/10 2010/11 2011/12 2012/13 2013/14
(percentage)
Primary
Males 88.4 87.5 85.3 88.1 88.0 89.5 91.6
Females 93.0 92.4 91.0 92.7 92.6 93.3 94.8
Preparatory
Males 87.6 85.3 89.8 92.0 92.0 90.2 94.5
Females 90.8 88.5 90.8 92.4 92.3 90.0 94.1
Secondary
Males 85.3 80.7 - 93.0 88.9 82.0 86.5
Females 93.6 91.3 - 96.8 93.9 91.3 93.9
General Secondary
Males 89.6 89.0 75.6 94.4 91.3 89.8 86.2
Females 93.3 93.6 78.0 96.1 94.2 93.3 90.0
Vocational Secondary
Males 82.5 75.3 91.9 87.6 77.6 86.6
Females 93.5 89.4 97.4 93.6 89.0 98.0
Vocational Secondary
by type:
Industrial
Males 85.2 80.5 75.3 92.4 90.0 81.2 89.4
Females 97.4 94.6 88.3 98.0 97.4 91.1 97.1
Agricultural
Males 86.6 72.7 64.1 92.7 87.7 71.6 79.6
Females 97.1 91.3 66.8 97.8 96.2 85.2 92.9
Commercial
Males 73.4 63.8 55.0 96.4 81.2 71.9 83.8
Females 90.2 85.0 70.1 90.6 90.2 87.3 94.4
Source: Ministry of Education, Statistical Yearbook, 2008/09-2014/15. Note: This table refers exclusively to the schools (public and private) under the Ministry of Education system, and exclude Al-Azhar schools. Data on vocational education refer exclusively to the 3-year vocational secondary educa-tion programme.
EDUCATION
21

Proportion of repeaters for different levels of education, by urban/rural location,
2008/09-2014/15
Table 8.19
School year 2008/09 2009/10 2010/11 2011/12 2012/13 2013/14 2014/15
(percentage)
Primary
Total 3.8 3.7 3.5 3.5 3.3 2.9 2.5
Urban 3.4 3.5 3.4 3.3 3.1 2.6 2.4
Rural 4.1 3.8 3.7 3.7 3.4 3.2 2.6
Preparatory
Total 8.1 7.8 7.2 8.1 8.5 8.1 6.6
Urban 6.1 6.2 5.7 6.1 7.0 6.2 5.6
Rural 9.6 9.3 8.5 9.8 9.8 9.7 7.4
Secondary
Total 4.4 3.3 2.9 2.8 4.4 3.4 3.8
Urban 4.1 3.1 2.8 2.7 4.3 3.3 3.8
Rural 5.1 3.6 3.1 3.3 4.7 3.1 4.0
Source: Ministry of Education, Statistical Yearbook, 2008/09-2014/15. Note: This table refers to the total number of students who are enrolled in the same grade as in the previous year, expressed as a percentage of the total number of enrolled students in the specified grade. Data include only the schools (public and private) under the Ministry of Education system, and exclude Al-Azhar schools.
Children in Egypt 2015
22
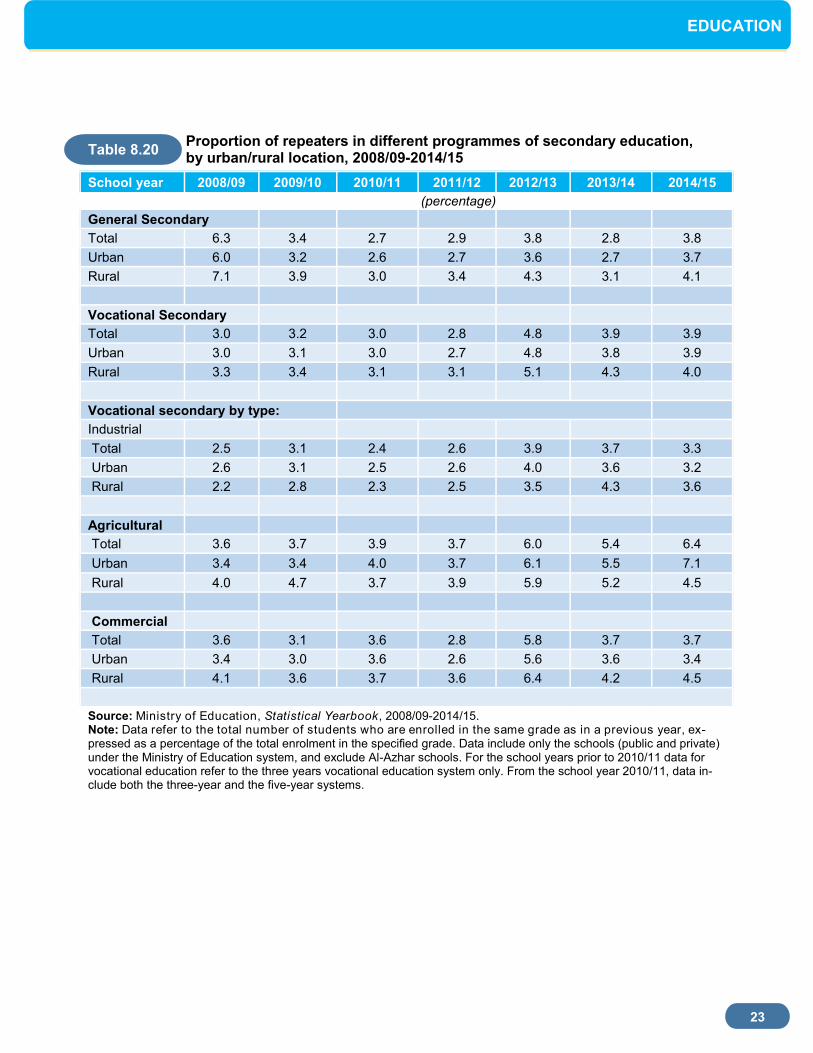
Proportion of repeaters in different programmes of secondary education, by urban/rural location, 2008/09-2014/15
Table 8.20
School year 2008/09 2009/10 2010/11 2011/12 2012/13 2013/14 2014/15
(percentage)
General Secondary
Total 6.3 3.4 2.7 2.9 3.8 2.8 3.8
Urban 6.0 3.2 2.6 2.7 3.6 2.7 3.7
Rural 7.1 3.9 3.0 3.4 4.3 3.1 4.1
Vocational Secondary
Total 3.0 3.2 3.0 2.8 4.8 3.9 3.9
Urban 3.0 3.1 3.0 2.7 4.8 3.8 3.9
Rural 3.3 3.4 3.1 3.1 5.1 4.3 4.0
Vocational secondary by type:
Industrial
Total 2.5 3.1 2.4 2.6 3.9 3.7 3.3
Urban 2.6 3.1 2.5 2.6 4.0 3.6 3.2
Rural 2.2 2.8 2.3 2.5 3.5 4.3 3.6
Agricultural
Total 3.6 3.7 3.9 3.7 6.0 5.4 6.4
Urban 3.4 3.4 4.0 3.7 6.1 5.5 7.1
Rural 4.0 4.7 3.7 3.9 5.9 5.2 4.5
Commercial
Total 3.6 3.1 3.6 2.8 5.8 3.7 3.7
Urban 3.4 3.0 3.6 2.6 5.6 3.6 3.4
Rural 4.1 3.6 3.7 3.6 6.4 4.2 4.5
Source: Ministry of Education, Statistical Yearbook, 2008/09-2014/15. Note: Data refer to the total number of students who are enrolled in the same grade as in a previous year, ex-pressed as a percentage of the total enrolment in the specified grade. Data include only the schools (public and private) under the Ministry of Education system, and exclude Al-Azhar schools. For the school years prior to 2010/11 data for vocational education refer to the three years vocational education system only. From the school year 2010/11, data in-clude both the three-year and the five-year systems.
EDUCATION
23
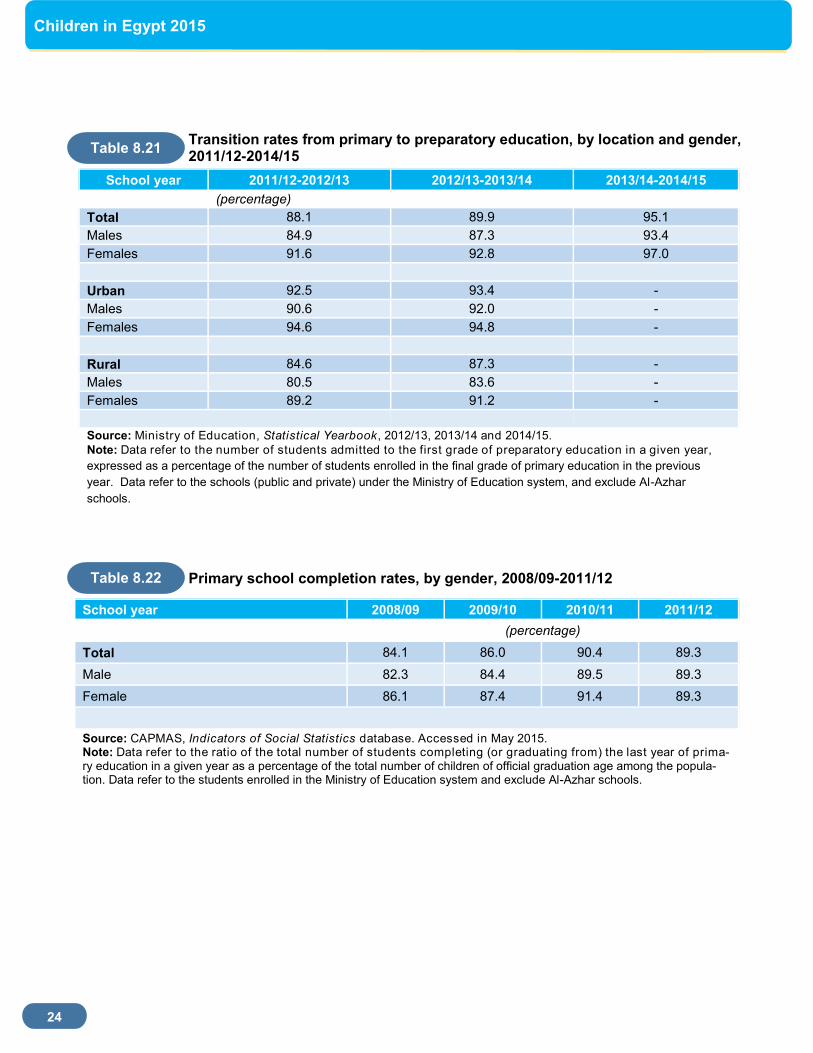
Transition rates from primary to preparatory education, by location and gender, 2011/12-2014/15
Primary school completion rates, by gender, 2008/09-2011/12
Table 8.21
School year 2011/12-2012/13 2012/13-2013/14 2013/14-2014/15
(percentage)
Total 88.1 89.9 95.1
Males 84.9 87.3 93.4
Females 91.6 92.8 97.0
Urban 92.5 93.4 -
Males 90.6 92.0 -
Females 94.6 94.8 -
Rural 84.6 87.3 -
Males 80.5 83.6 -
Females 89.2 91.2 -
Source: Ministry of Education, Statistical Yearbook, 2012/13, 2013/14 and 2014/15.
Note: Data refer to the number of students admitted to the first grade of preparatory education in a given year,
expressed as a percentage of the number of students enrolled in the final grade of primary education in the previous
year. Data refer to the schools (public and private) under the Ministry of Education system, and exclude Al-Azhar
schools.
Children in Egypt 2015
Table 8.22
School year 2008/09 2009/10 2010/11 2011/12
(percentage)
Total 84.1 86.0 90.4 89.3
Male 82.3 84.4 89.5 89.3
Female 86.1 87.4 91.4 89.3
Source: CAPMAS, Indicators of Social Statistics database. Accessed in May 2015. Note: Data refer to the ratio of the total number of students completing (or graduating from) the last year of prima-ry education in a given year as a percentage of the total number of children of official graduation age among the popula-tion. Data refer to the students enrolled in the Ministry of Education system and exclude Al-Azhar schools.
24

Class density for different levels of education, by urban/rural location,
2008/09 -2014/15
Table 8.23
QUALITY OF EDUCATION
School year 2008/09 2009/10 2010/11 2011/12 2012/13 2013/14 2014/15
(average number of students per classroom)
Pre-Primary
Total 32.6 30.0 33.1 34.0 34.1 34.2 35.6
Urban 34.2 31.4 34.5 35.4 34.8 34.9 36.4
Rural 30.6 28.2 31.3 32.2 33.1 33.4 34.7
Primary
Total 43.4 38.5 42.6 43.1 43.3 42.8 44.2
Urban 44.6 39.5 43.5 43.6 43.9 43.0 44.4
Rural 42.6 37.7 41.8 42.7 42.8 42.7 44.2
Preparatory
Total 41.4 36.5 40.3 40.2 40.7 40.1 41.9
Urban 41.0 36.6 40.3 40.2 41.0 40.1 41.8
Rural 41.6 36.4 40.3 40.2 40.5 40.5 42.1
Secondary by type:
General Secondary
Total 32.7 31.1 36.7 37.7 37.7 37.8 39.3
Urban 32.7 31.1 36.9 38.0 38.1 38.3 39.9
Rural 32.9 31.0 36.1 36.7 36.6 36.4 38.1
Vocational Secondary
Industrial
Total 33.2 30.9 34.2 31.3 34.3 32.9 33.7
Urban 32.9 30.7 34.2 30.7 33.9 31.4 33.6
Rural 34.8 31.9 34.3 34.5 35.8 33.3 33.9
Agricultural
Total 33.3 29.8 34.2 35.5 37.6 34.8 36.7
Urban 33.2 29.6 33.7 35.3 37.4 33.5 36.0
Rural 33.8 30.3 36.0 36.0 38.6 37.3 38.8
Commercial
Total 35.7 32.5 36.3 37.3 37.9 38.4 38.2
Urban 35.3 32.4 36.3 37.4 37.9 37.4 38.3
Rural 36.6 33.1 36.2 36.8 37.9 37.6 38.0
Source: Ministry of Education, Statistical Yearbook, 2012/13, 2013/14 and 2014/15. Note: The average class density for each level of education is the ratio between the total number of students enrolled and the number of classrooms in the school institutions for the respective level of education. Data refer to the schools (public and private) under the Ministry of Education system, and exclude Al-Azhar schools.
EDUCATION
25

Class density for different levels of education, Al-Azhar schools, 2008/09-2014/15
Table 8.24
School year 2008/09 2009/10 2010/11 2011/12 2012/13 2013/14 2014/15
(average number of students per classroom)
Pre-primary - - - - 37 36 36
Primary 37 33 36 35 35 34 33
Preparatory 30 28 32 32 32 32 31
General secondary 25 23 26 29 28 28 29
Source: CAPMAS Statistical Yearbook 2013 and Al-Azhar education online database: http://www.alazhar-alsharif.gov.eg/Statistics/Moasherat. Data for 2013/14 and 2014/15 are derived from Al-Azhar Education Statistical Administration. Note: Data refer exclusively to the schools under the Al -Azhar education system. Al-Azhar secondary education provides only the general secondary programme.
Children in Egypt 2015
26

Pupil to teacher ratio for different levels of education, by urban/rural location, 2008/09-2014/15
Table 8.25
School year 2008/09 2009/10 2010/11 2011/12 2012/13 2013/14 2014/15
(average number of students per teacher)
Pre-Primary
Total 30.8 28.5 28.1 27.5 28.1 29.3 28.4
Urban 24.8 22.8 23.2 25.2 24.9 26.0 26.2
Rural 47.7 46.9 40.8 31.9 33.9 35.1 31.8
Primary
Total 27.9 27.2 26.1 25.6 25.2 25.1 24.9
Urban 24.0 24.0 23.4 24.4 23.7 23.7 24.1
Rural 31.3 30.6 28.8 26.7 26.5 26.4 25.5
Preparatory
Total 18.7 18.3 18.7 18.4 17.8 17.9 18.0
Urban 15.3 15.3 15.7 16.3 16.0 16.1 16.7
Rural 22.6 22.2 22.5 20.8 19.8 19.8 19.3
Secondary by type:
General Secondary
Total 8.7 8.8 12.3 13.7 13.6 14.0 14.5
Urban 8.3 8.5 12.0 13.7 13.7 14.2 14.7
Rural 9.6 9.6 13.1 13.8 13.4 13.7 14.1
Vocational Secondary:
Industrial
Total 7.6 7.2 8.9 9.0 8.9 8.3 8.4
Urban 7.2 6.9 8.6 8.6 8.4 7.9 8.0
Rural 9.7 8.8 11.2 11.7 11.6 10.9 10.5
Agricultural
Total 9.4 9.0 11.0 12.9 12.9 12.1 12.3
Urban 8.8 8.4 10.1 12.0 12.2 11.2 11.3
Rural 12.3 12.0 15.2 16.7 15.9 16.1 16.4
Commercial
Total 12.9 12.7 15.8 18.8 17.7 17.4 17.3
Urban 12.1 11.9 15.0 18.2 16.8 16.2 16.5
Rural 15.5 15.2 18.6 20.8 20.5 21.3 20.0
Source: Ministry of Education, Statistical Yearbook, 2008/09-2014/15. Note: The average number of students per teacher at each level of education is the ratio between the total num-ber of students enrolled and the number of teachers in the school institutions for the respective level of education. Data refer to the schools (public and private) under the Ministry of Education system, and exclude Al-Azhar schools.
EDUCATION
27

Pupil to teacher ratio for different levels of education, Al-Azhar schools, 2008/09-2014/15
Total number of students enrolled in double-shift schools for different levels of education, by urban/rural location, 2010/11-2014/15
Table 8.26
School year 2008/09 2009/10 2011/12 2012/13 2013/14 2014/15
(number of students per teacher)
Pre-primary - 21 17 16 15 17
Primary 18 18 17 17 15 13
Preparatory 10 10 12 11 10 10
General secondary 9 6 9 9 9 9
Source: CAPMAS Statistical Yearbook, 2009, 2011 and 2013. Data for 2013/14 and 2014/15 are from Al -Azhar Edu-cation Statistical Administration. Note: Data refer exclusively to the schools under the Al -Azhar education system. Al-Azhar secondary education provides only the general secondary programme.
Table 8.27
School year 2010/11 2011/12 2012/13 2013/14 2014/15
(absolute number)
Primary
Total 888,084 881,010 879,224 859,295 874,314
Urban 351,051 317,372 291,341 278,155 315,127
Rural 537,033 563,638 587,883 581,140 559,187
Preparatory
Total 372,915 364,907 380,586 376,664 372,923
Urban 141,537 121,018 136,339 130,726 137,740
Rural 231,378 243,889 244,247 245,938 235,183
Secondary
Total 848,227 918,608 1,005,903 950,326 950,997
Urban 707,783 763,850 832,599 773,985 767,810
Rural 140,444 154,758 173,304 176,341 183,187
Source: Ministry of Education, Statistical Yearbook, 2010/11, 2011/12, 2012/13, 2013/14 and 2014/15. Note: Double-shift schools cater for two separate groups of students during the school day. The first shift runs from the early morning till mid-day and the second from mid-day to late-afternoon. In this case, students use the same buildings, equipment and facilities. Data refer to the schools (public and private) under the Ministry of Education system, and ex-clude Al-Azhar schools.
Children in Egypt 2015
28
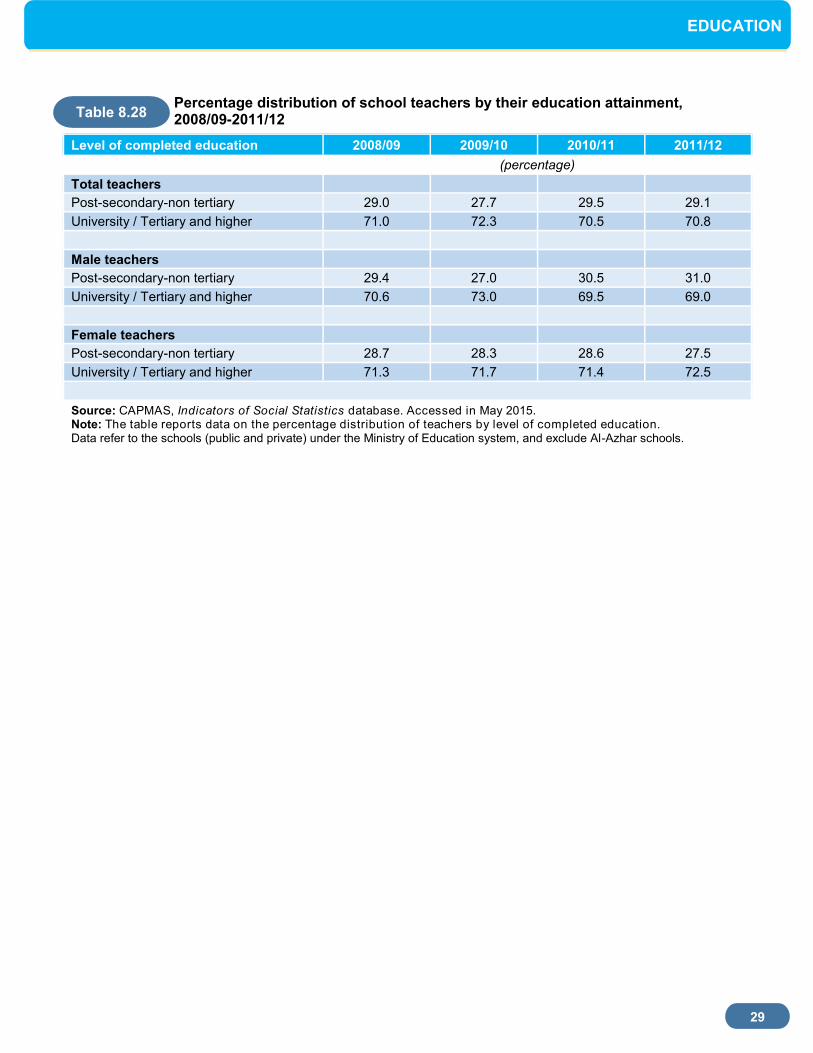
Percentage distribution of school teachers by their education attainment, 2008/09-2011/12
Table 8.28
Level of completed education 2008/09 2009/10 2010/11 2011/12
(percentage)
Total teachers
Post-secondary-non tertiary 29.0 27.7 29.5 29.1
University / Tertiary and higher 71.0 72.3 70.5 70.8
Male teachers
Post-secondary-non tertiary 29.4 27.0 30.5 31.0
University / Tertiary and higher 70.6 73.0 69.5 69.0
Female teachers
Post-secondary-non tertiary 28.7 28.3 28.6 27.5
University / Tertiary and higher 71.3 71.7 71.4 72.5
Source: CAPMAS, Indicators of Social Statistics database. Accessed in May 2015. Note: The table reports data on the percentage distribution of teachers by level of completed education. Data refer to the schools (public and private) under the Ministry of Education system, and exclude Al-Azhar schools.
EDUCATION
29

Percentage of teachers with a pedagogic university qualification, by school level and urban/rural location of the school, 2008/09-2014/15
Table 8.29
School year 2008/09 2009/10 2010/11 2011/12 2012/13 2013/14 2014/15
(percentage)
Pre-Primary
Total 61.2 75.2 77.4 80.9 80.7 81.5 82.3
Urban 67.5 70.9 71.8 73.2 72.9 73.4 73.5
Rural 88.0 89.1 91.8 95.0 95.0 95.6 95.6
Primary
Total 78.3 84.5 84.7 85.1 85.2 86.1 87.0
Urban 81.3 81.9 81.9 81.3 81.2 81.5 82.2
Rural 87.1 87.4 87.5 88.5 88.8 90.1 91.0
Preparatory
Total 68.9 75.8 75.3 74.3 75.5 77.4 79.6
Urban 72.8 74.9 74.5 72.2 73.0 74.2 75.8
Rural 76.2 76.9 76.4 76.5 78.1 80.7 83.4
Secondary
General Secondary
Total 63.5 71.7 71.0 69.9 71.1 72.6 75.2
Urban 67.3 70.8 70.2 68.6 69.6 70.8 73.2
Rural 73.2 74.1 73.5 73.5 75.0 77.1 80.1
Vocational Secondary
Industrial
Total 77.1 79.3 80.9 78.8 78.7 78.9 79.2
Urban 78.9 80.0 79.9 78.9 78.8 79.0 79.3
Rural 79.8 75.0 81.3 78.3 78.0 78.1 78.6
Agricultural
Total 93.8 44.3 42.6 42.7 44.8 47.1 51.4
Urban 46.0 45.9 41.2 43.1 44.9 47.0 50.8
Rural 51.6 35.3 49.0 41.3 44.5 47.6 53.4
Commercial
Total 32.4 49.9 49.2 48.6 50.6 54.1 58.3
Urban 51.7 49.6 49.3 48.3 50.3 53.7 57.6
Rural 50.7 51.2 48.8 49.4 51.4 55.4 60.3
Source: Ministry of Education, Statistical Yearbook, 2008/09-2014/15.
Note: Data from the Ministry of Education include both public and private schools, and exclude Al Azhar schools. For
each level of education, data refer to the percentage of teachers holding a degree from the University of Education. Data refer
to the schools (public and private) under the Ministry of Education system, and exclude Al-Azhar schools.
Children in Egypt 2015
30

Gender parity index in gross and net enrolment rates for different levels of education, 2008/09-2014/15
Table 8.30
GENDER EQUALITY IN THE EDUCATION SYSTEM
School year 2008/09 2009/10 2010/11 2011/12 2012/13 2013/14 2014/15
(gender parity index, 1= perfect parity)
Pre-Primary
Gross 0.96 0.95 0.95 0.95 1.00 1.00 1.00
Net 0.95 0.95 0.95 0.95 1.00 0.99 1.00
Primary
Gross 1.00 0.98 0.97 0.97 1.01 1.01 1.01
Net 1.01 0.99 0.99 0.99 1.02 1.02 0.99
Preparatory
Gross 1.04 1.04 1.01 1.01 1.04 1.04 1.04
Net 1.07 1.05 1.04 1.05 1.08 1.09 1.08
Total Secondary
Gross 0.97 0.98 0.99 0.97 0.99 1.01 1.00
Net 1.03 1.08 1.03 1.03 1.06 1.07 1.08
General Secondary
Gross 1.18 1.21 1.21 1.20 1.24 1.23 1.23
Net 1.20 1.28 1.22 1.22 1.26 1.26 1.26
Vocational Secondary
Gross 0.85 0.85 0.84 0.82 0.82 0.84 0.82
Net 0.91 0.95 0.90 0.89 0.91 0.92 0.93
Source: Ministry of Education, Statistical Yearbook, 2008/09-2014/15, calculated by UNICEF on the basis of the enrol-ment ratios. Note: The gender parity index in enrollment is the ratio of the enrolment rate for females divided by the enrolment rate for males. A value of 1 reflects perfect parity in enrolment between males and females. A value lower than 1 reflects a disadvantage for females, while a value higher than 1 reflects a disadvantage for males. The data presented in the table are for gross and for net enrolment rates respectively. Data refer to the schools (public and private) under the Ministry of Educa-tion system, and exclude Al-Azhar schools.
EDUCATION
31

Proportion of female teachers for different levels of education, by urban/rural location, 2008/09-2014/15
Table 8.31
School year 2008/09 2009/10 2010/11 2011/12 2012/13 2013/14 2014/15
(percentage of female teachers)
Pre-Primary
Total 98.7 98.7 99.3 99.3 99.4 99.5 99.5
Urban 98.7 98.8 99.1 99.0 99.1 99.3 99.2
Rural 98.8 98.3 99.7 99.7 99.8 99.9 99.9
Primary
Total 56.6 57.5 58.7 58.1 58.9 60.1 60.9
Urban 66.5 65.6 67.1 66.7 67.5 68.6 68.9
Rural 47.7 48.7 50.3 50.6 51.3 52.8 54.1
Preparatory
Total 46.4 47.7 48.3 49.0 49.5 50.2 51.1
Urban 52.8 53.1 53.8 54.7 55.4 56.0 56.4
Rural 39.2 40.8 41.5 42.7 43.1 44.2 45.8
Total Secondary
Total 40.1 41.0 41.3 41.3 42.1 42.9 43.7
Urban 42.4 43.4 43.8 43.8 44.7 45.6 46.3
Rural 31.1 31.8 31.6 31.6 32.6 33.4 35.2
General Secondary
Total 37.3 38.5 38.5 38.8 39.4 39.8 40.6
Urban 40.9 41.8 42.2 42.8 43.3 43.9 44.6
Rural 27.2 28.7 27.7 28.0 28.9 29.5 30.9
Vocational Secondary
Total 42.0 42.7 43.2 43.0 44.0 45.2 46.0
Urban 43.3 44.3 44.8 44.5 45.5 46.7 47.3
Rural 35.3 34.9 35.6 35.6 36.6 37.7 40.1
Source: Ministry of Education, Statistical Yearbook, 2008/09-2014/15. Note: For each level education, data show the number of female teachers expressed as a percentage of the total number of teachers and are calculated by UNICEF on the basis of the absolute numbers presented in the MoE Yearbooks. Data refer to the schools (public and private) under the Ministry of Education system, and exclude Al-Azhar schools.
Children in Egypt 2015
32

Total number of community schools and students enrolled, by urban/rural residence, 2008/09-2014/15
Class density and students to teacher ratio in community schools, by urban/rural location, 2008/09 -2014/15
Table 8.32
COMMUNITY SCHOOLS
School year 2008/09 2009/10 2010/11 2011/12 2012/13 2013/14 2014/15
(absolute number)
Schools
Total 4,006 4,542 4,571 4,624 4,614 4,780 5,018
Urban 86 704 660 645 641 659 706
Rural 3,920 3,838 3,911 3,979 3,973 4,121 4,312
Students
Total 90,496 103,512 101,985 101,177 100,286 99,475 106,781
Urban 1,664 16,206 15,487 15,317 15,692 15,824 17,213
Rural 88,832 87,306 86,498 85,860 84,594 83,651 89,568
Source: Ministry of Education, Statistical Yearbook, 2012/13, 2013/14 and 2014/15. Note: Community schools provide personalized education to children (especially girls) aged 6-14 years living in poor communities that are not reached by formal education. They are established by community organizations and supervised by the Ministry of Education. Local communities are involved in the provision and management of such schools. Personalized curricula and specialized teachers are provided by the Ministry of Education.
Table 8.33
School year 2008/09 2009/10 2010/11 2011/12 2012/13 2013/14 2014/15
(average number of students per classroom)
Class density
Total 22.6 22.8 22.3 21.9 21.7 20.8 21.3
Urban 19.4 23.0 23.5 23.8 24.5 24.0 24.4
Rural 22.7 22.8 22.1 21.6 21.3 20.3 20.1
Pupil to Teacher Ratio (number of students per teacher)
Total 21.5 11.5 10.0 12.5 12.2 12.0 12.6
Urban 15.1 12.0 11.3 14.9 14.2 14.4 14.5
Rural 21.7 11.5 9.8 12.1 11.8 11.7 12.3
Source: Data for class density are from the Ministry of Education, Statistical Yearbook, 2008/09-2014/15. Note: The pupil-to-teacher ratio reflects the average number of students per teacher at a specific level of education in a given school year and; is calculated by dividing the total number of students enrolled at the specified level of education by the num-ber of teachers at the same level. Data for 2008/09 include the average for community schools, one class schools and girl-friendly schools.
EDUCATION
33
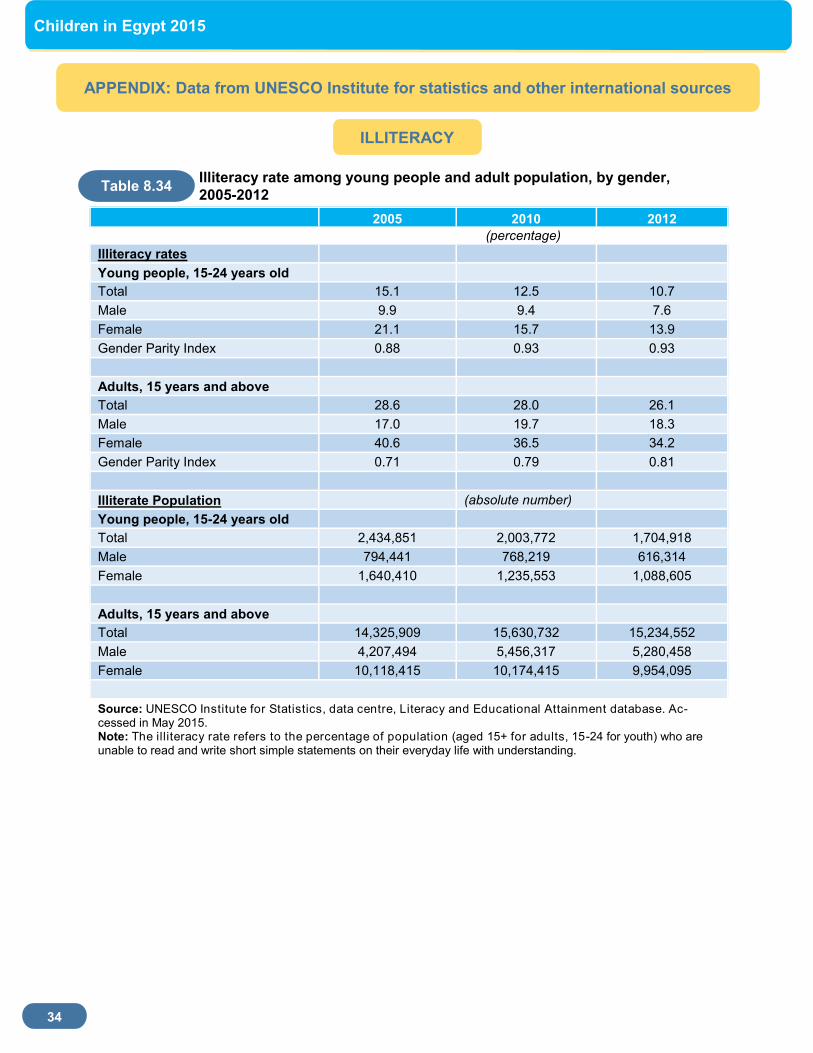
Illiteracy rate among young people and adult population, by gender,
2005-2012
APPENDIX: Data from UNESCO Institute for statistics and other international sources
Table 8.34
2005 2010 2012
(percentage)
Illiteracy rates
Young people, 15-24 years old
Total 15.1 12.5 10.7
Male 9.9 9.4 7.6
Female 21.1 15.7 13.9
Gender Parity Index 0.88 0.93 0.93
Adults, 15 years and above
Total 28.6 28.0 26.1
Male 17.0 19.7 18.3
Female 40.6 36.5 34.2
Gender Parity Index 0.71 0.79 0.81
Illiterate Population (absolute number)
Young people, 15-24 years old
Total 2,434,851 2,003,772 1,704,918
Male 794,441 768,219 616,314
Female 1,640,410 1,235,553 1,088,605
Adults, 15 years and above
Total 14,325,909 15,630,732 15,234,552
Male 4,207,494 5,456,317 5,280,458
Female 10,118,415 10,174,415 9,954,095
Source: UNESCO Institute for Statistics, data centre, Literacy and Educational Attainment database. Ac-cessed in May 2015. Note: The illiteracy rate refers to the percentage of population (aged 15+ for adults, 15-24 for youth) who are unable to read and write short simple statements on their everyday life with understanding.
Children in Egypt 2015
ILLITERACY
34

Absolute numbers and rate of primary education out of school children, by gender, 1999/2000-2010/11
Table 8.35
EDUCATION ACCESS AND PARTICIPATION
School year 1999/2000 2004/05 2009/10 2010/11
(absolute
number) %
(absolute
number) %
(absolute
number) %
(absolute
number) %
Primary
Total 327,886 4 245,758 3 368,000 4 258,378 3
Males 52,279 1 - - - - - -
Females 275,607 7 - - - - - -
Source: UNESCO Institute for Statistics, data centre, Education database. Accessed in May 2015. Note: Data refer to children in the official primary school-age range who are not enrolled in either primary or secondary schools.
EDUCATION
35

Gross school enrolment ratios for different levels of education, by gender,
1999/2000-2011/12
Table 8.36
School year 1999/2000 2004/05 2009/10 2010/11 2011/12
(percentage)
Pre-Primary
Total 12 17 31 27 28
Males 12 18 33 28 28
Females 12 17 28 27 27
Primary
Total 101* 106 112 109 113
Males 105* 109 115 112 116
Females 97* 102 110 105 111
Lower Secondary
Total 99* - 98 101 101
Males 103* - 99 102 102
Females 95* - 98 100 100
Upper Secondary (All programs)
Total 72* - 53 70 71
Males 74* - 55 71 72
Females 69* - 51 69 70
Basic Education (Primary + Lower secondary)
Total 93* - 94 97 100
Males 96* - 96 99 102
Females 89* - 92 95 99
Total (SecondaryLower + Upper secondary)
Total 86 - 76 86 86
Males 89 - 77 86 87
Females 82 - 74 85 86
Source: UNESCO Institute for Statistics, data centre, Education database. Accessed in May 2015. Note: The gross enrolment ratio is calculated as the number of children enrolled in the specific education level, re-gardless of age, divided by the population of the age group that corresponds officially to the same level. Lower secondary cor-responds to the preparatory level in the Egyptian education system. (*) refers to data estimated by the UNESCO Institute for Statistics.
Children in Egypt 2015
36
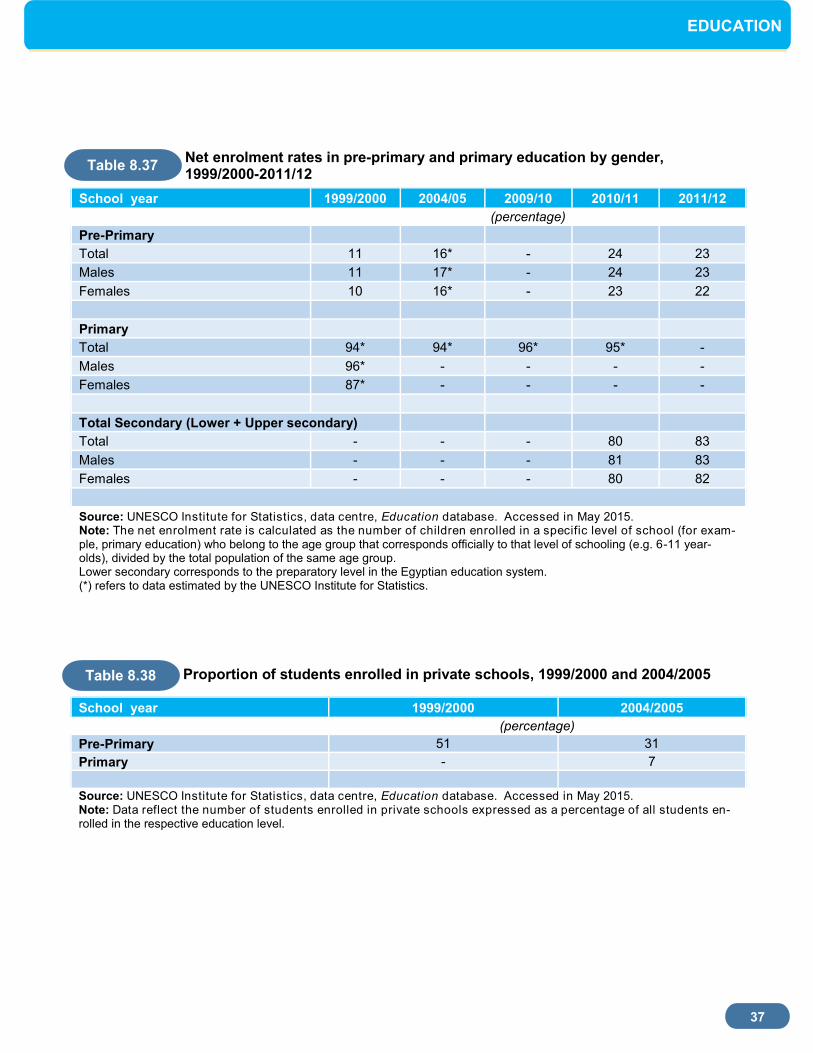
Net enrolment rates in pre-primary and primary education by gender, 1999/2000-2011/12
Proportion of students enrolled in private schools, 1999/2000 and 2004/2005
Table 8.37
Table 8.38
School year 1999/2000 2004/2005
(percentage)
Pre-Primary 51 31
Primary - 7
Source: UNESCO Institute for Statistics, data centre, Education database. Accessed in May 2015. Note: Data reflect the number of students enrolled in private schools expressed as a percentage of all students en-rolled in the respective education level.
School year 1999/2000 2004/05 2009/10 2010/11 2011/12
(percentage)
Pre-Primary
Total 11 16* - 24 23
Males 11 17* - 24 23
Females 10 16* - 23 22
Primary
Total 94* 94* 96* 95* -
Males 96* - - - -
Females 87* - - - -
Total Secondary (Lower + Upper secondary)
Total - - - 80 83
Males - - - 81 83
Females - - - 80 82
Source: UNESCO Institute for Statistics, data centre, Education database. Accessed in May 2015. Note: The net enrolment rate is calculated as the number of children enrolled in a specific level of school (for exam-ple, primary education) who belong to the age group that corresponds officially to that level of schooling (e.g. 6-11 year-olds), divided by the total population of the same age group. Lower secondary corresponds to the preparatory level in the Egyptian education system. (*) refers to data estimated by the UNESCO Institute for Statistics.
EDUCATION
37

Progression through primary school grades and transition to lower secondary, by gender, 1999/2000 and 2008/09
School ‘life expectancy’ for primary and secondary education, by gender, 1999/2000-2011/12
Table 8.39
SCHOOL RETENTION AND PROGRESS
School year 1999/2000 2008/2009
(percentage)
‘Survival’ to last year of primary grade
Total 99 96
Male 99 96
Female 99 96
Effective Transition from primary to lower secondary
Total 93* -
Males 91* -
Females 96* -
Source: UNESCO Institute for Statistics, data centre, Education database. Accessed in May 2015. Note: Data on the survival rate refer to the percentage of children entering the first grade of primary school who eventually reach the last grade. The effective transition rate shows the real transition from primary to secondary school, regardless of repetition. It reflects situations in which pupils repeat the last grade of primary but eventually make the transition to secondary. It is calculated as the number of new entrants to the first grade of lower secondary education for the following year divided by enrolment in the last grade of primary education in the given year minus the number of repeaters from the last grade of primary education in the following year. Together, the two indicators reflect access, retention capacity and the efficiency of the education system by illustrating the transition from one level of education to a higher level. Data for 2010 are from the UIS Global Education Digest, 2012. Lower secondary corresponds to the preparatory level in the Egyptian education system. (*) refers to data estimated by the UNESCO Institute for Statistics.
Table 8.40
School year 1999/2000 2008/09 2009/10 2010/11 2011/12
(years spent in the education system)
Total 10.2* 11.1* 11.3* 11.6* 12.0*
Males 10.6* 11.3* 11.5* 11.9* 12.2*
Females 9.8* 10.9* 11.1* 11.4* 11.8*
Source: UNESCO Institute for Statistics, data centre, Education database. Accessed in May 2015. Note: Data refer to the estimated average number of school years that a child is likely to spend in the edu-cation system of his/her country. More precisely, ‘school life expectancy’ is the total number of years of schooling that a child entering the school system could expect to receive in the future, assuming that the probability of his/her enrolment is equal to the prevailing participation rates. The indicator reflects the average duration of schooling in years, not the number of grades reached. (*) refers to data estimated by the UNESCO Institute for Statistics.
Children in Egypt 2015
38

Education achievements in international comparisons: competency of eighth grade students in mathematics and science, in Trends in International Mathematics and Science Study (TIMSS), 2007
Table 8.41
QUALITY OF EDUCATION
2007
Unit TIMSS average
scale/ international average
Egypt
Mathematics, 8th
grade students
Average mathematics achievement Score 500 391
Average in different cognitive domains
Knowing
Score
500 392
Applying 500 393
Reasoning 500 396
Students who reached the TIMSS International Benchmarks in mathematics
Below the low benchmark % of students
25 53
Advanced benchmark and above 2 1
Science, 8th
grade students
Average science achievement Score 500 408
Average in different cognitive domain
Knowing 500 434
Applying Score 500 404
Reasoning 500 395
Students who reached the TIMSS International Benchmarks in science
Below the low benchmark % of students 22 45
Advanced benchmark and above % of students 3 1
Source: TIMSS International Mathematics Report , 2007 and TIMSS International Science Report , 2007. Accessed in May 2015. Note: The Trends in International Mathematics and Science Study (TIMSS) is an international comparative assess-ment of the mathematics and science knowledge of fourth and eighth grade students around the world. TIMSS focuses on the effectiveness of curriculum and instruction on student learning by assessing mathematics and science achievement at the same point in schooling across countries. Egyptian eighth-grade students took part in the study in 2003 and 2007. In this table only data for 2007 are reported. The table reports the average scores of the Egyptian students who took part in the survey, for mathematics and sciences, and for sub-cognitive domains (knowing, applying, and reasoning) in mathematics and science. The data are compared with the average TIMSS scale which is set at 500 for each individual domain. Within its scale, TIMSS identifies four points as international benchmarks to classify achievement according to the students’ performance on the test questions. The low international benchmark is represented by a level equal or below the score of 400, while the advanced benchmark is represented by a score equal to or above the score of 625. The table reports the percentages of Egyptian students below the low benchmark and the percentages of Egyptian students above the advanced benchmark, and compares both the percentages with the international average. The 2007 TIMSS Assessment Framework contains detailed information describing factors associated with students’ learning in mathematics and science: <http://timss.bc.edu/timss2003i/frameworks.html>, <http://timss.bc.edu/timss2007/frameworks.html>
EDUCATION
39

Instructional time in public institutions for different levels of education (hours per year, and weeks per year), 2006 and 2010
Information and Communication Technology (ICT) infrastructure in primary and secondary (upper and lower) schools, 2010
Table 8.42
2006 2010
Hours per year Weeks per year Hours per year Weeks per year
Teachers’ instructional time
Primary 756 34 764 34
Lower Secondary 662 34 573 34
Upper Secondary (General Programs)
567 34 573 34
Intended Time for students
Primary 3,435 - 3,435 -
Lower Secondary 3,056 - 3,056 -
Source: UNESCO Institute for Statistics, data centre, Education database. 2010 data are from the UIS Global Education Digest, 2012. Accessed in May 2015. Note: Data on intended hours for primary education refer to total hours for children aged 9-11 years, while for lower secondary education they refer to children aged 12-14. Lower secondary corresponds to the preparatory level in the Egyptian education system.
Table 8.43
2010
(percentage)
Schools with electricity
Primary 100
Secondary 100
Schools with a telephone communication facility
Primary 70
Secondary 67
Schools with computer laboratories
Primary 12
Secondary 36
Schools with access to the internet
Primary 44
Secondary 50
Source: UNESCO Institute for Statistics, data centre, Communication and Information database. Accessed in May 2015.
Children in Egypt 2015
40

Information and Communication Technology qualification among teachers in primary and secondary (lower and upper) education, 2012
Table 8.44
2012
Primary Secondary
(percentage)
Teachers qualified in ICT (basic computer skills)
Total 2 3
Males 2 2
Females 2 3
Teachers currently teaching basic computer skills
or computing
Total 2 3
Males 2 2
Females 3 3
Source: UNESCO Institute for Statistics, data centre, Communication and Information database. Accessed in May 2015. Note: Data refer to the proportion of teachers trained, according to nationally -defined qualification standards, to teach basic computer skills in primary and secondary schools or computing in upper secondary schools. Lower secondary corresponds to the preparatory level in the Egyptian education system.
EDUCATION
41

Gender parity index in enrolment rates for different levels of education, 1999/2000-2010/11
Table 8.45
School year 1999/2000 2004/2005 2009/2010 2010/2011
(gender parity index, 1= perfect gender parity)
Pre Primary
Gross 0.95 0.95 0.86 0.95
Net 0.94 0.94* - -
Primary
Gross 0.92* 0.94 0.96 0.94
Net 0.94* - - -
Lower Secondary
Gross 0.92* - 0.98 0.99
Upper Secondary (all programs)
Gross 0.93* - 0.93 -
Secondary (Total lower and upper)
Gross 0.93* - 0.96* -
Primary +Secondary
Gross 0.92* - 0.96 -
Source: UNESCO Institute for Statistics, data centre, Education database. Accessed in May 2015. Note: The gender parity index in enrolment is the ratio of the enrolment rate for females divided by the enrollment rate for males. A value of 1 reflects perfect parity in enrolment between males and females. A value lower than 1 reflects a disad-vantage for females, while a value higher than one reflects a disadvantage for males. The data presented in the table are re-spectively for gross and for net enrollment ratios. Lower secondary corresponds to the preparatory level in the Egyptian education system. (*) refers to data estimated by the UNESCO Institute for Statistics
GENDER EQUALITY IN THE EDUCATION SYSTEM
Children in Egypt 2015
42

Proportion of female teachers for different levels of education, 1999/2000-2009/10
Table 8.46
School year 1999/2000 2004/05 2009/10
(percentage)
Pre-Primary - 99* 99
Primary 52 55 53
Total Secondary (lower + upper) 40 - 42
Lower Secondary 43 - 45
Upper Secondary 38 - 39
Source: UNESCO Institute for Statistics, data centre, Education database. Accessed in May 2015. Data for 2010 are derived from the UNESCO Global Education Digest 2012. Note: For each level of education, data show the number of female teachers expressed as a percentage of the total number of teachers. Lower secondary corresponds to the preparatory level in the Egyptian education system. (*) refers to data estimated by the UNESCO Institute for Statistics.
EDUCATION
43