cha relocation counseling assessment - urban
TRANSCRIPT
CHA RELOCATION COUNSELING ASSESSMENT
Susan J. Popkin Mary K. Cunningham
CHA Relocation Counseling Assessment
Final Report
July 2002
Prepared By:
Susan J. Popkin Mary K. Cunningham
with assistance from:
Erin Godfrey
Beata Bednarz Alicia Lewis
The Urban Institute
Metropolitan Housing and Communities Policy Center
2100 M Street, NW Washington, DC
and
Janet L. Smith Anne Knepler
Doug Schenkleberg
University of Illinois at Chicago Great Cities Institute
Chicago, IL
Submitted To:
The MacArthur Foundation Chicago, IL
Grant No. 99-61174-HCD
UI No. 07011-000-05
The nonpartisan Urban Institute publishes studies, reports, and books on timely topics worthy of public consideration. The views expressed are those of the authors and
should not be attributed to the Urban Institute, its trustees, or its funders.

CHA Relocation Counseling Assessment—Final Report
CONTENTS
EXECUTIVE SUMMARY ............................................................................................................... i
OVERVIEW................................................................................................................................... 1
PURPOSE OF THE STUDY ......................................................................................................... 2
METHODOLOGY ......................................................................................................................... 3
Limitations of This Research .........................................................................................4
CHA PLAN FOR TRANSFORMATION........................................................................................ 5
Relocation Rights Contract ............................................................................................6
CONTINUING CHALLENGES ..................................................................................................... 7
RELOCATION SERVICES SINCE 1999 .................................................................................... 10
Other Counseling Programs ........................................................................................12
RESIDENT EXPERIENCES ....................................................................................................... 13
Relocation Outcomes ..................................................................................................14
Movers’ Experiences ...................................................................................................16
Nonmovers’ Experiences.............................................................................................22
LESSONS FOR ONGOING RELOCATION EFFORTS ............................................................. 27
REFERENCES ........................................................................................................................... 31

CHA Relocation Counseling Assessment—Final Report
APPENDIX A: METHODOLOGY AND STUDY TIMELINE
APPENDIX B: WAVE 3 CHA RESEARCH QUESTIONS
APPENDIX C: DATA EXHIBITS 12-MONTH FOLLOW-UP: CHA RESPONDENTS
APPENDIX D: DATA EXHIBITS 12-MONTH FOLLOW UP: CHA MOVERS AND NONMOVERS
APPENDIX E: DATA EXHIBITS BASELINE, 6-MONTH, AND 12-MONTH FOLLOW-UPS: CHA RESPONDENTS
APPENDIX F: DATA EXHIBITS BASELINE, 6-MONTH, AND 12-MONTH FOLLOW-UPS: CHA RESPONDENTS—NONMOVERS

CHA Relocation Counseling Assessment—Final Report i
EXECUTIVE SUMMARY
Public housing in Chicago, as in many cities across the nation, is currently undergoing a dramatic transformation. In 1998, nearly 19,000 of the Chicago Housing Authority’s (CHA’s) units failed viability inspection, meaning that under federal law the CHA was required to demolish the units within five years.1 As a result, the city put forth a plan to “transform” the CHA’s enormous high-rise developments into smaller mixed-income communities of town homes and low-rise buildings. The CHA Plan for Transformation calls for the demolition of 51 gallery high-rise buildings, as well as several thousand mid-rise and low-rise units.2 The CHA will redevelop or rehabilitate 25,000 units of public housing; however, the plan calls for a substantial reduction in family public housing units (a net loss of 14,000 units). The original plan called for the relocation of as many as 6,000 families3 with Housing Choice Vouchers (Section 8 vouchers).4 This plan, including relocation and revitalization, is estimated to cost $1.5 billion over 10 years.
In 1999, the CHA began implementing housing search programs to help relocatees find housing in a broader range of neighborhoods. These programs also provided a range of training programs (e.g., workshops on tenant rights and responsibilities, budgeting, and housekeeping) and supportive services (generally, case management) intended to help relocatees become successful private-market tenants. The overarching goals of CHA’s relocation services were to help participants make good housing choices for themselves and their families; help participants make a successful transition to the private market; and prevent the creation of clusters of relocatees in other high-poverty neighborhoods.
During the first year of relocation, the CHA’s counseling services were targeted to residents of buildings slated for closing and demolition who indicated that Section 8 was their first choice for replacement housing. Since then, the CHA’s services have evolved significantly. In addition to relocation counseling for residents who receive vouchers, the agency now offers all tenants housing choice clinics and information sessions intended to help explain relocation options; Good Neighbor counseling; and a Service Connector program to provide case
1 Section 202 of the Omnibus Consolidated Reconciliation Act (OCRA), 1996. 2 See the CHA Plan for Transformation (October 2000) for more details regarding demolition and relocation.
Most of these demolitions are covered by a 1996 federal law calling for the conversion to vouchers of certain severely distressed public housing developments.
3 Based on its experience with the first three years of the Plan, the CHA now believes that this figure will ultimately be lower than originally estimated.
4 The Quality Housing and Work Responsibility Act of 1998 merged the Section 8 certificate and voucher program into one to create the Housing Choice Voucher program. We refer to this program throughout the report as “Section 8 vouchers” or “Section 8.”

CHA Relocation Counseling Assessment—Final Report ii
management and linkages to community services. Residents can also participate in the new Gautreaux II Mobility program, which provides mobility counseling and assistance in moving to “opportunity areas,” communities with poverty rates below 23.49 percent.
Since the relocation rights contract was signed in November 2001, the CHA has made a number of changes to its relocation process. The agency created a relocation department and developed relocation planning meetings and housing choice clinics to help ensure that residents were making informed choices about replacement housing. Staff report that the CHA has made ongoing efforts to simplify the materials it provides to residents and try new approaches to providing information, including a new cable show and audiovisual materials. The agency has also worked to develop a tracking system to follow residents through the relocation process.5 Finally, the CHA has made a number of changes to its counseling services.
CONTINUING CHALLENGES
In light of the size and scope of the CHA Plan for Transformation, a number of observers have raised concerns about the risks involved in this massive undertaking, particularly for current CHA tenants and receiving neighborhoods. From our reviews of available data and reports, interviews with key actors, and the information we have collected about the residents in our sample, we have identified the following critical issues about the transformation process to date:
Adequacy of resources;
Pace of relocation;
Pace of redevelopment;
Ensuring residents make informed choices;
Clustering and availability of voucher units;
Inadequate resident representation;
Residents’ ability to transition to the private market and effect on illegal tenants;
Lack of accurate information regarding residents’ status; and
Coordinating multiple agencies.
This report provides a systematic look at what happened to a sample of residents as they moved through the relocation process from 1999 to 2001, and provides feedback for the CHA’s ongoing efforts to refine its relocation process. The challenges encountered during the
5 The Chicago Housing Authority, MTW Annual Report FY 2001, March 2002; the Chicago Housing Authority, CHA Relocation Department Presentation, April 18, 2002

CHA Relocation Counseling Assessment—Final Report iii
early phases of implementation remain threats to the long-term success of the Plan for Transformation, particularly the challenge of providing effective services to so many residents with complex needs.
METHODOLOGY
Our study uses a variety of methods, including a collection of both qualitative and quantitative data. Specifically, we combined information from three major sources:
• A three-wave panel survey of a sample of approximately 190 CHA residents awaiting relocation with Section 8.
• In-depth interviews with 30 CHA relocatees focusing on their experiences with the counseling programs.
• A process study of the counseling and relocation services provided by the CHA’s contract counseling agencies.
This study provides the first systematic evidence of what happened to CHA residents who initially chose Section 8 for replacement housing. However, because the study was intended to provide rapid feedback for an ongoing process, we were, by design, studying a moving target. Because our survey began after the initial wave of relocation was under way, our sample likely represents those residents who face the greatest challenges in transitioning out of public housing.
RESIDENT EXPERIENCES
Our data document outcomes for our sample of 190 CHA residents as they moved through the relocation system, including personal and institutional barriers they have faced during relocation. Specifically, our analysis finds the following:
• Less than half of the CHA residents in our sample had relocated; most were still living in public housing. A total of 55 respondents (40 percent of our sample) moved by the 12-month follow-up.
• Movers are living in lower-poverty neighborhoods than their original public housing developments, but these neighborhoods are still segregated and high-poverty. The average reduction in neighborhood poverty level for these households is 42 percentage points. However, more than 55 percent are still living in communities with poverty rates greater than 40 percent.
• Movers perceive substantial improvements in their housing and neighborhood conditions. Just 12 percent of movers report having at least one “big problem” with their
CHA Relocation Counseling Assessment—Final Report iv
housing compared with 53 percent of nonmovers. Movers also report significant decreases in exposure to violence and improvement in outlook.
• Residents face personal and institutional barriers that make it challenging for them to relocate. Many residents have physical health problems, and overall our respondents had relatively low levels of personal efficacy and very low expectations about their ability to improve their circumstances.
LESSONS FOR ONGOING RELOCATION EFFORTS
Although this report describes the experiences of a relatively small sample of CHA residents, it offers important lessons for CHA’s ongoing efforts to improve and expand its relocation services. While the majority of residents who were referred for relocation services in September 1999 have left public housing, both our survey data and counseling agency records from the spring of 2001 show that a substantial number have not yet moved. Because our baseline survey occurred in April 2000, the sample for this study likely consisted of the same group that the counseling agencies have identified as more difficult to serve.6 Our results indicate that finding solutions for these families will not be simple.
As noted earlier, the CHA’s counseling programs and services are still a work in progress. The CHA has made a number of substantial changes to the relocation system in response to problems noted in our earlier report. While this report primarily concerns policies and programs that have now been updated, we believe that our findings are still relevant. The types of challenges encountered during the first phase of implementation remain threats to the long-term success of the relocation effort, particularly the challenge of providing effective services to so many residents with complex needs. In this section, we draw lessons from our findings about the issues that must be addressed to ensure that new policies and programs are implemented successfully to bring about the best possible outcomes for CHA’s remaining residents. Ongoing follow-up support is crucial.
Lease compliance issues appear widespread among the residents who remain in CHA housing.
Tracking a resident’s right to return is important.
Many residents may need more intensive preparation for the private market.
Consistency and coordination among service providers is crucial.
Ongoing evaluation is important.
More intensive service and long-term follow-up are needed.
6 Specifically, families with multiple complex problems, lease compliance issues, or credit problems.

CHA Relocation Counseling Assessment—Final Report v
The CHA is currently attempting to implement an extremely ambitious set of services that it hopes will both bring about positive outcomes for its current residents and transform its troubled developments. Our assessment of the first phase of relocation highlights critical issues that require attention from the agency and its partners as they continue to try to improve and expand services. The problems inherent in the previous relocation system clearly indicate the need for careful strategic planning, coordination, and ongoing monitoring to ensure that relocation runs as smoothly as possible.
Successfully transforming CHA’s housing and bringing about good outcomes for its current residents is extremely challenging. The agency is under pressure to rapidly move forward with its transformation plan. Federal regulations require the rapid closing and demolition of nonviable developments; financing agreements require the redevelopment plans to proceed on set schedules. The CHA has made many modifications to its services to try to address the types of problems identified in this report and has expanded its counseling programs substantially. However, there are still many serious challenges, including the pace of relocation and demolition, the adequacy and effectiveness of services, and the complex needs of the remaining residents—including those who are living in CHA developments illegally. The CHA will need to continue to think strategically and creatively about how to ensure that the very poor families who have depended on its developments for shelter end up in decent, secure housing.

CHA Relocation Counseling Assessment—Final Report 1
OVERVIEW Public housing in Chicago, as in many cities across the nation, is currently undergoing a
dramatic transformation. In 1998, nearly 19,000 of the Chicago Housing Authority’s (CHA’s) units failed viability inspection, meaning that under federal law the CHA was required to demolish the units within five years.7 As a result, the city put forth a plan to “transform” the CHA’s enormous high-rise developments into smaller mixed-income communities of town homes and low-rise buildings. The CHA Plan for Transformation calls for the demolition of 51 gallery high-rise buildings, as well as several thousand mid-rise and low-rise units.8 The CHA will redevelop or rehabilitate 25,000 units of public housing; however, the plan calls for a substantial reduction in family public housing units (a net loss of 14,000 units). The original plan called for the relocation of as many as 6,000 families9 with Housing Choice vouchers (Section 8 vouchers).10 This plan, including relocation and revitalization, is estimated to cost $1.5 billion over 10 years.
In 1999, the CHA began implementing housing search programs to help relocatees find housing in a broader range of neighborhoods. These programs also provided a range of training programs (e.g., workshops on tenant rights and responsibilities, budgeting, and housekeeping) and supportive services (generally, case management) intended to help relocatees become successful private-market tenants. The overarching goals of CHA’s relocation services were to help participants make good housing choices for themselves and their families; help participants make a successful transition to the private market; and prevent the creation of clusters of relocatees in other high-poverty neighborhoods.
During the first year of relocation, the CHA’s counseling services were targeted to residents of buildings slated for closing and demolition who indicated that Section 8 was their first choice for replacement housing. Since then, the CHA’s services have evolved significantly. In addition to relocation counseling for residents who receive vouchers, the agency now offers all tenants housing choice clinics and information sessions intended to help explain relocation options, Good Neighbor counseling, and a Service Connector program to provide case
7 Section 202 of the Omnibus Consolidated Reconciliation Act (OCRA), 1996. 8 See the CHA Plan for Transformation (October 2000) for more details regarding demolition and relocation.
Most of these demolitions are covered by a 1996 federal law calling for the conversion to vouchers of certain severely distressed public housing developments.
9 Based on its experience with the first three years of the plan, the CHA now believes that this figure will ultimately be lower than originally estimated.
10 The Quality Housing and Work Responsibility Act of 1998 merged the Section 8 certificate and voucher program into one to create the Housing Choice Voucher program. We refer to this program throughout the report as “Section 8 vouchers” or “Section 8.”

CHA Relocation Counseling Assessment—Final Report 2
management and linkages to community services. Residents are also offered the option of participating in the new Gautreaux II Mobility program, which provides mobility counseling and assistance in moving to “opportunity areas,” communities with poverty rates below 23.49 percent.
This report provides a systematic look at what happened to a sample of residents as they moved through the relocation process from 1999 to 2001, and provides feedback for the CHA’s ongoing efforts to refine its relocation process. The challenges encountered during the early phases of implementation remain threats to the long-term success of the Plan for Transformation, particularly the challenge of providing effective services to so many residents with complex needs.
In the following sections, we present an overview of the study and major findings. First, we describe the purpose of the study and our research methods. We then provide contextual information on the CHA’s Plan for Transformation and an overview of the counseling services that have been provided during the first phases of implementation. Next, we highlight our major findings from this longitudinal study, discussing outcomes for movers and the barriers that have prevented many residents in our sample from relocating successfully. Finally, we provide a discussion of the lessons this research provides for the ongoing relocation effort.
PURPOSE OF THE STUDY
The original intent of the CHA Relocation Counseling Assessment was to provide rapid feedback to the CHA, the Section 8 program, and the counseling agencies providing relocation counseling services. However, as the CHA’s programs rapidly evolved, the focus of the study shifted to describing the experiences of the 190 residents in the sample as they went through the relocation process. All were in buildings originally slated for closure and demolition early in the transformation process and have experienced both the original relocation services and changes that have occurred over time. This study provides systematic information about the experiences of those who have moved and the barriers that have prevented other participants from successfully relocating. The experiences of this sample of residents can be used to highlight critical issues that require attention as the CHA continues to improve and expand its relocation process and counseling services.
A secondary purpose of the study was to inform other actors concerned about the relocation process and the overall Section 8 program, including the Mayor’s Office, the Chicago Department of Human Services, and the U.S. Department of Housing and Urban Development (HUD). The study was funded by a grant from the John D. and Catherine T. MacArthur Foundation and was conducted by the Urban Institute, a nonprofit nonpartisan policy research and educational organization based in Washington, D.C., and its partner, the University of Illinois at Chicago.

CHA Relocation Counseling Assessment—Final Report 3
METHODOLOGY
To answer the research questions above, our study uses a variety of methods, including a collection of both qualitative and quantitative data. Specifically, we combined information from three major sources:
• A three-wave panel survey of a sample of approximately 190 CHA residents awaiting relocation with Section 8. The CHA relocatees in our sample are all leaseholders who selected Section 8 as their first option for relocation when their buildings were slated for closing in September 1999, but had not relocated by the winter of 2000, when our study began. Survey design and sample selection for the baseline survey were conducted in February and March 2000 and the survey was administered between April and June 2000. The first follow-up was conducted between November and January 2001. The third and final survey wave began in May 2001 and was completed in September 2001.
• In-depth interviews with CHA relocatees focusing on their experiences with the counseling programs. For the first round, project staff conducted in-depth interviews with 7 CHA respondents (mostly recent movers identified in the survey) in May 2000 to ask about their experiences with relocation counseling. The second round of in-depth interviews focused on the barriers to relocation. In March 2001, project staff conducted interviews with 11 CHA relocatees who were surveyed at baseline but had not yet relocated. Finally, in March 2002, project staff conducted interviews with 12 CHA relocatees who moved with vouchers.
• A process study of the counseling and relocation services provided by the CHA’s contract counseling agencies. Between February 2000 and December 2001, these agencies were The Leadership Council for Metropolitan Open Communities, Family Dynamics Inc., Changing Patterns for Families, and E.F. Ghoughan. Project staff conducted group interviews with CHA staff and counseling program administrators in January 2000 and held interviews and program observations from April to August 2000. They observed workshops and other program activities such as van tours and workshops for tenants and conducted one-on-one interviews with program administrators and individual counselors. 11 Finally, project staff conducted
11 During the second year of the study, the focus of the field work was on conducting observations at CHAC
for our companion assessment of CHAC’s Mobility program. The change in focus was due, in part, to the fact that CHA’s counseling agencies turned over and there was a long start-up period during which limited counseling occurred.

CHA Relocation Counseling Assessment—Final Report 4
follow-up interviews with program administrators and other key actors involved in the relocation process in the winter of 2001 and the spring of 2002. 12
Limitations of This Research
This study provides the first systematic evidence of what happened to CHA residents who initially chose Section 8 for replacement housing. However, because the study was intended to provide rapid feedback for an ongoing process, we were, by design, studying a moving target. We had to adapt our study to reflect changes in the CHA’s process. A timeline showing changes in the CHA’s programs and our major research activities is shown in appendix A. Our original research design called for selecting a random sample of relocatees from buildings that had not initiated the relocation process. However, after the fall of 1999, the CHA began to revamp its plans and hold off on closing additional buildings. Since our survey began in February 2000, we had to draw our sample of relocatees from buildings slated for closing in September 1999.13 According to CHA records, just over half the families who had originally lived in those buildings had relocated by February 2000. As a result, our respondents do not represent all residents referred for counseling in September 1999, but rather are a random sample of the 350 households who, according to CHA records, were referred for counseling but had not yet relocated.14
There are several reasons why these residents may not have moved by February 2000. One possibility is that the CHA’s demolition schedule and plans for redevelopment had changed by the time we conducted the baseline survey and could have affected residents’ decisions about housing choice. They may have decided to postpone moving for family reasons—for example, to avoid moving children during the school year. But our data suggest that the more likely explanation is that they may have had problems—personal problems or lease compliance issues—that made it difficult for them to move or even ineligible for replacement housing. Thus,
12 These key actors include the following: CHA administrative staff; staff from the MacArthur Foundation working with the CHA; attorneys representing CHA tenants from BPI, the Legal Assistance Foundation, and the National Center for Poverty Law; resident leaders from the LAC and Coalition to Protect Public Housing; staff from the Resident’s Journal; staff from the Metropolitan Planning Council; administrators from the CHA’s counseling agencies and CHAC; journalists writing about CHA-related issues; and researchers studying issues related to the CHA Transformation.
13 This list included all residents who had indicated Section 8 as their first choice for replacement housing and were referred to one of three counseling agencies in September 1999. Our response rate at baseline was 84 percent.
14 The majority (72 percent) of the relocatees on this list were residing in the Robert Taylor Homes. The respondents from Robert Taylor and Henry Horner include families who were relocated on an emergency basis because of heating failures in their original buildings in January and February 1999. Details on survey methodology are presented in appendix A.

CHA Relocation Counseling Assessment—Final Report 5
because of the timing of our study, our sample likely represents those residents who face the greatest challenges in transitioning out of public housing.
CHA PLAN FOR TRANSFORMATION
To understand the challenge of providing relocation and mobility services for CHA residents, it is important to review the recent history of public housing transformation in Chicago. By the early 1990s, the CHA’s decaying high-rise developments had become emblematic of the problems of distressed public housing; impoverished communities with very high crime rates dominated by gangs and drug dealing. Because of the extreme nature of the CHA’s problems, the U.S. Department of Housing and Urban Development (HUD) took control of the housing authority in May 1995. In September of that year, HUD selected the Quadel Consulting Corporation to manage the CHA’s Section 8 program. Quadel created a subsidiary, CHAC Inc., which formally took over program administration on December 1, 1995.15
Following the HUD takeover, the CHA gradually began to close and demolish buildings in its high-rise developments, initiating a massive revitalization effort in the Henry Horner development in late 1995. Between 1993 and 1998, HUD awarded HOPE VI grants for redevelopment efforts in Cabrini-Green, Henry Horner, ABLA Homes, and Robert Taylor. In 1998, nearly 19,000 of the CHA’s units failed viability inspection, meaning that under federal law the CHA was required to demolish the units within five years.16 This viability assessment created an even greater imperative to develop a strategy for replacing the CHA’s developments.
In 1999, the city of Chicago and the CHA developed a comprehensive plan to “transform” CHA housing. The plan called for the demolition of all of the CHA’s gallery high-rise buildings, as well as several thousand mid-rise and low-rise units, rehabilitation of senior buildings and scattered site units, development of mixed-income replacement housing, and relocation of as many as 6,000 families with Section 8. After 1999, the CHA received additional HOPE VI grants for Wells/Madden, Taylor, and Rockwell Gardens, making it the largest recipient of HOPE VI funds in the nation.
According to CHA staff, since the plan was approved in 2000, the CHA has demolished 4,665 units, including 2,293 in FY 2001.17 The authority has rehabilitated more than 2,000 units, primarily in senior buildings, and begun construction on several small, mixed-income
15 For more information on the recent history of the Section 8 program, see Susan J. Popkin and Mary K. Cunningham, Searching for Housing with Section 8 in the Chicago Region (Washington, D.C.: The Urban Institute, 2000). For a detailed history of the CHA, see Susan J. Popkin, et al., The Hidden War: Crime and the Tragedy of Public Housing in Chicago (New Brunswick, N.J.: Rutgers University Press, 2000).
16 Section 202 of the Omnibus Consolidated Reconciliation Act (OCRA), 1996. 17 More than 2,000 units were demolished before the approval of the official Plan for Transformation.

CHA Relocation Counseling Assessment—Final Report 6
developments.18 About 1,200 households have been formally relocated, most during FY 2001. About 490 (300 in FY 2001) of these households have received vouchers, while the rest have been relocated to other public housing. The CHA’s Year 3 Plan for FY 2002 calls for the construction or rehabilitation of more than 6,500 units (mostly in senior buildings), the demolition of more than 4,000 units, and the relocation of 1,500 families, of which more than 900 will receive vouchers.19 However, CHA staff now believe that the actual number of households who receive vouchers in FY 2002 will be substantially lower—closer to 600 overall.
Relocation Rights Contract
The CHA’s relocation process has changed substantially over time. One major factor was the relocation rights contract, created in response to concerns raised by advocates for CHA tenants. The contract spelled out the CHA’s obligations to residents during the transformation process. The CHA and its Central Advisory Council (CAC), the CHA’s official resident organization, signed the contract in December 2000. Per this agreement, all lease-compliant tenants living in CHA housing as of October 1999 are guaranteed a right to return to public housing.20 Lease-compliant tenants were defined as tenants who
• are up to date on their rent and utility payments and/or repayment agreement;
• are compliant with terms of the August 15, 2000 lease and federal requirements (including one-strike provisions that disqualify any tenants with household members who have evidence of involvement in drug or felony activity);
• have no unauthorized tenants in their units;
• have a good housekeeping record, with no documented evidence in CHA files of destruction, damage, or removal of CHA property.
In addition to guaranteeing a right to return, the contract provided a process for notifying residents about relocation and guaranteed them certain rights during the relocation process. It also defined the services that would be offered to residents during the transformation, including supportive services and relocation counseling.
Since the contract was signed, the CHA has made a number of changes to its relocation process. The agency created a relocation department and developed relocation planning meetings and housing choice clinics to help ensure that residents were making informed
18 The Chicago Housing Authority, MTW Annual Report FY2001, March 2002. 19 The Chicago Housing Authority, Plan for Transformation, Year 3: Moving to Work Draft Annual Plan FY
2002. September, 2001. 20 See CHA Leaseholder Housing Choice and Relocation Rights Contract, November 2000.

CHA Relocation Counseling Assessment—Final Report 7
choices about replacement housing. According to CHA relocation staff, the agency held 490 housing choice clinics in FY 2001 and collected completed housing choice surveys from nearly all of the residents (92 percent) in buildings slated for closure in FY 2002. As part of this effort, staff report that the CHA has made ongoing efforts to simplify the materials it provides to residents. The agency has also worked to develop a tracking system to follow residents through the relocation process.21 Finally, as discussed in more detail below, the CHA has made a number of changes to its counseling services.
CONTINUING CHALLENGES
In light of the size and scope of the CHA Plan for Transformation, a number of observers have raised concerns about the risks involved in this massive undertaking, particularly for current CHA tenants and receiving neighborhoods. From our reviews of available data and reports, interviews with key actors, and the information we have collected about the residents in our sample, we have identified the following critical issues about the transformation process to date:
• Adequacy of resources. Various observers have questioned whether the CHA really has adequate funds to carry out its transformation plan or provide services to residents. The official estimate of the costs of the Plan for Transformation is $1.5 billion; however, the city and the housing authority have acknowledged from the beginning that additional funds will have to come from leveraging other resources. Further, a number of key actors and media observers questioned whether the CHA’s funds are enough to provide effective supportive services to its remaining residents.22
• Pace of relocation and demolition. A number of key actors we interviewed questioned the pace of relocation and demolition. Many cited concerns about the number of demolished units far exceeding the number of newly constructed replacement units. In addition, observers are concerned about the pace of demolition and relocation outpacing the development of services to support CHA families. A recent report issued by the Metropolitan Planning Council (Snyderman and Dailey 2002)raised similar concerns. These observers also claim that an unknown number of households left CHA before signing the Relocation Rights Contract and have not received the services to which they are officially entitled. For example, the service
21 The Chicago Housing Authority, MTW Annual Report FY 2001, March 2002; the Chicago Housing
Authority, CHA Relocation Department Presentation, April 18, 2002. 22 See for example, A. Kotlowitz, “Where is Everyone Going?” Chicago Tribune Magazine March 10, 2002;
Snyderman and Dailey 2002.

CHA Relocation Counseling Assessment—Final Report 8
connector program, intended to help residents address lease compliance problems, was not implemented until late 2001 and observers have called its effectiveness into question.23
• Ensuring residents make informed choices. Despite the CHA’s efforts—creating a relocation department, developing housing choice clinics, and holding relocation information sessions—many key actors note that residents remain confused and poorly informed about the relocation process. Even CHA staff acknowledge that providing adequate and easily understood information to residents is a major challenge. The CHA has invested in developing new materials for residents—including a cable show and audiovisual materials—that are intended to be easier to follow even for residents with low literacy levels. Still, many residents have difficulty understanding the material. Further, many are alienated from the process and fail to attend the information sessions. Highlighting the level of confusion, a recent survey of Wells residents found that nearly a quarter said that they learned about the plans for their development from the interviewer (Popkin et al. 2002 Although it is not clear why these residents were confused, qualitative findings from that study suggest high levels of confusion and disconnection from the process.
• Clustering and availability of units. A number of key actors continue to question whether there will be enough affordable private market housing for all residents who receive vouchers (Fischer 2001; MPC 2002). Concern about the availability of private market housing led HUD and other local government agencies and philanthropic organizations to fund a rental market study in 1999 (Great Cities Institute 1999). This study, along with a recent review conducted by the Urban Institute (Turner et al. 2001 concluded that the available data indicate that there likely is enough potential affordable rental housing in the Chicago metropolitan area to absorb the number of CHA tenants expected to relocate with Section 8. However, CHA tenants may not have access to this housing, they may lack information about available units in unfamiliar areas, and, further, landlords may not be willing to rent to them. For these reasons, observers fear that CHA residents may end up clustered in other very low-income communities that suffer from many of the same problems as CHA developments. In addition, if this clustering does occur, the large influxes of public housing residents may have the potential to destabilize moderate-income African-American neighborhoods that border these poor communities.24
23 See for example, B. J. Rogal, “Staffing Shortage Hits CHA Families.” The Chicago Reporter, April 2002;
Snyderman and Dailey (2002). 24 See Turner, Popkin, and Cunningham (2000) for a discussion of the evidence on the impact of Section 8
on neighborhoods.

CHA Relocation Counseling Assessment—Final Report 9
• Inadequate resident representation. Several key actors raised concerns about what they viewed as the lack of effective resident representation in the transformation process. Some questioned whether the CHA’s official resident organization, the CAC, truly represented the interests of all residents. Others questioned whether attorneys officially speaking for CHA residents in negotiations with the CHA were really reflecting the concerns of most tenants.
• Residents’ ability to transition to the private market. Some observers raised concerns about whether current CHA tenants will be able to make a successful transition to either the private market or new mixed-income developments. Many may have lease compliance problems that make them ineligible for replacement housing. Earlier phases of this research support these concerns, documenting that compared with mainstream Section 8 recipients, CHA relocatees face substantially more barriers, particularly substance abuse, depression, gang affiliation, domestic violence, and lack of private market experience (Popkin and Cunningham 2000, 2001).
• Effect on illegal tenants. Many key actors—including CHA staff, city agencies, and service providers—have become increasingly concerned about the potential impact of redevelopment on the estimated thousands of illegal residents of CHA developments. These “unauthorized tenants” are particularly vulnerable to becoming homeless as a result of the transformation process.
• Lack of accurate information regarding residents’ status. A major problem for the CHA has been the lack of accurate information about the number of remaining residents, their lease compliance status, and their progress through the relocation system. Over the past year, the CHA has implemented a comprehensive system for tracking residents, but as several key actors point out, many residents eligible for relocation services under the Relocation Rights Contract were relocated—or simply left—before this system was implemented. Plans for monitoring the relocation process were still under discussion as of mid-2002.25
• Coordinating multiple agencies. Our previous report cited the problem of coordination among counseling agencies and between counseling agencies, the CHA, and CHAC as a major concern and a key issue for successful implementation. Lack of coordination creates the potential risk that families will get lost in the process and not receive the services to which they are entitled. Further, it creates the possibility of inconsistency across service providers, a problem we noted during the first phase of relocation. Since our first report, CHA staff have implemented regular
25 For a more detailed discussion of this issue, see Snyderman and Dailey (2002).
CHA Relocation Counseling Assessment—Final Report 10
meetings of the counseling staff to help facilitate coordination. Key actors we interviewed who have participated in these sessions have found them helpful, but still cite potentially serious problems. For example, counselors at the Good Neighbor sessions are supposed to do needs assessments for participants and pass this information to the relocation counseling service, meaning that the initial counseling becomes a two-step process involving multiple agencies and counselors. The fact that there will now be 15 agencies—not including the CHA and CHAC—providing four different types of counseling services for CHA tenants means that providing consistent, coordinated services will become increasingly challenging.
RELOCATION SERVICES SINCE 1999
Since 1999, the CHA has made a number of changes to its relocation services to attempt to address many of the concerns cited above. As described in our previous report (Popkin and Cunningham 2001), the CHA encountered a number of challenges during the first phase of the implementation of the Plan for Transformation. In September 1999 the CHA rapidly closed more than 11 buildings, moving many families to temporary units in “cluster buildings” in their developments. Over 800 of these households indicated on their housing choice surveys that they had selected Housing Choice vouchers as their first choice for relocation. As noted above, the families in our study sample are from this pool of residents affected by the first phase of implementation. The CHA contracted with three agencies to provide relocation counseling for these residents: Changing Patterns for Families Inc., Family Dynamics Inc., and the Leadership Council for Metropolitan Open Communities.26
In 2001, the CHA revamped its counseling services substantially. The housing authority issued a new counseling request for proposals (RFP) in September 2000, requesting a modified set of services, including services to prepare relocatees for the private market, housing search assistance, and mobility counseling. As discussed above, the Relocation Rights Contract specified the services to be provided all current tenants. In April 2001, the CHA contracted with two agencies to provide the modified relocation services (Changing Patterns and E.F. Ghoughan Inc.).
Relocation counseling includes providing information on neighborhoods, identifying units, escorting clients to units, and assistance in completing paperwork for the Housing Choice Voucher process. In addition, the counselors are supposed to provide services such as budgeting and credit counseling, needs assessment, and connection to supportive services
26 A detailed description of the agencies’ services and missions was provided in our earlier report, Popkin
and Cunningham (2001).

CHA Relocation Counseling Assessment—Final Report 11
through the Service Connectors program. Finally, follow-up visits should be conducted at 30, 60, and 120 days after lease-up.
Table 1. Relocation Counseling Agencies 1999–2002
Counseling Agency Description Changing Patterns for Families Inc.
CPF was created in 1997 specifically as a relocation service for CHA residents, and is the only agency to consistently provide relocation services since the beginning of the Plan for Transformation in 1999. During Phase I, staff estimated that CPF relocated about 375 residents. CPF has also done emergency relocation for the CHA and relocated residents from Section 8 202 buildings converting to private market housing. CPF has provided Good Neighbor counseling since 2001.
Family Dynamics Inc. FDI is a child welfare agency founded in 1994. FDI provided relocation services from late 1999 to early 2001. The CHA relocation program was the agency’s first experience in providing housing search assistance. FDI provided a wide range of services, including case management, GED and computer training classes, after-school programs, and a juvenile detention alternative program. Family Dynamics also offered workshops on budgeting/money management, housekeeping, child care resources, and housing rights.
Leadership Council for Metropolitan Open Communities
The Leadership Council was the first agency in the United States to provide mobility counseling to Section 8 participants, administering the Gautreaux program for 20 years. The agency provided relocation counseling for CHA residents from late 1999 to early 2001. In late 2001, the Leadership Council contracted with the CHA to run a new mobility program for CHA residents, called Gautreaux II. This program is available to all CHA residents who are interested in making opportunity moves, whether or not their buildings are slated for demolition.
E.F. Ghoughan and Associates Inc.
E.F.G. has been a relocation counseling agency since mid-2001. The agency was created to provide intensive counseling for substance abuse addiction and mental health issues. E.F.G. also provides counseling on life skills, work-readiness, and employer relations.
In addition to the standard relocation counseling, the CHA contracted with the Leadership Council to provide a new Gautreaux-type program for any CHA resident (not just those in buildings slated for demolition) interested in making a mobility move. The Leadership

CHA Relocation Counseling Assessment—Final Report 12
Council began implementing its program in late 2001. Participants receive enhanced relocation counseling to assist them in moving to “opportunity areas,” for example, census tracts in the city where the poverty rate is less than 23.49 percent and less than 30 percent of the population is African-American. In suburban areas, the tracts must be less than 10 percent poor and less than 10 percent African-American.
In April 2002, the CHA issued a third RFP for “transitional counseling” services. Planned modifications to existing relocation counseling include offering all residents information about opportunity areas, showing one apartment in an opportunity area, mandating lower counselor caseloads for residents who opt for mobility counseling, and offering agencies incentive payments for low-poverty placements. As of this writing, the housing authority had selected four new service providers, none of which had previously provided services as part of the relocation process.
Other Counseling Programs
In addition to the revamped relocation counseling, the CHA created its Good Neighbor counseling program in response to concerns about the level of problems among its remaining residents, particularly their ability to make successful transitions to private market or replacement housing. The counseling consisted of a one-day session that included counseling on housekeeping and household management, utilities, budgeting, lease compliance, and finding and linking to services in a new community. All current CHA tenants are supposed to receive this counseling, whether or not they select Section 8 as their first choice for replacement housing. In April 2001, the CHA contracted with five agencies to provide Good Neighbor counseling sessions in its developments, and began implementing the program in May. The program continued to undergo modifications throughout 2001.
The final component of the CHA’s service package is the Service Connector program. The Service Connector program is administered by the Chicago Department of Human Services (CDHS) in partnership with the housing authority. According to a review by the Metropolitan Planning Council (Snyderman and Dailey 2002), the program consists of development-based case managers who assist residents in identifying and gaining access to community-based services provided through public agencies and social service providers. The CHA’s original plans called for one service coordinator for every 139 households. The housing authority contracted with six agencies—two of which are also CHA property managers—in 2001, each of which was to serve a cluster of developments.27 Service Connector staff are supposed to provide outreach, assessment, referral, and follow-up services to participants. The program has
27 CHA staff report that the contract for one of these agencies has been terminated as of summer 2002.

CHA Relocation Counseling Assessment—Final Report 13
met with much criticism, focusing on the adequacy of resources and effectiveness of services.28 Several key actors we interviewed noted that the Service Connector staff received little or no training, and questioned whether property managers were qualified to be social service providers.
In 2002, CHA relocation staff became concerned about the impact of demolitions on the estimated thousands of illegal tenants who live in its developments—both with legal tenants and in vacant units. The housing authority has begun plans to work with city agencies to develop services and supportive housing for these households.
Status as of Spring 2002
By the beginning of 2002, the CHA’s counseling programs had four major components: Good Neighbor counseling, relocation counseling, the Service Connector program, and the Gautreaux II Mobility counseling program. Together, these programs involved 13 different service providers—only one agency was contracted to provide both relocation counseling and Good Neighbor counseling services. In June 2002, the CHA selected four new agencies to provide relocation counseling, bringing the total number of service providers offering some form of counseling to CHA tenants to 17. In addition, CHA staff continue to provide housing choice clinics and relocation planning meetings, and CHAC, which administers the Housing Choice Voucher program, plans to offer all new admissions its own mobility counseling services. Finally, the City of Chicago, CDHS, and the CHA will be working to develop services targeted to non-leaseholders.
The residents in our study sample have been affected by all of these changes during the first phase of implementation of the Plan for Transformation. They experienced the first attempt to provide relocation counseling services in 1999; some of them relocated during that period, but as discussed in our earlier report, most ended up in “consolidation buildings” in their developments. Presumably, these residents have now been through Good Neighbor counseling, housing choice clinics, the new housing choice survey, and some may have been assigned to new counseling agencies. For this reason, even though they do not represent the full spectrum of CHA tenants, their experiences can help to inform the CHA’s ongoing efforts, particularly regarding the tenants who face the greatest barriers in transitioning out of public housing.
RESIDENT EXPERIENCES
In this section, we discuss the findings from our three rounds of surveys and interviews, focusing on outcomes at the 12-month follow-up. We describe neighborhood outcomes for the
28 For discussions of the problems with the Service Connector, see B. J. Rogal, “Staffing Shortage Hits CHA Families.” The Chicago Reporter, April 2002; Snyderman and Dailey (2002).

CHA Relocation Counseling Assessment—Final Report 14
residents in our sample, the barriers that have prevented many residents from leaving public housing, and the experiences of those who have successfully relocated.
As discussed in our previous report (Popkin and Cunningham 2001), the residents in our sample were extremely poor and disadvantaged, even in comparison to a similar group of residents participating in the Housing Choice Voucher program. Other research on national populations of low-income households supports the idea that public housing residents are particularly distressed, finding that those who live in public housing are generally more disadvantaged—lower income, less work history, and lower levels of education—than other welfare recipients (Zedlewski 2002). Finally, because of the timing of our research, the residents in the CHA relocation assessment sample likely represent the most troubled of the CHA’s own tenants.
Relocation Outcomes
In this section, we present our findings on the overall status of the residents in our sample at the 12-month follow-up. Overall, we were able to complete interviews with about 73 percent of the original sample of 190, or 139 households. At the 12-month follow-up, we were unable to locate 30 respondents; another 6 respondents had died, and 2 refused to participate. The whereabouts of the remaining respondents are unknown; some may have moved with a voucher, others may be in a different public housing unit, and some may have moved independently.29
As documented in our previous report, at the 6-month follow-up only 36 residents (23 percent of the sample) had moved out of public housing into a private market unit. As table 2 indicates, only another 17 households had moved successfully six months later at the 12-month follow-up. Overall, 55 (38 percent) had moved to a private market unit with a voucher, while the rest remained in the same public housing unit.
29 The survey team made multiple attempts to contact each respondent. At the two follow-up waves, initial
contact attempts were made by telephone. If that was unsuccessful, interviewers attempted to contact the respondent in person. Finally, they checked the names of respondents they were unable to locate against CHAC’s database to see if they could find more current addresses.

CHA Relocation Counseling Assessment—Final Report 15
Table 2. Survey Response and Relocation Status
Number of Respondents Total baseline sample 190 Total respondents at 12-month follow-up 139
Response Rate 73%
Relocation Status of Those Contacted Movers 55 Nonmovers 84
Status of Respondents Not Contacted (41 total) Unable to locate 41 Deceased 6 Respondent not available or refused 2
Differences between Movers and Nonmovers
At the 12-month follow-up, the number of movers was large enough for us to be able to explore some of the factors that were associated with being able to make a successful move. We found relatively little difference on most characteristics. Those who moved tended to have fewer children and to report being employed at the time of the survey. However, they did not differ from nonmovers on a range of other characteristics such as age, education, income, welfare receipt, health status, or access to a working car.
While movers and nonmovers differed little in terms of demographic characteristics, we did find indications that nonmovers seem to face personal barriers that make it very difficult for them to make a successful transition out of public housing. At the 6-month follow-up nonmovers were more likely to report paying their rent late and having to cut meals because of lack of money. As shown in figure 1, at the 12-month follow-up, the pattern continues: nonmovers were significantly more likely to report having paid their rent late in the past six months. Nonmovers were more than twice as likely as those who had moved successfully to report late rent payment (40 percent versus 15 percent). This pattern indicates that nonmovers likely had more serious lease-compliance problems than movers—and potentially broader problems with lack of resources or budget management. Another indicator of possible credit problems was that twice

0% 10% 20% 30% 40% 50% 60% 70%
Late rent in last six months
3 or more children
Employed
Worried about food often
Worried about food sometimes
Nonmovers
Movers
Figure 1Differences between Movers and Nonmovers at 12-Month Follow-up
N = 84
N = 55

CHA Relocation Counseling Assessment—Final Report 16
as many nonmovers (42 percent) as movers said that they could not afford a telephone in the past six months. Further, nonmovers were also significantly more likely to report having worried about not having enough food and cutting meals because they could not afford food.
Movers’ Experiences
Figure 2 shows that 55 respondents in our sample had moved by the 12-month follow-up. Most of our respondents are living in neighborhoods that have significantly lower poverty levels than their original, extremely poor public housing developments (all had above 60 percent poverty rates). The average reduction in neighborhood poverty for these households is 42 percentage points, meaning that there has been a striking improvement in conditions for many families.
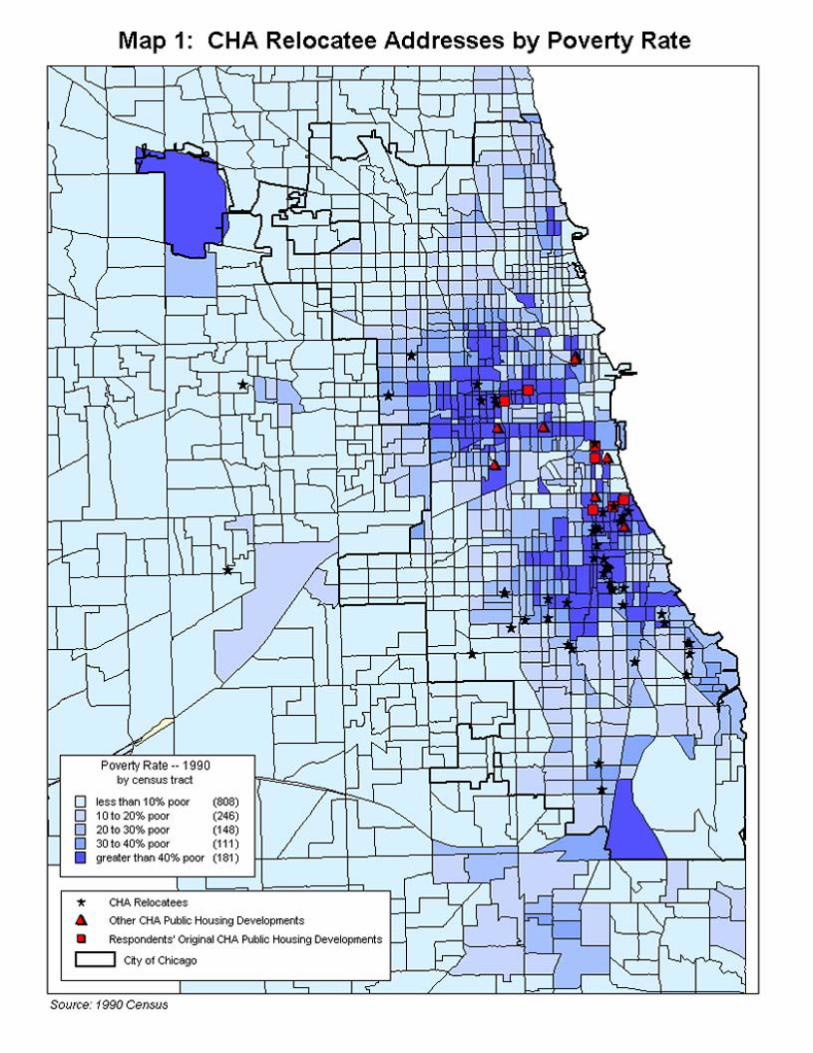
However, as figure 3 shows, even with this substantial reduction, many of the neighborhoods these households are living in are still very poor. More than half (55 percent) are living in communities with poverty rates greater than 40 percent; 18 percent are in neighborhoods with poverty rates of between 30 and 40 percent; and another 16 percent are in moderately poor neighborhoods, with poverty rates between 20 and 30 percent. Only 11 percent (representing 6 households) are living in a neighborhood that is less than 20 percent poor. Map 1 illustrates the relocation outcomes for the movers in our sample.
Further, as shown in map 2, while many of these households have experienced a substantial reduction in poverty, there has been less change in racial segregation. The vast majority of movers are living in neighborhoods that are more than 90 percent African-American (figure 4).

Relocated40%
Still living in public housing60%
Relocated
Still living in public housing
Figure 2Public Housing Movers at 12-Month Follow-up
N = 55
N = 85
% of respondents at 12-month follow-up
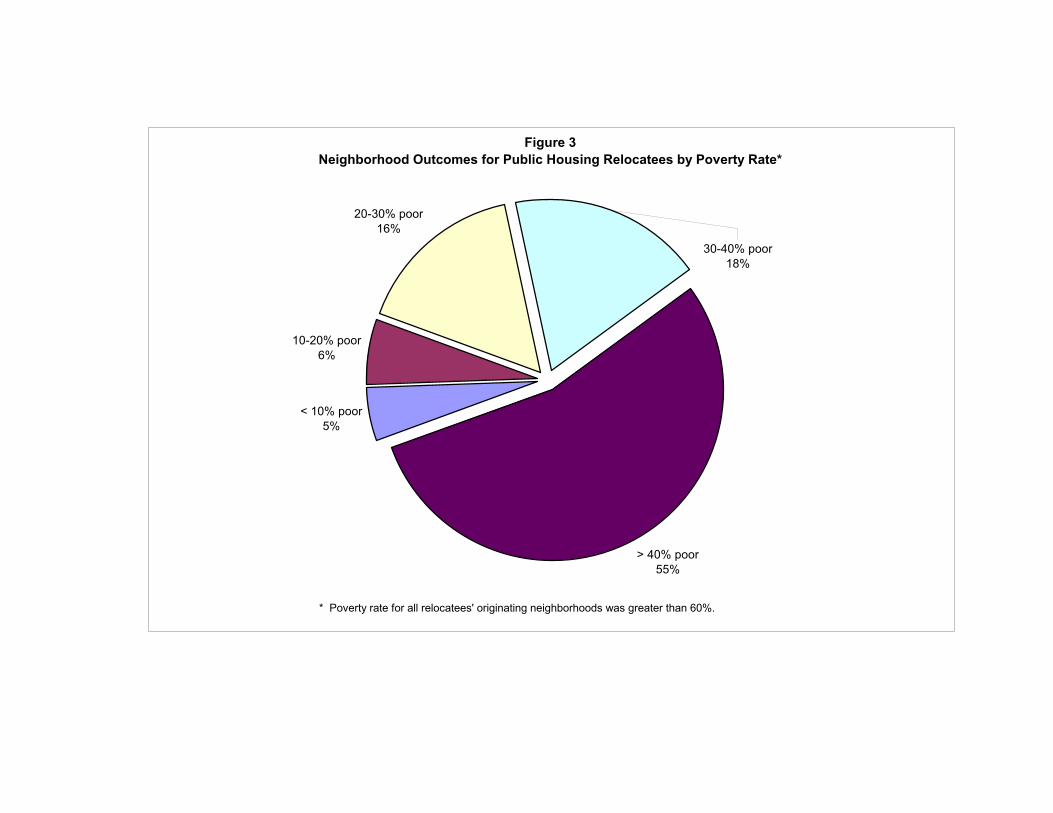
Figure 3Neighborhood Outcomes for Public Housing Relocatees by Poverty Rate*
< 10% poor5%
10-20% poor6%
20-30% poor16%
> 40% poor55%
30-40% poor18%
* Poverty rate for all relocatees' originating neighborhoods was greater than 60%.


Less than 90% black13%
Greater than 90% black87%
* Percentage black in all relocatees' originating neighborhoods was greater than 90% .
Figure 4Neighborhood Outcomes for Public Housing Relocatees by Percent Black*

CHA Relocation Counseling Assessment—Final Report 19
Improvements in Housing Conditions
The movers in our sample clearly perceive a substantial impact on their overall well-being as a result of these incremental improvements in their neighborhoods. They consistently report much better conditions than at baseline, and than their counterparts who have remained in public housing. In particular, these movers report significant improvements in their housing conditions. At each wave, we asked respondents about a range of problems with their housing, including peeling paint, broken plumbing, rats or mice, roaches, broken locks, and heat that does not work. Even though there were only a small number of movers at the second survey wave, our findings from the 6-month follow-up indicated that movers were living in substantially better conditions. Figure 5 shows that our findings from the 12-month follow-up survey are similar: Movers are significantly less likely to report any of these problems than those who are still living in CHA developments. Further, just 12 percent of movers report having at least one “big problem” with their housing compared with 53 percent of nonmovers.30
Many of our in-depth interview respondents talked enthusiastically about their new apartments. This woman’s comments were typical:
Oh yeah, it’s a nice apartment, real nice. They keep everything well-kept…I love the apartment. I love it. [R=100217]
While most of the women we interviewed said that their new apartments were much better, a few complained of problems such as lack of space or poor maintenance. Further, several spoke about the new challenges of living in the private market: less stable housing, difficulties in paying utility bills, and loss of the supportive services they had relied on to get by. For example, this woman said that she had to leave the first unit she moved to because the landlords decided to sell the building to their daughter:
Then they came up with they’re selling the building. To whom did they sell the building? They sold it to their daughter and her husband…That’s not selling no building. I had to move because they were selling the building. [R=100166]
Another respondent poignantly described the challenges of managing utility payments in the private market, and the fear she felt because she did not have the supports she had been able to rely on in public housing:
In [CHA] housing you can call in a work order…they might not get to it right now in a week or so later. You don’t worry about a gas bill, but you do worry about housing maintaining heat. You never worry about a threat that your water was about to get cut off. When you had a problem with your light bill, it was easier for
30 This difference is statistically significant at the p < .001 level.

0% 10% 20% 30% 40% 50% 60% 70% 80% 90% 100%
Peeling paint or broken plaster
Plumbing that does not work
Rats or mice
Cockroaches
Broken locks
Heat not working
Nonmovers
Movers
Figure 5 Movers' Housing Conditions at 12-Month Follow-up
N = 55
N = 84

CHA Relocation Counseling Assessment—Final Report 20
you being in public housing to go to a program and get help, but it’s not so [easy] once you’re not there. You have the threat of [Section 8] inspectors coming around…harassing you about things…and you’re not the landlord. You got threats of the water company coming and giving you cutoff notes. When the gas company cuts off your gas…it’s off. It ain’t like somebody’s going to come in the middle of the night and see what’s going on. Your lights, when they turn them off, then comes the panic. Now see, honestly, people have a way of getting around lights in housing because you can pay somebody ten dollars to go in there and turn them back on. You can’t do that [on Section 8]. [R=100149]
Improvements in Neighborhood Safety
The 12-month follow-up shows dramatic differences between movers and nonmovers in perceptions of neighborhood safety. As figure 6 shows, movers report much lower levels of problems with physical disorder—graffiti and trash—and about half as likely as those still in public housing to report “big problems” with drug trafficking and gang activity in their neighborhoods. Even more important for their overall sense of well-being, movers are much less likely to report problems with violent crime: 41 percent of movers report big problems with shootings and violence, compared with 90 percent of nonmovers.
Ratings of the “collective efficacy” (Sampson, Raudenbush, and Earls 1997) of a community are associated with lower crime rates and neighborhood social organization. These ratings measure the social cohesion and level of social control in a neighborhood. Movers in our sample consistently rate their communities higher than nonmovers on social control (whether neighbors would take action if they saw someone causing problems) and on measures of social cohesion and trust (whether neighbors trust each other and share values). For example, 79 percent of movers say that people in their neighborhood are “willing to help their neighbors,” compared with 51 percent of those still in public housing (figure 7).
Many of the respondents we interviewed spoke about the dramatic improvement in neighborhood safety and how this had affected their own—and their children’s—lives. This woman described how much safer she and her children felt in her new neighborhood:
[My kids] love it. Because now they can have their friends come over and you don’t want to be afraid that somebody’s gonna jump on ‘em or beat ‘em up or do something like that. It’s free. And there’s no standing out in front of buildings. No hollering…here comes the police and stuff like that. It’s very quiet where I’m at. Very quiet. [R=100096]
Likewise, this woman said she felt less stressed because she no longer had to worry about her daughter’s safety:

Figure 6Neighborhood and Housing Conditions
Movers and Nonmovers at 12-month Follow-up
0% 10% 20% 30% 40% 50% 60% 70% 80% 90% 100%
Graffiti
Trash
Gang activity
Shootings and violence
Nonmovers
Movers
N = 55
N = 84

Figure 7Social Cohesion and Trust
Movers and Nonmovers at 12-month Follow-Up
0% 10% 20% 30% 40% 50% 60% 70% 80% 90% 100%
People around here are willingto help their neighbors
People in this neighborhoodshare values
This is a close-knitneighborhood
People in this neighborhoodcan be trusted
People in this neighborhoodgenerally get along with each
other
% of Respondents
Nonmovers
Movers
N = 84
N = 55

CHA Relocation Counseling Assessment—Final Report 21
I’m sleeping and resting and comfortable and everything. I ain’t got to worry about my daughter leaving out, going to school, and something might happen. Worrying about her walking into gunfire, you know, all that. I’m glad. I used to get up every day, looking off my porch to see if my baby was safe. So I feel real good. [R=100287]
However, a few respondents said that their new neighborhoods were not much safer than their former public housing development:
It’s still a gentrifying neighborhood. The people … they shoot. They’ve been shooting around here … The only thing is that when we were living on 51st and State, if there was going to be a war between these guys they would let the neighborhood know. Now when something’s working out, you just hear gunshots. [R=100196]
Social Networks
While most movers we interviewed cited substantial improvements in housing and neighborhood conditions, some spoke about the loss of social networks. As this respondent put it:
It’s nice but it’s not the same. It’s not 51st and State. [R=100196)
This woman said what she missed most was “the closeness” in her public housing development:
I would say the closeness. You have your good people and your bad people but it seems that everybody would stick together. You know, you keep your distance from certain people and then you pull other people into you. [R=100149]
Surprisingly, although these differences are not statistically significant, our survey data show that at the 12-month follow-up, movers were more likely than nonmovers to report having friends and family in their neighborhood. About two-thirds of movers report having “many” friends and family in their community, compared with just over one-third of nonmovers. This finding is surprising, given the close networks of friends and family our interview respondents who still lived in CHA housing described. It is possible that the movers in our sample were able to use their vouchers to move near their family and friends; we know that most did not move far from their original developments. It is also possible that, because of the improvements in safety, movers have felt more free to form new networks in their new communities (figure 8).
Improvements in Outlook
Finally, our results provide some indication that the improvement in conditions—and the successful transition out of public housing—may have already had some impact on movers’ mental outlook. Although we did not find differences at baseline, at the 12-month follow-up,

0 10 20 30 40 50 60 70 80 90 100
Many
A few
None
Nonmovers
Movers
Figure 8Number of Family in Neighborhood
CHA Movers and Nonmovers at 12-month Follow-Up
N = 84
N = 55

CHA Relocation Counseling Assessment—Final Report 22
movers scored higher on self-efficacy, a measure of how much control you feel you have over your life. At the 12-month follow-up, just about half of movers agreed with the statement “Every time I try to get ahead, something stops me,” compared with about two-thirds of nonmovers. Our longitudinal data indicate that there has been a substantial increase in self-efficacy for movers over time, while the scores for nonmovers have not changed much (figure 9).
This respondent poignantly spoke about how moving to a new neighborhood had given her and other former CHA residents new hope
.... I see some people from around the projects that live around there, and they look totally different. They feel good about their self, you know what I’m saying, and they’ve got something to live for, not just living in the project doing what everybody else is doing, selling drugs and doing this and doing that. [R=100281]
Nonmovers’ Experiences
Only about 40 percent of the respondents in the CHA relocation assessment sample were able to make a successful move from public housing during the 12 months that we tracked them. The rest remained in consolidation buildings in CHA developments. Conditions in these buildings were reportedly very poor throughout the study period. As figure 10 shows, the majority of nonmovers reported at least one serious problem with their housing at the 12-month follow-up. These reports remained essentially constant over time; for example, at each wave, about half of the respondents reported problems with peeling paint and broken plumbing, about one-third reported problems with rats or mice, and about one-fifth reported problems with heat or broken locks. The only problem that declined slightly over time was cockroach infestation: at the baseline and 6-month follow-up, two-thirds of respondents reported this problem, but by the 12-month follow-up the figure had declined to just under half.
Our in-depth interviews with nonmovers found that these housing problems ranged from inconveniences to actual health hazards. For example, this respondent described living in a unit in a consolidation building with missing bathroom and bedroom doors and faucets that must be turned on and off with a wrench:
They brought me a bathroom door, I’ve been there a year, they brought me a bathroom door and never put it up. So it’s like you prop the door up for the bathroom. Never had knobs to my tub since I’ve been there. We turn the tub on, the water on, with a wrench. [R=100004]
This woman described more serious problems with her unit in the consolidation building, saying she twice had sewage back up into her unit and that the second flood had destroyed most of her belongings:

Figure 9Self-Efficacy
Movers at 6-Month and 12-Month Follow-ups
0%
10%
20%
30%
40%
50%
60%
70%
80%
90%
100%
Every time I try to get aheadsomething stops me…
When I make plans I canusually carry them out…
Planning only makes peopleunhappy…
Good luck is more importantthan hardwork for success…
6-month
12-month
N = 35
N = 55

0%
10%
20%
30%
40%
50%
60%
70%
80%
90%
100%
Peeling paint orbroken plaster
Plumbing that doesnot work
Rats or mice Cockroaches Broken locks Heat not working
6-month
12-month
Figure 10Housing Quality
Nonmovers at 6-Month and 12-Month Follow-ups
N = 35
N = 55

CHA Relocation Counseling Assessment—Final Report 23
Oh I had two floods. The worst flood I had, I lost all of my belongings. My TV, my microwave…about $800 or $900 worth of merchandise…. [But] I didn’t have but $499 worth of receipts for some of the things I had purchased. And they [CHA] gave me, it’s took about seven weeks, they gave me $400…. Then they gave me a voucher to go to the Salvation Army to get me a bed to sleep in. Because…my bed was closer to the floor, I don’t put my bed way up because of the shooting. [R=200001]
Nonmovers’ perceptions of problems with physical disorder and crime also remained constant over time. At each wave, nearly all—about 90 percent—reported problems with graffiti, trash, drug trafficking, drug sales, and violent crime.
Several respondents described the dangers they or their children had experienced in their buildings. One woman said she was shot in the head by a stray bullet. Another spoke of how the children in her building had terrorized her young son:
And he [my 6-year-old] can’t go outside and play. I have to pick him up from school. And these little kids are so cruel, it’s terrible. One of them had, it makes me so sad when I think about it, one of them have my son in the hallway and I heard him crying…I go out to the hallway and they had him on his knees, they had little play guns, they had a little play gun to his head…. [R=100188]
Finally, a number of respondents, particularly those from Robert Taylor, spoke of the dangers of having members from different gangs living in the same consolidation buildings. Several women mentioned that it was unsafe for their sons to visit them. Because of the high level of gang activity, even young men who were not active gang members were in danger.
Inside the building is where they sell their drugs. …having to walk through there…sometimes it messes with me mentally but I gather myself and go on upstairs. My son can’t come see me, and my grandbabies, I can’t see them like I want. [R=20001]
Reasons for Not Moving
In this section, we examine some of the factors that have kept the majority of the respondents in the CHA relocation assessment sample from moving in more than a year. We asked survey respondents in the two follow-up surveys why they had not moved since the baseline interview.31 Their responses reflect the range and complexity of the barriers that have made relocating these families so challenging. At the 6-month follow-up, the most common reason cited for not being able to move was not being able to find an apartment they like, for example, in a neighborhood where they feel comfortable, that has enough bedrooms, etc. At the 12-month follow-up, about a quarter of the nonmovers cited not being able to find a new
31 At wave 2, this question was open-ended and the responses were grouped into categories for analysis. At
wave 3, we used a closed-ended question based on the wave 2 responses.

CHA Relocation Counseling Assessment—Final Report 24
apartment; another quarter said that they had had “problems with Section 8;” and 13 percent said that they had not moved for “financial reasons.” Although more than a third of nonmovers said that they had paid their rent late in past six months, only a very small percentage (5 percent) said that they had officially been told that they were not lease-compliant (figure 11).
Another possible explanation for why so few respondents in the CHA relocation Assessment sample moved is that they changed their minds about their housing options as more information became available. However, we find little evidence to support this explanation. At the 12-month follow-up, only about 10 percent of nonmovers said they either had decided not to move, or simply liked where they were. Further, 75 percent said that they still planned on moving with a Section 8 voucher in the next six months and 56 percent said they were actively searching for housing (figure 12).
Our qualitative data suggest several other barriers that may have made it difficult for these residents to relocate during the study period. One factor that may have inhibited moves—particularly early on—is that many of these residents reported that they did not receive the counseling services that the CHA intended during the first phase of relocation. As discussed in our previous report, at the baseline and 6-month follow-up 40 percent of the respondents could not identify their counseling agency: 7 percent named CHAC, 6 percent said “other,” and 31 percent said that they did not have a counseling agency. At the 12-month follow-up, just 23 percent of nonmovers said they were still receiving mobility counseling, and almost half (45 percent) said that they had not been assigned to a counseling agency. Our survey did not ask about counseling services added after April 2001, including Good Neighbor counseling and housing choice clinics, because they had not yet been implemented at the time our survey was administered.32 Therefore, we are unable to assess whether these new programs were able to help ensure that residents were better informed about the services they were eligible to receive (figure 13).
Some nonmovers who had received counseling services complained that these services were inadequate. For example, one woman said that she felt she needed more information and support than the two group meetings at her counseling agency that she attended could provide, and many of the listings she received from her counselor were for units that had already been rented. She attributed the problems to the agency’s simply being overloaded with clients:
32 Our survey was administered between May and September 2001; contracts for Good Neighbor counseling
began in April 2001 and CHA was in the process of developing and refining the housing choice clinics during this period.

0%
10%
20%
30%
40%
50%
60%
70%
80%
90%
100%
Not lease compliant Financial reasons Personal problems Problems with Section 8 Cannot find an apartment
6-month
12-month
Figure 11Reasons for not Moving at 6-Month and 12-Month Follow-ups
N =117
N = 84

Figure 12Reasons for not Moving at 12-month Follow-up
0% 10% 20% 30% 40% 50% 60% 70% 80%
Decided not to move
Still plan on moving with Section 8voucher
Actively searching for housing

Figure 13 Knowledge of Counseling Agencies6-Month and 12-Month Follow-ups
0%
10%
20%
30%
40%
50%
60%
70%
80%
90%
100%
No counseling agency CHAC Other
6-month
12-month
N = 35
N = 55

CHA Relocation Counseling Assessment—Final Report 25
I believe it’s because they closed so many CHA buildings down at one time that the offices got overloaded with work and they were just pushing you in and pushing you out. And that was wrong for them to do the clients like that but that’s the way was happening. [R=100088]
Likewise, this respondent complained that the group briefings and housing listings were unhelpful:
And they [counseling agency] are supposed to help. But I went to one of their meetings and they didn’t help me with nothing that I didn’t know. I mean they didn’t say anything that I didn’t know. As far as Section 8. As far as looking for an apartment. They said they can help find something. So the list they gave me, it’s worse than staying in public housing. [R=10076]
Several respondents complained that their counselors only offered them apartments in dangerous neighborhoods—neighborhoods they perceived as being as bad as the public housing developments they were trying to leave. As this woman put it:
They came and picked me up at the building. And then they took me around. They find apartments for you, you don’t find it yourself…. And the neighborhoods were just like the neighborhood I’m in now. [R=100117]
This same woman went on to say that her counselor never asked her where she wanted to live and that she felt that her counselor was trying to bully her into taking an apartment she did not want in a neighborhood she felt was unsafe:
Yeah, that’s how it felt. Wherever they found [a unit], they expected you to take it or, “Girl, I don’t feel like keep going all around looking,” that’s how they were….[ R=100117]
The private rental market also presented major challenges for many of these residents. Many the nonmovers in our sample had searched for housing, some of them intensively. In-depth interview respondents described calling their counseling agencies regularly for listings, scanning the newspapers, and going out regularly to look at units. Those who had searched reported that the experience was difficult. They perceived discrimination against Section 8 holders generally; against CHA relocatees, who are often perceived as troublemakers or criminals; discrimination against families with children; and a tight rental market that has meant they have had to compete for units in better neighborhoods.33 This respondent described her experiences:
33 For a more detailed discussion on the rental market barriers facing Section 8 holders in general, see S.J.
Popkin and M.K. Cunningham (2000). Searching for Housing with Section 8 in the Chicago Region. Urban Institute Report. Washington, D.C.: The Urban Institute.

CHA Relocation Counseling Assessment—Final Report 26
Every place I find now and I call and asking where are you from and you tell them and it’s like well, they don’t come out and say well you from CHA we are not going to have nothing to do with you…they’ll say someone was looking at the apartment earlier and we’re going to go with them. Then they said well how many children do you have. And I’ll say well I have three small children. And they say well that’s a problem. Do you have any teenagers? No I do not. If you got teenagers then they say that’s a problem. They don’t want teenagers in the building. They don’t want small children in the building if they are not in school.… But I hope to get out. [R=100088]
In addition to problems with counseling agencies and rental market barriers, most of the residents we interviewed had profound fears about leaving their public housing communities. Bad as the conditions were, these developments were residents’ long-term homes. As discussed above, some of the movers we interviewed cited the loss of community as the main thing they disliked about having left public housing. Most of the residents in our sample—movers and nonmovers alike—had lived in public housing for more than a decade and many had extensive networks of family and friends. As a result, for many, the prospect of leaving was very frightening. This woman described her reasons for not wanting to leave Robert Taylor:
I’ve been there for 29 years. I’ve raised all my kids there. I’ve raised my grandkids, I’ve done raised four generations and I get respect. I stay in my own house. I know every- body and everybody knows me. [R=10075]
The many rumors about Section 8 that circulate in CHA developments have contributed to some residents’ reluctance to move. For example, the respondent quoted above also said she was afraid of being forced to move to the suburbs “where all the flooding is at,” a common fear expressed by CHA residents.34 Several other respondents cited rumors about Section 8 vouchers being good for only one year. These two residents interviewed in April 2000—both of whom had moved—described the rumors they had heard about Section 8 from other tenants.
Finally, residents’ personal problems have also created obstacles that have made it difficult for them to relocate. As noted in our previous report, many residents have physical health problems, and, overall, our respondents had relatively low levels of personal efficacy and very low expectations about their ability to improve their circumstances (in this instance, to move). Our six-month follow-up survey included a more comprehensive measure of depression.35 The results show that the level of depression is very high—approximately 40 percent of the respondents score as “depressed” (a score of 16 or more) and 10 percent of these score as moderately or very depressed (figure 14). The fact that some respondents were
34 See Popkin and Cunningham (2000) for a more examples of rumors and fears about relocation. 35 The Center for Epidemiological Studies Depression Scale (CES-D) was used to assess the degree of
depression. The scale employs 20 questions asking about the frequency with which each of the 20 events was experienced during the previous week. The weighted answers are added to create the depression score, which ranges from 0 to 60. Respondents with a depression score of 16 or more are considered depressed.

CHA Relocation Counseling Assessment—Final Report 27
surprised by the relocation and had not searched for housing likely reflects this overall level of depression and passivity.
As discussed above, many nonmovers also reported lease compliance problems that made it difficult for them to move. Nonmovers were more likely to report having poor rental payment histories. Further, they were also less likely to be able to afford telephone service, suggesting that a substantial proportion may have had serious credit problems. Two of the nonmovers we interviewed in-depth reported having large, unpaid light bills—one of them confessed that she had been illegally hooked up to the meter and had eventually gotten caught. She now owed $8,000.
I can’t see myself getting $8,000…that’s a lot of money. I can see if they would let me relocate and then I can pay or something like that. But they say I’m not the only one that there are a lot of us up in there owing our light bill…the meter man wasn’t coming out to read the meter because they were scared to come in the projects…. [R=100150]
LESSONS FOR ONGOING RELOCATION EFFORTS
Although this report describes the experiences of a relatively small sample of CHA residents, it offers important lessons for CHA’s ongoing efforts to improve and expand its relocation services. While the majority of residents who were referred for relocation services in September 1999 have left public housing, both our survey data and counseling agency records from the spring of 2001 show that the number who have not yet moved is substantial. Because our baseline survey occurred in April 2000, the sample for this study likely consisted of the same group that the counseling agencies have identified as more difficult to serve.36 Our findings indicate that finding solutions for these families will not be simple.
As noted earlier, the CHA’s counseling programs and services are still a work in progress. The CHA has made a number of substantial changes to the relocation system in response to the problems noted in our earlier report. Still, the types of challenges encountered during the first phase of implementation remain threats to the long-term success of the relocation effort, particularly the challenge of providing effective services to so many residents with complex needs. In this section, we draw lessons from our findings about the issues that must be addressed to ensure that new policies and programs are implemented successfully to bring about the best possible outcomes for CHA’s remaining residents.
36 Specifically, families with multiple complex problems, lease compliance issues, or credit problems.

0 10 20 30 40 50 60 70 80 90 100
<16 (not depressed)
16-30 (depressed)
31-45 (very depressed)
46-60 ( extremely depressed)
Nonmovers
Movers
Figure 14Depression Levels
6-Month and 12-Month Follow-ups
N = 36
N = 117
CHA Relocation Counseling Assessment—Final Report 28
• Ongoing follow-up support is crucial. The movers in our sample have clearly benefited from leaving public housing. However, many have encountered problems that threaten their stability in their new homes, including problems with landlords and difficulties managing utility payments. Providing effective follow-up support and linkages to counseling services is crucial if these residents are to make a successful transition to the private market.
• Lease compliance issues appear widespread among the residents who remain in CHA housing. Our findings indicate that lease compliance, both rental payment problems and criminal record issues, are probably widespread among the CHA’s remaining residents. On the surface, imposing more stringent conditions for occupancy seems reasonable—some of these “noncompliant” tenants have undoubtedly created much of the misery in the CHA’s developments. However, strictly enforcing these requirements could potentially displace a large number of households. As we stated in our earlier report, it is important that these lease compliance issues be dealt with compassionately and that CHA’s counseling programs offer serious services that will help residents who can “cure” their lease compliance problems to do so—an intensive service model will likely be required for most of these noncompliant tenants. In addition, CHA administrators and other concerned actors should begin thinking creatively about providing options for those who cannot “cure” their problems, such as serious drug addiction or enormous utility bills. Tenants with problems of this magnitude may require a solution such as supportive housing in order to avoid becoming homeless.
• Tracking a resident’s right to return is important. The CHA has been working to expand its capacity to track residents’ housing choices and relocation locations. It is important to collect this information and to make updates from this system available to the public via CHA quarterly reports on transformation.
• Many residents may need more intensive preparation for the private market. Providing the Good Neighbor training sessions on budgeting and household management is potentially useful, but without long-term follow-up and reinforcement, many residents may have difficulty applying the information provided. In particular, our research suggests that residents who have lease compliance issues and complex problems, such as drug addiction, will need more intensive support. We encourage the CHA to link this training to longer-term services, perhaps through its Service Connector program.
• Consistency and coordination are critical. The CHA now has 17 different contractors providing different forms of counseling to its residents. The findings from the first phase of our research documented the problems that result from poor communication and the crucial importance of coordination among different counseling agencies to ensure that a consistent level of service is being provided to all residents. The CHA has taken many steps to facilitate coordination, including holding training sessions and regular meetings with

CHA Relocation Counseling Assessment—Final Report 29
counseling agency staff. However, these measures are not sufficient; the CHA needs to strictly monitor contract compliance, putting monitoring mechanisms and quality control measures in place so that they can ensure that services are adequate and effective. Finally, to ensure that residents are receiving the services promised under the Relocation Rights Contract, it is essential that the CHA’s new tracking database includes information on service provision.
• Ongoing evaluation is needed. CHA should continue to evaluate and refine its counseling services, interviewing residents about their experiences on an ongoing basis, as well as monitoring counseling agency activities.
• More intensive service and long-term follow-up are needed. Our findings suggest that the basic level of counseling services may not be adequate for many residents, especially those with multiple, complex problems. As this report documents, many CHA residents are extremely poor and have little education or formal work experience. Further, many suffer from depression and other physical and mental health problems. Many relocatees will need considerable assistance to stabilize their current situations to help them prepare to move; without this help, it is likely that even if they are relocated, they will not be able to sustain their new housing situation. We recommend that the CHA continue to expand its services to include long-term, intensive follow-up for all relocatees, not only those enrolled in the Leadership Council’s mobility program. For example, a model employed by the Moving to Opportunity Program in Los Angeles offered participants who had moved to new units with Section 8 a year of intensive counseling, workshops, job development, and other supportive services. Another successful model is the approach used by Project Match, which provides long-term services to help support public housing residents as they take incremental steps toward self-sufficiency. Implementing such a service-rich, long-term process will undoubtedly require a considerable allocation of resources. But not making this investment means that the relocation system will continue to face serious problems and may, ultimately, lead to substantial human costs for current residents.
The CHA is currently attempting to implement an extremely ambitious set of services that it hopes will both bring about positive outcomes for its current residents and transform its troubled developments. Our assessment of the first phase of relocation highlights critical issues that require attention from the agency and its partners as they continue to try to improve and expand services. The problems inherent in the previous relocation system clearly indicate the need for careful strategic planning, coordination, and ongoing monitoring to ensure that the relocation process runs as smoothly as possible.
Successfully transforming CHA’s housing and bringing about good outcomes for its current residents is extremely challenging. The agency is under pressure to rapidly move forward with its transformation plan. Federal regulations require the rapid closing and demolition

CHA Relocation Counseling Assessment—Final Report 30
of nonviable developments; financing agreements require the redevelopment plans to proceed on set schedules. The CHA has made many modifications to its services to try to address the types of problems identified in this report and has expanded its counseling programs substantially. However, there are still many serious challenges, including the pace of relocation and demolition, the adequacy and effectiveness of services, and the complex needs of the remaining residents—including those who are living in CHA developments illegally. The CHA will need to continue to think strategically and creatively about how to ensure that the very poor families who have depended on its developments for shelter end up in decent, secure housing.

CHA Relocation Counseling Assessment—Final Report 31
REFERENCES
The Chicago Housing Authority, MTW Annual Report FY 2001, March 2002.
———. CHA Relocation Department Presentation, April 18, 2002.
Fischer, Paul B. 2001. Section 8 and the Public Housing Revolution: Where Will the Families Go? Chicago: The Woods Fund of Chicago.
Great Cities Institute. 1999. For Rent: Housing Options in the Chicago Region. A Report to the Metropolitan Planning Council. Chicago: Metropolitan Planning Council.
Popkin, Susan J. 1990. “Welfare: Views from the Bottom.” Social Problems 37(1): 64–79.
Popkin, Susan J., and Mary K. Cunningham. 1999. CHAC Section 8 Program: Barriers to Successful Leasing Up. Report prepared for CHAC, Inc. Washington, D.C.: The Urban Institute.
———. 2000. Searching for Rental Housing with Section 8 in Chicago. Urban Institute Report. Washington, D.C.: The Urban Institute.
———. 2001. CHA Relocation Counseling Assessment Interim Report. Urban Institute Report. Washington, D.C.: The Urban Institute.
Popkin, Susan J., Victoria E. Gwiasda, Larry Buron, and Jean Amendolia. 1998. Chicago Housing Authority Resident Satisfaction and Management Needs Survey: Final Report. Report to the U.S. Department of Housing and Urban Development.
Popkin, Susan J., Victoria E. Gwiasda, Lynn M. Olson, Dennis P. Rosenbaum, and Larry F. Buron. 2000. The Hidden War: Crime and the Tragedy of Public Housing in Chicago. New Brunswick, N.J.: Rutgers University Press.
Popkin, Susan J., Diane K. Levy, Laura E. Harris, Jennifer Comey, Mary K. Cunningham, and Larry F. Buron. 2002. HOPE VI Panel Study Baseline Report—Draft. Report to the U.S. Department of Housing and Urban Development. Washington, D.C.: The Urban Institute.
Sampson, Robert J., Stephen W. Raudenbush, and Felton Earls. 1997. “Neighborhoods and Violent Crime: A Multilevel Study of Collective Efficacy.” Science 277(5328): 918–24.
Snyderman, Robin, and Steven D. Dailey II. 2002. Public Housing in the Public Interest: Examining the Chicago Housing Authority’s Proposed Service Connector Model. MPC Fact Sheet # 2. Chicago: Metropolitan Planning Council.
Turner, Marjery Austin, Susan J. Popkin, and Mary K. Cunningham. 2000. Section 8 Mobility and Neighborhood Health. Washington, D.C.: The Urban Institute.

CHA Relocation Counseling Assessment—Final Report 32
Turner, Margery A., Martin Abravanel, Susan Popkin, and Mary Cunningham. 2001. Public Housing Relocatees and the Rental Market in the Chicago Region. A Report to the U.S. Department of Housing and Urban Development. Washington, D.C.: The Urban Institute.
“The Center for Epidemiologic Studies Depression Scale.” McGraw-Hill Higher Education. Health and Human Performance. http://www.mhhe.com/catalogs/sem/hhp/faculty/labs/stress/01.mhtml (accessed May 5, 2001.)
Zedlewski, Sheila. 2002. The Importance of Housing Benefits to Welfare Success. Washington, D.C.: The Brookings Institution and the Urban Institute.

Appendix A Methodology and Study Timeline

CHA Relocation Counseling Assessment—Final Report 1
APPENDIX A: METHODOLOGY
Our study uses a variety of methods, including a three-wave panel survey; in-depth interviews with CHA relocatees; interviews with administrative staff at CHA, CHAC, and the counseling agencies; and observations of program activities. This appendix provides an overview of our sampling frame and response rates for Waves I, II and III of survey data collection, an overview of in-depth interviews conducted with CHA relocatees, and a description of the interviews we conducted with administrative staff.
Panel Survey of Participants
This report includes data from all three waves of data collection. The first wave of the survey was conducted between April and June 2000 and collected baseline information on CHA relocatee sample characteristics, service needs, health, self-efficacy, and factors relevant to relocation—such as housing choice and counseling agency contact. The second wave, conducted six months later between November and January 2001, collected follow-up data on both CHA relocatee respondents who moved from public housing and those who remained. We asked respondents who moved about their experiences throughout the process of searching for housing, leasing up, and adjusting to new units and communities, and about the quality of their housing and new neighborhoods. For the respondents who remained in public housing, we asked about their current housing and neighborhood conditions and reasons why they did not move. The third wave of the survey, conducted between May and September 2001, followed up on respondents six months after the second wave survey. Again, we surveyed both relocatee respondents who moved from public housing and those who remained, and asked respondents about their experiences searching for housing, leasing up, adjusting to the private market and their new communities, and the quality of their home and neighborhood. Respondents who did not move form public housing were asked about their experiences in CHA, and barriers to relocation.
Sampling Frame
We had originally understood that it would be possible to interview CHA relocatees for the baseline survey at either the CHA-conducted “Town Hall” briefing about the building’s closing or at the initial Section 8 briefing at CHAC. In either scenario, CHA relocatees would have just learned that CHA was closing their building and would be new to the relocation process. However, our reconnaissance research determined that neither of these were viable options. In September 1999, the CHA announced that it was closing 11 buildings for “winterization,” as well as a number of individual buildings in a number of developments. The CHA made no plans to close any additional buildings during the data collection period for the baseline. For this reason, we had to draw our sample from the group of buildings that were notified of building closings in
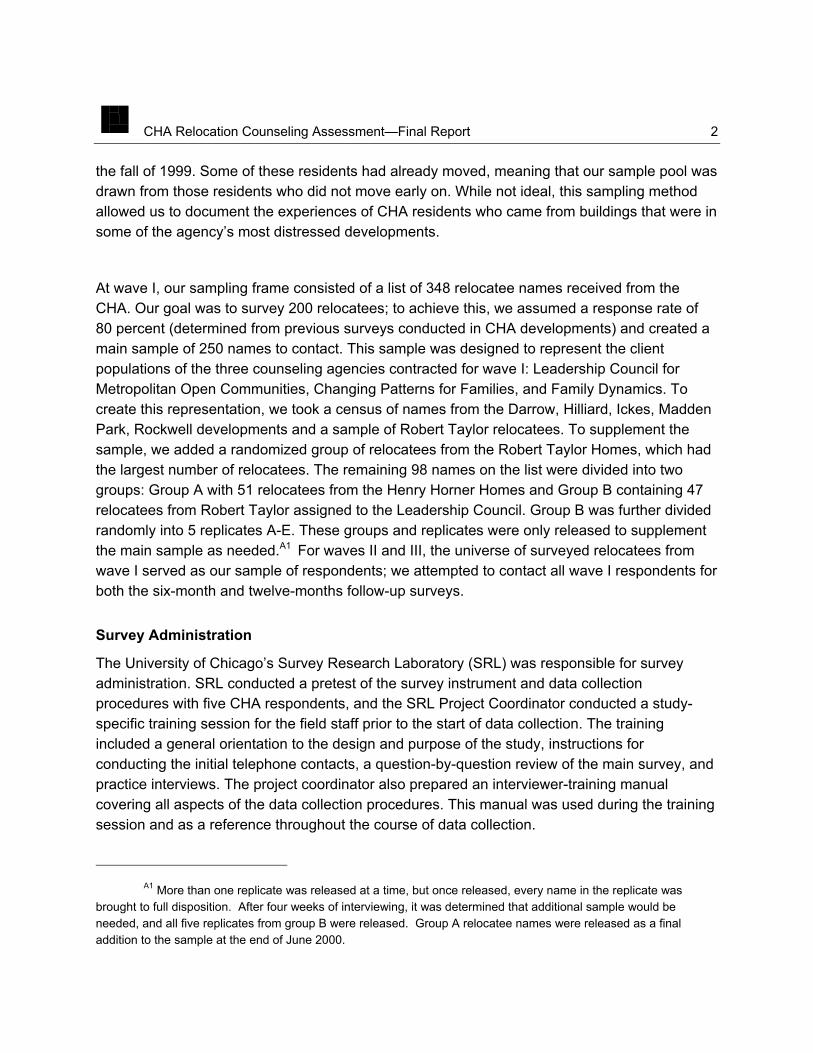
CHA Relocation Counseling Assessment—Final Report 2
the fall of 1999. Some of these residents had already moved, meaning that our sample pool was drawn from those residents who did not move early on. While not ideal, this sampling method allowed us to document the experiences of CHA residents who came from buildings that were in some of the agency’s most distressed developments.
At wave I, our sampling frame consisted of a list of 348 relocatee names received from the CHA. Our goal was to survey 200 relocatees; to achieve this, we assumed a response rate of 80 percent (determined from previous surveys conducted in CHA developments) and created a main sample of 250 names to contact. This sample was designed to represent the client populations of the three counseling agencies contracted for wave I: Leadership Council for Metropolitan Open Communities, Changing Patterns for Families, and Family Dynamics. To create this representation, we took a census of names from the Darrow, Hilliard, Ickes, Madden Park, Rockwell developments and a sample of Robert Taylor relocatees. To supplement the sample, we added a randomized group of relocatees from the Robert Taylor Homes, which had the largest number of relocatees. The remaining 98 names on the list were divided into two groups: Group A with 51 relocatees from the Henry Horner Homes and Group B containing 47 relocatees from Robert Taylor assigned to the Leadership Council. Group B was further divided randomly into 5 replicates A-E. These groups and replicates were only released to supplement the main sample as needed.A1 For waves II and III, the universe of surveyed relocatees from wave I served as our sample of respondents; we attempted to contact all wave I respondents for both the six-month and twelve-months follow-up surveys.
Survey Administration
The University of Chicago’s Survey Research Laboratory (SRL) was responsible for survey administration. SRL conducted a pretest of the survey instrument and data collection procedures with five CHA respondents, and the SRL Project Coordinator conducted a study-specific training session for the field staff prior to the start of data collection. The training included a general orientation to the design and purpose of the study, instructions for conducting the initial telephone contacts, a question-by-question review of the main survey, and practice interviews. The project coordinator also prepared an interviewer-training manual covering all aspects of the data collection procedures. This manual was used during the training session and as a reference throughout the course of data collection.
A1 More than one replicate was released at a time, but once released, every name in the replicate was
brought to full disposition. After four weeks of interviewing, it was determined that additional sample would be needed, and all five replicates from group B were released. Group A relocatee names were released as a final addition to the sample at the end of June 2000.

CHA Relocation Counseling Assessment—Final Report 3
Baseline CHA relocatee data collection consisted entirely of face-to-face interviews. SRL field staff surveyed CHA relocatees in their homes, going door-to-door in each of the sampled buildings. Five attempts were made to locate each respondent. Our sample of CHA relocatees included respondents from seven CHA developments: Darrow/Ida B Wells, Hilliard, Ickes, Madden Park, Robert Taylor, Rockwell and Henry Horner. The baseline survey lasted approximately 20 minutes, and each participant was paid $10 for completing the interview.
For Wave II data collection, SRL field staff first attempted to contact baseline respondents by telephone. If they were successful, they administered a 20-minute follow-up survey and respondents were mailed a $20 certificate for a local grocery store. Approximately 75 percent of completed wave II interviews were conducted by phone. For respondents who could not be contacted by telephone, face-to-face interviews were conducted and the $20 certificate was given to the respondent upon completion of the survey. Data collection for wave III proceeded in the same manner as wave II. Again, approximately 75% of wave III interviews were completed over the phone.
Response Rates
During baseline data collection, SRL successfully completed interviews with a total of 190 of 345 sampled relocatee names. For the six-month follow-up (wave II), SRL completed interviews with 157 of the baseline respondents. At the twelve-month follow-up (wave III), 142 interviews were completed.
Wave I Response Rate
There are two ways to calculate the wave I response rate for this survey. The first way assumes that the eligible sample includes relocatees who were screened—and therefore known to be eligible—as well as those who could not be located to screen. There were 113 cases that could not be located or screened. We then assumed the same eligibility rate for those 113 as was found for the 225 successfully screened: 97.4 percent. Therefore, we estimated that 110 cases of those not screened should be added to the 225 we knew to be eligible. Under these assumptions, the total eligible sample was 335, and the response rate is 190/335 or 56.7 percent.
However scientifically rigorous this method may be, it does not take into account the realities of our relocatee sample. From the onset of the sampling frame, we knew our data to be incomplete and in a constant state of flux. The “winterization” process was not well documented, and many relocatees moved earlier than expected or dropped out of the system. Taking these realities into

CHA Relocation Counseling Assessment—Final Report 4
consideration, then, a second survey response rate can be calculated. If we assume that the 113 relocatees who could not be located to screen have actually left the system, then they can be dropped from our sample total. Assuming the same 97.4 percent eligibility rate found among those screened, we could drop our total sample number by 110, reducing it from 335 to 225. The second response rate becomes 190/225 or 84.4 percent.
The survey response rate is the proportion of eligible respondents who completed an interview. Table A-1 shows the rates calculated for the wave I survey.
Table A-1. Response Rate for Wave I Survey Number Rate
Total Sample 345 Non duplicates 344 99.7% Contact to Screener 311 90.4% Cooperation to Screener 231 74.3% Eligible 225 97.4% Contact to Final 196 87.1% Cooperation to Final 190 96.9% Response Rate 84.4%
Wave II Response Rate
The six-month (wave II) sampling frame consisted of respondents who completed a pretest or baseline interview. Table A-2 shows the response rate for wave II of the survey data collection.
Table A-2. Response Rate for Wave II Survey
Number Rate
Total Sample 195 Non duplicates 195 100% Contact to Screener 189 96.9% Cooperation to Screener 168 88.9% Eligible 165 98.2% Contact to Final 159 96.4% Cooperation to Final 157 82% Response rate 157 82%

CHA Relocation Counseling Assessment—Final Report 5
Wave III Response Rate
The twelve-month (wave III) sampling frame was the same as the frame used in wave II. It consisted of all respondents who completed a pretest or baseline interview. Table A-3 details the response rate for wave III of the survey data collection.
Table A-3. Response Rate for Wave III Survey
Number Rate Total Sample 195 Non duplicates 195 100% Contact to Screener 195 100% Cooperation to Screener 164 84.1% Eligible 158 96.3% Contact to Final 143 90.5% Cooperation to Final 142 99.3% Response rate 76%
Nonresponse Analysis
We conducted an analysis of respondents who were surveyed at baseline but were not surveyed in the six-month follow-up to check if these respondents were different from the respondents included in our sample. We ran cross tabulations on respondents and nonrespondents to compare demographic and socio-economic characteristics, the buildings the respondents originated from, and the amount of relocation counseling they received. Using chi-square statistics, we found no statistically significant differences between nonrespondents and respondents. At the twelve-month follow up we conducted the same analysis and found that nonrespondents were more likely to have reported problems paying their rent on time. This analysis suggests that the sample may include respondents who slightly better off, in terms of economic hardship, then their counterparts we did not interview.
Process Study
The second component of this research is a process study of the relocation and mobility counseling services provided by the counseling agencies contracted by the CHA. The process study is designed to provide ongoing feedback on program activities, and serve as a tool to help agency staff to identify any problems early on and make any necessary changes to their counseling programs. There are two major components of the process study: 1) interviews with counseling agency staff and 2) observation of program activities.

CHA Relocation Counseling Assessment—Final Report 6
Interviews with Agency Staff
In March 2000, UI and UIC staff conducted interviews with agency administrators and counselors to obtain information about: their agency’s missions, the range and content of the services being provided, the types of challenges staff are encountering, and any changes made to the service package over time. We also asked about any other initiatives that might affect services, for example, the CHA and CHAC’s proposed initiative to develop a standard set of educational materials for Section 8 participants and landlords. We interviewed CHA and CHAC administrators about any external factors that may affect counseling, such as emergency relocations of CHA residents, changes in funding, or shifts in policy emphasis. Finally, we asked about broader issues that may affect outcomes for participants, particularly changes in the rental market. With the exception of Changing Patterns for Families, interviews were completed with most, if not all, the counselors working in the agencies providing relocation services.
During the Wave II data collection period, contracts with relocation counseling agencies were expiring so we did not conduct interviews. We did, however, meet with key relocation department staff to discuss new approaches to relocation counseling—such as good neighbor counseling, the relocation rights contract, and other new materials the CHA has created. Although most relocatees have been turned over to new counseling agencies, a new relocation schedule has not been released.
In wave III, project staff conducted follow-up interviews with program administrators and other key actors involved in the relocation process in the winter of 2001 and the spring of 2002. These key actors included: CHA administrative staff; staff from the MacArthur Foundation working with the CHA; attorneys representing CHA tenants from BPI, the Legal Assistance Foundation, and the National Center for Poverty Law; resident leaders from the LAC and Coalition to Protect Public Housing; staff from the Resident’s Journal; staff from the Metropolitan Planning Council; administrators from the CHA’s counseling agencies and CHAC; journalists writing about CHA-related issues; and researchers studying issues related to the CHA Transformation.
In-Depth Interviews
The baseline panel survey was supplemented with in-depth case studies of families. These interviews were designed to provide more textured information about participant experiences. At baseline, we interviewed the selected heads of household about topics such as: their concerns about moving, their needs, their family situation, their current housing situation, condition of current neighborhood, and concerns about their children. The interviews were semi-structured,

CHA Relocation Counseling Assessment—Final Report 7
allowing us to cover all topics of interest to the research, while also permitting respondents to bring up other issues of importance to them.
For baseline, we selected participants from each counseling agency to interview in-depth. Since these interviews were not intended to be representative, we asked staff from the counseling agencies to nominate potential respondents whom they view as articulate and well informed. We asked the counseling agencies to identify both participants who have positive views about moving out of public housing, as well as those who are dissatisfied or having difficulty with the relocation process. From this list we recruited respondents to participate in the interviews. During April 2000, we completed 7 interviews with CHA relocatees.
For wave II, we interviewed 11 randomly selected CHA relocatees who had been referred to a counseling agency, but had not moved as of March 2001. The purpose of these interviews was to investigate the reasons why families had not moved, ask about their experiences with relocation counseling and the relocation process.
At wave III, we interviewed 12 randomly selected CHA relocatees who had moved to a new apartment with the Section 8 program during the course of our study. During the interviews, we investigated how each family had found out about relocation and searched for housing, what types of counseling services they received, and how they were faring in their new locations.
Interviewing took place at SRL’s facilities in Chicago. A team of three to four trained interviewers spoke with each respondent for about an hour, following developed interview guides for CHA relocatees. Case study respondents received $40 for their participation in the interview.
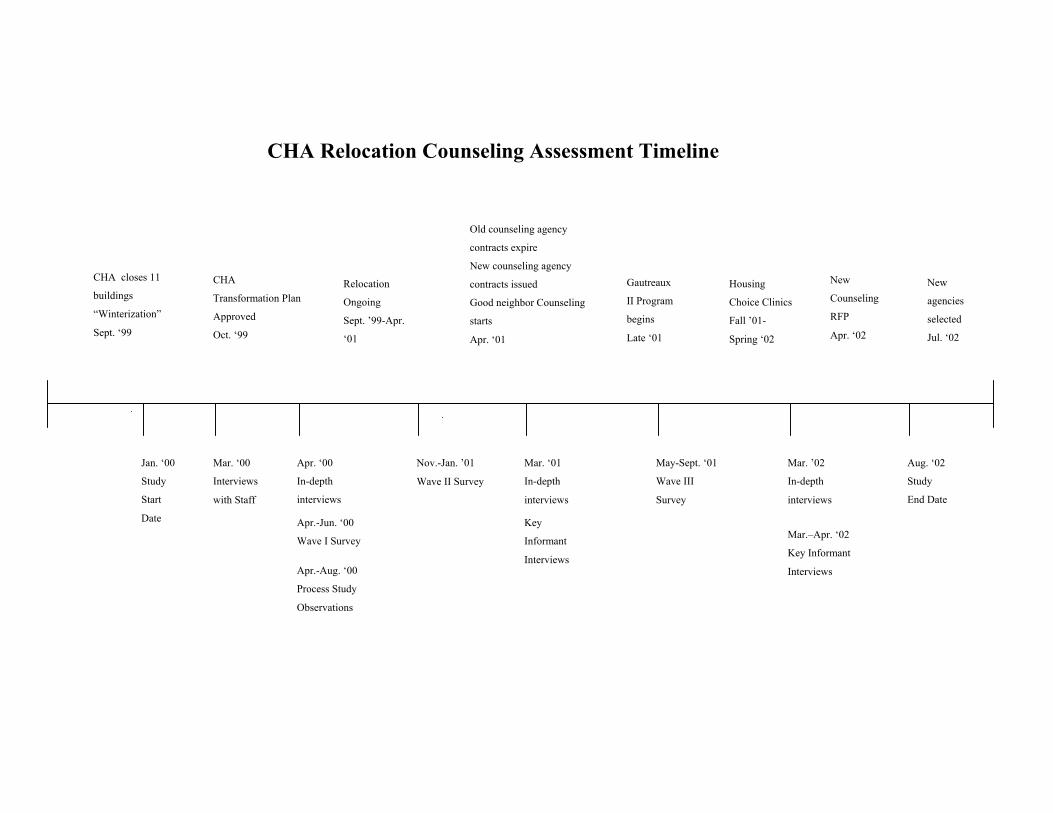
CHA Relocation Counseling Assessment Timeline
CHA closes 11
buildings
“Winterization”
Sept. ‘99
CHA
Transformation Plan
Approved
Oct. ‘99
Jan. ‘00
Study
Start
Date
Mar. ‘00
Interviews
with Staff
Apr.-Jun. ‘00
Wave I Survey
Apr. ‘00
In-depth
interviews
Relocation
Ongoing
Sept. ’99-Apr.
‘01
Old counseling agency
contracts expire
New counseling agency
contracts issued
Good neighbor Counseling
starts
Apr. ‘01
Nov.-Jan. ’01
Wave II Survey Mar. ‘01
In-depth
interviews
May-Sept. ‘01
Wave III
Survey
Mar. ’02
In-depth
interviews
Aug. ‘02
Study
End Date
Housing
Choice Clinics
Fall ’01-
Spring ‘02
New
Counseling
RFP
Apr. ‘02
New
agencies
selected
Jul. ‘02
Gautreaux
II Program
begins
Late ‘01
Key
Informant
Interviews Apr.-Aug. ‘00
Process Study
Observations
Mar.–Apr. ‘02
Key Informant
Interviews

Appendix B Wave 3 CHA Research Questions

TABLE 1. RESEARCH QUESTIONS
Barriers
What are the range of problems and challenges that Housing Choice Voucher recipients face in locating housing and leasing up with Housing Choice Voucher?
What proportion of the population has multiple problems; what proportion require intensive counseling before attempting a move; and what proportion will need long-term support in order to maintain their Housing Choice Voucher assistance?
Services and Facilitators
Do participants search in low-poverty areas?
What factors affect families’ willingness to consider unfamiliar areas, including: families’ preferences for particular communities, fears of moving to unfamiliar areas, concerns about encountering discrimination, and the limited availability of appropriate units (e.g., affordable units, large bedroom units)?
Are there other services they feel that they need?
What are the characteristics of those participants that move to low-poverty areas?
What types of services do these participants receive?
Locational Outcomes
What proportion of voucher holders move to low-poverty neighborhoods?
How do these participants compare to successful movers?
What are the relocation outcomes for participants, i.e., the characteristics of the neighborhoods that they move from and to?
How satisfied are movers with their new units and neighborhoods?
Do they feel they have received adequate follow-up support?
Are there any early impacts on employment or quality of life outcomes for participants?
What are the early outcomes for those who failed to find units?

Appendix C 12-Month Follow-up: CHA Respondents
Data Exhibits

Exhibit 1-1
12-Month Follow-up: CHA Respondents Respondent Characteristics at a Glance
CHA
N = 138 Gender Female 96% Male 4% Age 25 or younger 12% 26-35 27% 36-49 34% 50-59 11% 60 or older 17% Number of children 1-2 children 43% 3 or more children 57% Education No high school 10% Some high school 53% HS grad (no college) 26% HS grad (college) 11% Length of time in CHA Less than 5 years 7% 5-10 years 32% More than 10 years 62% Income $10,000 or less 79% $10,001 to $20,000 14% $20,001 to $30,000 5% $30,000+ 2% Currently employed 37% 20 or more hours 82% Less than 20 hours 18% Receiving public aid or TANF 31% Receiving SSI or SSDI 29% Have a valid drivers license 16% Have access to a car that runs 20% Notes: Two of the 138 respondents in the 12-month follow-up could not be categorized as either movers or nonmovers.

Exhibit 1-2 12-Month Follow-up: CHA Respondents
Section 8 Search Barriers
CHA N = 138
Are sure these factors will be a “big problem” or “some problem” while searching for housing with Section 8?
Finding a place with enough bedrooms 59% Finding a place you like 75% Finding a place you can afford 67% Finding a place that will pass Section 8 inspection 63% Finding landlords who will accept Section 8 65% Knowing how to look for a new apartment 46% Not having access to transportation for apartment hunting 59% Having a disability which makes it difficult to search 36% Finding child care so you can look for housing 27% Discrimination because of your race 33% Landlords who do not want to rent to families with children 58% Discrimination because you are coming from CHA public housing
65%
Taking time off from work to look for an apartment 41%

Exhibit 1-3 12-Month Follow-up: CHA Respondents
Housing Quality
CHA N = 138
Housing quality index 1.72 Percent reporting “big problem” or “some problem” Walls with peeling paint or broken plaster 35% Plumbing that does not work properly 36% Rats or mice in the apartment 26% Cockroaches or other bugs in the apartment 41% Broken locks or no locks on doors to unit 13% Heat not working for more than 24 hours 21% The housing quality index was calculated by adding all of the respondents that reported a “big problem” with each housing question and calculating the average. All indices have a Cronbachs Alpha >.60
Exhibit 1-4 12-Month Follow-up: CHA Respondents
Household Member Victimized in the Past Year
CHA N = 138
Purse, wallet, or jewelry stolen 5% Threatened with a knife or gun 7% Beaten or assaulted 5% Stabbed or shot 1% Anyone trying to break into home 6%

Exhibit 1-5 12-Month Follow-up: CHA Respondents
Social Disorder, Physical Disorder, and Violence
CHA N = 138
Social disorder scale 3.46 People selling drugs 77% People using drugs 76% Groups of people just hanging out 75% Gangs 75% Police not coming when called 46% Physical disorder scale 1.21 Graffiti 60% Trash and junk 61% Violence scale 1.71 People being attacked or robbed 58% Shootings and violence 72% Rape or sexual assaults 46% The social disorder scale, physical disorder scale, and violence scale were calculated by adding all of the respondents that reported a “big problem” with each related question and calculating the average. All indices have a Cronbachs Alpha >.60

Exhibit 1-6 12-Month Follow-up: CHA Respondents
Health
CHA N = 138
General health Excellent 17% Very good 21% Good 23% Fair 30% Poor 9% Health compared to six months ago Much better 16% Somewhat better 17% About the same 58% Somewhat worse 7% Much worse 3% Ever told by doctor had asthma 44% Past 6 months anyone in HH had asthma attack 24% Past 6 months visited ER because of asthma
21%
Exhibit 1-7 12-Month Follow-up: CHA Respondents
Self-Efficacy
CHA N=138
Every time I try to get ahead, something stops me 59% When I make plans, I can usually carry them out 82% Planning only makes people unhappy because plans hardly ever work out anyway
37%
Good luck is more important than hard work for success 42%
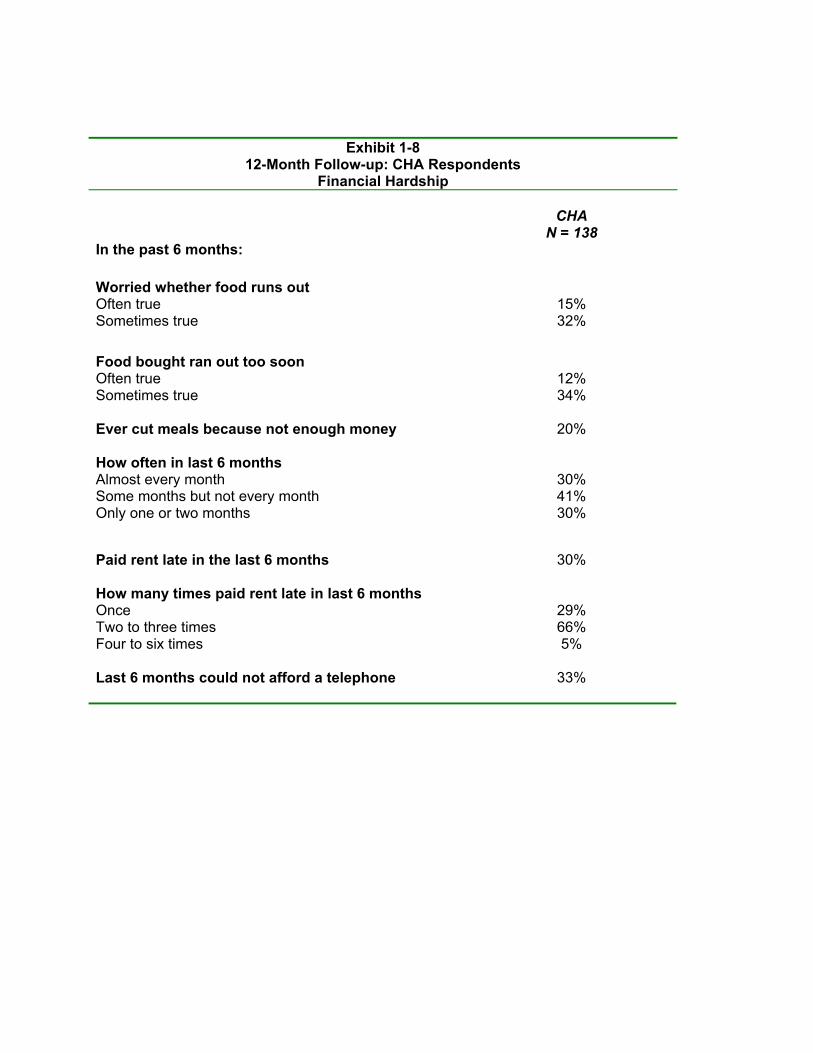
Exhibit 1-8
12-Month Follow-up: CHA Respondents Financial Hardship
CHA
N = 138 In the past 6 months: Worried whether food runs out Often true 15% Sometimes true 32% Food bought ran out too soon Often true 12% Sometimes true 34% Ever cut meals because not enough money 20% How often in last 6 months Almost every month 30% Some months but not every month 41% Only one or two months 30%
Paid rent late in the last 6 months 30% How many times paid rent late in last 6 months Once 29% Two to three times 66% Four to six times 5% Last 6 months could not afford a telephone 33%

Appendix D 12-Month Follow-up: CHA Movers and
Nonmovers Data Exhibits

Exhibit 2-1 12-Month Follow-up: CHA Movers and Nonmovers
Respondent Characteristics at a Glance
CHA
Movers N = 52
CHA
Nonmovers N = 84
Gender Female 96% 96% Male 4% 4% Age 25 or younger 10% 12% 26-35 33% 23% 36-49 23% 41% 50-59 10% 11% 60 or older 23% 12% Number of children 1-2 children 51% 36% 3 or more children 49% 64% Education No high school 13% 7% Some high school 46% 58% HS grad (no college) 29% 24% HS grad (college) 12% 11% Income $10,000 or less 75% 83% $10,001 to $20,000 15% 13% $20,001 to $30,000 8% 4% Above $30,000 2% 1% Currently employed 46% 33% 20 or more hours 88% 78% Less than 20 hours 13% 22% Receiving public aid or TANF 31% 31% Receiving SSI or SSDI 33% 26% Have a valid drivers license 17% 15% Have access to a car that runs 21% 20% Notes: Because of rounding, all variables may not sum to 100 percent. Significant difference indicated by *p<.10 **p<.05 ***p<.001

Exhibit 2-2 12-Month Follow-up: CHA Movers and Nonmovers
Section 8 Search Barriers
CHA
Movers N = 52
CHA
Nonmovers N = 84
Are sure these factors will be a “big problem” or “some problem” while searching for housing with Section 8?
Finding a place with enough bedrooms 56% 62% Finding a place you like 75% 76% Finding a place you can afford** 52% 76% Finding a place that will pass Section 8 inspection
60% 65%
Finding landlords who will accept Section 8** 54% 73% Knowing how to look for a new apartment 48% 44% Not having access to transportation for apartment hunting
52% 62%
Having a disability which makes it difficult to search
42% 32%
Finding child care so you can look for housing 27% 27% Discrimination because of your race 28% 35% Landlords who do not want to rent to families with children
59% 57%
Discrimination because you are coming from CHA public housing
55% 71%
Taking time off from work to look for an apartment
46% 37%
Notes: Because of rounding, all variables may not sum to 100 percent. Significant difference indicated by *p<.10 **p<.05 ***p<.001
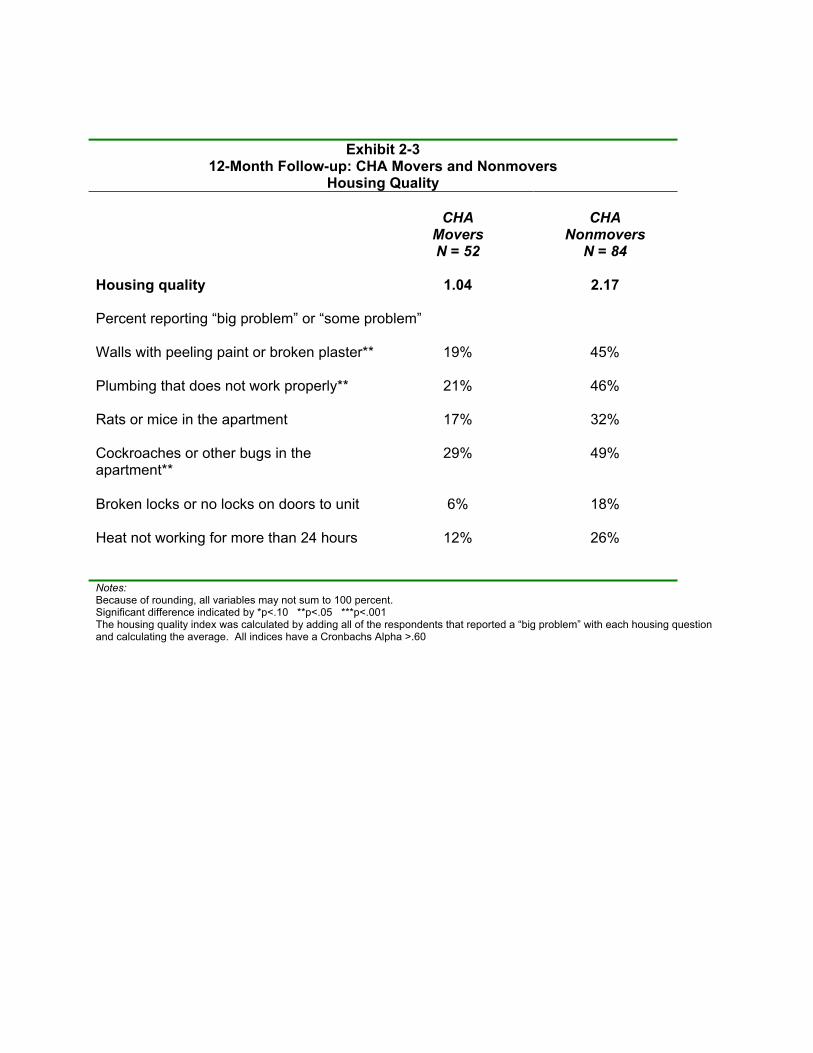
Exhibit 2-3
12-Month Follow-up: CHA Movers and Nonmovers Housing Quality
CHA
Movers
CHA
Nonmovers N = 52 N = 84 Housing quality 1.04 2.17 Percent reporting “big problem” or “some problem” Walls with peeling paint or broken plaster** 19% 45% Plumbing that does not work properly** 21% 46% Rats or mice in the apartment 17% 32% Cockroaches or other bugs in the apartment**
29% 49%
Broken locks or no locks on doors to unit 6% 18% Heat not working for more than 24 hours 12% 26% Notes: Because of rounding, all variables may not sum to 100 percent. Significant difference indicated by *p<.10 **p<.05 ***p<.001 The housing quality index was calculated by adding all of the respondents that reported a “big problem” with each housing question and calculating the average. All indices have a Cronbachs Alpha >.60
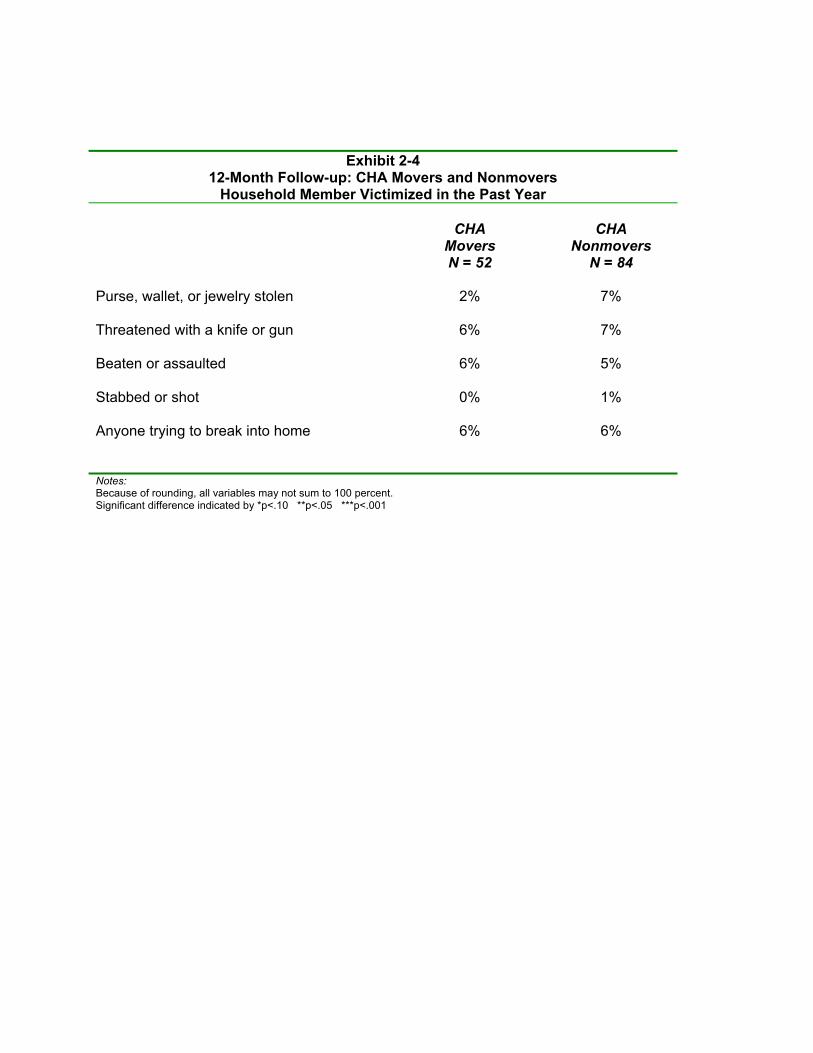
Exhibit 2-4 12-Month Follow-up: CHA Movers and Nonmovers
Household Member Victimized in the Past Year
CHA
Movers N = 52
CHA
Nonmovers N = 84
Purse, wallet, or jewelry stolen 2% 7% Threatened with a knife or gun 6% 7% Beaten or assaulted 6% 5% Stabbed or shot 0% 1% Anyone trying to break into home 6% 6% Notes: Because of rounding, all variables may not sum to 100 percent. Significant difference indicated by *p<.10 **p<.05 ***p<.001

Exhibit 2-5 12-Month Follow-up: CHA Movers and Nonmovers
Social Disorder, Physical Disorder, Violence
CHA
Movers N = 52
CHA
Nonmovers N = 84
Social disorder scale 2.19 4.29 People selling drugs*** 53% 93% People using drugs*** 49% 94% Groups of people just hanging out*** 53% 89% Gangs*** 50% 92% Police not coming when called*** 21% 63% Physical disorder scale 0.58 1.63 Graffiti*** 21% 86% Trash and junk*** 37% 78% Violence scale 0.92 2.23 People being attacked or robbed*** 30% 74% Shootings and violence*** 41% 90% Rape or sexual assaults*** 25% 60% Notes: Because of rounding, all variables may not sum to 100 percent. Significant difference indicated by *p<.10 **p<.05 ***p<.001 The social disorder scale, physical disorder scale, and violence scale were calculated by adding all of the respondents that reported a “big problem” with each related question and calculating the average. All indices have a Cronbachs Alpha >.60
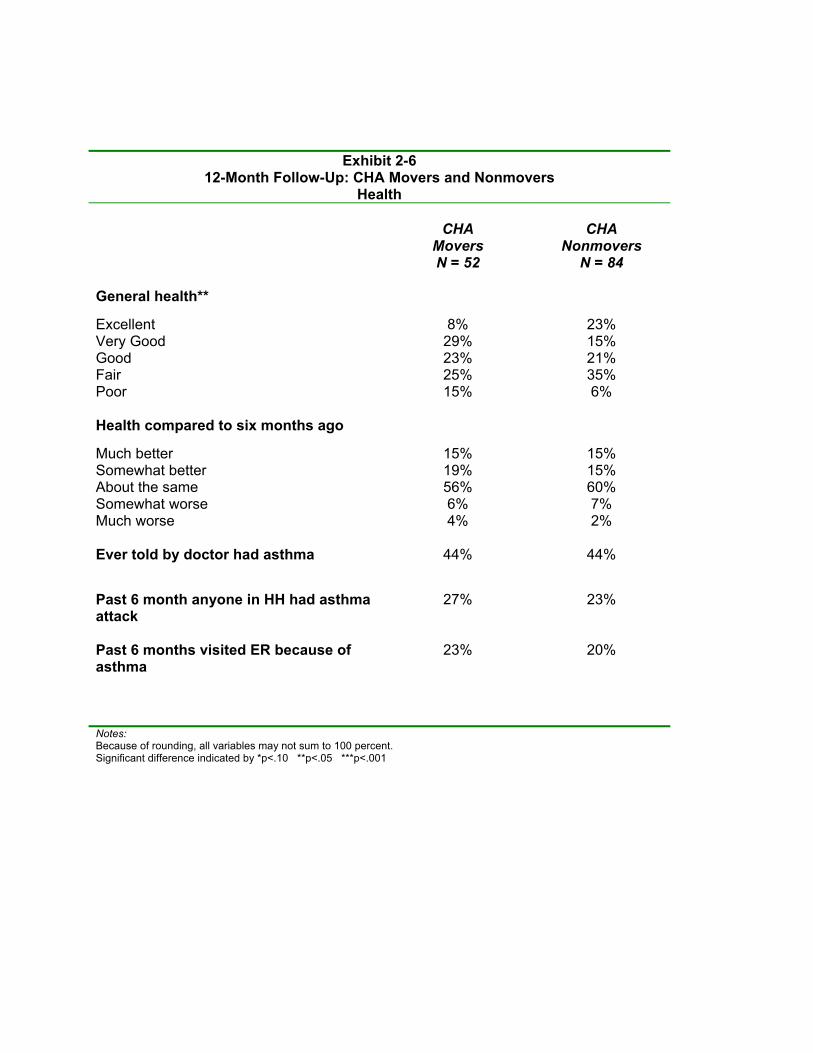
Exhibit 2-6 12-Month Follow-Up: CHA Movers and Nonmovers
Health
CHA
Movers N = 52
CHA
Nonmovers N = 84
General health**
Excellent 8% 23% Very Good 29% 15% Good 23% 21% Fair 25% 35% Poor 15% 6% Health compared to six months ago
Much better 15% 15% Somewhat better 19% 15% About the same 56% 60% Somewhat worse 6% 7% Much worse 4% 2% Ever told by doctor had asthma 44% 44%
Past 6 month anyone in HH had asthma attack
27% 23%
Past 6 months visited ER because of asthma
23% 20%
Notes: Because of rounding, all variables may not sum to 100 percent. Significant difference indicated by *p<.10 **p<.05 ***p<.001

Exhibit 2-7
12-Month Follow-up: Movers and Nonmovers Self-Efficacy
CHA
Movers N = 52
CHA
Nonmovers N = 84
Every time I try to get ahead, something stops me*
51% 65%
When I make plans I can usually carry them out
82% 83%
Planning only makes people unhappy because plans hardly ever work out anyway
39% 37%
Good luck is more important than handwork for success
43% 43%
Notes: Because of rounding, all variables may not sum to 100 percent. Significant difference indicated by *p<.10 **p<.05 ***p<.001

Exhibit 2-8
12-Month Follow-up: Movers and Nonmovers Financial Hardship
CHA
Movers N = 54
CHA
Nonmovers N = 86
In the past 6 months: Worried whether food runs out** Often true 12% 18% Sometimes true 19% 39% Food bought ran out too soon** Often true 8% 14% Sometimes true 23% 40% Ever cut meals because not enough money* 12% 25% How often in last 6 months have you cut meals because not enough money
Almost every month 50% 24% Some months but not every month 33% 43% Only one or two months 17% 33% Paid rent late in the last 6 months** 15% 40% How many times paid rent late in last 6 months
Once 29% 29% Two to three times 71% 65% Four to six times 0% 6% Last 6 months could not afford a telephone** 21% 42% Notes: Because of rounding, all variables may not sum to 100 percent. Significant difference indicated by *p<.10 **p<.05 ***p<.001

Appendix E Baseline, 6-Month, and 12-Month
Follow-ups: CHA Respondents
Data Exhibits

Exhibit 3-1
Baseline, 6-Month, and 12-Month Follow-ups: CHA Respondents Respondent Characteristics at a Glance
W1 (N = 190)
W2 (N = 152)
W3 (N = 138)
Gender Female 96% 96% 96% Male 4% 4% 4% Age 25 or younger 13% 11% 12% 26-35 29% 28% 27% 36-49 33% 33% 34% 50-59 11% 12% 11% 60 or older 14% 16% 17% Number of children 1-2 children 41% 38% 43% 3 or more children 59% 62% 57% Education No high school 8% 9% 10% Some high school 55% 52% 53% HS grad (no college) 25% 30% 26% HS grad (college) 12% 9% 11% Income $10,000 or less 84% 81% 79% $10,001 to $20,000 12% 13% 14% $20,001 to $30,000 4% 5% 5% $30,000+ 0% 0% 2% Currently employed 32% 28% 37% 20 or more hours 89% 86% 82% Less than 20 hours 11% 14% 18% Receiving public aid or TANF 48% 38% 31% Receiving SSI or SSDI 34% 32% 29% Have a valid drivers license 13% 16% 16% Have access to a car that runs 22% 16% 20%
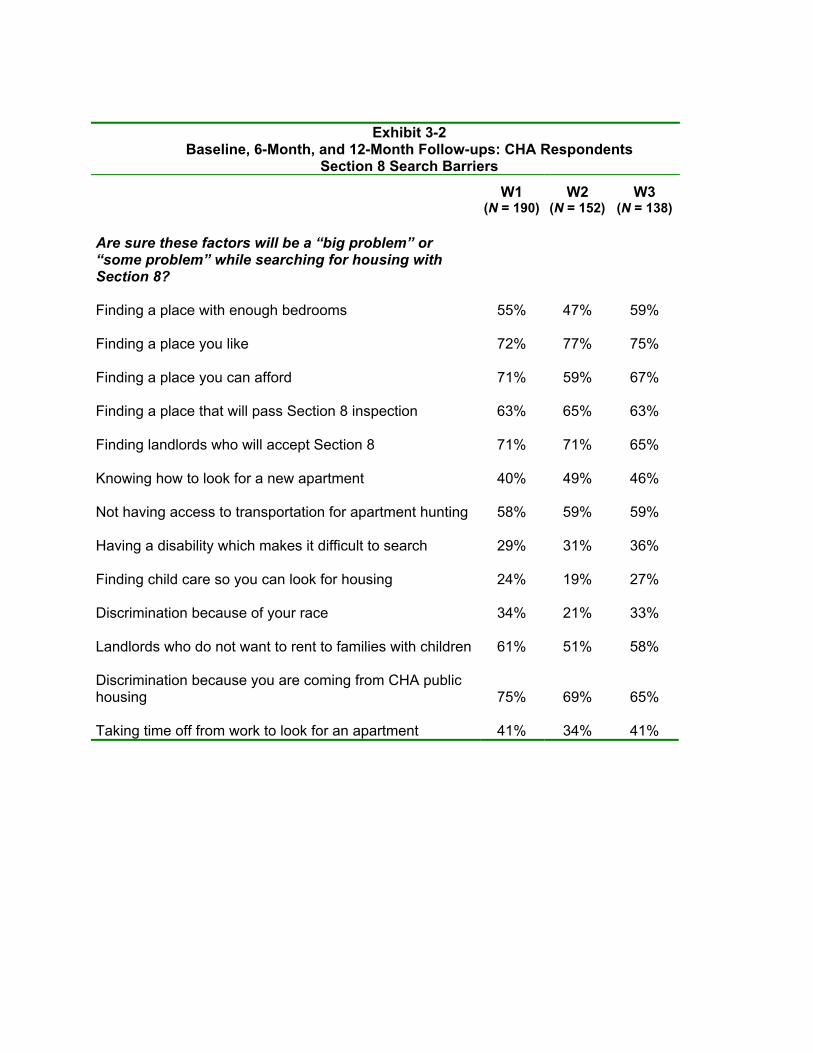
Exhibit 3-2 Baseline, 6-Month, and 12-Month Follow-ups: CHA Respondents
Section 8 Search Barriers W1
(N = 190)W2
(N = 152) W3
(N = 138)
Are sure these factors will be a “big problem” or “some problem” while searching for housing with Section 8?
Finding a place with enough bedrooms 55% 47% 59% Finding a place you like 72% 77% 75% Finding a place you can afford 71% 59% 67% Finding a place that will pass Section 8 inspection 63% 65% 63% Finding landlords who will accept Section 8 71% 71% 65% Knowing how to look for a new apartment 40% 49% 46% Not having access to transportation for apartment hunting 58% 59% 59% Having a disability which makes it difficult to search 29% 31% 36% Finding child care so you can look for housing 24% 19% 27% Discrimination because of your race 34% 21% 33% Landlords who do not want to rent to families with children 61% 51% 58% Discrimination because you are coming from CHA public housing
75%
69%
65%
Taking time off from work to look for an apartment 41% 34% 41%

Exhibit 3-3 Baseline, 6-Month, and 12-Month Follow-ups: CHA Respondents
Housing Quality W1
(N = 190) W2
(N = 152) W3
(N = 138) Housing quality index 2.32 2.09 1.72 Percent reporting “big problem” or “some problem” Walls with peeling paint or broken plaster 46% 40% 35% Plumbing that does not work properly 49% 41% 36% Rats or mice in the apartment 33% 40% 26% Cockroaches or other bugs in the apartment 66% 53% 41% Broken locks or no locks on doors to unit 20% 16% 13% Heat not working for more than 24 hours 17% 18% 21%
The housing quality index was calculated by adding all of the respondents that reported a “big problem” with each housing question and calculating the average. All indices have a Cronbachs Alpha >.60
Exhibit 3-4 Baseline, 6-Month, and 12-Month Follow-ups: CHA Respondents
Household Member Victimized in the Past Year W1
(N = 190)W2
(N = 152) W3
(N = 138) Purse, wallet, or jewelry stolen 6% 5% 5% Threatened with a knife or gun 9% 8% 7% Beaten or assaulted 12% 6% 5% Stabbed or shot 5% 1% 1% Anyone trying to break into home 10% 6% 6%

Exhibit 3-5 Baseline, 6-Month, and 12-Month Follow-ups: CHA Respondents
Social Disorder, Physical Disorder, and Violence W1
(N = 190) W2
(N = 152) W3
(N = 138) Social disorder scale 4.19 3.53 3.46 People selling drugs 92% 81% 77% People using drugs 91% 76% 76% Groups of people just hanging out 89% 76% 75% Gangs 91% 78% 75% Police not coming when called 61% 50% 46% Physical disorder scale 1.78 1.36 1.21 Graffiti 92% 73% 60% Trash and junk 86% 64% 61% Violence scale 2.18 1.76 1.71 People being attacked or robbed 68% 54% 58% Shootings and violence 91% 76% 72% Rape or sexual assaults 64% 52% 46% The social disorder scale, physical disorder scale, and violence scale were calculated by adding all of the respondents that reported a “big problem” with each related question and calculating the average. All indices have a Cronbachs Alpha >.60
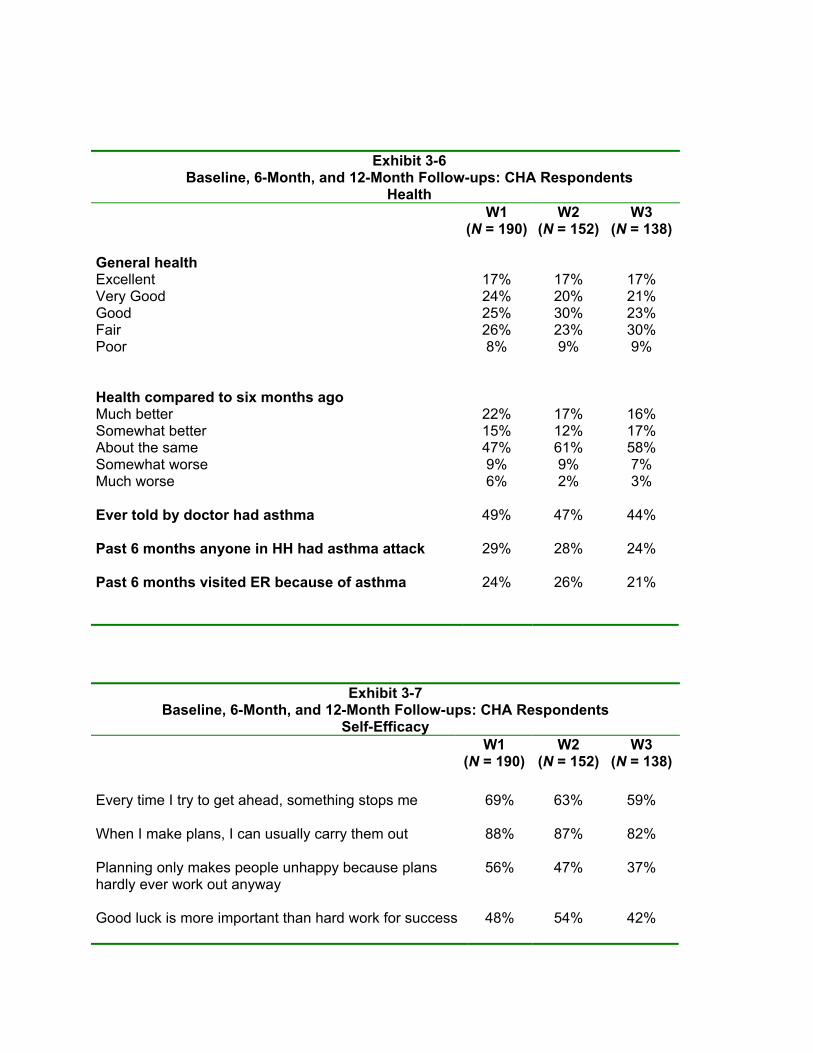
Exhibit 3-6 Baseline, 6-Month, and 12-Month Follow-ups: CHA Respondents
Health W1
(N = 190)W2
(N = 152) W3
(N = 138) General health Excellent 17% 17% 17% Very Good 24% 20% 21% Good 25% 30% 23% Fair 26% 23% 30% Poor 8% 9% 9% Health compared to six months ago Much better 22% 17% 16% Somewhat better 15% 12% 17% About the same 47% 61% 58% Somewhat worse 9% 9% 7% Much worse 6% 2% 3% Ever told by doctor had asthma 49% 47% 44% Past 6 months anyone in HH had asthma attack 29% 28% 24% Past 6 months visited ER because of asthma
24% 26% 21%
Exhibit 3-7 Baseline, 6-Month, and 12-Month Follow-ups: CHA Respondents
Self-Efficacy W1
(N = 190)W2
(N = 152) W3
(N = 138) Every time I try to get ahead, something stops me 69% 63% 59% When I make plans, I can usually carry them out 88% 87% 82% Planning only makes people unhappy because plans hardly ever work out anyway
56% 47% 37%
Good luck is more important than hard work for success 48% 54% 42%

Exhibit 3-8
Baseline, 6-Month and 12-Month Follow-Ups: CHA Respondents Financial Hardship
W1 (N = 190)
W2 (N = 152)
W3 (N = 138)
In the past 6 months: Worried whether food runs out Often true 15% 11% 15% Sometimes true 35% 33% 32% Food bought ran out too soon Often true 8% 12% 12% Sometimes true 36% 29% 34% Ever cut meals because not enough money 12% 18% 20% How often in last 6 months Almost every month 13% 19% 30% Some months but not every month 48% 44% 41% Only one or two months 39% 37% 30%
Paid rent late in the last 6 months 39% 30% 30% How many times paid rent late in last 6 months Once 32% 18% 29% Two to three times 50% 61% 66% Four to six times 18% 14% 5% Six to eight times 0% 7% 0% Last 6 months could not afford a telephone 38% 38% 33%

Appendix F Baseline, 6-Month, and 12-Month
Follow-ups: CHA Respondents—Nonmovers
Data Exhibits

Exhibit 4-1 Baseline, 6-Month, and 12-Month Follow-ups: Nonmovers
Respondent Characteristics at a Glance W2
(N = 117) W3
(N = 84) Gender Female 96 96 Male 4 4 Age 25 or younger 10 12 26-35 25 23 36-49 37 41 50-59 14 11 60 or older 14 12 Number of children 1-2 children 37 36 3 or more children 63 64 Education No high school 8 7 Some high school 56 58 HS grad (no college) 30 24 HS grad (college) 7 11 Income $10,000 or less 83 83 $10,001 to $20,000 10 13 $20,001 to $30,000 7 4 $30,000+ 0 1 Currently employed 27 33 20 or more hours 84 78 Less than 20 hours 16 22 Receiving public aid or TANF 37 31 Receiving SSI or SSDI 29 26 Have a valid drivers license 15 15 Have access to a car that runs 18 20

Exhibit 4-2 Baseline, 6-Month, and 12-Month Follow-ups: Nonmovers
Section 8 Search Barriers W2
(N = 117) W3
(N = 84) Are sure these factors will be a “big problem” or “some problem” while searching for housing with Section 8?
Finding a place with enough bedrooms 47 62 Finding a place you like 77 76 Finding a place you can afford 59 76 Finding a place that will pass Section 8 inspection 65 65 Finding landlords who will accept Section 8 71 73 Knowing how to look for a new apartment 49 44 Not having access to transportation for apartment hunting 59 62 Having a disability which makes it difficult to search 31 32 Finding child care so you can look for housing 19 27 Discrimination because of your race 21 35 Landlords who do not want to rent to families with children 51 57 Discrimination because you are coming from CHA public housing
69 71
Taking time off from work to look for an apartment 34 37

Exhibit 4-3 Baseline, 6-Month, and 12-Month Follow-ups: Nonmovers
Housing Quality W2
(N = 117) W3
(N = 84) Housing Quality Index 2.47 2.17 Percent reporting “big problem” or “some problem” Walls with peeling paint or broken plaster 50 45 Plumbing that does not work properly 49 46 Rats or mice in the apartment 44 32 Cockroaches or other bugs in the apartment 62 49 Broken locks or no locks on doors to unit 20 18 Heat not working for more than 24 hours 23 26 The housing quality index was calculated by adding all of the respondents that reported a “big problem” with each housing question and calculating the average. All indices have a Cronbachs Alpha >.60
Exhibit 4-4 Baseline, 6-Month, and 12-Month Follow-ups: Nonmovers
Household Member Victimized in the Past Year W2
(N = 117) W3
(N = 84) Purse, wallet, or jewelry stolen 5 7 Threatened with a knife or gun 9 7 Beaten or assaulted 7 5 Stabbed or shot 1 1 Anyone trying to break into home 6 6

Exhibit 4-5 Baseline, 6-Month, and 12-Month Follow-ups: Nonmovers
Social Disorder, Physical Disorder, and Violence W2
(N = 117) W3
(N = 84) Social disorder scale 4.06 4.29 People selling drugs 91 93 People using drugs 86 94 Groups of people just hanging out 89 89 Gangs 90 92 Police not coming when called 55 63 Physical disorder scale 1.62 1.63 Graffiti 90 86 Trash and junk 73 78 Violence scale 2.03 2.23 People being attacked or robbed 60 74 Shootings and violence 90 90 Rape or sexual assaults 59 60 The social disorder scale, physical disorder scale, and violence scale were calculated by adding all of the respondents that reported a “big problem” with each related question and calculating the average. All indices have a Cronbachs Alpha >.60

Exhibit 4-6 Baseline, 6-Month, and 12-Month Follow-Ups: Nonmovers
Health W2
(N = 117) W3
(N = 84) General health Excellent 19 23 Very Good 22 15 Good 30 21 Fair 22 35 Poor 8 6 Health compared to six months ago Much better 14 15 Somewhat better 12 15 About the same 66 60 Somewhat worse 7 7 Much worse 2 2 Ever told by doctor had asthma 45 44 Past 6 months anyone in HH had asthma attack 26 23 Past 6 months visited ER because of asthma
23 20
Exhibit 4-7 Baseline, 6-Month, and 12-Month Follow-ups: Nonmovers
Self-Efficacy W2
(N = 117) W3
(N = 84) Every time I try to get ahead, something stops me 62 65 When I make plans, I can usually carry them out 86 83 Planning only makes people unhappy because plans hardly ever work out anyway
47 37
Good luck is more important than hard work for success 50 43

Exhibit 4-8 Baseline, 6-Month, and 12-Month Follow-ups: Nonmovers
Financial Hardship W2
(N = 117) W3
(N = 84) In the past 6 months: Worried whether food runs out Often true 11 18 Sometimes true 35 19 Food bought ran out too soon Often true 12 14 Sometimes true 30 40 Ever cut meals because not enough money 19 25 How often in last 6 months Almost every month 23 24 Some months but not every month 32 43 Only one or two months 45 33
Paid rent late in the last 6 months 36 40 How many times paid rent late in last 6 months Once 19 29 Two to three times 60 65 Four to six times 14 6 Six to eight times 7 0 Last 6 months could not afford a telephone 44 42