chained equations and more in multiple imputation in stata 12 · chained equations and more in...
TRANSCRIPT
Chained equations and more in multiple imputation in Stata 12
Chained equations and more in multiple
imputation in Stata 12
Yulia Marchenko
Associate Director, BiostatisticsStataCorp LP
2011 Italian Stata Users Group Meeting
Yulia Marchenko (StataCorp) November 17, 2011 1 / 45
Chained equations and more in multiple imputation in Stata 12
Outline
Outline
Brief overview of MI
Brief history of MI in Stata
New official MI features in Stata 12
Multiple imputation using chained equations (MICE)
OverviewExamplesConvergenceAdvantages/DisadvantagesIncompatibility of conditionalsMICE versus MVN
Concluding remarks
References
Yulia Marchenko (StataCorp) November 17, 2011 2 / 45
Chained equations and more in multiple imputation in Stata 12
Brief overview of MI
Multiple imputation (MI) is a principled, simulation-basedapproach for analyzing incomplete data
MI procedure 1) replaces missing values with multiple sets ofsimulated values to complete the data, 2) applies standardanalyses to each completed dataset, and 3) adjusts theobtained parameter estimates for missing-data uncertainty
The objective of MI is not to predict missing values as closeas possible to the true ones but to handle missing data in away resulting in valid statistical inference (Rubin 1996)
MI is statistically valid if an imputation model is proper andthe primary, completed-data analysis is statistically valid inthe absence of missing data (Rubin 1987)
Yulia Marchenko (StataCorp) November 17, 2011 3 / 45
Chained equations and more in multiple imputation in Stata 12
Brief history of MI in Stata
User-written tools
Stata 7
2003 (Carlin et al. 2003): tools for analyzing multiplyimputed data (mifit, miset, mido, mici, mitestparm,miappend, etc.)
Stata 8
2004 (Royston 2004): univariate imputation (uvis) andmultivariate imputation using chained equations (mvis),analysis of multiply imputed data (micombine similar toCarlin’s mifit)
2005 (Royston 2005a, 2005b): ice replaces and extends mvisfor imputation using chained equations
2007 (Royston 2007): updates for ice with an emphasis oninterval censoring
2008: mira by Rodrigo Alfaro for analyzing MI data stored inseparate files
Yulia Marchenko (StataCorp) November 17, 2011 4 / 45
Chained equations and more in multiple imputation in Stata 12
Brief history of MI in Stata
User-written tools
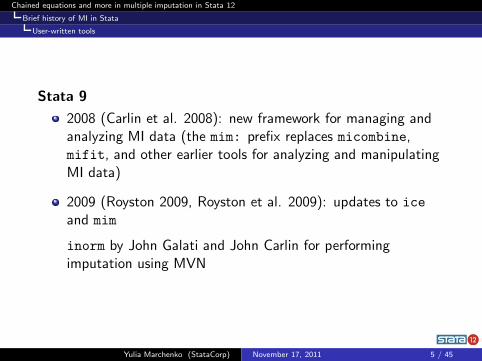
Stata 9
2008 (Carlin et al. 2008): new framework for managing andanalyzing MI data (the mim: prefix replaces micombine,mifit, and other earlier tools for analyzing and manipulatingMI data)
2009 (Royston 2009, Royston et al. 2009): updates to ice
and mim
inorm by John Galati and John Carlin for performingimputation using MVN
Yulia Marchenko (StataCorp) November 17, 2011 5 / 45
Chained equations and more in multiple imputation in Stata 12
Brief history of MI in Stata
Official tools
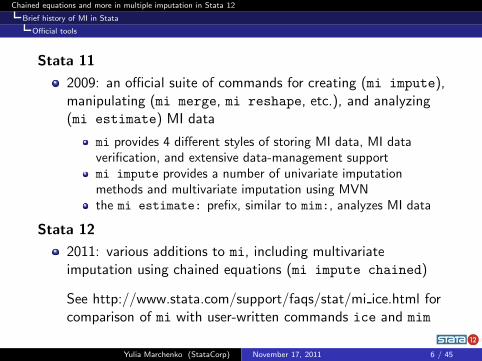
Stata 11
2009: an official suite of commands for creating (mi impute),manipulating (mi merge, mi reshape, etc.), and analyzing(mi estimate) MI data
mi provides 4 different styles of storing MI data, MI dataverification, and extensive data-management supportmi impute provides a number of univariate imputationmethods and multivariate imputation using MVNthe mi estimate: prefix, similar to mim:, analyzes MI data
Stata 12
2011: various additions to mi, including multivariateimputation using chained equations (mi impute chained)
See http://www.stata.com/support/faqs/stat/mi ice.html forcomparison of mi with user-written commands ice and mim
Yulia Marchenko (StataCorp) November 17, 2011 6 / 45
Chained equations and more in multiple imputation in Stata 12
Some of the new official MI features in Stata 12
Imputation
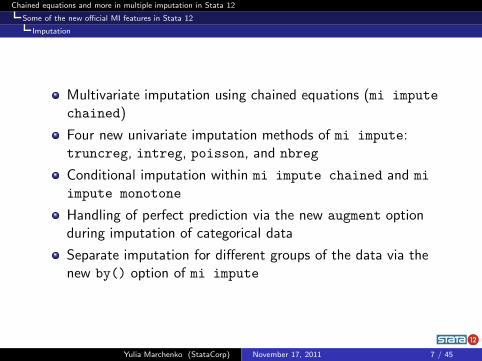
Multivariate imputation using chained equations (mi impute
chained)
Four new univariate imputation methods of mi impute:truncreg, intreg, poisson, and nbreg
Conditional imputation within mi impute chained and mi
impute monotone
Handling of perfect prediction via the new augment optionduring imputation of categorical data
Separate imputation for different groups of the data via thenew by() option of mi impute
Yulia Marchenko (StataCorp) November 17, 2011 7 / 45

Chained equations and more in multiple imputation in Stata 12
Some of the new official MI features in Stata 12
Estimation
mi estimate, mcerror estimates the amount of simulationerror associated with MI results
New commands mi predict and mi predictnl to computelinear and nonlinear MI predictions
misstable summarize, generate() creates missing-valueindicators for variables containing missing values
Yulia Marchenko (StataCorp) November 17, 2011 8 / 45

Chained equations and more in multiple imputation in Stata 12
Multiple imputation using chained equations
Overview
MICE (van Buuren et al. 1999) is an iterative imputationmethod that imputes multiple variables by using chainedequations, a sequence of univariate imputation methods withfully conditional specification (FCS) of prediction equations
That is, to get one set of imputed values, iterate overt = 0, 1, . . . ,T and impute:
X(t+1)1 using X
(t)2 ,X
(t)3 , . . . ,X
(t)q
X(t+1)2 using X
(t+1)1 ,X
(t)3 , . . . ,X
(t)q
· · ·X
(t+1)q using X
(t+1)1 ,X
(t+1)2 , . . . ,X
(t+1)q−1
Yulia Marchenko (StataCorp) November 17, 2011 9 / 45

Chained equations and more in multiple imputation in Stata 12
Multiple imputation using chained equations
Overview
MICE is also known as FCS and SRMI, sequential regressionmultivariate imputation (Raghunathan et al. 2001)
MICE can handle variables of different types
MICE can handle arbitrary missing-data patterns
MICE can accommodate certain important characteristics(data ranges, restrictions within a subset) of the observationaldata
Being an iterative method, MICE requires checking ofconvergence
MICE requires careful modeling of conditional specifications
See White et al. (2011) for practical guidelines about usingMICE
Yulia Marchenko (StataCorp) November 17, 2011 10 / 45

Chained equations and more in multiple imputation in Stata 12
Multiple imputation using chained equations
Examples: Data
Consider fictional data recording heart attacks
. use mheart8(Fictional heart attack data; bmi and age missing; arbitrary pattern)
. describe
Contains data from mheart8.dta
obs: 154 Fictional heart attack data;bmi and age missing; arbitrarypattern
vars: 6 1 Sep 2011 10:11size: 1,848
storage display value
variable name type format label variable label
attack byte %9.0g Outcome (heart attack)
smokes byte %9.0g Current smokerage float %9.0g Age, in years
bmi float %9.0g Body Mass Index, kg/m^2female byte %9.0g Genderhsgrad byte %9.0g High school graduate
Sorted by:
Yulia Marchenko (StataCorp) November 17, 2011 11 / 45

Let’s summarize missing values
. misstable summarize, generate(Mis_)
Obs<.
UniqueVariable Obs=. Obs>. Obs<. values Min Max
age 12 142 142 20.73613 83.78423bmi 28 126 126 17.22643 38.24214
and explore missing-data patterns
. misstable patterns
Missing-value patterns
(1 means complete)
PatternPercent 1 2
77% 1 1
16 1 05 0 1
3 0 0
100%
Variables are (1) age (2) bmi
Chained equations and more in multiple imputation in Stata 12
Multiple imputation using chained equations
Examples: Prepare data for imputation
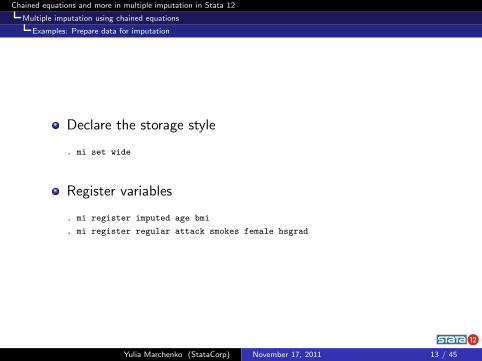
Declare the storage style
. mi set wide
Register variables
. mi register imputed age bmi
. mi register regular attack smokes female hsgrad
Yulia Marchenko (StataCorp) November 17, 2011 13 / 45

Chained equations and more in multiple imputation in Stata 12
Multiple imputation using chained equations
Example 1: Default prediction equations
Impute age and bmi using regression imputation
. mi impute chained (regress) age bmi = attack smokes female hsgrad, add(5) rseed(27654)
Conditional models:age: regress age bmi attack smokes female hsgrad
bmi: regress bmi age attack smokes female hsgrad
Performing chained iterations ...
Multivariate imputation Imputations = 5Chained equations added = 5Imputed: m=1 through m=5 updated = 0
Initialization: monotone Iterations = 50
burn-in = 10
age: linear regressionbmi: linear regression
Observations per m
Variable Complete Incomplete Imputed Total
age 142 12 12 154
bmi 126 28 28 154
(complete + incomplete = total; imputed is the minimum across mof the number of filled-in observations.)
Yulia Marchenko (StataCorp) November 17, 2011 14 / 45

Chained equations and more in multiple imputation in Stata 12
Multiple imputation using chained equations
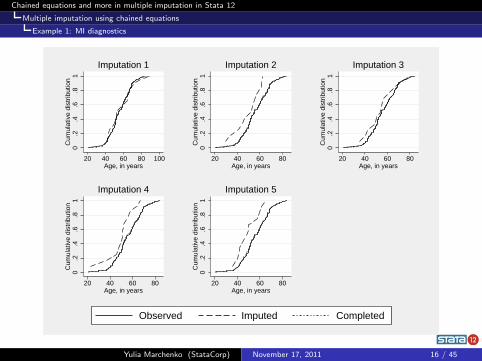
Example 1: MI diagnostics
Compare distributions of the imputed, completed, andobserved data for age (midiagplots is a forthcominguser-written command; see Marchenko and Eddings (2011) forhow to create MI diagnostic plots manually)
. midiagplots age, m(1/5) combine
(M = 5 imputations)(imputed: age bmi)
(Continued on next page)
Yulia Marchenko (StataCorp) November 17, 2011 15 / 45
Chained equations and more in multiple imputation in Stata 12
Multiple imputation using chained equations
Example 1: MI diagnostics
0.2
.4.6
.81
Cum
ulat
ive
dist
ribut
ion
20 40 60 80 100Age, in years
Imputation 1
0.2
.4.6
.81
Cum
ulat
ive
dist
ribut
ion
20 40 60 80Age, in years
Imputation 2
0.2
.4.6
.81
Cum
ulat
ive
dist
ribut
ion
20 40 60 80Age, in years
Imputation 30
.2.4
.6.8
1C
umul
ativ
e di
strib
utio
n
20 40 60 80Age, in years
Imputation 40
.2.4
.6.8
1C
umul
ativ
e di
strib
utio
n
20 40 60 80Age, in years
Imputation 5
Observed Imputed Completed
Yulia Marchenko (StataCorp) November 17, 2011 16 / 45

Chained equations and more in multiple imputation in Stata 12
Multiple imputation using chained equations
Example 1: MI diagnostics
Compare distributions of the imputed, completed, andobserved data for bmi
. midiagplots bmi, m(1/5) combine(M = 5 imputations)
(imputed: age bmi)
(Continued on next page)
Yulia Marchenko (StataCorp) November 17, 2011 17 / 45

Chained equations and more in multiple imputation in Stata 12
Multiple imputation using chained equations
Example 1: MI diagnostics
0.2
.4.6
.81
Cum
ulat
ive
dist
ribut
ion
15 20 25 30 35 40Body Mass Index, kg/m^2
Imputation 1
0.2
.4.6
.81
Cum
ulat
ive
dist
ribut
ion
15 20 25 30 35 40Body Mass Index, kg/m^2
Imputation 2
0.2
.4.6
.81
Cum
ulat
ive
dist
ribut
ion
15 20 25 30 35 40Body Mass Index, kg/m^2
Imputation 30
.2.4
.6.8
1C
umul
ativ
e di
strib
utio
n
15 20 25 30 35 40Body Mass Index, kg/m^2
Imputation 40
.2.4
.6.8
1C
umul
ativ
e di
strib
utio
n
10 20 30 40Body Mass Index, kg/m^2
Imputation 5
Observed Imputed Completed
Yulia Marchenko (StataCorp) November 17, 2011 18 / 45
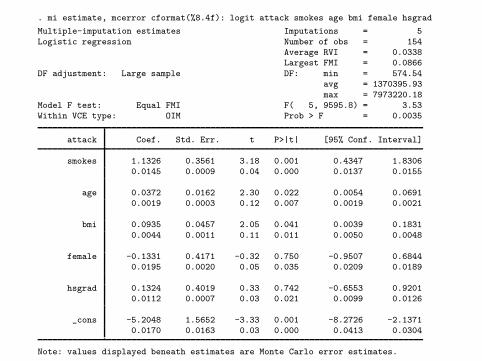
. mi estimate, mcerror cformat(%8.4f): logit attack smokes age bmi female hsgrad
Multiple-imputation estimates Imputations = 5
Logistic regression Number of obs = 154Average RVI = 0.0338Largest FMI = 0.0866
DF adjustment: Large sample DF: min = 574.54avg = 1370395.93
max = 7973220.18Model F test: Equal FMI F( 5, 9595.8) = 3.53Within VCE type: OIM Prob > F = 0.0035
attack Coef. Std. Err. t P>|t| [95% Conf. Interval]
smokes 1.1326 0.3561 3.18 0.001 0.4347 1.83060.0145 0.0009 0.04 0.000 0.0137 0.0155
age 0.0372 0.0162 2.30 0.022 0.0054 0.06910.0019 0.0003 0.12 0.007 0.0019 0.0021
bmi 0.0935 0.0457 2.05 0.041 0.0039 0.1831
0.0044 0.0011 0.11 0.011 0.0050 0.0048
female -0.1331 0.4171 -0.32 0.750 -0.9507 0.68440.0195 0.0020 0.05 0.035 0.0209 0.0189
hsgrad 0.1324 0.4019 0.33 0.742 -0.6553 0.92010.0112 0.0007 0.03 0.021 0.0099 0.0126
_cons -5.2048 1.5652 -3.33 0.001 -8.2726 -2.13710.0170 0.0163 0.03 0.000 0.0413 0.0304
Note: values displayed beneath estimates are Monte Carlo error estimates.
Chained equations and more in multiple imputation in Stata 12
Multiple imputation using chained equations
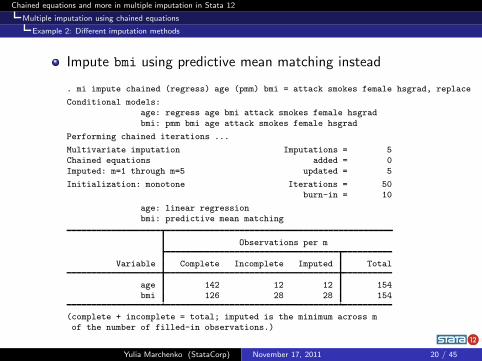
Example 2: Different imputation methods
Impute bmi using predictive mean matching instead
. mi impute chained (regress) age (pmm) bmi = attack smokes female hsgrad, replace
Conditional models:age: regress age bmi attack smokes female hsgrad
bmi: pmm bmi age attack smokes female hsgrad
Performing chained iterations ...
Multivariate imputation Imputations = 5Chained equations added = 0
Imputed: m=1 through m=5 updated = 5
Initialization: monotone Iterations = 50burn-in = 10
age: linear regressionbmi: predictive mean matching
Observations per m
Variable Complete Incomplete Imputed Total
age 142 12 12 154bmi 126 28 28 154
(complete + incomplete = total; imputed is the minimum across mof the number of filled-in observations.)
Yulia Marchenko (StataCorp) November 17, 2011 20 / 45

Chained equations and more in multiple imputation in Stata 12
Multiple imputation using chained equations
Example 3.1: Custom prediction equations (different sets of predictors)
Omit hsgrad from the prediction equation for bmi
. mi impute chained (regress) age ///> (pmm, omit(hsgrad)) bmi ///
> = attack smokes female hsgrad, replace
Conditional models:age: regress age bmi attack smokes female hsgrad
bmi: pmm bmi age attack smokes female
Performing chained iterations ...
Multivariate imputation Imputations = 5Chained equations added = 0Imputed: m=1 through m=5 updated = 5
Initialization: monotone Iterations = 50
burn-in = 10
age: linear regressionbmi: predictive mean matching
Observations per m
Variable Complete Incomplete Imputed Total
age 142 12 12 154
bmi 126 28 28 154
(complete + incomplete = total; imputed is the minimum across mof the number of filled-in observations.)
Yulia Marchenko (StataCorp) November 17, 2011 21 / 45

Chained equations and more in multiple imputation in Stata 12
Multiple imputation using chained equations
Example 3.1: Custom prediction equations (different sets of predictors)
Or, include hsgrad in the prediction equation for age
. mi impute chained (regress, include(hsgrad)) age ///> (pmm) bmi ///
> = attack smokes female, replace
Conditional models:age: regress age bmi hsgrad attack smokes female
bmi: pmm bmi age attack smokes female
Performing chained iterations ...
Multivariate imputation Imputations = 5Chained equations added = 0Imputed: m=1 through m=5 updated = 5
Initialization: monotone Iterations = 50
burn-in = 10
age: linear regressionbmi: predictive mean matching
Observations per m
Variable Complete Incomplete Imputed Total
age 142 12 12 154
bmi 126 28 28 154
(complete + incomplete = total; imputed is the minimum across mof the number of filled-in observations.)
Yulia Marchenko (StataCorp) November 17, 2011 22 / 45

Chained equations and more in multiple imputation in Stata 12
Multiple imputation using chained equations
Example 3.2: Custom prediction equations (functions of imputed variables)
What if relationship between age and bmi is curvilinear?
. mi impute chained (regress, include(hsgrad (bmi^2))) age ///> (pmm) bmi ///
> = attack smokes female, replace
Conditional models:age: regress age bmi hsgrad (bmi^2) attack smokes female
bmi: pmm bmi age attack smokes female
Performing chained iterations ...
Multivariate imputation Imputations = 5Chained equations added = 0Imputed: m=1 through m=5 updated = 5
Initialization: monotone Iterations = 50
burn-in = 10
age: linear regressionbmi: predictive mean matching
Observations per m
Variable Complete Incomplete Imputed Total
age 142 12 12 154
bmi 126 28 28 154
(complete + incomplete = total; imputed is the minimum across mof the number of filled-in observations.)
Yulia Marchenko (StataCorp) November 17, 2011 23 / 45
Chained equations and more in multiple imputation in Stata 12
Multiple imputation using chained equations
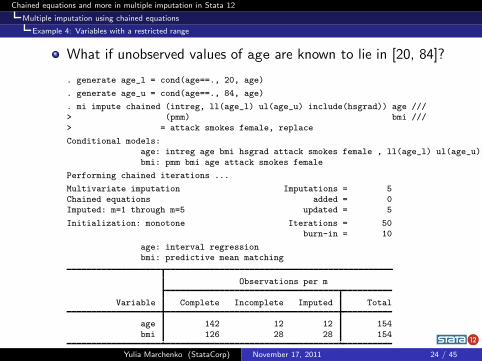
Example 4: Variables with a restricted range
What if unobserved values of age are known to lie in [20, 84]?
. generate age_l = cond(age==., 20, age)
. generate age_u = cond(age==., 84, age)
. mi impute chained (intreg, ll(age_l) ul(age_u) include(hsgrad)) age ///> (pmm) bmi ///
> = attack smokes female, replace
Conditional models:age: intreg age bmi hsgrad attack smokes female , ll(age_l) ul(age_u)
bmi: pmm bmi age attack smokes female
Performing chained iterations ...
Multivariate imputation Imputations = 5Chained equations added = 0Imputed: m=1 through m=5 updated = 5
Initialization: monotone Iterations = 50burn-in = 10
age: interval regressionbmi: predictive mean matching
Observations per m
Variable Complete Incomplete Imputed Total
age 142 12 12 154
bmi 126 28 28 154
(complete + incomplete = total; imputed is the minimum across mYulia Marchenko (StataCorp) November 17, 2011 24 / 45
Chained equations and more in multiple imputation in Stata 12
Multiple imputation using chained equations
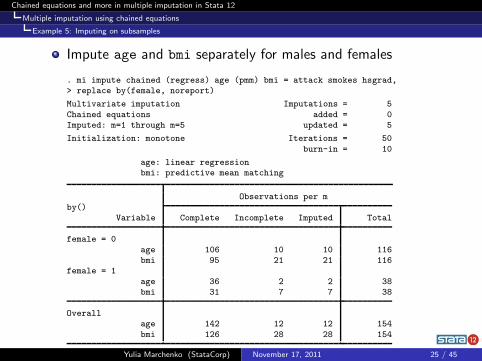
Example 5: Imputing on subsamples
Impute age and bmi separately for males and females
. mi impute chained (regress) age (pmm) bmi = attack smokes hsgrad,> replace by(female, noreport)
Multivariate imputation Imputations = 5
Chained equations added = 0Imputed: m=1 through m=5 updated = 5
Initialization: monotone Iterations = 50
burn-in = 10
age: linear regressionbmi: predictive mean matching
Observations per m
by()Variable Complete Incomplete Imputed Total
female = 0
age 106 10 10 116bmi 95 21 21 116
female = 1
age 36 2 2 38bmi 31 7 7 38
Overallage 142 12 12 154
bmi 126 28 28 154
(complete + incomplete = total; imputed is the minimum across mYulia Marchenko (StataCorp) November 17, 2011 25 / 45
Chained equations and more in multiple imputation in Stata 12
Multiple imputation using chained equations
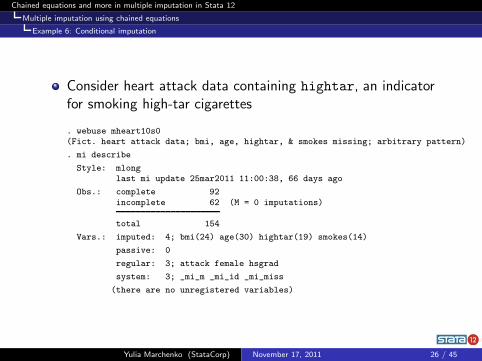
Example 6: Conditional imputation
Consider heart attack data containing hightar, an indicatorfor smoking high-tar cigarettes
. webuse mheart10s0(Fict. heart attack data; bmi, age, hightar, & smokes missing; arbitrary pattern)
. mi describe
Style: mlonglast mi update 25mar2011 11:00:38, 66 days ago
Obs.: complete 92
incomplete 62 (M = 0 imputations)
total 154
Vars.: imputed: 4; bmi(24) age(30) hightar(19) smokes(14)
passive: 0
regular: 3; attack female hsgrad
system: 3; _mi_m _mi_id _mi_miss
(there are no unregistered variables)
Yulia Marchenko (StataCorp) November 17, 2011 26 / 45

Explore missing-data patterns
. mi misstable patterns
Missing-value patterns(1 means complete)
PatternPercent 1 2 3 4
60% 1 1 1 1
14 1 1 1 0
10 1 1 0 17 0 0 1 13 1 1 0 0
2 1 0 1 11 0 0 0 1
<1 0 0 1 0<1 1 0 0 0<1 1 0 1 0
100%
Variables are (1) smokes (2) hightar (3) bmi (4) age
.
. mi misstable nested
1. smokes(14) -> hightar(19)2. bmi(24)
3. age(30)
Chained equations and more in multiple imputation in Stata 12
Multiple imputation using chained equations
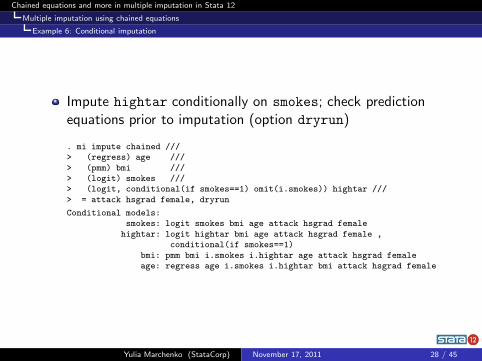
Example 6: Conditional imputation
Impute hightar conditionally on smokes; check predictionequations prior to imputation (option dryrun)
. mi impute chained ///> (regress) age ///
> (pmm) bmi ///> (logit) smokes ///> (logit, conditional(if smokes==1) omit(i.smokes)) hightar ///
> = attack hsgrad female, dryrun
Conditional models:smokes: logit smokes bmi age attack hsgrad female
hightar: logit hightar bmi age attack hsgrad female ,conditional(if smokes==1)
bmi: pmm bmi i.smokes i.hightar age attack hsgrad femaleage: regress age i.smokes i.hightar bmi attack hsgrad female
Yulia Marchenko (StataCorp) November 17, 2011 28 / 45
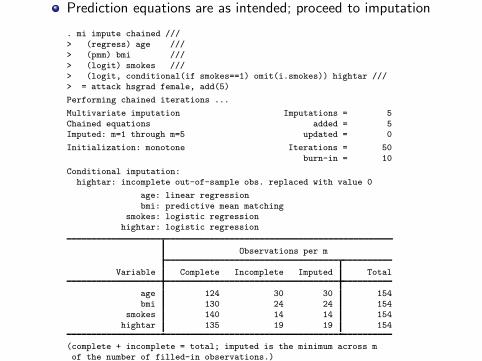
Prediction equations are as intended; proceed to imputation
. mi impute chained ///
> (regress) age ///> (pmm) bmi ///
> (logit) smokes ///> (logit, conditional(if smokes==1) omit(i.smokes)) hightar ///> = attack hsgrad female, add(5)
Performing chained iterations ...
Multivariate imputation Imputations = 5
Chained equations added = 5Imputed: m=1 through m=5 updated = 0
Initialization: monotone Iterations = 50
burn-in = 10
Conditional imputation:hightar: incomplete out-of-sample obs. replaced with value 0
age: linear regression
bmi: predictive mean matchingsmokes: logistic regression
hightar: logistic regression
Observations per m
Variable Complete Incomplete Imputed Total
age 124 30 30 154bmi 130 24 24 154
smokes 140 14 14 154
hightar 135 19 19 154
(complete + incomplete = total; imputed is the minimum across mof the number of filled-in observations.)
Chained equations and more in multiple imputation in Stata 12
Multiple imputation using chained equations
Convergence
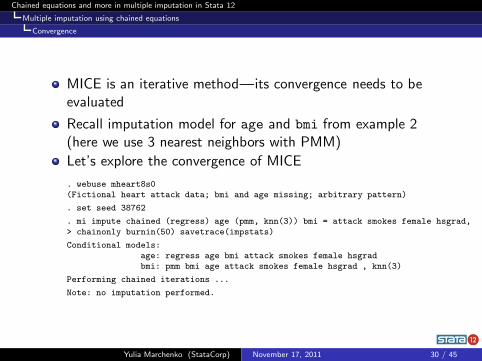
MICE is an iterative method—its convergence needs to beevaluated
Recall imputation model for age and bmi from example 2(here we use 3 nearest neighbors with PMM)
Let’s explore the convergence of MICE
. webuse mheart8s0(Fictional heart attack data; bmi and age missing; arbitrary pattern)
. set seed 38762
. mi impute chained (regress) age (pmm, knn(3)) bmi = attack smokes female hsgrad,
> chainonly burnin(50) savetrace(impstats)
Conditional models:age: regress age bmi attack smokes female hsgradbmi: pmm bmi age attack smokes female hsgrad , knn(3)
Performing chained iterations ...
Note: no imputation performed.
Yulia Marchenko (StataCorp) November 17, 2011 30 / 45

Chained equations and more in multiple imputation in Stata 12
Multiple imputation using chained equations
Convergence
Trace plots of means and standard deviations of imputedvalues
. use impstats
(Summaries of imputed values from -mi impute chained-)
. tsset itertime variable: iter, 0 to 50
delta: 1 unit
. tsline bmi_mean, name(gr1) nodraw yline(25)
. tsline bmi_sd, name(gr2) nodraw yline(4)
. tsline age_mean, name(gr3) nodraw yline(56)
. tsline age_sd, name(gr4) nodraw yline(11.6)
. graph combine gr1 gr2 gr3 gr4, title(Trace plots of summaries of imputed values)> rows(2)
(Continued on next page)
Yulia Marchenko (StataCorp) November 17, 2011 31 / 45

Chained equations and more in multiple imputation in Stata 12
Multiple imputation using chained equations
Convergence
2324
2526
27M
ean
of b
mi
0 10 20 30 40 50Iteration numbers
23
45
6S
td. D
ev. o
f bm
i
0 10 20 30 40 50Iteration numbers
5055
6065
Mea
n of
age
0 10 20 30 40 50Iteration numbers
510
1520
Std
. Dev
. of a
ge
0 10 20 30 40 50Iteration numbers
Trace plots of summaries of imputed values
Yulia Marchenko (StataCorp) November 17, 2011 32 / 45

Chained equations and more in multiple imputation in Stata 12
Multiple imputation using chained equations
Convergence
MICE uses separate independent chains to obtain imputations
Use add() instead of chainonly in combination withsavetrace() to save summaries of imputed values frommultiple chains
. webuse mheart8s0, clear
(Fictional heart attack data; bmi and age missing; arbitrary pattern)
. qui mi impute chain (regress) age (pmm, knn(3)) bmi = attack smokes female hsgrad,> add(5) burnin(20) savetrace(impstats, replace)
Yulia Marchenko (StataCorp) November 17, 2011 33 / 45

Chained equations and more in multiple imputation in Stata 12
Multiple imputation using chained equations
Convergence
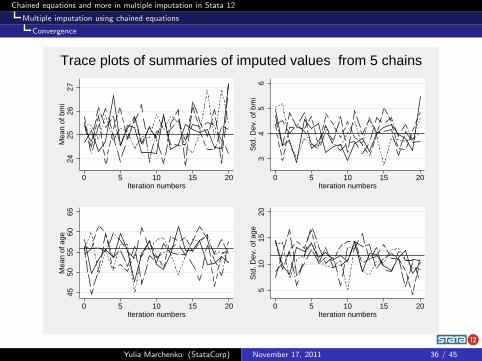
Trace plots of means and standard deviations of imputedvalues from multiple chains
. use impstats, clear
(Summaries of imputed values from -mi impute chained-)
. reshape wide *mean *sd, i(iter) j(m)(note: j = 1 2 3 4 5)
Data long -> wide
Number of obs. 105 -> 21
Number of variables 6 -> 21j variable (5 values) m -> (dropped)xij variables:
age_mean -> age_mean1 age_mean2 ... age_mean5bmi_mean -> bmi_mean1 bmi_mean2 ... bmi_mean5
age_sd -> age_sd1 age_sd2 ... age_sd5bmi_sd -> bmi_sd1 bmi_sd2 ... bmi_sd5
--more--
Yulia Marchenko (StataCorp) November 17, 2011 34 / 45

Chained equations and more in multiple imputation in Stata 12
Multiple imputation using chained equations
Convergence
. tsset itertime variable: iter, 0 to 20
delta: 1 unit
. tsline bmi_mean*, name(gr1) nodraw legend(off) ytitle(Mean of bmi) yline(25)
. tsline bmi_sd*, name(gr2) nodraw legend(off) ytitle(Std. Dev. of bmi) yline(4)
. tsline age_mean*, name(gr3) nodraw legend(off) ytitle(Mean of age) yline(56)
. tsline age_sd*, name(gr4) nodraw legend(off) ytitle(Std. Dev. of age) yline(11.6)
. graph combine gr1 gr2 gr3 gr4, title(Trace plots of summaries of imputed values> from 5 chains) rows(2)
(Continued on next page)
Yulia Marchenko (StataCorp) November 17, 2011 35 / 45
Chained equations and more in multiple imputation in Stata 12
Multiple imputation using chained equations
Convergence
2425
2627
Mea
n of
bm
i
0 5 10 15 20Iteration numbers
34
56
Std
. Dev
. of b
mi
0 5 10 15 20Iteration numbers
4550
5560
65M
ean
of a
ge
0 5 10 15 20Iteration numbers
510
1520
Std
. Dev
. of a
ge
0 5 10 15 20Iteration numbers
Trace plots of summaries of imputed values from 5 chains
Yulia Marchenko (StataCorp) November 17, 2011 36 / 45

Chained equations and more in multiple imputation in Stata 12
Multiple imputation using chained equations
Advantages
The variable-by-variable specification of MICE makes it easyto build complicated imputation models for multiple variables
Unlike sequential monotone imputation, MICE does notrequire monotone missing-data patterns
MICE accommodates variables of different types by using animputation method appropriate for each variable
MICE allows different sets of predictors when imputingdifferent variables
MICE allows to impute missing values within the observed (orpre-specified) ranges of the data
MICE can handle imputation of variables defined only on asubset of the data—conditional imputation
MICE can incorporate functional relationships among variables
Yulia Marchenko (StataCorp) November 17, 2011 37 / 45
Chained equations and more in multiple imputation in Stata 12
Multiple imputation using chained equations
Disadvantages
MICE lacks formal theoretical justification
In particular, its theoretical weakness is possibleincompatibility of fully conditional specifications for which noproper joint multivariate distribution exists
The variable-by-variable specification of MICE also makes iteasy to build models with incompatible conditionals
Yulia Marchenko (StataCorp) November 17, 2011 38 / 45

Chained equations and more in multiple imputation in Stata 12
Multiple imputation using chained equations
Incompatibility of conditionals
MICE is similar in spirit to a Gibbs sampler but is not a trueGibbs sampler except in rare cases
A set of fully conditional specifications may be incompatible,that is, it may not correspond to any proper joint multivariatedistribution (e.g., Arnold et al. 2001)
For example, X1|X2 ∼ N(α1 + β1X2, σ21) and
X2|X1 ∼ N(α2 + β2 lnX1, σ22) are incompatible
See, for example, van Buuren (2006, 2007) for the impact ofincompatible conditionals on final MI results—only minorimpact was found in the examples considered
Yulia Marchenko (StataCorp) November 17, 2011 39 / 45
Chained equations and more in multiple imputation in Stata 12
Multiple imputation using chained equations
MICE versus MVN
MICE uses a sequential (variable-by-variable) approach forimputation; MVN (Schafer 1997) uses a joint modelingapproach based on a multivariate normal distributionMICE has no theoretical justification (except in someparticular cases); MVN doesMICE can handle variables of different types; MVN is intendedfor continuous variables and requires normality (Schafer [1997]and Allison [2001] note that MVN can be robust to departuresfrom normality and can sometimes be used to model binaryand ordinal variables)MICE can incorporate important data characteristics such asranges and restrictions within a subset of the data; in general,MVN cannotIn practice, the quality of imputations from either of themethods should be examinedSee, for example, Lee and Carlin (2010) for a recentcomparison of MVN and MICE
Yulia Marchenko (StataCorp) November 17, 2011 40 / 45
Chained equations and more in multiple imputation in Stata 12
Concluding remarks
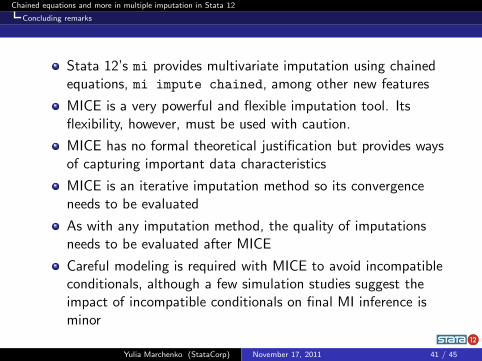
Stata 12’s mi provides multivariate imputation using chainedequations, mi impute chained, among other new features
MICE is a very powerful and flexible imputation tool. Itsflexibility, however, must be used with caution.
MICE has no formal theoretical justification but provides waysof capturing important data characteristics
MICE is an iterative imputation method so its convergenceneeds to be evaluated
As with any imputation method, the quality of imputationsneeds to be evaluated after MICE
Careful modeling is required with MICE to avoid incompatibleconditionals, although a few simulation studies suggest theimpact of incompatible conditionals on final MI inference isminor
Yulia Marchenko (StataCorp) November 17, 2011 41 / 45
Chained equations and more in multiple imputation in Stata 12
References
Allison, P. D. 2001. Missing Data. Thousand Oaks, CA: Sage.
Arnold, B. C., E. Castillo, and J. M. Sarabia. 2001. Conditionallyspecified distributions: An introduction. Statistical Science 16:249—274.
Carlin, J. B., J. C. Galati, and P. Royston. 2008. A new frameworkfor managing and analyzing multiply imputed data in Stata. Stata
Journal 8: 49—67.
Carlin, J. B., N. Li, P. Greenwood, and C. Coffey. 2003. Tools foranalyzing multiple imputed datasets. Stata Journal 3: 226—244.
Lee, K. J., and J. B. Carlin. 2010. Multiple imputation for missingdata: Fully conditional specification versus multivariate normalimputation. American Journal of Epidemiology 171: 624—632.
Marchenko, Y. V., and W. D. Eddings. 2011. A note on how toperform multiple-imputation diagnostics in Stata.http://www.stata.com/users/ymarchenko/midiagnote.pdf.
Yulia Marchenko (StataCorp) November 17, 2011 42 / 45

Chained equations and more in multiple imputation in Stata 12
References
Raghunathan, T. E., J. M. Lepkowski, J. Van Hoewyk, and P.Solenberger. 2001. A multivariate technique for multiply imputingmissing values using a sequence of regression models. Survey
Methodology 27: 85—95.
Royston, P. 2004. Multiple imputation of missing values. Stata
Journal 4: 227—241.
Royston, P. 2005a. Multiple imputation of missing values: Update.Stata Journal 5: 188—201.
Royston, P. 2005b. Multiple imputation of missing values: Updateof ice. Stata Journal 5: 527—536.
Royston, P. 2007. Multiple imputation of missing values: Furtherupdate of ice, with an emphasis on interval censoring. Stata
Journal 7: 445—464.
Yulia Marchenko (StataCorp) November 17, 2011 43 / 45
Chained equations and more in multiple imputation in Stata 12
References
Royston, P. 2009. Multiple imputation of missing values: Furtherupdate of ice, with an emphasis on categorical variables. Stata
Journal 9: 466—477.
Royston, P., J. B. Carlin, and I. R. White. 2009. Multipleimputation of missing values: New features for mim. Stata Journal
9: 252—264.
Rubin, D. B. 1987. Multiple Imputation for Nonresponse in
Surveys. New York: Wiley.
Rubin, D. B. 1996. Multiple imputation after 18+ years. Journal
of the American Statistical Association 91: 473—489.
Schafer, J. L. 1997. Analysis of Incomplete Multivariate Data.Boca Raton, FL: Chapman & Hall/CRC.
Yulia Marchenko (StataCorp) November 17, 2011 44 / 45

Chained equations and more in multiple imputation in Stata 12
References
van Buuren, S. 2007. Multiple imputation of discrete andcontinuous data by fully conditional specification. Statistical
Methods in Medical Research 16: 219—242.
van Buuren, S., H. C. Boshuizen, and D. L. Knook. 1999. Multipleimputation of missing blood pressure covariates in survival analysis.Statistics in Medicine 18: 681—694.
van Buuren, S., J. P. L. Brand, C. G. M. Groothuis-Oudshoorn,and D. B. Rubin. 2006. Fully conditional specification inmultivariate imputation. Journal of Statistical Computation and
Simulation 76: 1049—1064.
White, I. R., P. Royston, and A. M. Wood. 2011. Multipleimputation using chained equations: Issues and guidance forpractice. Statistics in Medicine 30: 377—399.
Yulia Marchenko (StataCorp) November 17, 2011 45 / 45