chair of economic geography, institute of geography, kiel ... file1 the role of multinational...
TRANSCRIPT
1
The Role of Multinational Corporations in Metropolitan Innovation Systems –
Empirical Evidence from Europe and South-East Asia
Javier Revilla Diez, Martin Berger
Chair of Economic Geography, Institute of Geography, Kiel University
Ludewig- Meyn- Str. 14, D-24098 Kiel, Germany; email: [email protected]
Abstract. Using firm-level survey data from Barcelona, Stockholm, Vienna in Europe and Singapore, Penang
(Malaysia) and Bangkok in South-East Asia the paper enquires into the different R&D and innovation behaviour
of multinational and local companies in these Metropolitan Regions. Scrutinizing a set of input, throughput and
output indicators as well as information on cooperation characteristics, we try to evaluate a) if the spatial pattern
of more (intense) innovation activity in Europe when compared to South-East Asia is still valid; and b) if there
are reasons to believe that R&D units of multinational corporations in Europe are mainly concerned with the
enhancement of the knowledge base and the development of future competitiveness by tapping into localized
knowledge and using the particular host regions’ innovation systems, while, on the other hand, MNCs in South-
East Asia use R&D to support existing production facilities in order to exploit an existing competitive advantage.
We are able to show that there is still a major gap in the innovation performance between South-East Asia and
Europe and that there are indeed indications that R&D units in Europe are more orientated towards the
augmentation of the company’s knowledge base.
2
Introduction
Multinational corporations (MNCs) are an essential mechanism for the internationalization of
the transfer of knowledge and technology (Stichweh, 1999). By internationalization,
corporations try to use their specific competencies in various markets (Chandler, 1992). They
can utilize product, production, marketing and development competencies, which they have
accumulated in their home country.
In R&D facilities a gradual move away from a hitherto ethnocentric orientation can be
observed since the 1990s. Nevertheless, the corporations still stress predominantly
headquarter R&D capacities (cp. Patel and Pavitt, 1998). And the production of new
knowledge – as far as it can be measured in patent activities – is still concentrated in the home
country or region of the corporation (Archibugi and Mitchie, 1995). Therefore corporate
production and innovation concepts are still largely determined by the home location and the
respective national and regional characteristics and norms. However, the share of foreign
research departments increases steadily with the share of foreign industrial production
(OECD, 1998). This supports the thesis that the internationalization of production is followed
by the internationalization of research. The R&D departments of corporations are positioned
close to production units in order to use the advantages of spatial proximity. The
internationalization of production structures is therefore pushing the internationalization of
R&D departments.
Contrary to the image of borderless, globally acting corporations, there is evidence that the
competencies for research, production and marketing of specific products and services are still
to a significant degree regionally concentrated (see Braczyk et al., 1998; Cooke, 2002):
“Microregions are increasingly becoming one of the leading motors of economic
development, and gateways of countries to the global market place“ (Dunning, 2000: 29).
Consequently, it can be asked whether, how and in which ways multinational corporations use
regional competencies strategically.

3
The aim of this paper is to shed some light on the interaction between Multinational
Corporations’ affiliates and their host region’s system of innovation. In other words, we try to
contribute to the answer to following questions:
• What role do/ can MNCs’ subsidiaries play in the development of the host’s Regional
Innovation System (RIS)?
• And, in turn, how can MNCs benefit from their subsidiaries’ host innovation system?
The underlying assumption is that both targets - regional development and company
competitiveness – are interrelated. This means that strong regions can start a positive cycle of
attracting R&D related FDI, which fosters the RIS, which grows stronger and eventually
attracts even more companies.
On the other hand, weak regions could be ‘hollowed out’ by a vicious cycle of a weak RIS
and MNCs that restrict their regional activity to asset exploitation which might not benefit the
RIS.
The paper is structured in the following way: First, the theoretical framework is developed by
briefly summarizing the reason why companies go multinational. Especially the recent trend
of increasing globalisation of corporate R&D activities is highlighted. Second, we give an
overview of the theoretical foundation of Regional and Metropolitan Innovation Systems,
thereby elaborating the interaction between the MNC and the region and how they can
develop to mutual benefit. Third, we present the data used for this study and the methodology
with which it was generated and briefly describe the National Innovation System in which the
case regions are located. Fourth, we use empirical data from Europe and South-East Asia in
order to display similarities and differences in the MNC behaviour in Barcelona, Vienna,
Stockholm, Bangkok, Penang and Singapore. Within this part we test two hypotheses: first,

4
comparing innovation activity in Europe and South-East Asia, innovations are still
predominantly performed in Europe. Second, MNC subsidiaries in Europe tend to be more
focused on asset augmentation, i.e. in tapping into localized knowledge in order to increase
the MNCs knowledge base, while subsidiaries in South-East Asia are rather focused on asset
exploitation, i.e. the production of goods. Finally, we conclude with summing up our key
findings.
The perspective of the firm – objectives of cross border investments in R&D: exploiting
vs. augmenting
A MNC’s decision about which location to pick for an overseas investment is related to the
motive for this investment. Besides more traditional aspects such as resource or market-
seeking aspects, firms also decide in favour of a certain location because of efficiency or
strategic asset- seeking motives. The last two decades have witnessed a “rapid growth of
strategic asset-seeking FDI, which is geared less to exploiting an existing ownerspecific
advantage of an investing firm, and more to protecting, or augmenting, that advantage by
acquisition of new assets, or by a partnering arrangement with a foreign firm” (Dunning,
1998: 55). But also more traditional forms of FDI have changed, and foreign subsidiaries are
nowadays more embedded in their host economy, have deeper value-chains and perform
higher order activities, including R&D (ibid.).
Both processes resulted in a situation where “an increasing proportion of the total R&D
expenditure is accounted for by … [MNCs] foreign subsidiaries” (Dunning, 2000: 16).
The main reasons for globalising R&D functions, which traditionally have been conducted at
the home base of the MNC, can be grouped in the following categories: a) market related: to
adapt products to local needs, to keep track of customer demands and to give technological
back up for important production sites; b) technology related: MNCs try to tap into foreign
science and technology (S&T) resources; c) cost related: not only the labour costs for

5
engineers and scientists vary globally, but in some industries the supply of high class
scientists at the home base might simply be not sufficient to sustain the MNC’s R&D efforts;
d) technology monitoring: to monitor new developments in S&T or to analyse competitors; e)
non-R&D related: national governments might connect market access to the establishment of
R&D facilities (e.g. in pharmaceuticals), or a company might want to improve its image by
showing commitment to the host region by transferring R&D functions (Reddy, 2000).
Combining types and motives of foreign R&D facilities produces a dichotomy of the
following two types of R&D FDI: units that are concerned with the exploitation of the firm’s
knowledge stock and units that aim at augmenting that existing knowledge stock of the firm
(Kuemmerle, 1999). Kuemmerle labels these types of R&D facilities ‘home-base-exploiting’
(HBE) and ‘home-base-augmenting’ (HBA) FDI.
HBE is responsible for adapting existing products to local needs and transferring knowledge
and prototypes from the firm’s home location and therefore follows existing production
abroad (see also Hotz-Hart, 2000). There is evidence that much of the technology that is
developed by MNCs abroad still falls into the core areas of the firms’ competence,
“suggesting that adaptation and technical support to foreign manufacturing plants continues to
be a major explanatory factor” (Cantwell and Iammarino, 2003: 4) for the dispersion of
multinational R&D activities.
In contrast, HBA has the task of extending existing core competencies and of broadening the
knowledge base of the firm. Its requirements on a location are fairly different from HBEs. In
order to participate in innovative networks, to benefit from spillovers and to tap into local
knowledge they need to be located in agglomerations that host a high density of high-class
R&D facilities (public or private), service companies and institutions as well as a large pool
of highly educated engineers and scientists (e.g. Ivarsson and Jonsson, 2003). Furthermore,
different locations offer different specialisations, and it is necessary for MNC to ‘be there’ in
6
order to make use of this localized knowledge. Reddy evaluates this access to “ a wide range
of innovative stimuli and sources of scientific creativity” (2000: 27) as the key driving force
behind the globalization of R&D by MNCs.
Even though this kind of localized knowledge is increasingly distributed internationally, it is
predominantly sited within the Triad of Europe, Japan, and North America (Hotz-Hart, 2000;
Dunning, 2000). Still more than 90% of the world’s industrial R&D is still carried out within
the industrialized world (Reddy, 2000). These locations of innovative stimuli, key knowledge
and sources of creativity are not evenly distributed within the industrialized world, but there is
“some suggestion that the major metropolitan areas and their surrounding hinterlands are
becoming the loci of agglomerative knowledge enhancing activity” (Dunning, 2000: 125).
The perspective of the region – From national to metropolitan systems of innovation
Since the mid-1980s research about innovation processes has been increasingly directed to the
analysis of national systems of innovation (Freeman and Soete, 1997). The systems of
innovation concept interprets innovation as a systemic and complex process, which is not seen
as a linear sequence, as in the neoclassical view, and not only dependent on one single
entrepreneur's decisions. Instead, it is accepted that innovation is a result of intensive
interactions between different actors within and outside a firm and therefore depending
heavily on relationships between the firm and its environment. The business environment
influences the firm's innovation activities in two ways. On the one hand, innovative firms use
the cooperation with other actors to access information, knowledge and other resources, to
exchange experiences, and to find jointly adequate solutions. Potential cooperation partners
are other firms, for example customers, suppliers, competitors, service providers and/or
research institutes, financial institutions, political decision-makers etc. On the other hand, the
social and cultural embeddedness, the institutional and regulatory framework and the existing

7
infrastructure influence entrepreneurial decisions. In this sense, innovation is the outcome of
an interplay between different actors, whose actions are determined by their environment
(Camagni, 1991; Crevoisier, 1998; Hudson, 1999).
Whereas Lundvall (1992) and Nelson (1993) concentrate their analysis on the nation state,
much more attention has been paid to the regional level since the mid-1990s which led to a
fairly high number of studies about regional innovation systems (e.g. Cooke and Morgan,
1998; Braczyk et al., 1998; Maskell et al., 1998). The authors transfer the systemic elements
of a national innovation system to the regional level. In short, they argue that region-specific
conditions and cooperation relationships between different actors influence the regional
innovation potential either positively or negatively. However, it would be wrong to interpret
regional innovation systems as being isolated from the national and/ or international context.
The national scale continues to be crucial in setting important framework conditions like laws
and investment (e.g. in research and education). The international scale gives important
impulses about potential markets and the development of new products; it also provides
knowledge from outside the region (Revilla Diez, 2000).
Recent studies about the spatial distribution of innovation activities show that metropolitan
regions have a high innovation potential (e.g. BMBF, 2000 for Germany; Brouwer et al.,
1999; Varga, 1998; Anselin et al., 1997 for the USA; Feldman and Audretsch, 1999).
These results underline that metropolitan regions offer favourable conditions for innovating
firms. Here, innovating firms find a qualified work force, capable cooperation partners in
business and research institutes (Suárez-Villa and Fischer, 1995; Howells, 1983; Ewers and
Wettmann, 1980). Furthermore, spatial, technological and institutional proximity and specific
resources are available that can generate significant externalities (Fischer et al., 2001). For
these reasons metropolitan regions can be interpreted as metropolitan innovation systems

8
which tend to be the driving forces in national and global innovation processes (Fischer et al.,
2001; Shefer and Frenkel, 1998).
However, the importance of ‘simple physical’ or geographical proximity for interactive
learning processes, which is at the heart of the concepts of regional and metropolitan systems
of innovation, has been questioned. There is no doubt about the benefits of being co-located
for organizing face-to-face contacts and frequent interaction, but relational or organizational
proximity are supposed to be even more important, allowing for easy knowledge transfer via
modern telecommunication even over wide distances (e.g. Amin, 2000: 14; Gertler, 1995:
pp.4). However, “the idea that organizational or relational proximity is sufficient to transcend
the effects of distance (even when assisted by telecommunications and frequent travel) seems
improbable” (Gertler, 2001: 19). Furthermore, even MNCs are still strongly influenced by
national and to a certain degree regional conditions. At the one hand, they “forever bear the
markings or imprints of their national origin” (ibid.: 14) but at the same time their practices
are strongly shaped by the national institutions of their host regions. Additionally, Gertler
recognises the possible impact by regional factors (e.g. industrial relations regimes, education
and training systems), which have received “surprisingly little attention thus far” (ibid: 21).
Therefore, a multi-scale approach which takes into account different spatial and non-spatial
systems of innovation and their intertwining seems necessary (e.g. Bunnell and Coe, 2001;
Revilla Diez and Kiese, 2004).
To sum up, the quality of an RIS or MIS depends on the quality and quantity of actors and the
linkages between them. Furthermore, the regional knowledge base is the result of an
evolutionary, cumulative process of learning. In this process it is important to secure a steady
inflow of outside knowledge resources, either by attracting new actors from outside into the
region or by having local actors with the capability to tap into outside knowledge (Cantwell
and Iammarino, 2003). In both mechanisms MNC play a crucial role, because they can be
9
attracted to a region and they sustain strong links to the outside world. Cantwell and
Immarino see them therefore as “the key ring of the chain from global to local” (2003:18).
MNCs, on the other hand, use the different national and regional competencies specifically
and strategically – e.g. by supplier-client-relationships, research and development co-
operations, the recruitment of labour and special producer-client relationships (lead
customers), as was elaborated by various contributions to the debate on regional and national
innovation systems (Braczyk et al., 1998; Edquist, 1997; Lundvall, 1992; Nelson, 1993). It
can be assumed that the strengths of MNCs derive from the possibility to learn in different
regional contexts (see Ivarsson, 2002). However, since different national/ regional
institutional settings shape MNCs practices and the processes in which new knowledge is
created, combining the knowledge from different locations is just as challenging as the
transfer of good practice even for “global firms with deep resources” (Gertler, 2001: 19).
Building on these theoretical reflections the aim of the paper is to investigate the following
key questions:
• The traditional spatial pattern of R&D activity suggests that MNCs would perform
much more R&D in Europe than in South-East Asia. Is this picture still valid for
successful latecomers like Singapore vis-à-vis European Metropolitan Regions?
• Is there evidence to support the hypothesis that MNCs in Europe tend to be more
involved in home-base-augmentation while MNC in South East Asia are more
orientated towards home-base-exploitation?
Data/ Methodology
Since the 1970's numerous innovation and network studies have been conducted on a national
and regional scale. However, a basic problem is their lack of comparability. The European
Regional Innovation Survey (ERIS) was a comprehensive and integrated attempt to overcome

10
this shortcoming. Using written questionnaires, the most important actors in eleven regional
innovation systems across Europe were surveyed, namely manufacturing firms, producer
services and research institutions, in order to analyse their innovative and networking
activities. Basically the same actor-specific questionnaires were used in all the regions
surveyed, guaranteeing a high degree of comparability (Fritsch et al., 1998).
When designing the questionnaires for the postal surveys in Singapore, Penang and Thailand,
the core elements of the ERIS questionnaires were retained. It includes information about firm
characteristics (age, size in terms of turnover, capital stock, and employees, sector, ownership
etc.), innovation activities (R&D personnel and expenditure, patents, new products etc.) and
innovation co-operation (with customers, suppliers, parent companies, universities etc.).
This paper focuses on the results from the six metropolitan regions Barcelona, Stockholm and
Vienna in Europe and Bangkok, Penang and Singapore in South-East Asia1. The regions are
defined in a functional perspective. In addition to the city core area the industrial hinterland is
included. Table 1 gives an overview of the spatial extension of the metropolitan regions.
Table 1. Size of the six metropolitan case regions Metropolitan Region …encompassing: Stockholm Provinces of Stockholm, Uppsala, Södermanslands, Örebro and Vastmanlands Vienna City of Vienna and districts of Baden, Bruck an der Leitha, Gänserndorf,
Korneuburg, Mödling, Tulln and Vienna vicinity Barcelona Communities of Barcelona, Baix Llobregat, Valles Occidental, Valles Oriental and
Maresme. Singapore City of Singapore Penang State of Penang Bangkok Provinces of Bangkok, Nonthaburi, Pathum Thani, Nakhon Pathom, Samut Sakhon,
Samut Prakan, Ayutthaya, Chachoengsao, Chon Buri and Rayong.
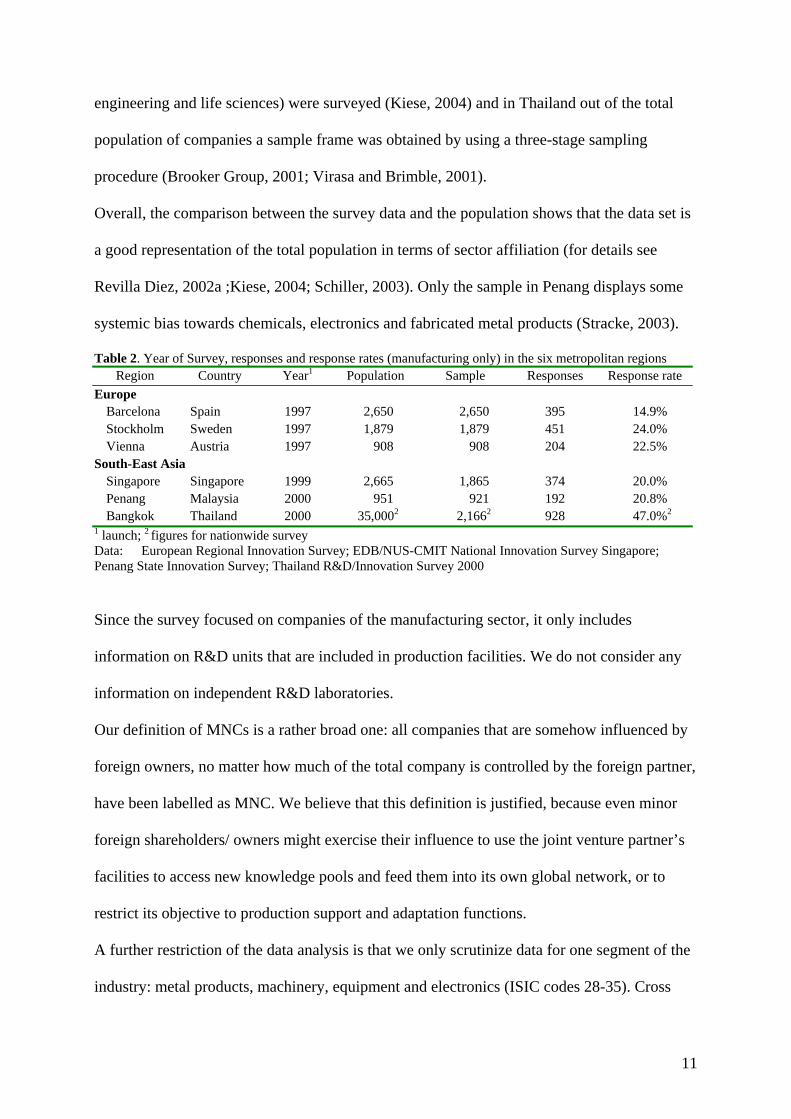
Table 2 gives an overview of the populations, sample sizes, response rates and year of the
surveys. While in Europe and Penang all sectors and all companies were included, in
Singapore only companies in the dominating industry clusters (electronics, chemicals,
1 For a comprehensive analysis of the three European regions see Fischer et al. (2001) and Revilla Diez (2002b; 2002c), for Singapore refer to Kiese (2004) and for Penang to Stracke (2003). Thailand related details can be found in Intarakumnerd et al. (2002). A general overview and comparison of the three South-East Asian surveys has recently been published by Kiese and Revilla Diez (2004).
11
engineering and life sciences) were surveyed (Kiese, 2004) and in Thailand out of the total
population of companies a sample frame was obtained by using a three-stage sampling
procedure (Brooker Group, 2001; Virasa and Brimble, 2001).
Overall, the comparison between the survey data and the population shows that the data set is
a good representation of the total population in terms of sector affiliation (for details see
Revilla Diez, 2002a ;Kiese, 2004; Schiller, 2003). Only the sample in Penang displays some
systemic bias towards chemicals, electronics and fabricated metal products (Stracke, 2003).
Table 2. Year of Survey, responses and response rates (manufacturing only) in the six metropolitan regions Region Country Year1 Population Sample Responses Response rate
Europe Barcelona Spain 1997 2,650 2,650 395 14.9% Stockholm Sweden 1997 1,879 1,879 451 24.0% Vienna Austria 1997 908 908 204 22.5%
South-East Asia Singapore Singapore 1999 2,665 1,865 374 20.0% Penang Malaysia 2000 951 921 192 20.8% Bangkok Thailand 2000 35,0002 2,1662 928 47.0%2
1 launch; 2 figures for nationwide survey Data: European Regional Innovation Survey; EDB/NUS-CMIT National Innovation Survey Singapore; Penang State Innovation Survey; Thailand R&D/Innovation Survey 2000
Since the survey focused on companies of the manufacturing sector, it only includes
information on R&D units that are included in production facilities. We do not consider any
information on independent R&D laboratories.
Our definition of MNCs is a rather broad one: all companies that are somehow influenced by
foreign owners, no matter how much of the total company is controlled by the foreign partner,
have been labelled as MNC. We believe that this definition is justified, because even minor
foreign shareholders/ owners might exercise their influence to use the joint venture partner’s
facilities to access new knowledge pools and feed them into its own global network, or to
restrict its objective to production support and adaptation functions.
A further restriction of the data analysis is that we only scrutinize data for one segment of the
industry: metal products, machinery, equipment and electronics (ISIC codes 28-35). Cross
12
country comparisons require this kind of limitation, because otherwise the results will be
distorted by the differences in the economic structure.
The Case Study Regions – some secondary indicators for characterising the National
Innovation Systems
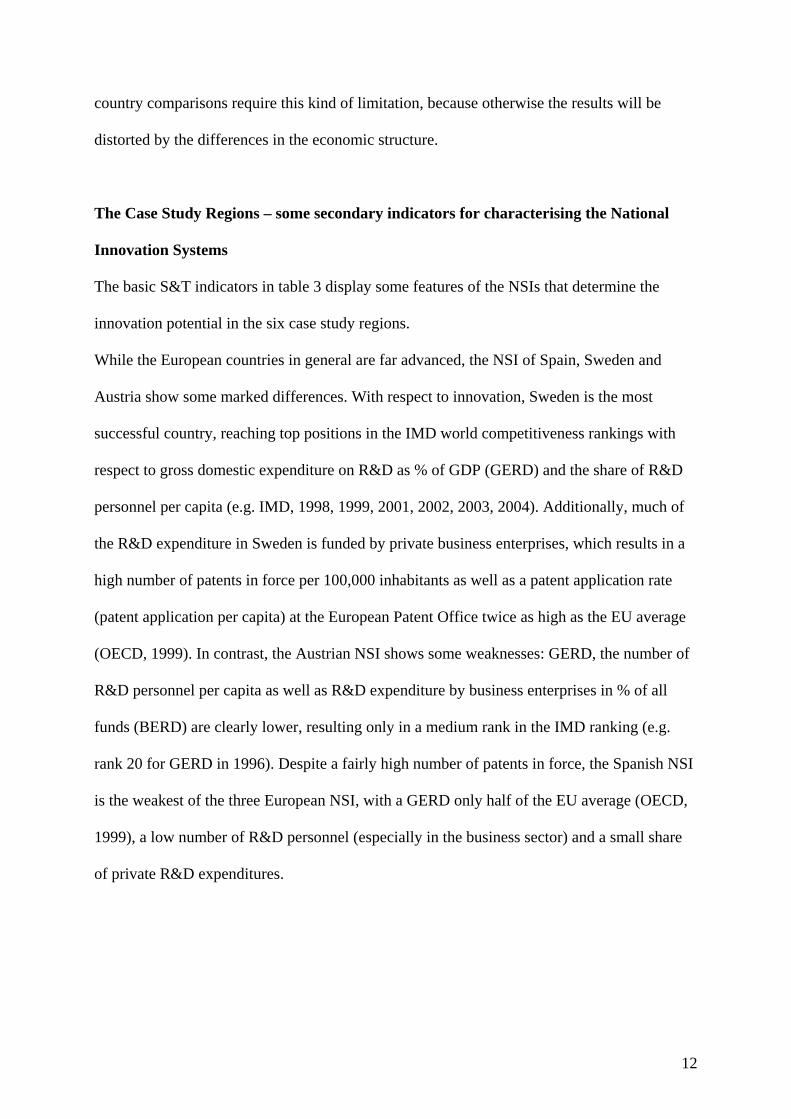
The basic S&T indicators in table 3 display some features of the NSIs that determine the
innovation potential in the six case study regions.
While the European countries in general are far advanced, the NSI of Spain, Sweden and
Austria show some marked differences. With respect to innovation, Sweden is the most
successful country, reaching top positions in the IMD world competitiveness rankings with
respect to gross domestic expenditure on R&D as % of GDP (GERD) and the share of R&D
personnel per capita (e.g. IMD, 1998, 1999, 2001, 2002, 2003, 2004). Additionally, much of
the R&D expenditure in Sweden is funded by private business enterprises, which results in a
high number of patents in force per 100,000 inhabitants as well as a patent application rate
(patent application per capita) at the European Patent Office twice as high as the EU average
(OECD, 1999). In contrast, the Austrian NSI shows some weaknesses: GERD, the number of
R&D personnel per capita as well as R&D expenditure by business enterprises in % of all
funds (BERD) are clearly lower, resulting only in a medium rank in the IMD ranking (e.g.
rank 20 for GERD in 1996). Despite a fairly high number of patents in force, the Spanish NSI
is the weakest of the three European NSI, with a GERD only half of the EU average (OECD,
1999), a low number of R&D personnel (especially in the business sector) and a small share
of private R&D expenditures.
13
Table 3. Overview of the key indicators of the National Systems of Innovation in the six case study countries: GERD, BERD, R&D personnel in total and in business, number of patents in force
Country GERD BERD Total R&D Personnel*
R&D Personnel in Business*
Number of Patents in Force§
1996 2002 1996 2002 1997 2002 1997 2002 1996 2001 Europe
Spain 0.84 0.962 48.6 52.42 2.26 3.122 0.79 1.152 391.7 251.6 Sweden 3.59 4.272 74.4 77.62 7.40 8.112 4.725 5.552 1,076.4 1,097.57 Austria 1.51 1.93 41.23 77.24 3.884 3.884 2.524 2.524 193.0 144.7
South-East Asia Singapore 1.37 2.15 63.3 61.4 3.23 5.24 2.12 2.75 368.4 704.2 Malaysia 0.201 0.71 72.81 65.6 0.21 0.52 0.11 0.26 28.66 2.3 Thailand 0.13 0.26 20.2 42.1 0.23 0.512 0.015 0.11 4.24 2.67
11997, 22001, 3 1993, 41998, 51995, 61994, 72000 Source: IMD, 1998, 1999, 2001, 2003, 2004 *in full time work equivalent per 1,000 people; § per 100,000 inhabitants
When these figures are compared with the data from South-East Asia, it is striking that
Singapore is doing quite well when it comes to allocating resources for R&D. GERD is
almost as high as in Austria. The number of R&D personnel per capita even ranks second of
the six regions considered, behind Sweden.
On the other hand, Malaysia and Thailand lag behind quite significantly, with a very low
GERD and R&D personnel intensity. Additionally, the number of patents in force is
significantly lower than in the other countries.
In conclusion, the European NSI are quite mature but show different levels of excellence.
Singapore has obviously managed to catch up in allocating resources to innovation processes.
The NSI in Malaysia and Thailand still lag behind markedly.
It can therefore be assumed that investment by MNCs in R&D facilities in Europe could be of
the HBA type, since the S&T environment conditions favour this kind of activity. At the same
time, not all the three European regions offer the same high quality standard, and therefore the
analysis of the micro-level data is needed to see if some differences between these regions can
be observed.
For the South-Asian regions, the secondary data for Singapore is in almost all aspects at the
same level as the figures for the European regions: can this positive evaluation be confirmed
by the micro level data? In contrast, the general data for Thailand and Malaysia look quite
14
gloomy: what is the situation like in the two national economic powerhouses of Bangkok and
Penang? Does the data give reason to believe that the agglomerations do better in innovative
terms than the country as a whole?
Innovation capabilities compared
The brief summary of available secondary data confirms the first assumption that R&D
activities are still stronger in EU than in South-East Asian countries. While Singapore has
managed to increase it innovation activities, Thailand and Malaysia commit far less resources
to innovation activities.
The summary of key innovation indicators in table 4 shows that there is still a major gap
between innovation activity in South-East Asian and European Metropolitan Regions. This
result supports the argument that most of the R&D is still performed in industrialized regions
of the triad. Furthermore, the data displays that Singapore and Penang are at a similar level,
clearly in an intermediate position between the European regions and the ‘laggard’ Bangkok.
Consequently, the picture of Singapore as an advanced country with respect to innovation,
that has been sketched by the secondary data, does not hold true for the micro-level survey
data. Obviously the secondary data is a snapshot, displaying the commitment towards the
development of a knowledge-intensive economy. The firm-level data on the other hand are
rather the result of a long-term development. And this development in Singapore just started
in the late 1980s (Kiese, 2004) and is still characterised by a strong focus on applied research.
The same is true for Penang, where the main objective of the companies is seen in the
assembly of components with hardly any tasks in earlier (design/ R&D) or later (marketing)
tasks along the value chain (Stracke, 2003).
15
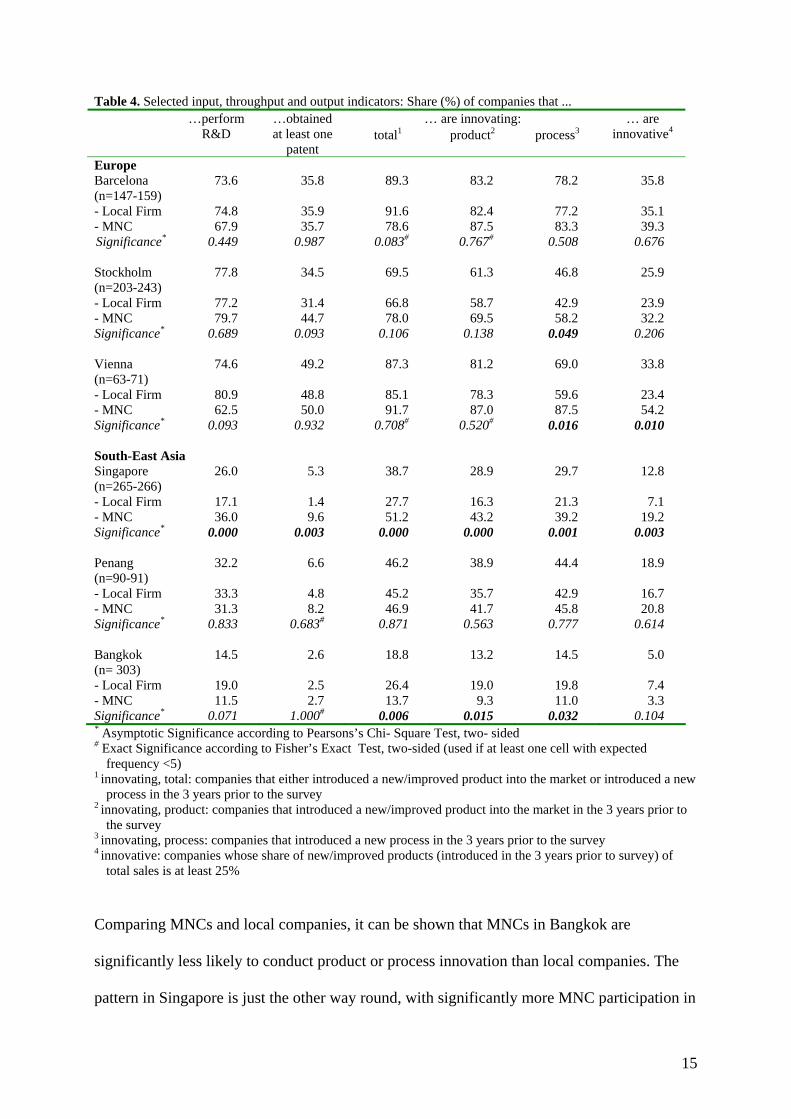
Table 4. Selected input, throughput and output indicators: Share (%) of companies that ... … are innovating: …perform
R&D …obtained at least one
patent total1 product2 process3
… are innovative4
Europe Barcelona (n=147-159)
73.6 35.8 89.3 83.2 78.2 35.8
- Local Firm 74.8 35.9 91.6 82.4 77.2 35.1 - MNC 67.9 35.7 78.6 87.5 83.3 39.3 Significance* 0.449 0.987 0.083# 0.767# 0.508 0.676 Stockholm (n=203-243)
77.8 34.5 69.5 61.3 46.8 25.9
- Local Firm 77.2 31.4 66.8 58.7 42.9 23.9 - MNC 79.7 44.7 78.0 69.5 58.2 32.2 Significance* 0.689 0.093 0.106 0.138 0.049 0.206 Vienna (n=63-71)
74.6 49.2 87.3 81.2 69.0 33.8
- Local Firm 80.9 48.8 85.1 78.3 59.6 23.4 - MNC 62.5 50.0 91.7 87.0 87.5 54.2 Significance* 0.093 0.932 0.708# 0.520# 0.016 0.010 South-East Asia Singapore (n=265-266)
26.0 5.3 38.7 28.9 29.7 12.8
- Local Firm 17.1 1.4 27.7 16.3 21.3 7.1 - MNC 36.0 9.6 51.2 43.2 39.2 19.2 Significance* 0.000 0.003 0.000 0.000 0.001 0.003 Penang (n=90-91)
32.2 6.6 46.2 38.9 44.4 18.9
- Local Firm 33.3 4.8 45.2 35.7 42.9 16.7 - MNC 31.3 8.2 46.9 41.7 45.8 20.8 Significance* 0.833 0.683# 0.871 0.563 0.777 0.614 Bangkok (n= 303)
14.5 2.6 18.8 13.2 14.5 5.0
- Local Firm 19.0 2.5 26.4 19.0 19.8 7.4 - MNC 11.5 2.7 13.7 9.3 11.0 3.3 Significance* 0.071 1.000# 0.006 0.015 0.032 0.104 * Asymptotic Significance according to Pearsons’s Chi- Square Test, two- sided # Exact Significance according to Fisher’s Exact Test, two-sided (used if at least one cell with expected
frequency <5) 1 innovating, total: companies that either introduced a new/improved product into the market or introduced a new
process in the 3 years prior to the survey 2 innovating, product: companies that introduced a new/improved product into the market in the 3 years prior to
the survey 3 innovating, process: companies that introduced a new process in the 3 years prior to the survey 4 innovative: companies whose share of new/improved products (introduced in the 3 years prior to survey) of
total sales is at least 25%
Comparing MNCs and local companies, it can be shown that MNCs in Bangkok are
significantly less likely to conduct product or process innovation than local companies. The
pattern in Singapore is just the other way round, with significantly more MNC participation in

16
all available innovation indicators. In Penang the difference is less striking, but here the
results also show some higher activity by MNCs than by local companies.
In the European regions the differences between local and multinational firms are quite small.
Both types of companies are engaged more strongly in product than in process innovation.
The high percentage of companies (also MNCs) that obtained a patent could be an indication
of the more HBA orientated activity in Europe compared with South-East Asia, since it can be
assumed that the accumulation of new knowledge feeds into the development of patentable
designs, products or processes. HBE-supporting activities, like the technical back-up of
production processes or the local adaptation of products might, on the other hand, not be
protected by patents. Furthermore, the Asian-based companies show a clear tendency rather to
conduct process than product innovations (the only exception are MNCs in Singapore), while
in Europe companies perform more product innovations. This result points towards a certain
division of labour as proclaimed by the notion of the ‘new division of labour’ (see e.g Fröbel
et al., 1980): Asian companies seem to be more concerned with efficiency-enhancing process
improvements that increase productivity and reduce costs. This indicates that their
competitive advantage/ core competence seems to lie in the cost efficient production of goods,
and not in the development of the product design. The latter is mostly brought in from Triad
countries. Typical firm strategies would be the OEM (Original Equipment Manufacturing;
(Hobday, 1995, 2000) led growth or other more process-oriented specialisations (e.g. see
Wong, 1999): between 65-70% of the firms in Bangkok, Penang and Singapore are either
OEM or manufacturing arm companies, which manufacture products according to design
specifications provided either by external customers or parent companies (Revilla Diez and
Berger, 2004).
17
On the other hand, European-based companies are as, or even more, likely than their Asian
counterparts to improve existing process technology, but they are even more active in
developing new products. Of course, process improvements are important for the
competitiveness of a company, but new products are essential for the future competitiveness
and market position of the company. And these investments in the future are obviously made
more often in European regions, which can be explained by the proximity to demanding lead
markets, offering easy access to market intelligence, specialised services and all important
user-producer linkages, as well as to a pool of highly qualified human capital and excellent
centers of basic and applied research (Wong, 1999; Hobday, 2000; Fischer et al., 2001).
In order to investigate the commitment to innovation activities of the companies in Europe
and South-East Asia, tables 5 and 6 as well as figure 1 show the resource input into the R&D
process by multinational and local companies. We therefore have grouped the companies
according to their R&D expenditure per sales. This is a common approach for distinguishing
different technology intensive industries. BMBF (2000) classifies three groups: low
technology (less than 3.5% R&D expenditure/ sales), medium technology (3.5 – 8.5%) and
high technology industries (> 8.5%). Due to different class-sizes, these classifications could
only approximately be resembled.
In R&D expenditure/ sales as well as R&D personnel/ employees local companies assign
significantly more resources to the R&D process for the total sample. Comparing the Asian
with the European Metropolitan Regions it can be shown that MNCs in Europe devote more
and MNCs in South-East Asia commit less resources to R&D than local companies.2
2 One has to take into account a possible influence of the 1997 Asian financial crisis on the R&D expenditure by companies. While GERD in Singapore did not decrease, there are contradictory data for Thailand and in Malaysia GERD already decreased in 1996 (IMD, 1998, 1999; Mani, 2004; NSTDA, 1999; UNESCO, 2004), therefore private R&D expenditure might be lower than before the crisis. However, the structural pattern is very unlikely to be distorted and the additional presented data is more persistent and underlines the sketched picture. Rather, we agree with Intarakumnerd et al., 2002 that the severeness of the Asian crisis in Thailand is a result of the poorly developed innovation system (see conclusion).

18
Even Singapore-based companies display a higher resemblance with MNCs in Penang and
Bangkok than with MNCs in the European regions: about 63% of the MNCs invest less than
3% of sales in R&D, and the pattern of local companies having a higher R&D personnel
intensity than MNCs holds true for Singapore as well. Nevertheless, the total share of R&D
personnel in Singapore is clearly higher than in the other Asian regions, reaching levels
similar to or even higher than in Europe. Within Europe, Stockholm is conspicuously different
from Barcelona and Vienna. A large share of MNC in Stockholm is found in the high
technology or medium technology sector, while MNCs in Vienna and Barcelona are most
frequently in the medium technology industry, and hardly reaching high technology levels. In
these regions local firms dominate the high technology sector.
This pattern is also reflected by the R&D personnel intensity, which is fairly high for
Stockholm based MNCs and clearly lower for MNCs in Barcelona and Vienna; in Barcelona
the average of MNCs is even below the average of local companies.
Table 5. R&D expenditure per sales and share of R&D personnel of total workforce of local and multinational companies in Europe and South-East Asia Total Europe South-East Asia R&D expenditure per sales Local Firm
(n=330) MNC
(n=222) Local Firm
(n=240) MNC (n=79)
Local Firm (n=90)
MNC (n=132)
< 3% 46.4% 62.2% 34.6% 20.3% 77.8% 85.3% 3-9.9% 31.8% 28.4% 39.6% 57.0% 11.1% 12.6% >= 10% 21.8% 9.5% 25.8% 22.8% 11.1% 2.1% Significance * 0.000 0.016 0.014 R&D personnel/ employees (%) Local Firm
(n=424) MNC
(n=296) Local Firm
(n=305) MNC (n=97)
Local Firm (n=119)
MNC (n=199)
Mean 7.43% 4.40% 8.60% 10.46% 4.45% 1.44% Significance+ 0.000 0.256 0.002 * Pearsons’s Chi-Square Test, + t-Test Table 6. Average of R&D personnel/employees (%) of local and multinational companies in the six Metropolitan regions
Local Firm MNC Europe
Barcelona 7.69 6.22 Stockholm 9.81 13.22 Vienna 6.94 8.77
South-East Asia Singapore 12.49 6.00 Penang 4.97 2.14 Bangkok 2.36 0.06

19
Figure 1. R&D expenditure per sales of local and multinational companies in the six Metropolitan regions
0%
10%
20%
30%
40%
50%
60%
70%
80%
90%
100%
Local MNC Local MNC Local MNC Local MNC Local MNC Local MNC
Bangkok Penang Singapore Vienna Barcelona Stockholm
>= 10% 3- 9.9% < 3%
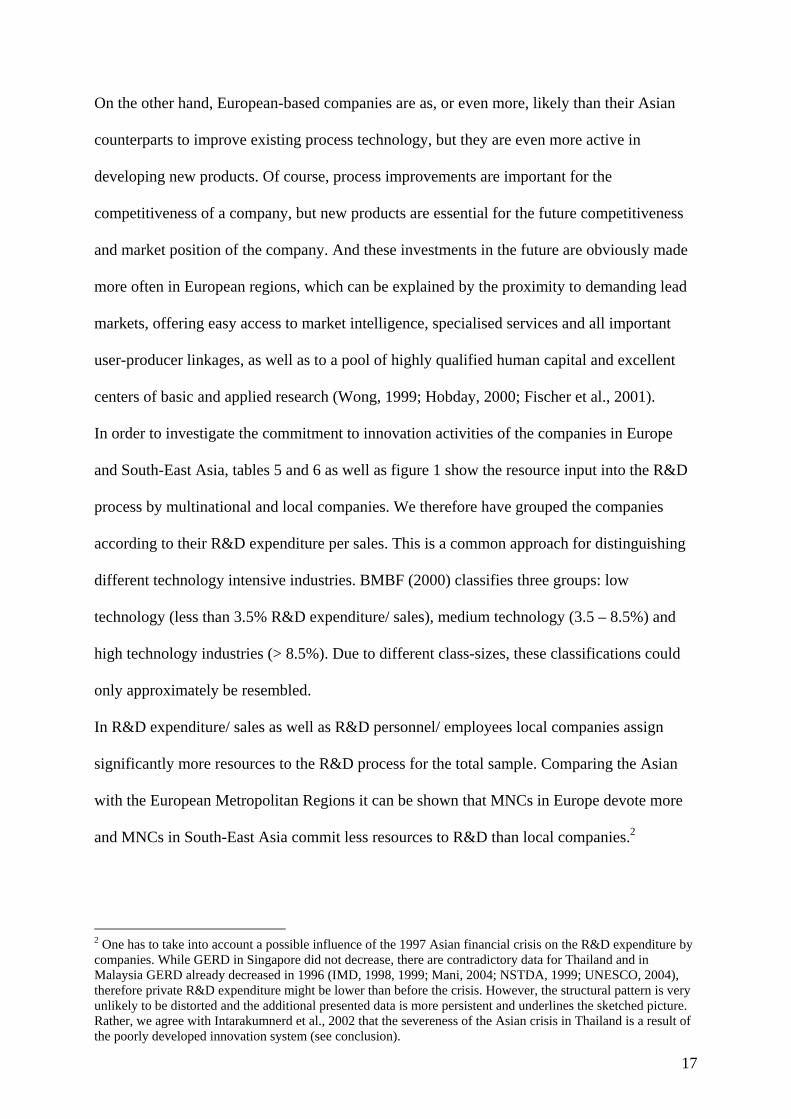
Asked to evaluate the availability of qualified personnel more generally in their host region, a
higher share of companies in Europe were satisfied with the human capital (see table 7). Even
though there are no significant differences between MNC and local firms in the regions (Chi-
Square Test), a certain pattern evolves: MNCs in South-East Asia less frequently evaluate the
availability positively than local companies, while in Europe it is just the other way round,
indicating that this might be one reason why MNCs set up facilities in these regions. The quite
negative evaluation in Stockholm could be an indication of a lack of suitable manpower in the
scientific as well as business sector due to a very high demand (as indicated by the high share
of R&D personnel/ employees in MNCs) in this thriving region. Presumably this shows
agglomerative disadvantages that are not yet experienced in the other European regions. In
Bangkok and presumably Penang it is rather a lack of human capital caused by insufficient
numbers of qualified people, especially in science and engineering, that causes the
dissatisfaction: in 1998 in Thailand 18% of graduates were from S&E courses (Alpha
Research, 2003; cf. Intarakumnerd, 2004), compared with 35% in Singapore (Ministry of
Education Singapore, 2004), 22% in Spain, 23% in Austria and 51% in Sweden (EC, 2002;).
20
Table 7. Share of companies that assessed the availability of manpower as good or very good Availability of suitable manpower in
scientific- technical sector Availability of suitable manpower in
business sector Local Firm MNC Local Firm MNC
Europe Barcelona 52.4 69.6 46.0 57.1 Stockholm 25.0 25.0 17.0 25.0 Vienna 33.3 57.9 43.9 57.9
South-East Asia Singapore 24.1 22.4 27.7 23.2 Penang 19.0 10.2 21.4 18.4 Bangkok 20.7 15.4 20.7 17.6
Cooperation Pattern
In this section we will examine how the companies that actually perform either product or
process innovations differ with respect to their cooperation behaviour with external partners
(see table 8).
The data depicted in table 8 leads to the following conclusions:
First, obviously cooperation is a key feature of innovating companies in all six regions. In all
regions a high and similar share of innovating companies cooperate with external partners in
their innovation activities. Furthermore, all regions exhibit a similar ranking of cooperation
partners: customers are the most frequent cooperation partner followed by suppliers and
service providers. This pattern has already been observed in all eleven regions of the ERIS-
project (see Sternberg, 2000). Vertical linkages to suppliers and customers are more important
in the innovation process of companies than horizontal linkages to service providers or
research institutes, thus confirming Lundvall’s (1985) findings. This is also valid for firms in
South-East Asia.

21
Table 8. Share (%) of all innovating companies that collaborate (at any intensity) with the following external partners
Region Any Partner
Customer Supplier Business Service Provider
Technical Service Provider
Research Institution/ University
Other company/
Competitor
Europe Barcelona (n=142)
92.3 67.6 56.3 31.0 55.6 22.5 22.5
- Local Firm 91.7 66.7 51.7 30.0 54.2 19.2 19.2 - MNC 95.5 72.7 81.8 36.4 63.6 40.9 40.9 Significance* 1.000# 0.577 0.009 0.553 0.411 0.048# 0.048# Stockholm (n=169)
89.9 75.1 39.1 32.5 38.5 36.7 18.9
- Local Firm 87.8 70.7 38.2 29.3 31.7 30.1 20.3 - MNC 95.7 87.0 41.3 41.3 56.5 54.3 15.2 Significance* 0.160# 0.030 0.714 0.137 0.003 0.004 0.451 Vienna (n=62)
88.7 53.2 33.9 40.3 40.3 32.3 19.4
- Local Firm 82.5 45.0 25.0 32.5 32.5 27.5 20.0 - MNC 100.0 68.2 50.0 54.5 54.5 40.9 18.2 Significance* 0.044# 0.080 0.047 0.090 0.090 0.280 1.000# South-East Asia Singapore (n=103)
98.1 94.2 85.4 56.3 73.8 70.9 51.5
- Local Firm 97.4 97.4 82.1 51.3 66.7 53.8 56.4 - MNC 98.4 92.2 87.5 59.4 78.1 81.3 48.4 Significance* 1.000# 0.404# 0.447 0.422 0.200 0.003 0.432 Penang (n=42)
97.6 97.6 90.5 73.8 81.0 61.9 76.2
- Local Firm 100.0 100.0 84.2 73.7 84.2 52.6 73.7 - MNC 95.7 95.7 95.7 73.9 78.3 69.6 78.3 Significance* 1.000# 1.000# 0.313# 1.000# 0.709# 0.261 1.000# Bangkok (n= 57)
71.9 70.2 59.6 33.3 47.4 42.1 49.1
- Local Firm 75.0 71.9 59.4 28.1 43.8 50.0 53.1 - MNC 68.0 68.0 60.0 40.0 52.0 32.0 44.0 Significance* 0.559 0.751 0.962 0.345 0.536 0.172 0.494 * Asymptotic Significance according to Pearsons’s Chi- Square Test, two- sided # Exact Significance according to Fisher’s Exact Test, two-sided (used if at least one cell with expected frequency <5)
Second, more innovating companies in Penang, Singapore and partly in Bangkok cooperate
with external partners than companies in Europe, which might be caused by a lack of in-house
innovation resources in terms of funds and personnel (e.g. see table 5 and 6) as well as
‘expertise’, because many latecomer-firms are still rather inexperienced when it comes to

22
innovation activities. This is clearly the case in Thailand (see Arnold et al., 2000; Brimble,
2003 and Intarakumnerd et al., 2002) and it is also still valid for Malaysia, although at a
different level (Ariffin and Figueiredo, 2002; Hobday, 1999 and Rasiah, 2003). In Singapore,
there is a recent trend of major upgrading in R&D capabilities, especially by MNCs (Wong,
1998, 2003), which is displayed by fairly high R&D intensity in terms of personnel. However,
there is still a significant gap in terms of R&D expenditure between European and
Singaporean firms (ca. 63% of both local and foreign firms spend less than 3% of sales for
R&D, compared to 12-28% of firms in Europe). Additionally, firms size (measured in
employees) in South-East Asia tends to be larger than in Europe. Since empirical studies
found that size and propensity towards co-operation correlates (e.g. Colombo, 1995; Munier,
2004 (forthcoming); Kiese, 2004), this would partly explain the pattern, even though the
innovation indicators are too different between Asia and Europe to solely rely on this
explanation.
A second explanation for the larger share of co-operating companies in South-East Asia can
be found in the higher degree of external control over local and multinational companies alike
(Kiese and Revilla Diez, 2004), either directly by the parent company or through hierarchies
within global production networks (Henderson et al., 2002; Ernst, 2002).
Third, there is a tendency that more local firms than MNCs cooperate with customers in
South-East Asia, while in Europe it is just the other way round. This supports the observation
that more Europe-based MNCs are product innovators, which requires close collaboration
with possible customers, while MNCs in South-East Asia are more concerned with process
innovations. Nevertheless, the share of South-East Asia based MNCs that cooperate with
customers is remarkably high, indicating that the MNC-headquarters’ objective even for their
Asian affiliates follows a Local-for-Local or even Local-for-Global strategy. The first
describes a strategy where the MNC subsidiary develops products for important markets

23
locally, while the latter depicts local development activities for the global market.
Traditionally, MNC have used a Centre for Global strategy, where R&D was concentrated at
the home base of the company (Ghoshal and Barlett, 1990).
Fourth, apart from Bangkok, in all other regions MNCs use the possibility to cooperate with
research institutes or universities more frequently than local companies. This is significant at
the 5%-level for Singapore, Barcelona and Stockholm. Assuming that the objective of these
linkages is to enhance the knowledge base of the MNC, our conclusion is that a high share of
collaboration with these kinds of institutions is an indicator of a high share of HBA-type
MNC affiliates. On the other hand, we lack information on the type and intensity of the
knowledge transfer taking place in these networks, and therefore can only suppose that
Europe- and to a certain extent Singapore- based MNC affiliates try to tap into pools of
localized, new knowledge, while certainly in Bangkok, and presumably in Penang, the quality
of the local S&T infrastructure is not sufficient to attract much MNC involvement.
The overall spatial distribution of cooperation partners (see figure 2 for any partner and figure
3 for universities and R&D institutes) shows that MNCs in Penang and Singapore are much
more outward-looking than MNCs in the European metropolitan regions. In Penang as well as
in Singapore, partners in the rest of the world are frequently sought by the surveyed MNCs,
while in Europe the region and the nation (Stockholm) or the region and the EU (Barcelona)
are the source of most of the cooperation partners. Only MNCs in Vienna cooperate as often
regionally as globally.
The spatial pattern can be explained by a) the importance of customers and suppliers in
demanding lead markets for co-operation in product or process development, b) the quality
and quantity of suitable cooperation partners which is clearly higher in the European
innovation systems due to the maturity of the systems and the ‘traditional’ international
24
division of labour/ research, which is also connected to c) intra-firm or intra-global production
network-hierarchies, where production sites in South East Asia might not have the autonomy
to organise their own external cooperation-relation, but are rather dependent on the Europe,
North America or Japan based headquarters or ‘network flagships’ (Ernst, 2002).
The above described pattern is even more striking when it comes to cooperation with
universities or R&D institutes: MNC affiliates in Europe hardly ever cooperate directly with
institutions outside Europe. Most contacts in Europe are restricted to the region, which is a
sign of the strength of the Metropolitan Innovation systems which offer enough cooperation
opportunities to meet the demand of the MNCs. Only the MIS in Vienna seems to be fairly
weak, being more attractive for local companies than for multinationals. On the other hand,
MNCs in Penang cooperate as often globally as they cooperate regionally, while in Singapore
the S&T infrastructure seems to be fairly conducive to cooperation-seeking MNCs.
Nevertheless, MNCs in Singapore do not rely on regional contact solely, but have a very
strong focus on institutions in the rest of the world as well.
The strong regional focus of MNC affiliates in Europe is therefore an indicator of the attempt
to tap into localized knowledge in order to augment the companies’ knowledge base and to
feed this knowledge into intra-firm networks.

25
Figure 2. Spatial Distribution of cooperation partners: Any partner
N.B. No spatial information for Thailand has been gathered. In Singapore the data for the national and regional level is the same.
0
10
20
30
40
50
60
Regi on
Nat i on
ASEAN/ EU
Wor l d
V ienna
0
10
20
30
40
50
60
Regi on
Nat i on
ASEAN/ EU
Wor l d
Barcelona
0
10
20
30
40
50
60
Regi on
Nat i on
ASEAN/ EU
Wor l d
St ockholm
0
10
20
30
40
50
60
Regi on
Nat i on
ASEAN/ EU
Wor l d
Singapore
0
10
20
30
40
50
60Region
Nation
ASEAN/ EU
Worldlocal MNC
Penang

26
Figure. 3 Spatial Distribution of cooperation partners: Universities and R&D institutes
N.B. No spatial information for Thailand has been gathered. In Singapore the data for the national and regional level is the same.
0
10
20
30
40
Regi on
Nat i on
ASEAN/ EU
Wor l d
V ienna
0
10
20
30
40
Regi on
Nat i on
ASEAN/ EU
Wor l d
Barcelona
0
10
20
30
40
Regi on
Nat i on
ASEAN/ EU
Wor l d
St ockholm
0
10
20
30
40
Regi on
Nat i on
ASEAN/ EU
Wor l d
Singapore
0
10
20
30
40Region
Nation
ASEAN/ EU
Worldlocal MNC
Penang
27
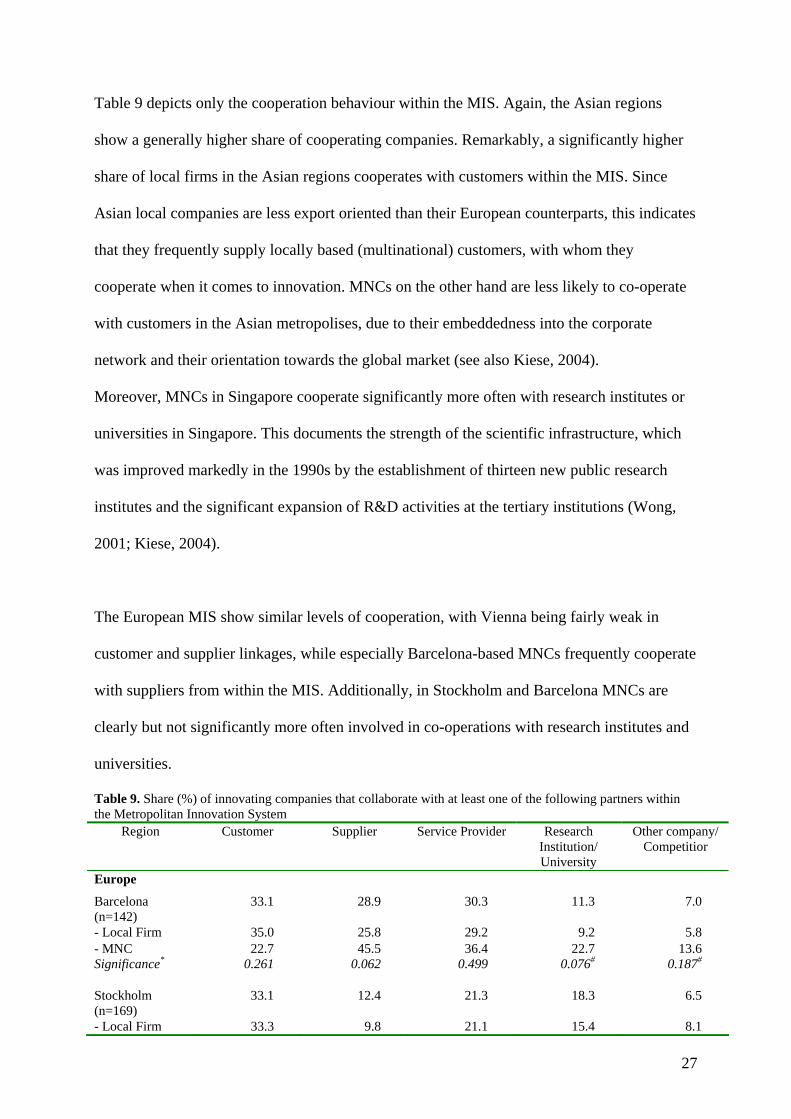
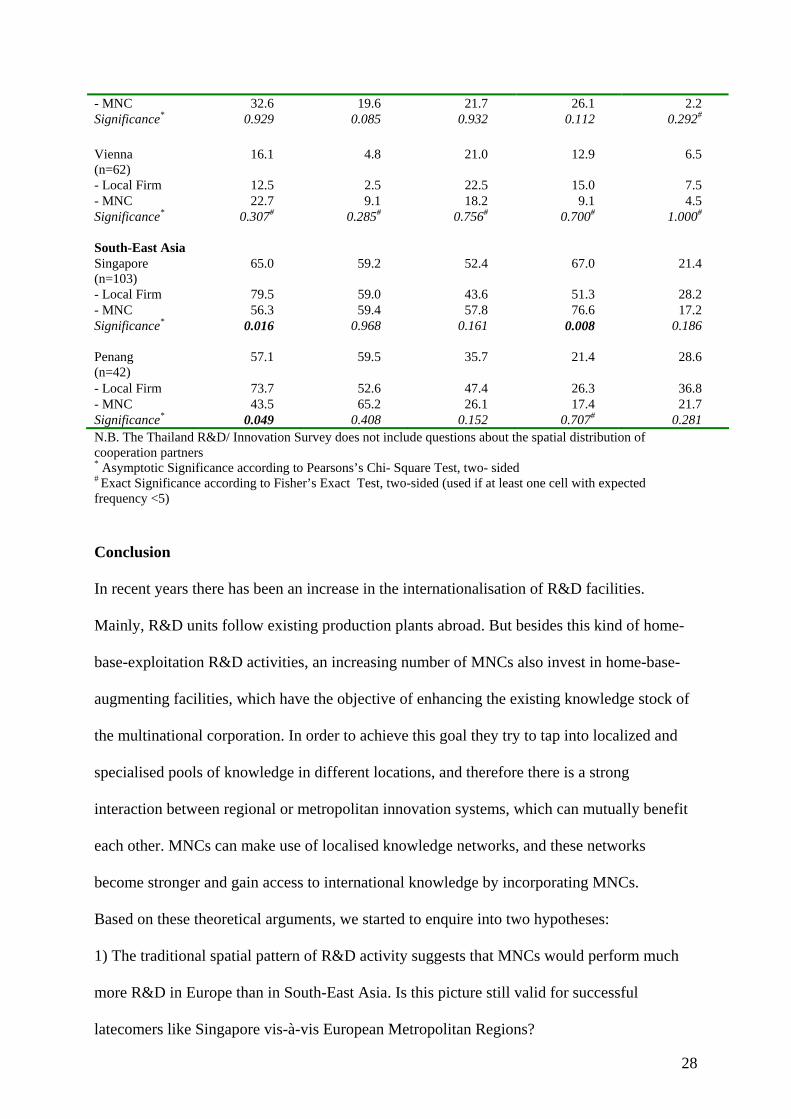
Table 9 depicts only the cooperation behaviour within the MIS. Again, the Asian regions
show a generally higher share of cooperating companies. Remarkably, a significantly higher
share of local firms in the Asian regions cooperates with customers within the MIS. Since
Asian local companies are less export oriented than their European counterparts, this indicates
that they frequently supply locally based (multinational) customers, with whom they
cooperate when it comes to innovation. MNCs on the other hand are less likely to co-operate
with customers in the Asian metropolises, due to their embeddedness into the corporate
network and their orientation towards the global market (see also Kiese, 2004).
Moreover, MNCs in Singapore cooperate significantly more often with research institutes or
universities in Singapore. This documents the strength of the scientific infrastructure, which
was improved markedly in the 1990s by the establishment of thirteen new public research
institutes and the significant expansion of R&D activities at the tertiary institutions (Wong,
2001; Kiese, 2004).
The European MIS show similar levels of cooperation, with Vienna being fairly weak in
customer and supplier linkages, while especially Barcelona-based MNCs frequently cooperate
with suppliers from within the MIS. Additionally, in Stockholm and Barcelona MNCs are
clearly but not significantly more often involved in co-operations with research institutes and
universities.
Table 9. Share (%) of innovating companies that collaborate with at least one of the following partners within the Metropolitan Innovation System
Region Customer Supplier Service Provider Research Institution/ University
Other company/ Competitior
Europe
Barcelona (n=142)
33.1 28.9 30.3 11.3 7.0
- Local Firm 35.0 25.8 29.2 9.2 5.8 - MNC 22.7 45.5 36.4 22.7 13.6 Significance* 0.261 0.062 0.499 0.076# 0.187# Stockholm (n=169)
33.1 12.4 21.3 18.3 6.5
- Local Firm 33.3 9.8 21.1 15.4 8.1
28
- MNC 32.6 19.6 21.7 26.1 2.2 Significance* 0.929 0.085 0.932 0.112 0.292# Vienna (n=62)
16.1 4.8 21.0 12.9 6.5
- Local Firm 12.5 2.5 22.5 15.0 7.5 - MNC 22.7 9.1 18.2 9.1 4.5 Significance* 0.307# 0.285# 0.756# 0.700# 1.000# South-East Asia Singapore (n=103)
65.0 59.2 52.4 67.0 21.4
- Local Firm 79.5 59.0 43.6 51.3 28.2 - MNC 56.3 59.4 57.8 76.6 17.2 Significance* 0.016 0.968 0.161 0.008 0.186 Penang (n=42)
57.1 59.5 35.7 21.4 28.6
- Local Firm 73.7 52.6 47.4 26.3 36.8 - MNC 43.5 65.2 26.1 17.4 21.7 Significance* 0.049 0.408 0.152 0.707# 0.281 N.B. The Thailand R&D/ Innovation Survey does not include questions about the spatial distribution of cooperation partners * Asymptotic Significance according to Pearsons’s Chi- Square Test, two- sided # Exact Significance according to Fisher’s Exact Test, two-sided (used if at least one cell with expected frequency <5)
Conclusion
In recent years there has been an increase in the internationalisation of R&D facilities.
Mainly, R&D units follow existing production plants abroad. But besides this kind of home-
base-exploitation R&D activities, an increasing number of MNCs also invest in home-base-
augmenting facilities, which have the objective of enhancing the existing knowledge stock of
the multinational corporation. In order to achieve this goal they try to tap into localized and
specialised pools of knowledge in different locations, and therefore there is a strong
interaction between regional or metropolitan innovation systems, which can mutually benefit
each other. MNCs can make use of localised knowledge networks, and these networks
become stronger and gain access to international knowledge by incorporating MNCs.
Based on these theoretical arguments, we started to enquire into two hypotheses:
1) The traditional spatial pattern of R&D activity suggests that MNCs would perform much
more R&D in Europe than in South-East Asia. Is this picture still valid for successful
latecomers like Singapore vis-à-vis European Metropolitan Regions?

29
There is overwhelming evidence that the majority of innovation activity in the six case
regions is still being performed in Europe. Despite favourable secondary data for Singapore,
the analysis of the micro-level data pointed towards a considerable gap between the
innovation potential and performance in Singapore and the European regions. While Penang
is doing fairly well, and clearly better than the nationwide secondary statistics indicated,
Bangkok is lagging significantly behind, as is Thailand as a whole. For the Thai case, it might
be even argued, that the mismatch between the development level of the economic structure
and the NIS contributed significantly to the 1997 Asian crisis, in which the Thai economy
“slumped more seriously” and “the economic recovery has been much slower” than in the east
Asian NIEs (Intarakumnerd et al., 2002: pp. 1452).
2) Is there evidence to support the hypothesis that MNCs in Europe tend to be more involved
in HBA, while MNC in South East Asia are more orientated towards HBE?
To sum up the evidence in favour of this hypothesis: MNCs in Europe are more orientated
towards product innovation, while MNCs in South-East Asia are more likely to conduct
process innovations. MNCs in Europe devote significantly more resources in terms of R&D
expenditure and personnel to their innovation activities than local companies. The picture in
South-East Asia is just the opposite. Even though Kuemmerle (1999: 9) concluded that “HBA
and HBE FDI in R&D require similar resource commitments”, we see the difference in the
commitment to the innovation process as an indication of different types of R&D units.
Additional support for this assessment is provided by the spatial distribution of cooperation
partners: innovating MNC affiliates in Europe cooperate more often with regional partners
and less often directly with partners in the rest of the world. On the other hand, MNC
subsidiaries in Singapore and Penang are much more outward looking, indicating structural
weaknesses in the Metropolitan Innovation System that have to be overcome by international
contacts. Especially, MNCs in Europe are more likely to cooperate with universities and R&D
institutes within their host region. This is true of MNCs in Singapore as well, but again, the

30
global orientation in Singapore is much stronger, giving evidence of an insufficient S&T
infrastructure as well as a stronger hierarchical dependence in Singapore. The same can be
observed in Penang. Together with the assessment of the availability of suitable human
capital, this points towards more HBA orientated R&D activities in Europe, and this is in line
with Kuemmerle’s findings that “a firm’s propensity to invest in HBA R&D activities abroad
rises with the relative commitment to R&D of private and public entities in the target country,
as well as with the quality of the human resource pool and with the level of scientific
achievement in relevant sciences” (ibid.: 18). Therefore it also indicates a higher HBA-focus
of MNC affiliates in Europe.
What are the political implications of these findings? The regions in South East Asia have to
further develop their MIS if they want to maintain their international competitiveness and
their position in the global production networks of MNCs vis-à-vis strong competition from
other newly industrialising countries and if they want to upgrade from locations for HBE to
HBA oriented activities. Therefore investment in basic and applied science infrastructure and
the education of human capital has to be a priority. Furthermore, political support for the
development of local technology oriented and highly capable companies and start-ups
(‘technopreneurship’) is necessary in order to improve to quality of the MIS and in order to
avoid further dependence on international investment, which can pose a substantial threat for
sustainable growth as was displayed by the 1997 financial crises.
31
References
Alpha Research, 2003 Thailand in Figures 2002-2003 (Bangkok) Amin A, 2000 Organisational Learning Through Communities of Practice Paper presented at
the Workshop on The Firm in Economic Geography, University of Portsmouth, 9-11 March
Anselin L, Varga A, Ács Z J, 1997, "Local geographical spillovers between university research and high technology innovations" Journal of urban economics 42 3 422-448
Archibugi D, Mitchie J, 1995, "The globalization of technology: a new taxonomy" Cambridge Journal of Economics 19 121-140
BMBF, 2000 Zur technologischen Leistungsfähigkeit Deutschlands. Zusammenfassender Endbericht, Bundesministerium für Bildung und Forschung, Bonn
Braczyk H-J, Cooke P N, Heidenreich M, 1998 Regional innovation systems : the role of governances in a globalized world (UCL Press, London [u.a.])
Brooker Group, 2001 Technological Innovation of Industrial Enterprises in Thailand - Innovation and R&D in Thailand's Private Sector Information and New Findings, National Science and Technology Development Agency, Bangkok
Brouwer E, Budil-Nadvornika H, Kleinknecht A, 1999, "Are urban agglomerations a better breeding place for product innovation? : An analysis of new product announcements" Regional Studies 33 6 541-549
Bunnell T G, Coe N M, 2001, "Spaces and scales of innovation" Progress in Human Geography 25 4 569-589
Camagni R, 1991 Innovation networks: spatial perspectives (Belhaven Press, London [u.a.]) Cantwell J, Iammarino S, 2003 Multinational corporations and European regional systems of
innovation Studies in global competition ; 18 (Routledge, London [u.a.]) Chandler A D, 1992, "Organizational Capabilities and the Economic History of the Industrial
Enterprise" Journal of Economic Perspectives 6 79-100 Colombo M G, 1995, "Firm size and cooperation : the determinants of cooperative
agreements in information technology industries" International journal of the economics of business 2 1 3-29
Cooke P, 2002 Knowledge Economies. Clusters, learning and cooperative advantage (Routledge, London and New York)
Cooke P, Morgan K, 1998 The associational economy : firms, regions, and innovation (Oxford Univ. Press, Oxford [u.a.])
Crevoisier O, 1998, "Innovation and the city", in Making connections - technological learning and regional economic change Eds E J Malecki and P Oinas (Ashgate, Aldershot [u.a.])
Dunning J H, 1998, "Location and the multinational enterprise : a neglected factor?" Journal of international business studies 29 1 45-66
Dunning J H, 2000, "Regions, globalization and the knowledge-based economy: the issues stated", in Regions, Globalization, and the Knowledge Based Economy Ed J H Dunning (Oxford Univ. Press, Oxford) pp. 8-41
EC, 2002 Key figures 2002 : towards a European research area ; science, technology and innovation (Brussels)
Edquist C, 1997 Systems of innovation : technologies, institutions, and organizations Science, technology and the international political economy series (Pinter, London [u.a.])
Ernst D, 2002, "Global Production Networks and the Changing Geography of Innovation systems. Implications for Developing Countries" Economics of Innovation and New Technology 11 6 497-523
Ewers H-J, Wettmann R, 1980, "Innovation-oriented regional policy" Regional Studies 14 161-179
32
Feldman M P, Audretsch D B, 1999, "Innovation in cities : science-based diversity, specialization and localized competition" European economic review : EER 43 2 409-429
Fischer M M, Revilla Diez J, Snickars F, 2001 Metropolitan innovation systems : theory and evidence from three metropolitan regions in Europe Advances in spatial science (Springer, Berlin [u. a.])
Freeman C, Soete L L G, 1997 The economics of industrial innovation (Pinter, London [u.a.]) Fritsch M, Koschatzky K, Schätzl L, Sternberg R, 1998, "Regionale Innovationspotentiale
und innovative Netzwerke" Raumforschung und Raumordnung 56 4 243-252 Fröbel F, Heinrichs J, Kreye O, 1980 The new international division of labour : structural
unemployment in industrialised countries and industrialisation in developing countries Studies in modern capitalism = Etudes sur le capitalisme moderne (Cambridge Univ. Press, Cambridge [u.a.])
Gertler M S, 1995, ""Being There": Proximity, Organization, and Culture in the Development and Adoption of Advanced Manufacturing Technologies" Economic Geography 71 1 1-26
Gertler M S, 2001, "Best practice? Geography, learning and the institutional limits to strong convergence" Journal of Economic Geography 1 1 5-26
Ghoshal S, Barlett C A, 1990, "Innovation processes in multinational corporations" Strategic Management Journal 11 499-518
Henderson J, Dicken P, Hess M, Coe N, Yeung H W-c, 2002, "Global production networks and the analysis of economic development" Review of international political economy 9 3 436-464
Hobday M, 1995 Innovation in East Asia : the challenge to Japan (Elgar, Aldershot [u.a.]) Hobday M, 2000, "East versus Southeast Asia innovation systems : comparing OEM- and
TNC-led growth in electronics", in Technology, Learning, & Innovation - Experiences of Newly Industrializing Economies Eds L Kim and R R Nelson (Cambridge University Press, Cambridge) pp. 129-169
Hotz-Hart B, 2000, "Innovation Networks, Regions, and Globalization", in The Oxford handbook of economic geography Eds G L Clark, M P Feldman and M S Gertler (Oxford University Press, Oxford, England ; New York) pp. 432-450
Howells J, 1983, "Filter-down theory: Location and technology in the UK pharmaceutical industry" Environment and Planning A 15 147-164
Hudson R, 1999, ""The learning economy, the learning firm and the learning region": A sympathetic critique of the limits to learning" European Urban and Regional Studies 6 59-72
IMD, 1998 The world competitiveness yearbook 1998 (International Institute for Management Development,, Lausanne)
IMD, 1999 The world competitiveness yearbook 1999 (International Institute for Management Development,, Lausanne)
IMD, 2001 The world competitiveness yearbook 2001 (International Institute for Management Development,, Lausanne)
IMD, 2003 The world competitiveness yearbook 2003 (International Institute for Management Development,, Lausanne)
IMD, 2004 The world competitiveness yearbook 2004 (International Institute for Management Development,, Lausanne)
Intarakumnerd P, 2004, Thailand’s National Innovation System in Transition in, First Asialics International Conference on Innovation Systems and Clusters in Asia: Challenges and Regional Integration(Bangkok)
33
Intarakumnerd P, Chairatana P-A, Tangchitpiboon T, 2002, "National innovation system in less successful developing countries: the case of Thailand" Research Policy 31 8-9 1445-1457
Ivarsson I, 2002, "Transnational corporations and the geographical transfer of localised technology : a multi-industry study of foreign affiliates in Sweden" Journal of economic geography 2 2 221-247
Ivarsson I, Jonsson T, 2003, "Local technological competence and asset-seeking FDI: an empirical study of manufacturing and wholesale affiliates in Sweden" International Business Review 12 3 369-386
Kiese M, 2004 Regionale Innovationspotentiale und innovative Netzwerke in Südostasien : Innovations- und Kooperationsverhalten von Industrieunternehmen in Singapur Hannoversche geographische Arbeiten ; 56 (Lit, Münster [u.a.])
Kiese M, Revilla Diez J, 2004, "Regionale Innovationspotentiale in Südostasien - Empirische Ergebnisse aus Singapur, Penang (Malaysia) und Thailand" Geographica Helvetica 57 3
Kuemmerle W, 1999, "The drivers of foreign direct investment into research and development : an empirical investigation" Journal of international business studies 30 1 1-24
Lundvall B-Å, 1985 Product innovation and user-producer interaction Industrial development research series ; 31 (Univ. Press, Aalborg)
Lundvall B-Å, 1992 National systems of Innovation: Towards a Theory of Innovation and Interactive Learning (Frances Pinter, London)
Mani S, 2004, Financing of Innovation - A survey of various institutional mechanisms in the context of two high technology exporting developing economies from Asia in, First Asialics International Conference on Innovation Systems and Clusters in Asia: Challenges and Regional Integration(Bangkok)
Maskell P, Eskelinen H, Hannibalsson I, Malmberg A, Vatne E, 1998 Competitiveness, localised learning and regional development : specialization and prosperity in small open economies Routledge frontiers of political economy ; 13 (Routledge, London [u.a.])
Ministry of Education Singapore, 2004, Education Statistics DigestOnline Munier F, 2004 (forthcoming), "Firm Size, Technological intensity of sector and relational
competencies to innovate : evidence from french industrial innovating firms" Economics of Innovation and New Technology SPECIAL ISSUE of the Economics of Innovation and New Technology - Empirical Studies of Innovation in the Knowledge Driven Economy
Nelson R R, 1993 National Innovation Systems: A comparative analysis (Oxford University Press, New York)
NSTDA, 1999 Thailand Science and Technology Profile 1999, National Science and Technology Development Agency, Bangkok
OECD, 1998 Internationalisation of Industrial R&D. Patterns and Trends (OECD, Paris) OECD, 1999 Benchmarking the knowledge base economy (OECD, Paris) Patel P, Pavitt K, 1998, National systems of innovation under strain: The internationalisation
of corporate R & D in, Science Policy Research Unit: Electronic Working Papers Series Paper No 22(Sussex)
Reddy P, 2000 The globalization of corporate R&D : implications for innovation systems in host countries Routledge studies in international business and the world economy ; 18 (Routledge, London [u.a.])
Revilla Diez J, 2000, "The Importance of Public Research Institutes in Innovative Networks - Empirical Results from the Metropolitan Innovation Systems Barcelona, Stockholm and Vienna" European Planning Studies 8 4 451-463
34
Revilla Diez J, 2002a Betrieblicher Innovationserfolg und räumliche Nähe : zur Bedeutung innovativer Kooperationsverflechtungen in metropolitanen Verdichtungsregionen ; die Beispiele Barcelona, Stockholm und Wien Wirtschaftsgeographie 22 (Lit, Münster)
Revilla Diez J, 2002b, "Innovation activities and networks in metropolitan systems of innovation : empirical findings from Barcelona, Vienna and Stockholm", in Technological change and regional development in Europe Eds L Schätzl and J Revilla Diez (Springer, Heidelberg, New York)
Revilla Diez J, 2002c, "Metropolitan innovation systems : a comparison between Barcelona, Stockholm, and Vienna" International regional science review 25 1 63-85
Revilla Diez J, Berger M, 2004, "Technological Capabilities and Innovation in Southeast Asia - Empirical Evidence from Singapore, Penang (Malaysia) and Thailand", in Innovation and Clusters in Asia Eds P Intarakumnerd and J Vang (in press)
Revilla Diez J, Kiese M, 2004, "Scaling Innovation in Southeast Asia: Empirical Evidence from Singapore, Penang (Malaysia) and Bangkok" Economic Geography (submitted)
Schiller D, 2003: Technologische Leistungsfähigkeit Thailands: Die Rolle der Forschungs- und Technologiepolitik und das regionale Innovationspotenzial im Verarbeitenden Gewerbe Unpublished Diploma Thesis, Geographisches Institut, Universität Hannover, Hannover
Shefer D, Frenkel A, 1998, "Local milieu and innovations : some empirical results" The Annals of Regional Science 32 1 185-200
Sternberg R, 2000, "Innovation Networks and Regional Development- Evidence from the European Regional Innovation Survey (ERIS)" European Planning Studies 8 4 389-407
Stichweh R, 1999, "Globalisierung der Wissenschaft und die Region Europa", in Globalisierung. Ökonomische und soziale Herausforderungen am Ende des zwanzigsten Jahrhunderts. Sonderband 13 der "Sozialen Welt" Eds G Schmidt and R Trinczek (Nomos, Baden-Baden) pp. 275-292
Stracke S, 2003: Technologische Leistungsfähigkeit im Innovationssystem Penang, Malaysia Unpublished Doctoral Thesis, Abteilung für Wirtschaftsgeographie, Universität Hannover, Hannover
Suárez-Villa L, Fischer M M, 1995, "Technology, organization and export-driven research and development in Austria's electronics industry" Regional studies 29 1 19-42
UNESCO, 2004, Science and Technology Statistics Varga A, 1998 University research and regional innovation : a spatial econometric analysis
of academic technology transfers Economics of science, technology, and innovation ; v. 13 (Kluwer Acad. Publ., Boston [u.a.])
Virasa T, Brimble P, 2001, Technological Innovation of Industrial Enterprises in Thailand in, Regional Workshop on Innovation in the Manufacturing Sector(Penang, The Gurney Hotel)
Wong P K, 1999, National Innovation Systems for Rapid Technological Catch-up: An analytical framework and a comparative analysis of Korea, Taiwan and Singapore in, DRUID Summer Conference on National Innovation Systems, Industrial Dynamics and Innovation Policy(Rebild, Denmark)
Wong P K, 2001, "Leveraging multinational corporations, fostering technopreneurship : the changing role of S&T policy in Singapore" International journal of technology management 22 5/6 539-567