challenge: variation in participants and policies across
TRANSCRIPT

ChalleNGe: Variation in Participantsand Policies Across Programs
Subpopulations and Geographic Analysis
Cathleen M McHugh • Jennie W. Wenger
CAB D0019577.A2/Final
March 2009
CNA’s annotated briefings are either condensed presentations of the results of formal CNA studies that have been further documented elsewhere or stand-alone presentations of research reviewed and endorsed by CNA. These briefings repre-sent the best opinion of CNA at the time of issue. They do not necessarily represent the opinion of the Department of the Navy.
Approved for Public Release; Distribution Unlimited. Specific authority: N00014-05-D-0500.Copies of this document can be obtained through the Defense Technical Information Center at www.dtic.milor contact CNA Document Control and Distribution Section at 703-824-2123.
Copyright © 2009 CNA
Approved for distribution: March 2009
Henry S. Griffis, DirectorDefense Workforce AnalysesResource Analysis Division
1
Overview
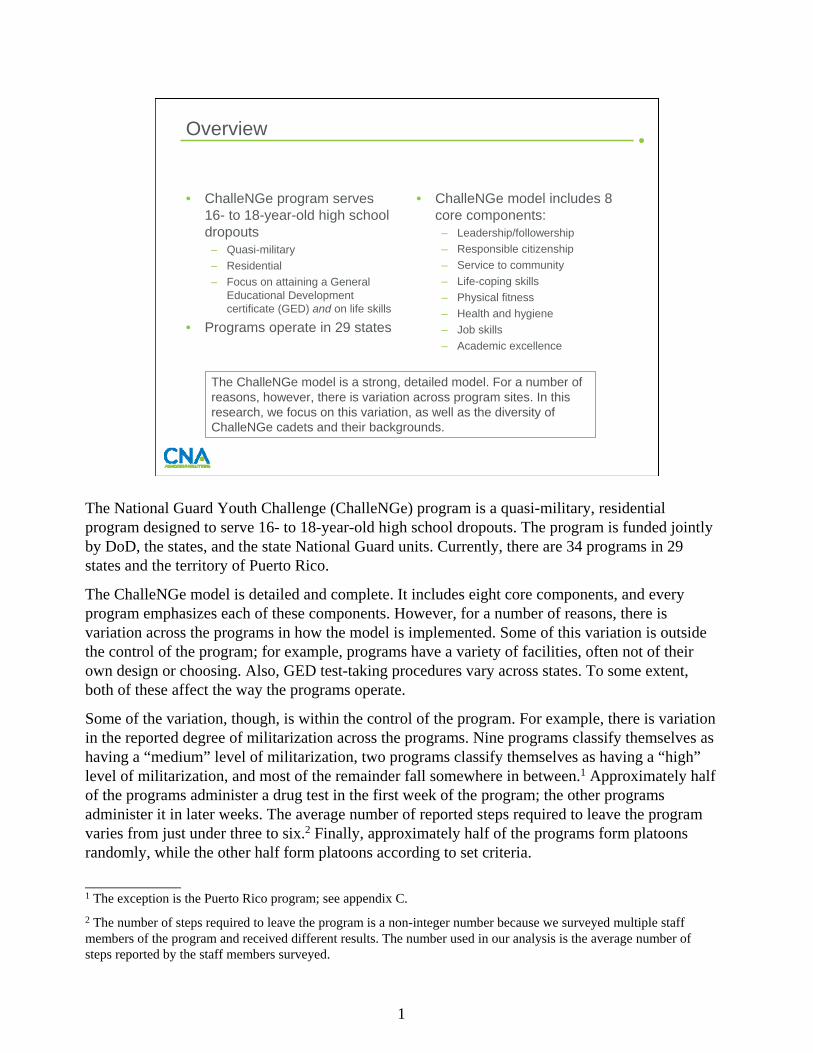
• ChalleNGe program serves 16- to 18-year-old high school dropouts
– Quasi-military– Residential– Focus on attaining a General
Educational Development certificate (GED) and on life skills
• Programs operate in 29 states
• ChalleNGe model includes 8 core components:
– Leadership/followership– Responsible citizenship– Service to community– Life-coping skills– Physical fitness– Health and hygiene– Job skills– Academic excellence
The ChalleNGe model is a strong, detailed model. For a number ofreasons, however, there is variation across program sites. In this research, we focus on this variation, as well as the diversity of ChalleNGe cadets and their backgrounds.
The National Guard Youth Challenge (ChalleNGe) program is a quasi-military, residential program designed to serve 16- to 18-year-old high school dropouts. The program is funded jointly by DoD, the states, and the state National Guard units. Currently, there are 34 programs in 29 states and the territory of Puerto Rico.
The ChalleNGe model is detailed and complete. It includes eight core components, and every program emphasizes each of these components. However, for a number of reasons, there is variation across the programs in how the model is implemented. Some of this variation is outside the control of the program; for example, programs have a variety of facilities, often not of their own design or choosing. Also, GED test-taking procedures vary across states. To some extent, both of these affect the way the programs operate.
Some of the variation, though, is within the control of the program. For example, there is variation in the reported degree of militarization across the programs. Nine programs classify themselves as having a “medium” level of militarization, two programs classify themselves as having a “high”level of militarization, and most of the remainder fall somewhere in between.1 Approximately half of the programs administer a drug test in the first week of the program; the other programs administer it in later weeks. The average number of reported steps required to leave the program varies from just under three to six.2 Finally, approximately half of the programs form platoons randomly, while the other half form platoons according to set criteria.
____________1 The exception is the Puerto Rico program; see appendix C. 2 The number of steps required to leave the program is a non-integer number because we surveyed multiple staff members of the program and received different results. The number used in our analysis is the average number of steps reported by the staff members surveyed.

2
Tasking
• This annotated briefing details some of our findings for three tasks:– Analysis of subpopulations: Is there evidence that
some aspects of the ChalleNGe model affect different cadets in different ways?
– Geographic analysis: Do cadets come from areas with high dropout rates?
– Military attrition analysis: Update analysis of the attrition rates of those ChalleNGe cadets who enlist
In this annotated briefing, we detail some of our research looking at variation across ChalleNGe cadets and ChalleNGe programs. We focus on two questions.
First, are there aspects of the ChalleNGe model that affect different cadets in different ways? For example, a program with a high degree of militarization may be more or less effective with cadets from urban areas versus those from rural or suburban areas, or with female cadets versus male cadets.
Second, we are interested in classifying the schools or school districts that cadets previously attended. Specifically, we explore whether cadets come from schools or school districts with high dropout rates. Serving cadets from “dropout factories” may have implications for the performance of the programs. It also may suggest areas where programs should recruit or areas where new programs should locate if funding for additional programs becomes available.
Finally, we use ChalleNGe program data as well as data from the Defense Manpower Data Center (DMDC) to update our analysis of the performance of those ChalleNGe cadets who eventually enlist. We examine how ChalleNGe graduates in the military perform (in terms of attrition), we compare the performance of ChalleNGe graduates to nongraduates, we look at how performance has changed over time, we compare the performance of ChalleNGe graduates to those holding high school diplomas, and we test for performance differences across graduates from different ChalleNGe programs.
The next slide details the data sources we use in this analysis.

3
Data and methodology
• We combine data from several sources in our analysis:– ChalleNGe program data– Census data– Enrollment data from CCD, NCES– Data from our online survey of ChalleNGe staff– DMDC data:
Longitudinal dataset of all who enlisted in the military and have one of the following education credentials: high school diploma graduate; ChalleNGe; GED; no credential (“dropout”)—used to compare the progress of ChalleNGe enlistees from DoD’s perspective. Includes FY99-FY08.Matched dataset of all who expressed interest in ChalleNGe and eventually enlisted in the military—used to track the education codes of ChalleNGe enlistees and to look at program-level differences among enlistees. Also covers the period FY99-FY08.
This project required data from a number of sources. First, we use ChalleNGe program data,3 which include demographic information on the cadets (i.e., gender, ethnicity, age at entry) and scores on physical fitness tests and the Test of Adult Basic Education (TABE). Program data also include an indication of whether the cadet graduated from ChalleNGe, as well as the cadet’s home ZIP code. These data span 1999 through early 2008.
We use the cadet’s ZIP code and data from the Census to classify the poverty rate of the cadet’s neighborhood. Likewise, we use the cadet’s ZIP code and data on U.S. public schools from the Common Core of Data (CCD), made available by the U.S. Department of Education’s National Center for Education Statistics (NCES), to determine both the urbanicity of the cadet’s neighborhood and the completion rate of the cadet’s home school district. Completion rates are similar to graduation rates; we discuss our calculations in detail on later slides.
In early 2008, we fielded an online survey of ChalleNGe staff. Multiple staff members from 28 different ChalleNGe programs participated in the survey; we surveyed Directors, Deputy Directors, and leaders in various areas, including teaching and counseling.4 We use some of the data from that survey in this analysis; in particular, we use these data to characterize some program-level differences.
____________3 The ChalleNGe program data were provided by Pat Antosh of AOC Solutions. 4 At the time of the survey, there were 29 programs in operation.

4
Finally, we requested and received two data extracts from DMDC.5 The first dataset includes every enlistee from the non-prior-service active duty accession files for all four Services who holds one of the following education credentials: ChalleNGe graduate plus a GED, high school diploma, or GED alone. We use this file to compare the performance of ChalleNGe enlistees with that of enlistees with other credentials.
The second DMDC dataset is based on a complete list of Social Security Numbers (SSNs) from the ChalleNGe program files, including those who completed ChalleNGe, those who entered ChalleNGe but dropped out, and even some information on those who expressed an interest in ChalleNGe but did not enter. DMDC matched this list to its non-prior-service active duty accession files for all four Services. Thus, we have a dataset including all ChalleNGe participants who eventually enlisted. In these cases, we also know which ChalleNGe program each enlistee attended. We use this dataset to track the total number of ChalleNGe participants who enlist, to detail performance differences between ChalleNGe graduates and nongraduates, and finally to examine program-level differences in the military performance of ChalleNGe graduates.
On the next slide, we begin to discuss our analysis of task 1: Is there evidence that some aspects of the ChalleNGe model affect different cadets in different ways?
____________5 We thank Debi Williams of DMDC for merging and extracting these datasets.

5
Task 1: Analysis of subpopulations
Do attributes of the ChalleNGe program affect all types of participants in the same way?

6
Task 1: Do attributes of the ChalleNGe program affect all types of participants in the same way?
• Variation in who is served by different ChalleNGe programs– Gender– Poverty rate– Urbanicity
• Variation in how ChalleNGe programs are implemented– Degree of militarization– Number of steps required for a recruit to attrite– Method of assigning recruits to platoons– Whether or not drug testing takes place in first week
• All populations may not be affected the same way by attributes of the ChalleNGe program (i.e., youth from high- and low-poverty areas may be affected differently by degree of militarization)
We examine whether ChalleNGe program characteristics have different effects for participants from various types of neighborhoods. We analyze male and female participants separately and characterize neighborhoods by both income levels and urbanicity. As a baseline for our income analysis, we examine the effects of program characteristics on the probability that a recruit from a middle-income neighborhood graduates from ChalleNGe and whether these effects are the same for recruits from low- and high-income neighborhoods. We perform a similar analysis for urbanicity, using recruits from mixed-urbanicity neighborhoods as a baseline and then examining whether program effects differ for recruits from urban versus rural neighborhoods.
We examine four different program characteristics:
• Degree of militarization
• Whether recruits are assigned to their platoon randomly
• Number of steps a recruit has to go through in order to leave the program early (i.e., drop out of the program)
• Whether drug testing takes place in the first week of the program.
Data on these program characteristics come from our survey of ChalleNGe staff.6 We will discuss each of these program characteristics in detail on the slides that follow.____________6 For more details, see Cathleen M. McHugh and Jennie W. Wenger, “Variation in Participants and Policies Across ChalleNGe Programs,” CRM D0017743.A2, April 2008.

7
Degree of militarization
This variable measures the degree to which program staff think their program is militarized (answers were “less than most programs,” “about the same as other programs,” or “more than other programs”). It is not immediately obvious how the degree of militarization would affect the probability of graduation or if this effect would be linear. For instance, it is possible that moderately militarized programs have higher graduation rates than programs with either a lower or higher degree of militarization.
Number of steps a recruit has to go through in order to leave the program
We asked staff from each program how many steps a recruit must take in order to leave the program early (i.e., drop out of the program). If relatively few steps are necessary, participants who want to leave may be more likely to do so. If this policy affects only those ChalleNGe participants who would like to leave the program early, programs that are relatively easy to leave should have either lower rates or the same graduation rates as programs that are hard to leave. (Easy-to-leave programs would have lower graduation rates if those who left the program early actually would have graduated had they not been able to leave; they would have the same graduation rates if those who left the program early would not have graduated even if they had not left the program early.)
Easy-to-leave programs may have higher graduation rates if students who would like to leave are disruptive and affect the likelihood that other participants graduate. In other words, if disruptive participants are allowed to leave, they do not have the chance to influence other participants. If this is true, it is highly suggestive of the presence of peer effects in the ChalleNGe program—that is, a participant’s likelihood of graduating is affected not only by what he/she does and by what the program does but also what his/her classmates do.
Whether a program randomly assigned recruits to platoons
This measures whether programs randomly assign recruits to platoons or whether they form platoons based on such criteria as geographic location of recruits’ homes. We include this variable in both the male and female results, even though most programs have only enough females to make up one platoon. Thus, if this variable is significant for females, it is picking up something that differs besides the actual method of platoon assignment.
We think of this variable as capturing both actual peer effects as well as the degree to which programs account for the possibility of peer effects (i.e., that a cadet’s peers may affect his or her performance). We don’t specify exactly what type of peer effect operates in the ChalleNGeenvironment—in fact, the peer effects captured by this variable may even be different across programs as programs may use different criteria to form platoons.
Whether drug testing takes place in the first week
All programs test all cadets. This variable indicates whether the program tests the recruits for drugs in the first week. If a recruit tests positive for drugs, that recruit is then sent home. Thus, one would expect that this negatively affects the likelihood of graduation if a recruit would have graduated from the program if he/she had not been sent home.

8
Conversely, one would expect the presence of drug testing in the first week to have a positive effect on graduation if recruits who test positive for drugs in the first week generally fail to graduate and are disruptive so their presence causes other students not to graduate. (This would have no effect on the likelihood of graduation if students who would have tested positive for drugs in the first week would not have graduated even if they had remained in the program, but also would not have disrupted their peers.)
The slides that follow demonstrate how each of these program-level characteristics (degree of militarization, steps required to leave the program, assignment to platoon, and drug testing within the first week) affect various cadets. We test these characteristics on male and female cadets, as well as on cadets from urban, mixed, or rural areas, and on cadets from neighborhoods with different average incomes.
We obtained these results from logistic regressions that model the probability a cadet graduates as a function of the program level characteristics discussed above as well as the cadet’s: age, race/ethnicity, TABE score, and level of physical fitness. Also controlled for are the distance from the cadet’s home to the program site, whether the program is in its first five years of operation, the cadet’s class, and the year the cadet participated in ChalleNGe. Standard errors are clustered at the program level.
The statistical significance of our results is denoted by stars. One star denotes significance at the 10 percent level, two stars at the 5 percent level, and three stars at the 1 percent level.

9
Program-level effects on female recruits—effects for neighborhoods with middle-level income
Middle income neighborhoods
0.500.550.600.650.700.75
Less Average More 4 steps 5 steps 6 steps Notrandom
Random Yes No
Degree of militarization*** Steps required to leaveprogram**
Assignment toplatoon***
Drug testing in firstweek*
Program characteristics
Prob
abili
ty o
f gra
duat
ion
All four program characteristics significantly affect the probability that a young woman will graduate from the ChalleNGe program. Young women from middle-income neighborhoods are most likely to graduate from:
• Highly militarized programs
• Programs that are relatively easy to leave
• Programs that do not randomly assign their platoons
• Programs that do not test for drugs in the first week.
There is evidence of the existence of peer effects in the program: young women are more likely to graduate from programs that are relatively easy to leave. This suggests that retaining recruits who want to leave is disruptive for other recruits. Drug testing in the first week (and therefore kicking out recruits who test positive) negatively affects the probability of graduation. This suggests those recruits who test positively for drugs in the first week perform well in the program; testing later may allow them to pass the drug test and succeed. Also, this suggests that these recruits do not disrupt other recruits.
We included random assignment to platoons for female recruits even though programs usually have only enough female recruits to fill one platoon. We find that female recruits are more likely to graduate from programs that do not randomly assign recruits to platoons; this suggests there is something else systematically different about these programs that affects female graduation.
10
Program-level effects on female recruits—effects for neighborhoods with high and low income
High income neighborhoods
0.500.550.600.650.700.75
Less Average More 4 steps 5 steps 6 steps Notrandom
Random Yes No
Degree of militarization Steps required to leave program Assignment toplatoon**
Drug testing in firstweek
Program characteristics
Prob
abili
ty o
f gra
duat
ion
Low income neighborhoods
0.500.550.600.650.700.75
Less Average More 4 steps 5 steps 6 steps Notrandom
Random Yes No
Degree of militarization* Steps required to leave program Assignment toplatoon**
Drug testing in firstweek
Program characteristics
Prob
abili
ty o
f gra
duat
ion
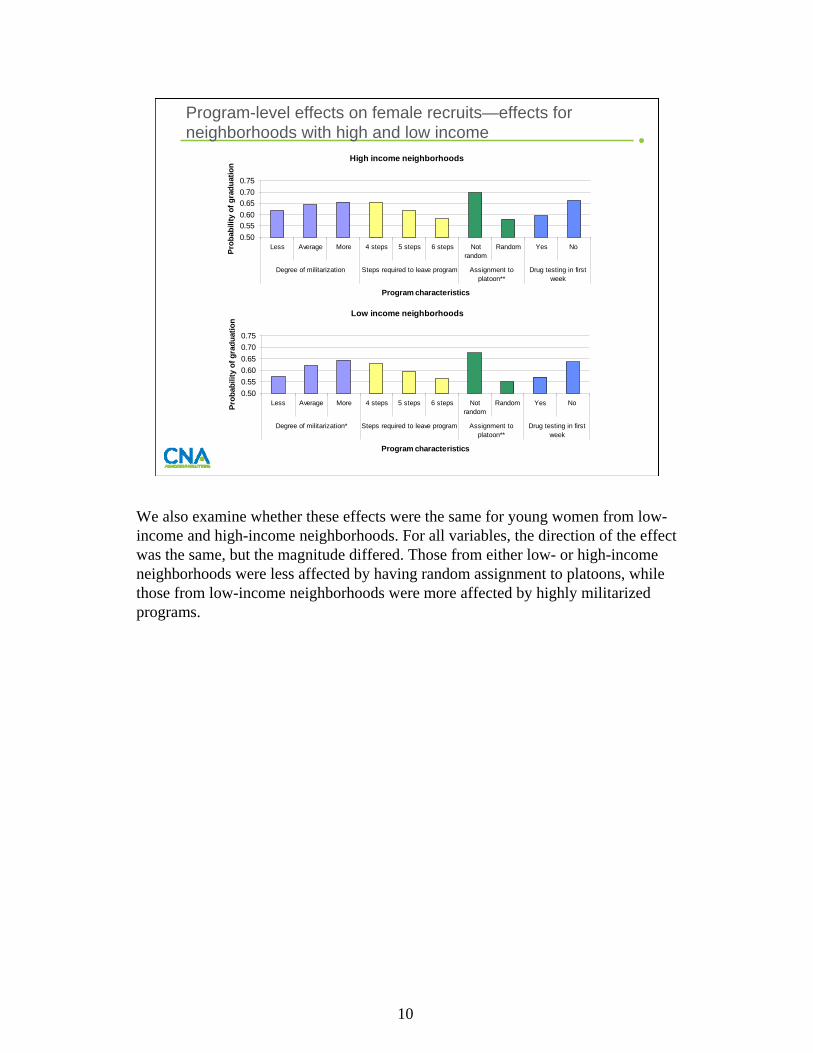
We also examine whether these effects were the same for young women from low-income and high-income neighborhoods. For all variables, the direction of the effect was the same, but the magnitude differed. Those from either low- or high-income neighborhoods were less affected by having random assignment to platoons, while those from low-income neighborhoods were more affected by highly militarized programs.

11
Program-level effects on female recruits—effects for neighborhoods with mixed urbanicity
Mixed urbanicity neighborhoods
0.450.500.550.600.650.700.75
Less Average More 4 steps 5 steps 6 steps Notrandom
Random Yes No
Degree of militarization*** Steps required to leaveprogram**
Assignment toplatoon***
Drug testing in firstweek***
Program characteristics
Prob
abili
ty o
f gra
duat
ion
When we examine effects by neighborhood urbanicity, we find that program-level characteristics affect graduation in the same way as they did in our analysis by neighborhood income. Young women from mixed-urbanicity neighborhoods are more likely to graduate from programs that are highly militarized, that require few steps to leave, that do not randomly assign recruits to platoons, and that do not administer drug tests in the first week.

12
Program-level effects on female recruits—effects for urban and rural neighborhoods
Urban neighborhoods
0.450.500.550.600.650.700.75
Less Average More 4 steps 5 steps 6 steps Notrandom
Random Yes No
Degree of militarization Steps required to leave program Assignment toplatoon*
Drug testing in firstweek
Program characteristics
Prob
abili
ty o
f gra
duat
ion
Rural neighborhoods
0.450.500.550.600.650.700.75
Less Average More 4 steps 5 steps 6 steps Notrandom
Random Yes No
Degree of militarization* Steps required to leave program Assignment toplatoon*
Drug testing in firstweek
Program characteristics
Prob
abili
ty o
f gra
duat
ion
The effect of random assignment to platoons differs by neighborhood type. Randomly assigning recruits to platoons has the largest negative effect on young women from rural neighborhoods and the smallest negative effect on young women from urban neighborhoods. This suggests that programs that randomly assign recruits to platoons are least successful with young women from rural and mixed-urbanicity neighborhoods and most successful with young women from urban neighborhoods. The effect of the degree of militarization is higher for young women from rural neighborhoods than from mixed-urbanicity neighborhoods.

13
Program-level effects on male recruits—effects for neighborhoods with middle-level income
Middle income neighborhoods
0.500.550.600.650.700.75
Less Average More 4 steps 5 steps 6 steps Notrandom
Random Yes No
Degree of militarization*** Steps required to leaveprogram**
Assignment toplatoon***
Drug testing in firstweek*
Program characteristics
Prob
abili
ty o
f gra
duat
ion
Similar to young women from middle-income neighborhoods, young men from middle-income neighborhoods are most likely to graduate from:
• Highly militarized programs
• Programs that are relatively easy to leave
• Programs that do not randomly assign their platoons
• Programs that do not test for drugs in the first week.
Because most programs have enough young men to fill more than one platoon, the variable assignment to platoon potentially picks up both the effect of method of platoon formation as well as other program-level differences (the presence of which was found in the results for female recruits).

14
Program-level effects on male recruits—effects for neighborhoods with high and low income
High income neighborhoods
0.500.550.600.650.700.75
Less Average More 4 steps 5 steps 6 steps Notrandom
Random Yes No
Degree of militarization Steps required to leave program Assignment toplatoon**
Drug testing in firstweek*
Program characteristics
Prob
abili
ty o
f gra
duat
ion
Low income neighborhoods
0.500.550.600.650.700.75
Less Average More 4 steps 5 steps 6 steps Notrandom
Random Yes No
Degree of militarization Steps required to leave program Assignment toplatoon*
Drug testing in firstweek
Program characteristics
Prob
abili
ty o
f gra
duat
ion
The effect on graduation of attending a program that randomly assigns recruits to platoons is smaller for young men from low- or high-income neighborhoods than for those from middle-income neighborhoods. This mirrors the results for female recruits, which suggests that this effect is being driven by other program-level factors—differences between programs that randomly assign recruits and those that do not—and is not necessarily only the effect of random assignment.
The effect on graduation of attending a program that administers drug tests in the first week is smallest for young men from high-income neighborhoods. One explanation for this result is that young men from high-income neighborhoods may be less likely to test positive for drugs in the first week. This differs from the results for female recruits. For young women, there was no difference between those from low-, middle-, or high-income neighborhoods on the effect of attending a program that drug tested in the first week. This would suggest that there is no difference in terms of which young women, from which neighborhoods, are most likely to test positive for drugs in the first week.
15
Program-level effects on male recruits—effects for neighborhoods with mixed urbanicity
Mixed urbanicity neighborhoods
0.500.550.600.650.700.75
Less Average More 4 steps 5 steps 6 steps Notrandom
Random Yes No
Degree of militarization*** Steps required to leaveprogram***
Assignment toplatoon***
Drug testing in firstweek***
Program characteristics
Prob
abili
ty o
f gra
duat
ion
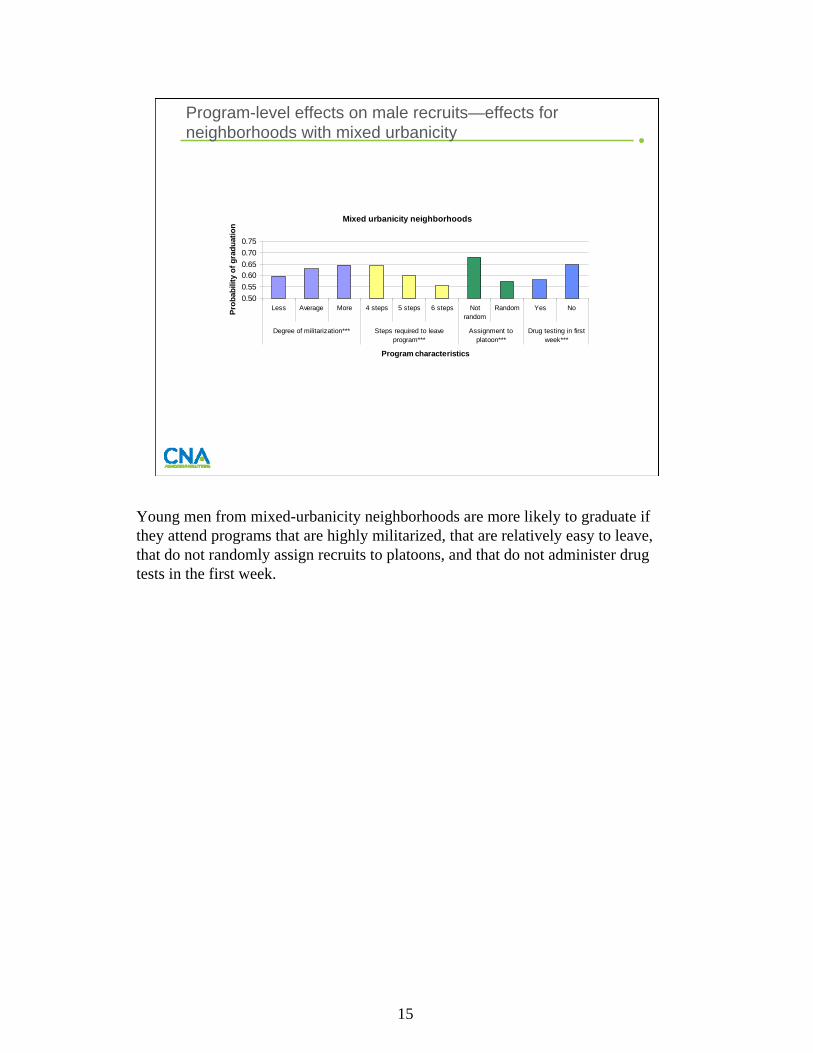
Young men from mixed-urbanicity neighborhoods are more likely to graduate if they attend programs that are highly militarized, that are relatively easy to leave, that do not randomly assign recruits to platoons, and that do not administer drug tests in the first week.
16
Program-level effects on male recruits—effects for urban and rural neighborhoods
Urban neighborhoods
0.500.550.600.650.700.75
Less Average More 4 steps 5 steps 6 steps Notrandom
Random Yes No
Degree of militarization*** Steps required to leave program Assignment toplatoon***
Drug testing in firstweek
Program characteristics
Prob
abili
ty o
f gra
duat
ion
Rural neighborhoods
0.500.550.600.650.700.75
Less Average More 4 steps 5 steps 6 steps Notrandom
Random Yes No
Degree of militarization** Steps required to leave program Assignment toplatoon
Drug testing in firstweek
Program characteristics
Prob
abili
ty o
f gra
duat
ion
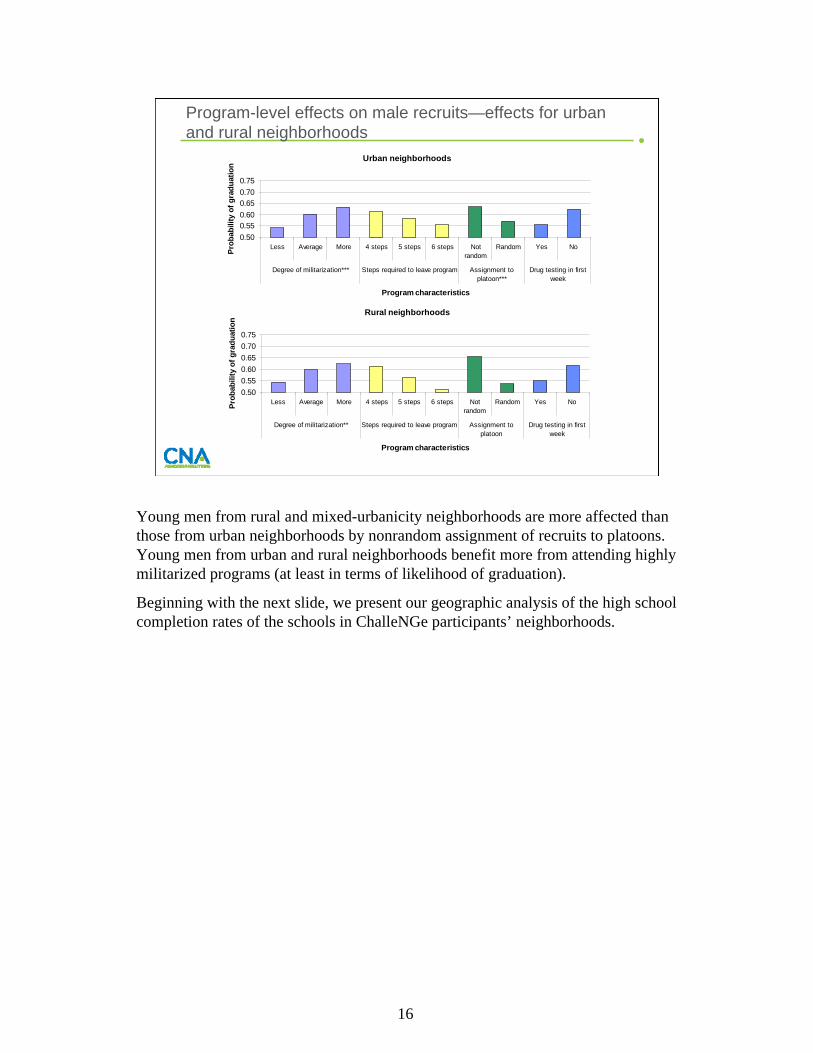
Young men from rural and mixed-urbanicity neighborhoods are more affected than those from urban neighborhoods by nonrandom assignment of recruits to platoons. Young men from urban and rural neighborhoods benefit more from attending highly militarized programs (at least in terms of likelihood of graduation).
Beginning with the next slide, we present our geographic analysis of the high school completion rates of the schools in ChalleNGe participants’ neighborhoods.

17
Task 2: Geographic analysis
High school completion rates in ChalleNGe participants’ neighborhoods

18
Task 2: High school completion rates in ChalleNGe participants’ neighborhoods
• Completion rate versus dropout rate• Data at the ZIP code area versus data at the school district
level • Missing data
– State level– ChalleNGe participants
• Probability that a state’s average 16- to 18-year-old lives in a ZIP code area with a low high school completion rate
• Probability that a state’s average ChalleNGe participant lives in a ZIP code area with a low high school completion rate
There are several ways to measure a school’s or a school district’s graduation rate. Some measures focus on the dropout rate by counting all who leave school without a diploma; others measure the completion rate by focusing on the number who complete 12th grade and receive a diploma and comparing this number with the number of students in a given grade some years earlier (such as 9th graders 3 years prior). Although migration affects the completion rate, we prefer completion rates to dropout rates because dropout rates often classify students who leave the school as “transfers” without following up to see whether the students ever receive credentials.
In this section of our analysis, we match ChalleNGe participants to the completion rate of young people living in the same ZIP code. (To be more precise, we map the cadet’s ZIP code to school district-level completion data.) Optimally, we would prefer to match the participants to the completion rate of the school they attended before entering ChalleNGe. However, we know only ChalleNGe participant’s home ZIP codes, not the name of their previous school (we recommend that data on the previous school attended be collected in the future; such data would allow more accurate matching). Also, the data we use at this stage exist for the school district, but not for the individual school. Finally, we note that this matching is stymied by missing data in some instances; we discuss these in more detail in the following slides.

19
Calculating completion rates
• Standardized calculation of dropout rate is not available across all states during this time period
• We use data on enrollment and diplomas granted to calculate completion rate
Completion rate = Number of diplomas granted in school year t+210th grade enrollment in school year t
There is no standardized dropout rate calculation used consistently across the states.7 Thus, instead of using a dropout rate, we calculate the 10th grade completion rate. This completion rate is calculated as the ratio of the number of diplomas granted by district j in year t+2 and the number of students enrolled in 10th grade in district j in year t.8
____________7 For additional information about dropout rates and differences across the states, see: Philip Kaufman, Martha Naomi Alt, and Christopher D. Chapman. 2004. Dropout Rates in the United States: 2001 (NCES 2005-046). U.S. Department of Education. National Center for Education Statistics. Washington, DC: U.S. Government Printing Office.8 For additional information about completion rate measures and a demonstration of their relationship with other student outcomes, see: Martin Carnoy, Susanna Loeb, and Tiffany L. Smith. 2001. Do Higher State Test Scores in Texas Make for Better High School Outcomes? Consortium for Policy Research in Education, University of Pennsylvania Graduate School of Education, Research Report Series RR-047.

20
Transitions from 10th grade to diploma
Enrolled in 10th
grade in district A in year t
Not enrolled in any district in year
t+2
Enrolled in other district in year t+2
Enrolled in 12th
grade in district A in year t+2
Received diploma
from district A in year t+2
Not enrolled in any district in year
t
Enrolled in other district in year t
Enrolled in district A in year t but not
in 10th grade
Failed to receive diploma
from district A in year t+2
Enrolled in district A in year t+2 but not in 12th grade
Our completion rate reflects not only the dropout rate of a school district but also other changes in the student population between grades 10 and 12. A student attending one district in 10th grade may be attending another district in 12th grade. Likewise, a student graduating from one district may have attended another district in grade 10. We chart the different transitions above.
Due to these other transitions, the 10th grade completion rate can exceed 100 percent. This is most likely for districts that changed boundaries between year t and year t+2 but could also occur for districts that have high growth rates. We truncate the completion rate at 100 percent in these cases.
Note that districts that see a net inflow of students between year t and year t+2 will have an artificially high completion rate, whereas those that see a net outflow of students between year t and year t+2 will have an artificially low completion rate. This should be kept in mind while interpreting results for geographic entities (school districts, ZIP code areas, states) that have experienced large changes in population.
To minimize this type of measurement error, we exclude districts that changed boundaries during the relevant years. We also exclude districts that did not offer both 10th and 12th
grades. Beyond that, we calculate this measure using district level data collected by the National Center for Education Statistics for the school years 1999/2000 through 2004/2005.

21
Geography used in analysis
• Geographical unit of analysis is ZIP code area• Map ZIP code areas to corresponding school districts• Calculate
– Completion rates for each school year from 1999/2000 through 2004/2005
– Average completion rate over this time period• Classify ZIP code area as having “low” completion rate if average
completion rate is 75% or lower• Overall, 30% of ZIP codes/school districts have completion rates of
75% or less
We calculate completion rates for the ZIP code areas of ChalleNGe participants. To do this, we use a mapping of school districts to ZIP code areas. Because some ZIP code areas cross school district lines, this mapping uses 2000 population data to ascribe the percentage of the ZIP code found in district A, the percentage found in district B, and so on. We map the completion rates to all ZIP code areas in a state and calculate a ZIP code area level completion rate for each school from 1999/2000 to 2004/2005. We also calculate the average completion rate for each district over this time period.
We classify ZIP code areas as having low completion rates if their average completion rate is less than 75 percent. We then construct the probability that a ChalleNGe participant lives in a ZIP code that is classified as having a low completion rate.
As a comparison group, we use data on the state’s 16-, 17-, and 18-year-olds from the 2000 Census to construct probabilities that the average 16- to 18-year-old in the state lives in a ZIP code area that is classified as having a low completion rate.
Some ZIP code areas are missing data; because of this, some of our state-specific results should be interpreted with caution. We discuss this issue, as well as recent trends in the data, in appendix A.

22
Concentration of students in school districts and of youth in low-completion ZIP codes varies across states
Note: Hawaii has no 16- to 18-year-olds living in a ZIP code area with a low high school completion rate.
0.0
10.0
20.0
30.0
40.0
50.0
60.0
70.0
80.0
90.0
100.0
AK AL AR AZ CA DC FL GA IL IN KY LA MD MI MS MT NC NJ NM OK OR SC TX VA WI WV WY
State
Per
cent
age
of p
opul
atio
nPercentage of 16- to 18-year-old population living in a low completion ZIP code areaPercentage of school age population living in the largest school districts
The probability that a 16- to 18-year-old lives in a low-completion ZIP code area varies widely across states. For instance, both the District of Columbia and South Carolina have probabilities that exceed 90 percent, and Montana, West Virginia, and Hawaii have probabilities less than 10 percent—specifically, Hawaii has no 16-to 18-year-olds living in a ZIP code area with a low high school completion rate. This difference occurs in part because of the structure of school districts in these states. Therefore, it is helpful to use the percentage of school-age population living in the largest school districts to provide context for the results concerning the percentage of 16- to 18-year-olds living in low-completion ZIP codes.
For instance, Hawaii and the District of Columbia each have only one school district included in the dataset. Thus, all students in each of these areas will be classified together.
Neither West Virginia nor South Carolina is dominated by a few large school districts; the largest 10 percent of school districts contain approximately 33 and 42 percent, respectively, of the total school enrollment. In fact, these two states have some of the lowest concentrations of students in the 10 percent largest school districts: West Virginia has the lowest concentration among the 50 states and the District of Columbia; South Carolina is ranked 45th. These statistics suggest that there are many districts with high completion rates in West Virginia and many districts with low completion rates in South Carolina.

23
Concentration of students in school districts and of youth in low completion ZIP code varies across states (cont.)
0.0
10.0
20.0
30.0
40.0
50.0
60.0
70.0
80.0
90.0
100.0
AK AL AR AZ CA DC FL GA IL IN KY LA MD MI MS MT NC NJ NM OK OR SC TX VA WI WV WY
State
Per
cent
age
of p
opul
atio
nPercentage of 16- to 18-year-old population living in a low completion ZIP code areaPercentage of school age population living in the largest school districts
Montana is more concentrated: over 60 percent of the school population is concentrated in the largest 10 percent of school districts. This means that the results from Montana are more sensitive to the condition of these large districts. Data for several other states, including Virginia and Wisconsin, resemble the data for Montana. In contrast, data from Mississippi and Alabama resemble the data from South Carolina and suggest that these states have many districts with low completion rates.
There is a shortcoming to categorizing districts as low completion based on an absolute number—districts with similar completion rates may be classified differently if their completion rates are close to the cut-off point. For instance, the average completion rates for the Hawaii district and the District of Columbia district were 75.8 and 74.9 percent, respectively. Even though these two districts have roughly the same completion rates, all students in Hawaii were classified as not coming from a low-completion district, and all students in the District of Columbia were classified as coming from a low-completion district.

24
ChalleNGe results
Note: Hawaii has no 16- to 18-year-olds living in a ZIP code area with a low high school completion rate.
0.0
10.0
20.0
30.0
40.0
50.0
60.0
70.0
80.0
90.0
100.0
AK AL AR AZ CA DC FL GA IL IN KY LA MD MI MS MT NC NJ NM OK OR SC TX VA WI WV WY
State
Perc
enta
ge o
f pop
ulat
ion
ChalleNGe participants State 16- to 18-year-old population
This slide indicates the percentage of areas in the state with low (less than 75 percent) completion rates and the percentage of ChalleNGe cadets from low-completion areas. There is a great deal of variation between states in terms of the representativeness of ChalleNGe participants’ ZIP code dropout rates. For instance, New Mexico ChalleNGe participants are 8.5 percentage points less likely to come from a low-completion-rate ZIP code area than the average New Mexico 16- to 18-year-old, while Illinois ChalleNGe participants are 22.7 percentage points more likely to come from a low-completion-rate ZIP code area than the average Illinois 16- to 18-year-old. Of course, the vast majority of areas in New Mexico have low completion rates, while low completion areas cover less of Illinois. Thus, New Mexico ChalleNGe cadets are more likely than Illinois cadets to come from low-completion-rate ZIP codes.
In ten states, those from low-completion rate areas are underrepresented among ChalleNGe participants. The average difference for these states is 3.2 percentage points, which is comparatively small.
In sixteen states, those from low-completion rate areas are overrepresented among ChalleNGe participants. The average degree of overrepresentation for these states is 9.8 percentage points. Besides Illinois, the other states with very high degrees of overrepresentation follow (percentage points given in parentheses): Michigan (13.8), Montana (14), North Carolina (15.4), New Jersey (13.4), Texas (11.3), and Wyoming (17). In many of these states, the overall rate is lower than average, so relatively few of the areas have a low completion rate. This suggests that, in these states, the dropouts are concentrated in some areas and that ChalleNGe serves those areas.
Next, we focus on those ChalleNGe participants who enlist in the military.
25
Task 3: Military attrition analysis
Update the analysis on ChalleNGe enlistees
On the slides that follow, we present our analysis of ChalleNGe participants in the military. We begin by comparing the performance of those with ChalleNGe education credentials to enlistees with other credentials. For this task, we use the longitudinal file furnished by DMDC (see slide on pg. 4).

26
Task 3: How do enlistees with ChalleNGe credentials perform?
05
101520253035404550
FY99-FY01 FY02-FY04 FY05-FY06 FY07-FY08
HSDG, 3-mo HSDG, 12-mo HSDG, 36-moChalleNGe, 3-mo ChalleNGe, 12-mo ChalleNGe, 36-mo
This graph indicates the attrition rates of those with ChalleNGe credentials and those with traditional high school diplomas (HSDGs), over time. The graph indicates that, while attrition rates of ChalleNGe enlistees generally are higher than attrition rates of HSDGs, performance of ChalleNGe enlistees has improved markedly over time. Indeed, over the last 2 years, ChalleNGe enlistees have had lower attrition than HSDGs over the first 3 months of service and roughly the same level of attrition as HSDGs over the first 12 months of service. While ChalleNGe enlistees have typically struggled between 12 and 36 months of service, recent trends seem to suggest that performance of ChalleNGe enlistees has improved markedly, even at the 36-month point. This figure indicates that the trend pinpointed in our previous analysis (see figure 26, McHugh and Wenger 2008) seems to be continuing.
To test for other potential sources of the downward trend in attrition, we also ran regression models explaining attrition rates as a function of fiscal year, education credential, gender, age, ethnicity, marital status, AFQT score, and branch of service. Our results were quite consistent with the figure above; after holding other characteristics constant, the 3-month regression rates of ChalleNGe enlistees have been below those of HSDGs since FY05 and substantially below those of other GED-holders since FY99.
Next, we examine separation codes of ChalleNGe enlistees and those with other education credentials.

27
Separation codes, by education credential
0%
10%
20%
30%
40%
50%
60%
AWOL Behavior Death Disabled Entry Other Parent
HSDG GED ChalleNGe
This slide categorizes separation codes for those who did not remain in the service, did not successfully complete their term, and did not leave for reasons such as immediate school enrollment or officer programs. We categorize the remaining separation codes into several groups: “AWOL” also includes those who deserted or were dropped from strength due to desertion; “Behavior” includes those who separated for reasons such as alcoholism, discreditable incidents, drug use, convictions (civil or court-martial), pattern of minor disciplinary infractions, commission of a serious offense, unsatisfactory performance, or entry level performance/conduct; “Death” and “Disability” are self-explanatory; “Entry” includes fraudulent entry, breach of contract and erroneous enlistment; “Other” includes “failure to meet retention qualifications” as well as those separations without a specific code; and “Parent” includes separation for pregnancy and for parenthood.
As we see above, ChalleNGe graduates who enlist are more likely than HSDGs or other GED-holders to leave the Services for behavioral reasons. This pattern holds for both the matched sample and the longitudinal sample; it is especially pronounced among those who leave the Services between 3 and 36 months of service, and it remains when we examine only men who enlisted in the Army. Within the behavioral category, ChalleNGe enlistees are more likely than HSDGs to separate due to discreditable incidents, drugs, or commission of a serious offense; HSDGs are more likely to separate due to character/behavioral disorders, unsatisfactory performance, and entry-level performance or conduct issues.
Next, we look at the patterns of behavioral separation codes over time.

28
Reasons for separation
05
1015202530354045
3-mo 12-mo 24-mo 36-mo
HSDG, overall HSDG, behavior ChalleNGe, overall ChalleNGe, behavior
Historically, ChalleNGe enlistees have struggled between 12 and 36 months of service. Although the slide on pg. 26 shows a downward trend in 36-month attrition, rates are still higher for ChalleNGe enlistees than for HSDGs at 36 months of service, and the slide on pg. 27 indicates that ChalleNGe enlistees are especially likely to separate for behavioral reasons.
The slide above shows that ChalleNGe enlistees evidence higher levels of behavioral separations than HSDGs, especially after the 12-month mark. (At the 3-month mark, ChalleNGe enlistees and HSDGs have about the same rate of separation for behavioral reasons.)
While all of these separation codes may not indicate behavioral problems in all instances, they do as a group suggest problems adjusting to military life, as opposed to injury, disability, fraudulent entry, parenthood, or other common reasons for separation.
These data are consistent with ChalleNGe enlistees struggling with the adaptation to military life after bootcamp. Compared with other enlistees, ChalleNGe graduates may find bootcamp relatively familiar territory, but they seem to get into trouble after bootcamp when they have more freedom. This pattern has been observed among other nongraduates as well.
Based on these data, we recommend that ChalleNGe programs encourage mentors to keep in touch with enlistees beyond the 12-month mark.

29
How many ChalleNGe participants enlist?
0200400600800
100012001400160018002000
1999 2000 2001 2002 2003 2004 2005 2006 2007 2008
Enlistees Graduate Enlistees
Next, we begin to examine the matched DMDC file. The slides preceding this one use the longitudinal file because our purpose was to compare performance of ChalleNGe enlistees with that of other enlistees. However, these slides include only those whose official education credential indicates that they participated in ChalleNGe. As we detail here and elsewhere, many ChalleNGe enlistees have other education credentials on their records. Therefore, we use the matched file to help us estimate the total number of ChalleNGe participants who have enlisted, as well as to perform other analyses.
The graph above shows how the number of ChalleNGe enlistees has changed over time. The top (lighter-colored) line indicates the total number of ChalleNGe participants who enlisted, including graduates and nongraduates. The bottom line indicates the number of ChalleNGe graduates who enlist. Each line is based on the DMDC matched file and thus includes ChalleNGe participants regardless of their official education credential. The lines follow the same general pattern; the total peaked in FY04, the last year in which the ChalleNGe credential was considered Tier 1 under the 5-year pilot program.
The majority of ChalleNGe graduates who enlist join the Army; this has been true since 2004 but the trend has accelerated somewhat in recent years. This is probably because many ChalleNGe Army enlistees enter through the GED Plus program; in some cases, this program provides ChalleNGe enlistees with opportunities to qualify for enlistment bonuses normally available only to those with Tier 1 credentials.

30
Education credentials of ChalleNGe enlistees
ChalleNGe + GED HSDG GED Dropout Other Tier1 Other TIer2/3
The chart above indicates the distribution of education credentials held by ChalleNGe graduates who enlist. The majority of ChalleNGe graduates have official records that indicate their status as ChalleNGe graduates, but a sizable proportion of them have a different credential. The second most common credential is a high school diploma; this is not surprising since several ChalleNGe programs award HSDGs. (Indeed, descriptive statistics indicate that most ChalleNGe graduates in this category did attend programs that award an HSDG.) Nearly three-quarters of ChalleNGe enlistees have a ChalleNGe credential or an HSDG. For whatever reason, about 10 percent have a GED as their official credential. Small proportions have other Tier 1 credentials (most often “completed one semester of college”) or other Tier 2/3 credentials, and a very small number are listed as dropouts.
This slide demonstrates that DMDC files underestimate the true number of ChalleNGe graduates who enlist. This is not due to data errors but simply due to the fact that many ChalleNGe graduates legitimately enlist with a non-ChalleNGe education credential. To accurately track the number of ChalleNGe graduates in the military requires matching ChalleNGe program data to the DMDC files, as we have done here; relying only on the DMDC files would exclude those ChalleNGe graduates who enlist with other credentials.

31
Total number of ChalleNGe enlistees over time
• Number of ChalleNGe graduates who have enlisted, FY99-FY08: ~ 12,000
• Number of ChalleNGe participants (graduates and nongraduates) who have enlisted, FY99-FY08: ~14,000
Our matched DMDC dataset included information on 10,057 ChalleNGe enlistees (graduates and terminates) who enlisted during FY99 through FY08. Of these, 8,671 (abut 86 percent) were ChalleNGe graduates. However, we know that the true number of ChalleNGe graduates who enlist is higher than 8,671 because some of the program data include incomplete or incorrect SSNs.
We estimate the total number of ChalleNGe graduates who enlisted as follows: Our longitudinal dataset indicated that 7,074 enlisted with ChalleNGe credentials in the FY99-FY08 period. In theory, all 7,074 should have been in our matched DMDC dataset (along with those who enlisted with other credentials). However, our matched dataset included only 5,104 who enlisted with a ChalleNGe credential. Based on this, we believe the undercount due to incorrect or incomplete SSN data is roughly 28 percent; put another way, this indicates that we have incorrect SSN information on about 1,970 enlistees. Therefore, we assume that the 8,671 figure is undercounted by the same amount; based on this, we estimate that roughly 12,000 ChalleNGe graduates enlisted between FY99 and FY08. If we assume that 86 percent of ChalleNGe participants who enlist are graduates, this suggests that roughly 14,000 ChalleNGe participants enlisted over the FY99-FY08 period.
We discuss more details of these two datasets in appendix B. Next, we continue to detail the performance of ChalleNGe participants in the military.
32
Completing ChalleNGe is associated with lower attrition
0
10
20
30
40
50
60
3-month 12-month 24-month 36-month
ChalleNGe graduates ChalleNGe terminates
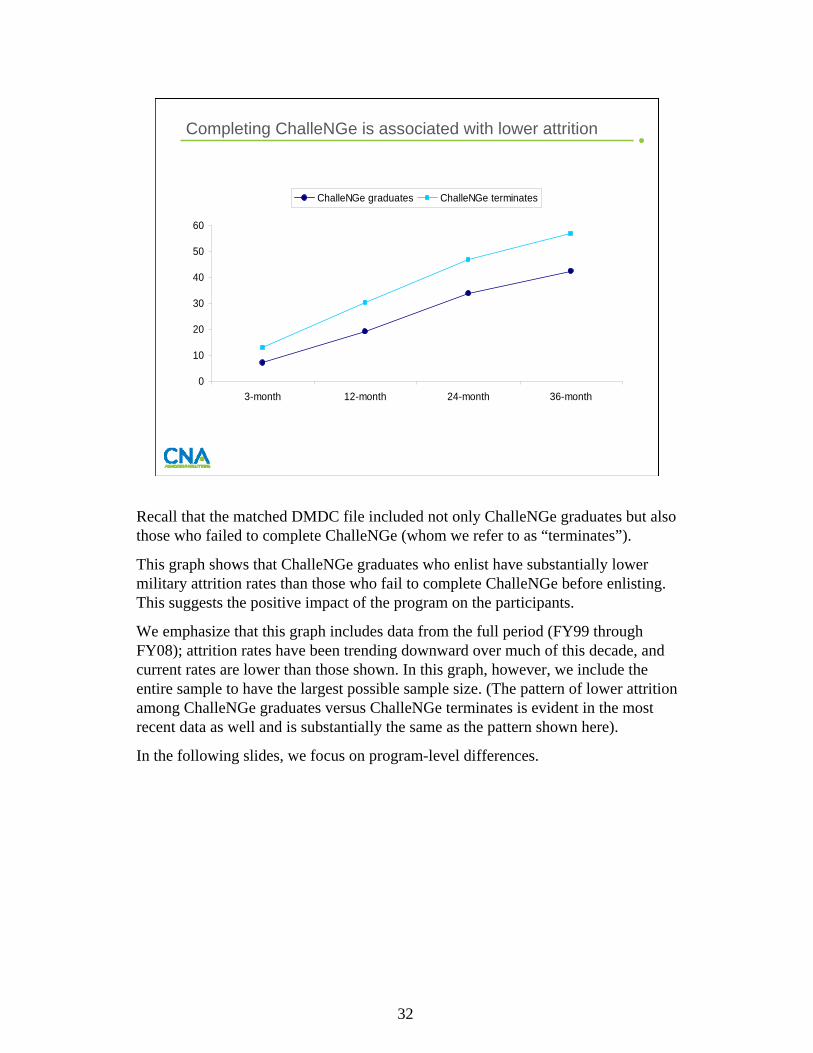
Recall that the matched DMDC file included not only ChalleNGe graduates but also those who failed to complete ChalleNGe (whom we refer to as “terminates”).
This graph shows that ChalleNGe graduates who enlist have substantially lower military attrition rates than those who fail to complete ChalleNGe before enlisting. This suggests the positive impact of the program on the participants.
We emphasize that this graph includes data from the full period (FY99 through FY08); attrition rates have been trending downward over much of this decade, and current rates are lower than those shown. In this graph, however, we include the entire sample to have the largest possible sample size. (The pattern of lower attrition among ChalleNGe graduates versus ChalleNGe terminates is evident in the most recent data as well and is substantially the same as the pattern shown here).
In the following slides, we focus on program-level differences.

33
Program-level differences
• Past research found substantial differences across ChalleNGe programs in terms of:– Graduation rates– Characteristics of cadets
AgeGender, ethnicityInitial preparation (i.e., TABE scores)
– Characteristics of the programMilitarizationSteps cadets follow before withdrawingTiming of drug tests
– Military enlistment rates– Military performance among enlistees
In this section, we use the matched DMDC dataset to explore the extent to which program-level differences show up in the military performance of enlistees. Our earlier analysis indicated that program-level differences are quite important in understanding graduation rates (see slides on pgs. 9-16). In this section, we test to see whether those differences carry through to first-term military performance when we examine attrition rates of ChalleNGe graduates using our DMDC matched data sample.

34
Program-level differences remain
0
10
20
30
40
50
60
AK AR AZ CB CC CLCM FG FL FS GL HI IL KY
MD MIMS MT NC NJ
NM OK SL TX VA WIWV
3-mo 12-mo 36-mo 3-mo avg 12-mo avg 36-mo avg
As this slide indicates, program-level differences persist into the first term of those ChalleNGe graduates who enlist. These findings are quite consistent with our past analyses (see McHugh and Wenger, 2008). As when we examined data from earlier years, we see here that there is substantial dispersion around the means; graduates from some programs perform much better in terms of attrition, on average, than graduates of other programs.
Earlier slides indicated that specific program-level characteristics were tied to differences in graduation rates. Next, we examine one program-level difference in particular and test the hypothesis that it may explain some of the variation evident in the slide above.

35
Graduates from more militaristic programs perform better
05
101520253035404550
3-mo 12-mo 36-mo
"High" "Average"
3-month difference significant at < 1 percent; 12-month difference significant at 6 percent; 36-month difference insignificant.
This slide indicates the average attrition rates of ChalleNGe graduates who enlisted; we have divided the graduates based on the level of militarism in the ChalleNGe program they attended.
The militarism measure is based on survey data we collected in early 2008. Among other questions, we asked ChalleNGe Directors, Deputy Directors, and staff to indicate the level of militarism at their program. Potential answers included, “the least amount of militarization possible under the ChalleNGe program,” “an average degree of militarization,” and “a high degree of militarization.” We used program-level averages in this analysis.
The results above indicate that the level of militarization has effects not only on the graduation rate (as shown in earlier slides) but also on the eventual military performance of those ChalleNGe cadets who go on to enlist. Consistent with other evidence, this suggests that the military aspect of the ChalleNGe program is one fundamental element of the program’s success.
Note that the size of the effect diminishes over time. The effect is largest in bootcamp; by 36 months, the difference is both small and statistically insignificant. Our measure of militarization is a snapshot in time, while our attrition data include information from a much longer period. This could explain some of the difference in effect size between 3 and 36 months, if the militarization levels of programs change over time.

36
Grads from more militaristic programs perform better (cont.)
05
101520253035404550
3-mo 12-mo 36-mo
"High" "Average"
3-month difference significant at < 1 percent; 12-month difference significant at 6 percent; 36-month difference insignificant.
We also tested other program elements in our regression results. (Note that regressions also included gender, ethnicity, marital age, AFQT score, branch, and fiscal year of enlistment, as well as ChalleNGe TABE and physical fitness scores; also, we clustered the errors at the program level but did not include specific program-level fixed effects in this model due to collinearity with militarism and other aspects of the survey.) We also included indicators of drug testing in the first week and experimented with random versus non-random platoon assignment and steps required to leave the program. While all of these variables were significant predictors of graduation, only militarization has a consistent effect on military performance; the effects of the others seem to be contained within the ChalleNGe program. They may have indirect effects in terms of increasing graduation rate, for example, but no direct effects on military performance of ChalleNGe enlistees.
We note that no program indicated “the least amount of militarization possible.” Our results are essentially unchanged if, instead of using this variable, we use either the degree of militarization variable based only on responses of Directors or a measure of militarization that is a function of one of the following:
• The degree of militarization
• A variable indicating that male cadets were required to shave their heads or maintain military haircuts
• A variable indicating that physical training was used as a disciplinary tool.

37
Conclusions
• Program-level effects:– In general, program-level effects are consistent across cadets, regardless of
gender, neighborhood income level, or urbanicity– The militarism of the ChalleNGe model is an important element of the program’s
success with all cadets– Our results suggest that (a) there are substantial peer effects within the program
and (b) programs that make it somewhat easier for cadets to leave actually produce higher graduation rates
• Geographic analysis on completion rates:– Many ChalleNGe programs draw cadets from areas with very low high school
completion rates• Attrition analysis:
– Attrition rates of ChalleNGe graduates continue to decrease over time– Program-level differences, however, remain– ChalleNGe graduates are more likely than other enlistees to separate
prematurely for behavioral reasons– Graduates from more militaristic ChalleNGe programs have better military
performance
This slide briefly details our main findings. The following slides discuss the implications of these findings in more detail.

38
Implications
• There is no evidence that the ChalleNGe model should be adjusted based on demographics of cadets
• Evidence suggests that the militarism of the ChalleNGe model is one of its strengths, improving both graduation rates and eventual militaryperformance
• Our results suggest that releasing cadets who wish to leave the program with minimal bureaucracy may improve overall graduation rates
• Reexamining the drug testing program could yield positive results; in particular, those programs that do not test in the first week have higher graduation rates
• With other results, the result that nonrandom platoon formation is associated with higher graduation suggests the importance of peer effects in ChalleNGe
• We recommend that programs ask mentors or staff to stay in touch with graduates who enlist beyond the 12-month mark because ChalleNGe enlistees often struggle during the second and third years of enlistment
Our results indicate that, although the magnitude of effects can differ depending on the gender and background of cadets, differences are small; in general, the ChalleNGe model seems to work reasonably well with cadets from a variety of backgrounds. In this vein, we find evidence in the program data and the DMDC data that the militarism of the program is one of it strengths. Programs with higher levels of militarism have higher graduation rates, and the graduates of those programs who enlist have lower military attrition rates.
Programs also differ in the way they deal with cadets who wish to drop out of the ChalleNGe program. Specifically, there are variations between the programs in the number of steps a cadet who wishes to leave has to follow in order for that cadet to be released from the program. Our results indicate that the programs with relatively more steps actually have lower graduation rates overall, suggesting that cadets who are deterred from leaving are unlikely to complete the program and that they are likely to have a negative influence on their peers. This negative influence could be direct or indirect; the second could occur if these cadets take up so much of the program staffers’ time that staffers are unable to foresee problems developing among other cadets.
Programs that test for drugs in the first week have lower overall graduation rates than programs that test for drugs in later weeks. This suggests that some cadets who test positive in the first week would otherwise successfully complete the program. We suspect this result occurs because of the relatively long time required to process marijuana (or the compound that is the focus of marijuana drug tests, THC). Of course, ChalleNGe programs cannot tolerate any drug use by enrolled cadets, but to the extent that cadets are testing positive due to drug use that took place before entering the program, it may be worth reconsidering or standardizing this policy.

39
The positive effect of nonrandom platoon formation is intriguing. Since this effect shows up among female cadets as well as male cadets, we believe that platoon formation is correlated with some other unmeasured program-level difference. This, too, could be a measure of peer effects.
Finally, our military data indicate that attrition rates of ChalleNGe graduates who enlist continue to decline over time. This is testimony to the hard work of ChalleNGe staff in preparing cadets for schools, jobs, and the military. However, we are concerned by the relatively high levels of “behavioral” separations within the first term of military service. The problem seems to occur between bootcamp and the third year of service, after cadets have completed the relatively structured world of bootcamp and have gained additional freedom. We recommend that ChalleNGe programs ask mentors or staff members to stay in touch with those who enlist for longer than the usual 12 months.

40
This page intentionally left blank.

41
Appendix A: Details on ZIP code data
This appendix includes additional information on the ZIP code data we use to calculate the completion rates of the school districts ChalleNGe cadets formerly attended.

42
Appendix A: Details on ZIP code data (cont.)
Note: States without any bars did not have any missing completion data.
0.0
5.0
10.0
15.0
20.0
25.0
30.0
AK AL AR AZ CA DC FL GA IL IN KY LA MD MI MS MT NC NJ NM OK OR SC TX VA WI WV WY
State
Perc
enta
ge m
issi
ng c
ompl
etio
n da
taPercentage of ZIP code areas missing completion dataPercentage of state 16- to 18-year-old population missing completion data
We were not able to calculate completion rates for all ZIP codes. The file that mapped ZIP codes to school districts contained 29,849 ZIP code areas, corresponding to 63,571 school districts. Of 27 ZIP code areas that could not be mapped to the 2000 Decennial Census, 25 were located in Georgia (out of a total of 693 ZIP code areas in Georgia in the mapping file). Another 1,051 ZIP code areas did not contain completion data for all of the districts making up that ZIP code area. We illustrate missing data both as the percentage of ZIP code areas in a state missing completion data and as the percentage of 16- to 18-year-olds in the state living in ZIP code areas missing completion data.
Arizona, Kentucky, Oregon, Texas, and Wyoming have the most missing data. In Arizona and Texas, the percentage of ZIP code areas missing completion data is higher than the percentage of 16- to 18-year-olds missing completion data. Thus, the ZIP code areas missing data are below average in terms of youth population. Missing data pose a particular problem in Arizona; more than 25 percent of ZIP code areas were missing completion data, corresponding to just over 10 percent of the 16- to 18-year-old population.
In Oregon, Kentucky, and Wyoming, the percentage of ZIP code areas missing data is less than the percentage of 16- to 18-year-olds missing data, meaning that the missing ZIP codes are, on average, more populous than the average ZIP code area. Oregon has the most missing data in this group; around 8 percent of ZIP code areas were missing completion data, or about 10 percent of the 16- to 18-year-old population.
Care should be taken in interpreting results from Arizona and Oregon because of the missing data.
43
Appendix A: Details on ZIP code data (cont.)
0.0
5.0
10.0
15.0
20.0
25.0
30.0
35.0
40.0
45.0
50.0
AK AL AR AZ CA DC FL GA HI IL IN KY LA MD MI MS MT NC NJ NM OK OR SC TX VA WI WV WY
State
Perc
enta
ge o
f Cha
lleN
Ge
parti
cipa
nts
Missing ZIP code data ZIP code area is not contained in mapping datasetZIP code area does not have completion data
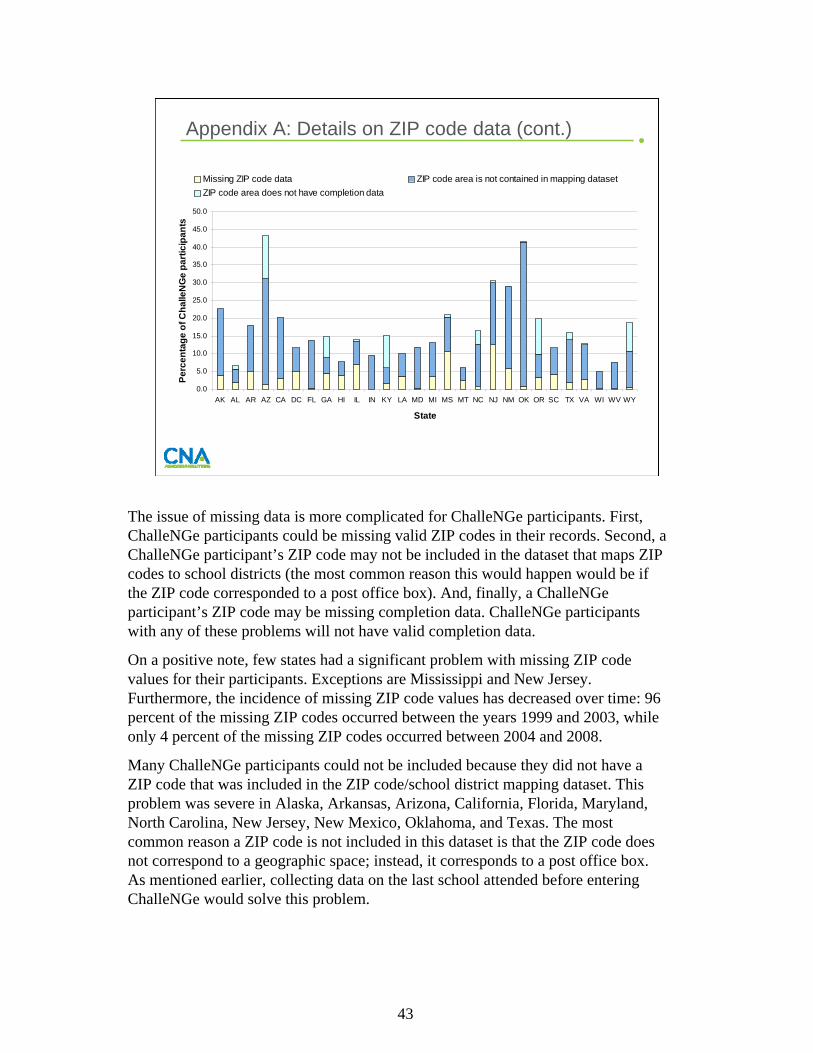
The issue of missing data is more complicated for ChalleNGe participants. First, ChalleNGe participants could be missing valid ZIP codes in their records. Second, a ChalleNGe participant’s ZIP code may not be included in the dataset that maps ZIP codes to school districts (the most common reason this would happen would be if the ZIP code corresponded to a post office box). And, finally, a ChalleNGe participant’s ZIP code may be missing completion data. ChalleNGe participants with any of these problems will not have valid completion data.
On a positive note, few states had a significant problem with missing ZIP code values for their participants. Exceptions are Mississippi and New Jersey. Furthermore, the incidence of missing ZIP code values has decreased over time: 96 percent of the missing ZIP codes occurred between the years 1999 and 2003, while only 4 percent of the missing ZIP codes occurred between 2004 and 2008.
Many ChalleNGe participants could not be included because they did not have a ZIP code that was included in the ZIP code/school district mapping dataset. This problem was severe in Alaska, Arkansas, Arizona, California, Florida, Maryland, North Carolina, New Jersey, New Mexico, Oklahoma, and Texas. The most common reason a ZIP code is not included in this dataset is that the ZIP code does not correspond to a geographic space; instead, it corresponds to a post office box. As mentioned earlier, collecting data on the last school attended before entering ChalleNGe would solve this problem.
44
Appendix A: Details on ZIP code data (cont.)
0.0
5.0
10.0
15.0
20.0
25.0
30.0
35.0
40.0
45.0
50.0
AK AL AR AZ CA DC FL GA HI IL IN KY LA MD MI MS MT NC NJ NM OK OR SC TX VA WI WV WY
State
Perc
enta
ge o
f Cha
lleN
Ge
parti
cipa
nts
Missing ZIP code data ZIP code area is not contained in mapping datasetZIP code area does not have completion data
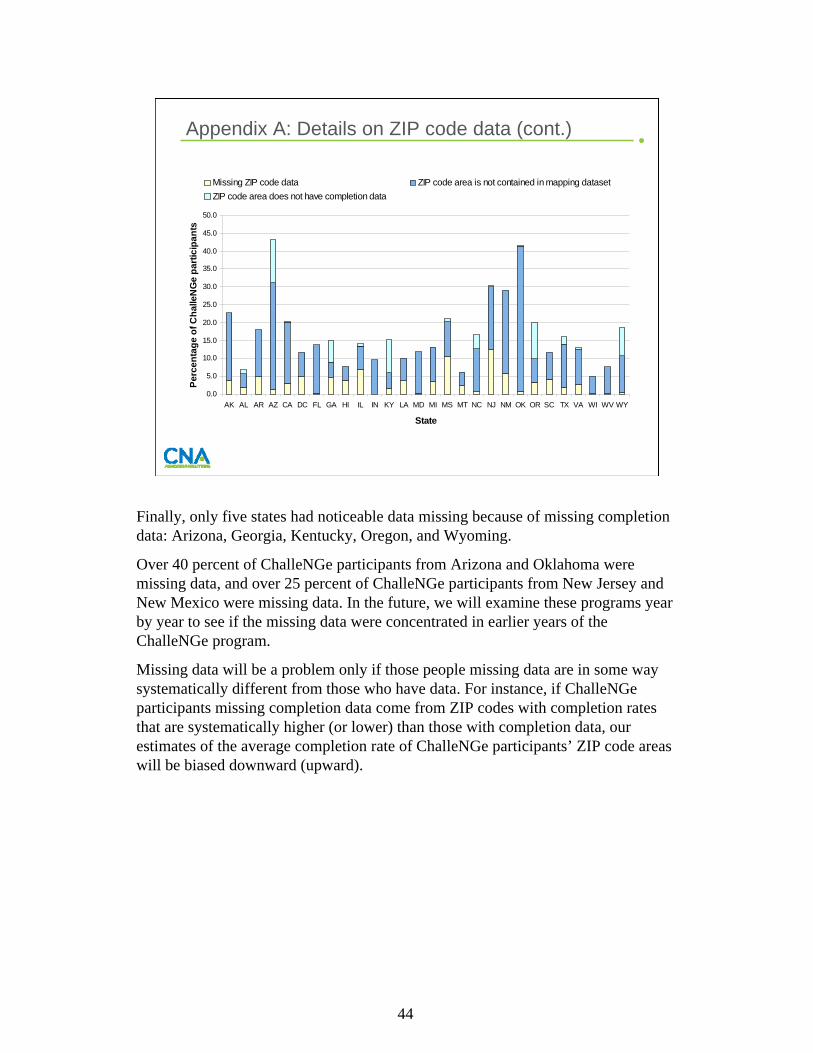
Finally, only five states had noticeable data missing because of missing completion data: Arizona, Georgia, Kentucky, Oregon, and Wyoming.
Over 40 percent of ChalleNGe participants from Arizona and Oklahoma were missing data, and over 25 percent of ChalleNGe participants from New Jersey and New Mexico were missing data. In the future, we will examine these programs year by year to see if the missing data were concentrated in earlier years of the ChalleNGe program.
Missing data will be a problem only if those people missing data are in some way systematically different from those who have data. For instance, if ChalleNGe participants missing completion data come from ZIP codes with completion rates that are systematically higher (or lower) than those with completion data, our estimates of the average completion rate of ChalleNGe participants’ ZIP code areas will be biased downward (upward).

45
Appendix A: Details on ZIP code data (cont.)
• Between 2007 and 2008, the percentage of ChalleNGe participants who came from low-completion-rate ZIP code areas increased by 12.9 percentage points
• This could be due to either a change in distribution of studentsbetween programs or a change in completion rates
• We examined the change in completion rates between programs with data in both 2007 and 2008– Alaska, Alabama, District of Columbia, Louisiana, Michigan, New
Jersey, Oregon, South Carolina– Increase of 3.9 percentage points between participants in these
programs coming from low-completion-rate areas from 2007 to 2008Biggest increase was Alaska (6.5 percentage points)Biggest decrease was Michigan (6.3 percentage points)
– It was more likely in 2007 than in 2008 that a ChalleNGe participant came from a state with the completion rate trending upward
From 2007 to 2008, we noticed an increase of almost 13 percentage points in the percentage of ChalleNGe participants from low-completion-rate ZIP code areas. This could be due to either a change in the distribution of ChalleNGe students between programs (i.e., in 2008 more ChalleNGe participants may be found in states or areas with a large number of noncompleters) or a decrease in completion rates in U.S. high schools overall. To get an idea of which is driving the change, we examined the change in completion rates between programs with data both in 2007 and 2008. We found that the percentage of ChalleNGe students who came from low-completion ZIP code areas increased by 3.9 percentage points in these states. The state with the largest increase was Alaska, while the state with the largest decrease was Michigan. This overall increase between states was tempered by a decrease in the representation of states that saw a decrease in completion rates. In 2007, 81 percent of the participants from these states came from states that saw a decrease in completion rates in 2008. In 2008, 73 percent of the participants from these states came from states that saw a decrease in completion rates in 2008. Thus, the increase in 2008 is mainly due to the programs with data in 2008, not to a large increase in the percentage of ChalleNGe students coming from low-completion ZIP code areas.

46
This page intentionally left blank.

47
Appendix B: Quality of the matchThis appendix includes details about our procedures for cleaning the DMDC datasets, as well as details about the number of ChalleNGe participants in each category. We base our estimates on the total number of ChalleNGe enlistees (see slide on pg. 31).
The longitudinal DMDC dataset includes data on all non-prior-service enlistees from FY99 to FY08 holding one of the following credentials: traditional high school diploma (HSDG), GED, and ChalleNGe completion plus a GED. The dataset includes those who enlisted in the Army, Navy, Air Force, or Marine Corps. This group numbers about 1.51 million. We deleted those whose records indicated an age below 17 or above 40 (182 observations) and those whose AFQT percentile was listed as 0 (4451 observations). We consider those who completed their contracts not to be attrites; for example, those who had 2-year contracts and left at the 24-month mark are not considered to have attrited. Also, those who left the enlisted forces for Officer Commissioning Programs or Service Academies are not considered to have attrited; finally, those who died while enlisted are not considered to have attrited. During this time period, about 5,800 enlistees entered Officer Commissioning Programs or Service Academies; roughly 5,000 died. Note that, in some cases, we do not have complete information on performance; for example, we do not have 36-month attrition rates for those who enlisted in FY06 or later.
Description of matched DMDC data: We requested that DMDC match our list of SSNs of all ChalleNGe participants with their non-prior-service active duty accession files. The file that DMDC returned to us included information on the performance of each ChalleNGe participant who eventually enlisted. There are several important points to recognize about these files. First, we included every person in the ChalleNGe program files; therefore, our matched sample initially included some who expressed an interest in, but did not actually enter, ChalleNGeand eventually enlisted. Second, the quality of this match is by definition limited by the quality of the SSN data in the ChalleNGe program files. We have expressed reservations about these data in the past . While we believe that the quality of the SSN data has improved over time, there are still problems within some programs. Our examination of the data reveals that some programs enter obviously incorrect Social Security Numbers for some or all participants. Therefore, the number of ChalleNGe enlistees is surely an underestimate of the true number. However, many ChalleNGe enlistees do not enlist with a ChalleNGe credential (because, for example, their program awards a high school diploma). Therefore, this method of matching provides the only way to track the true number of ChalleNGe enlistees.

48
Our DMDC matched sample initially included information on 14,690 ChalleNGe participants who enlisted in the Army, Navy, Air Force, or Marine Corps. We dropped those whose AFQT scores were listed as the 0th percentile (33 observations). We deleted the 56 enlistees from Puerto Rico because we do not have comparable civilian data on Puerto Rico. We coded attrition exactly as we did for the longitudinal sample (see previous slide); among ChalleNGe participants, 9 were listed as having entered Officer Commissioning Programs or Service Academies and 65 were listed as deceased. We also dropped those who came through ChalleNGe programs in 1998 or earlier (1,928 observations) since the program records from that era are incomplete. At the end of this cleaning process, we were left with 12,673 observations on ChalleNGe participants who enlisted; our data include information on their program, status, and military performance. We further note that of these 12,673 enlistees, 2,616 are listed in the ChalleNGe program data but never actually entered a ChalleNGe program. Of the 10,057 who entered a ChalleNGe program and eventually enlisted, 86 percent graduated from ChalleNGe. Thus, the vast majority of ChalleNGe cadets who enlist successfully complete ChalleNGe first. We base most of our analysis on this group of 10,057 who actually entered a ChalleNGe program and eventually enlisted.
While past analysis indicated that ChalleNGe enlistees with a high school diploma performed better than those who enlisted with a ChalleNGe credential, this pattern no longer holds; today, those enlisting with a ChalleNGe credential actually have slightly lower attrition rates than ChalleNGe enlistees who enlist with a HSDG. Thus, the undercounting caused by incomplete matches is not likely to underestimate the performance of ChalleNGe enlistees.
More details on the program-level data used in slides on pgs. 34 and 35: Some programs had too few observations on graduates who enlisted to be included in this section of the analysis. Specifically, we do not include the Washington, Oregon, Puerto Rico, Alabama, and Wyoming programs. Most of these programs are relatively new. The Oregon program, while not new, has a very low match rate with the DMDC data; in fact, there were 0 matches. We believe it unlikely that no ChalleNGe participants from Oregon have enlisted; rather, we suspect the quality of the SSN data.

49
Appendix C: Program survey results
Program Degree of Steps required Random assignment Drug testing Year programmilitarization1,2 to leave1 to platoons in first week began
Alaska Military Youth Academy 2.4 4.4 Yes No 1994
Arkansas National Guard Youth ChalleNGe Academy 2.0 5.3 No Yes 1993
California Grizzly Youth Academy 2.0 4.3 N/A N/A 1998
Florida Youth ChalleNGe Academy 2.5 4.7 No Yes 2001
Georgia-Fort Gordon Youth ChalleNGe Academy 2.8 5.5 No No 2000
Georgia-Fort Stewart Youth ChalleNGe Academy 2.6 4.8 No No 1993
Hawaii National Guard Youth ChalleNGe Academy 2.3 6.0 No Yes 1994
Illinois Lincoln's ChalleNGe Academy 2.0 4.2 Yes No 1993
Kentucky Bluegrass ChalleNGe Academy 2.0 3.6 Yes Yes 1999
Louisiana-Camp Beauregard Youth ChalleNGe Program 2.4 4.0 No No 1993
Louisiana-Camp Minden Youth ChalleNGe Program 2.3 3.0 Yes No 2002
Louisiana-Gillis Long Youth ChalleNGe Program 3.0 5.5 N/A Yes 1999
Maryland Freestate ChalleNGe Academy 2.0 3.3 No Yes 1993
Michigan Youth ChalleNGe Academy 2.5 4.3 No Yes 1999
Montana Youth ChalleNGe Program 2.0 5.9 No No 1999
New Jersey Youth ChalleNGe Academy 2.0 4.0 Yes Yes 1994
New Mexico Youth ChalleNGe Academy 2.8 5.5 Yes No 2001
North Carolina Tarheel ChalleNGe Academy 2.6 5.2 No Yes 1994
1 Responses are averaged across all respondents.2 1=Low, 2=Medium,3=High
Response to survey
This appendix indicates the average responses to select survey questions, by ChalleNGe program.

50
Appendix C: Program survey results (cont.)
Program Degree of Steps required Random assignment Drug testing Year programmilitarization1,2 to leave1 to platoons in first week began
Oklahoma Thunderbird Youth Academy 2.6 4.2 Yes No 1993
Oregon National Guard Youth ChalleNGe Program 2.5 4.3 No No 1999
Puerto Rico Youth ChalleNGe Program 1.7 4.8 Yes Yes 1999
South Carolina-Camp Long Youth ChalleNGe Academy 2.3 3.5 Yes No 2002
South Carolina-Columbia Youth ChalleNGe Academy 2.5 4.5 No No 1998
Texas Seaborne ChalleNGe Corps 2.0 4.8 Yes No 1999
Virginia Commonwealth ChalleNGe Program 3.0 5.3 Yes No 1994
West Virginia Mountaineer ChalleNGe Academy 3.0 3.3 Yes Yes 1993
Wisconsin National Guard ChalleNGe Academy 2.0 2.8 No Yes 1998
Wyoming Youth ChalleNGe Program 2.0 5.0 Yes No 2006
1 Responses are averaged across all respondents.2 1=Low, 2=Medium,3=High
Response to survey


4825 Mark Center Drive, Alexandria, VA 22311-1850 703-824-2000 www.cna.org
CAB D0019577.A2/Final