challenges building online gis services to support …
TRANSCRIPT

Biodiversity Informatics, 2, 2005, pp. 56-69
56
CHALLENGES BUILDING ONLINE GIS SERVICES TO SUPPORT GLOBAL BIODIVERSITY MAPPING AND ANALYSIS: LESSONS FROM THE
MOUNTAIN AND PLAINS DATABASE AND INFORMATICS PROJECT
ROBERT GURALNICK1,2 AND DAVID NEUFELD1 1University of Colorado Museum, 2Department of Ecology and Evolutionary Biology, University
of Colorado, Boulder, CO 80309 USA
Abstract.—We argue that distributed mapping and analysis of biodiversity information becoming available on global distributed networks is a lynchpin activity linking together research and development challenges in biodiversity informatics. Online mapping is key because it allows users to explore the spatial context of biodiversity information visually and assemble quickly the datasets needed to ask and answer biodiversity research and management questions. We make the case that free, online, global biodiversity mapping tools utilizing distributed species’ occurrence records are now within reach, and discuss how such a system can be built using existing technology. We also discuss additional technological and sociological challenges and solutions, given experiences building a regional distributed GIS tool called MaPSTeDI (Mountain and Plains Spatio-Temporal Database and Informatics Initiative). We focus on solutions to 3 technology challenges: returning result queries in a reasonable amount of time given network limitations; accessing multiple, heterogeneous data sources using different transmission mechanisms; and scaling from a solution for a handful of data providers to hundreds or thousands of providers. We also discuss future challenges and potential solutions for integrating analysis tools into online mapping applications. We close with a discussion of sociological impediments and potential community solutions for biodiversity mapping endeavors. Key words.—Heterogeneous geospatial data, Global biodiversity mapping, MaPSTeDI, online GIS, distribution modeling, species’ occurrence datasets.
Biologists are increasingly approaching a set of
very complex questions related to current, past, and future geographic distribution of genes, organisms and ecosystems from a spatial ecological and evolutionary perspective (Crisci, 2001). To approach these questions, researchers need tools to assist in acquiring and synthesizing biodiversity and environmental data. The biodiversity informatics community has realized the importance of making data available, and the amount and diversity of datasets continues to increase and become more readily accessible over the Internet. As these data have become available, it has become clear that an equally crucial challenge is that of building tools for data synthesis and analysis. Ultimately, such work achieves a major biodiversity informatics goal: a standards-based global computing infrastructure to allow rapid, real-time discovery, access, visualization, interpretation, and analysis of biodiversity information (Wilson 1992; Brisby 2000; Krishtalka and Humphrey 2000; Sugden and Pennisi 2000). Meeting the challenge is particularly crucial given the accumulating evidence of accelerating
biodiversity and habitat loss1 caused by human impacts on the environment.
Much of the current work in the field of biodiversity informatics is geared towards overcoming one of the largest problems the biodiversity community faces – access to vast quantities of baseline biodiversity data locked away from the broader research and management communities. For example, natural history museums worldwide contain >3 x 10⁹ records of life--mostly plants and animals--representing one of the best sources of information on past and present biodiversity (Brisby 2000; Krishtalka and Humphrey 2000; Suarez & Tsutsui 2004). However, much of the information on species diversity and distributions has neither been digitized nor georeferenced, exists in different data formats, or cannot be aggregated or integrated with existing computer applications. For example, it is estimated that <5% of species’ occurrences are digitized, and far fewer have computer-readable geospatial coordinates associated with them (Beaman and Conn 2003).
1 http://www.biodiv.org/gbo/gbo-pdf.asp.

GURALNICK AND NEUFELD – DISTRIBUTED MAPPING SOLUTIONS FOR BIODIVERSITY ANALYSIS
57
In the correct format, data from natural history museums and local, regional and continental surveys could provide immensely valuable new data resources to the broader biodiversity community. Towards this end, projects such as the Mammal Networked Information System (MaNIS2, Stein and Wieczorek, 2004), HerpNet3, ORNIS4, and the Global Biodiversity Information Facility (GBIF) Biodiversity Data Portal5 are providing access to large, distributed species’ occurrence datasets. For example, GBIF, as of May 2005, provides access >70 x 106 specimen records through its data portal. The ultimate goal is to provide standardized, high quality, and easily usable data back to the community. Although these taxonomically focused efforts are critical for repurposing natural history data for biodiversity analyses, there are some limitations to broader use by the diverse community of scientists and managers who could benefit from the data. One impediment is that users must first accumulate the data on a local machine, in most cases taxon by taxon, and then convert the data into more usable formats for further analysis. Taxonomic foci also limit the likelihood that land resource managers and conservation planners, who are typically more interested in particular areas, will adopt these systems.
At the same time, several ongoing development projects aim to build tools to facilitate answering research questions in environmental biology. A general overview of available approaches and early tools is available from Stockwell6 (Stockwell 1997). Graham et al. (2004) have recently published on the subject of how biodiversity informatics tools are being applied to answer research questions.
Two areas of interest in the community have been ecological niche modeling (overviews in Peterson 2001; Soberón and Peterson 2004) and species richness and abundances estimates (Soberón et al. 2000; Ponder et al. 2001; Rahbek and Graves 2001; Petersen et al. 2003; Meier and Dikow 2004; Guralnick and Van Cleve 2005). Ecological niche modeling and species richness estimations both require coupling biodiversity
2 http://elib.cs.berkeley.edu/manis/. 3 http://www.herpnet.org/. 4 http://ornisnet.org/. 5 http://www.gbif.net/portal/index.jsp. 6 http://biodi.sdsc.edu/Doc/BIS/overview.html.
information--named species occurrences--with geographic and potentially environmental data, geographic information systems (GIS) and statistical approaches. Concurrent with methodological development has been production of a set of desktop and web-based tools. DesktopGARP7, web services like WhyWhere8, and hybrids currently under development like OpenModeller9 are freely available applications that allow users to perform their own niche model experiments. Although species richness estimations have yet to be built into web-based applications, desktop tools like EstimateS10, which provides biodiversity summary estimates, and DIVA-GIS11, which provides a GIS-based set of biodiversity analysis tools, are both already available. These tools provide the logic and some of the geographic data for performing analyses, but do not provide a means to accumulate and explore effortlessly existing, up-to-date, georeferenced biodiversity information available from computer networks.
At present, the communities of biodiversity informatics developers and users are working from two ends that will ideally converge in the middle. At one end are spatial research endeavors like ecological niche modeling and species richness estimations, and applications like DesktopGARP, that are built to help answer research or management questions. On the other end is infrastructure development to share biodiversity information, especially species’ occurrence datasets, over the Internet. We argue that the obvious bridge between infrastructure and research for the biodiversity informatics field is a global online distributed biodiversity mapping application. Such an application would utilize georeferenced data from multiple global distributed species’ occurrence databases using community data standards and mechanisms, and provide functionalities for exploring, exporting, and analyzing the data (all discussed below in more detail).
This mapping tool would remove many impediments that currently limit the utility of species occurrence data to the research community by allowing workers to perform spatial or text-
7 http://lifemapper.org/desktopgarp. 8 http://biodi.sdsc.edu/ww_home.html. 9 http://sourceforge.net/projects/openmodeller/. 10 http://viceroy.eeb.uconn.edu/estimates. 11 http://www.diva-gis.org/.

GURALNICK AND NEUFELD – DISTRIBUTED MAPPING SOLUTIONS FOR BIODIVERSITY ANALYSIS
58
Figure 1. Steps necessary to have natural history and survey collections data automatically displayable and analyzable in online GIS web services. In each case, data move from one structured format into another, represented by boxes during data translation and transmission.

Biodiversity Informatics, 2, 2005, pp. 56-69
59
based searches for the most up-to-date biodiversity information available. A user can delimit the taxonomic and spatial scale of the question that she wants to ask, and either run appropriate tests online or export the data for later analysis. We believe that online mapping simplifies the process of data exploration and ultimately lowers the cost barrier to analyses that have not yet been attempted, leading to potential novel research findings and wider use of the data by land managers and conservation planners.
Building online GIS web services to support biodiversity mapping is a major development challenge, and many steps are still in the process of being worked out now, or will need to be addressed in the future. We believe the following questions are the crucial ones that need to be answered in order to move forward on such an endeavor: 1. What methodology and tools should be used to
georeference the data? 2. How should data access and transmission be
addressed, so that an online, global-scale GIS can access appropriate biodiversity data?
3. How can a system be built that is efficient and fast enough for users to sort through the large amounts of data potentially available?
4. How can a distributed GIS be built that can handle heterogeneous data sources?
5. How can such a system present attribute data effectively, both in text form and on maps, with potentially billions of data points and thousands of repositories?
6. How can analysis tools be built into a web mapping application so that users can perform as many tasks as possible online and easily export datasets out of the online applications for further use on their desktops?
7. How can the community overcome potential sociological barriers to build such a tool most effectively?
Below, we organize our discussion of these
questions in order of tasks that need to be completed (summarized graphically in Figure 1). We first discuss the steps necessary to prepare data, including retrospectively georeferencing species records without explicit geospatial coordinates and ensuring that converted records are compliant with community data standards like DarwinCore2, Access to Biological Collections Data (ABCD), and TAPIR (all discussed in more detail below). We then discuss the challenge of building online
mapping applications that can access those distributed georeferenced records, and display them along with other heterogeneous data sources. Lastly, we discuss ways to link web-based analysis tools to online mapping applications in order to process biodiversity and environmental data and return summary spatial data. We base much of our discussion on our experiences developing an online biodiversity mapping application (MaPSTeDI; the Mountain and Plains Spatio-Temporal Database and Informatics Project12) at the University of Colorado Museum. We believe it is appropriate to use lessons learned developing the regional MaPSTeDI application to extrapolate towards a fully integrated global biodiversity mapping application, given that MaPSTeDI was built to scale to larger endeavors.
DATA PREPARATION NEEDED PRIOR TO BIODIVERSITY MAPPING
What Methodology and Tools Should be Used to Georeference the Data?
A major challenge for the natural history community has been to establish standards for the process of georeferencing collections data. Of the roughly 3 x 10⁹ specimens stored in the world’s natural history museums, <5% have been digitally catalogued or georeferenced (Beaman and Conn, 2003). Fortunately, progress is being made through an increasing number of projects that rely on manual and semi-automated techniques to assign geospatial coordinates to collection records based on the locality descriptions stored with the record; a process known as retrospective georeferencing (Murphey et al. 2004, Wieczorek et al. 2004). Current and past manual georeferencing projects include MaPSTeDI, MaNIS, and INRAM13.
Collaborations among biodiversity informaticians are leading to georeferencing protocols with standardized methods for determining both the spatial coordinates for a location and the error and uncertainty regarding the assigned points. One of the most complete guides to georeferencing natural history museum specimen occurrence data is available online from the MaNIS project14. This guide establishes a standard methodology with which to assign geospatial coordinates to historical locality descriptions which 12 http://www.mapstedi.org. 13 http://www.inram.org/. 14 http://elib.cs.berkeley.edu/manis/GeorefGuide.html.
GURALNICK AND NEUFELD – DISTRIBUTED MAPPING SOLUTIONS FOR BIODIVERSITY ANALYSIS
60
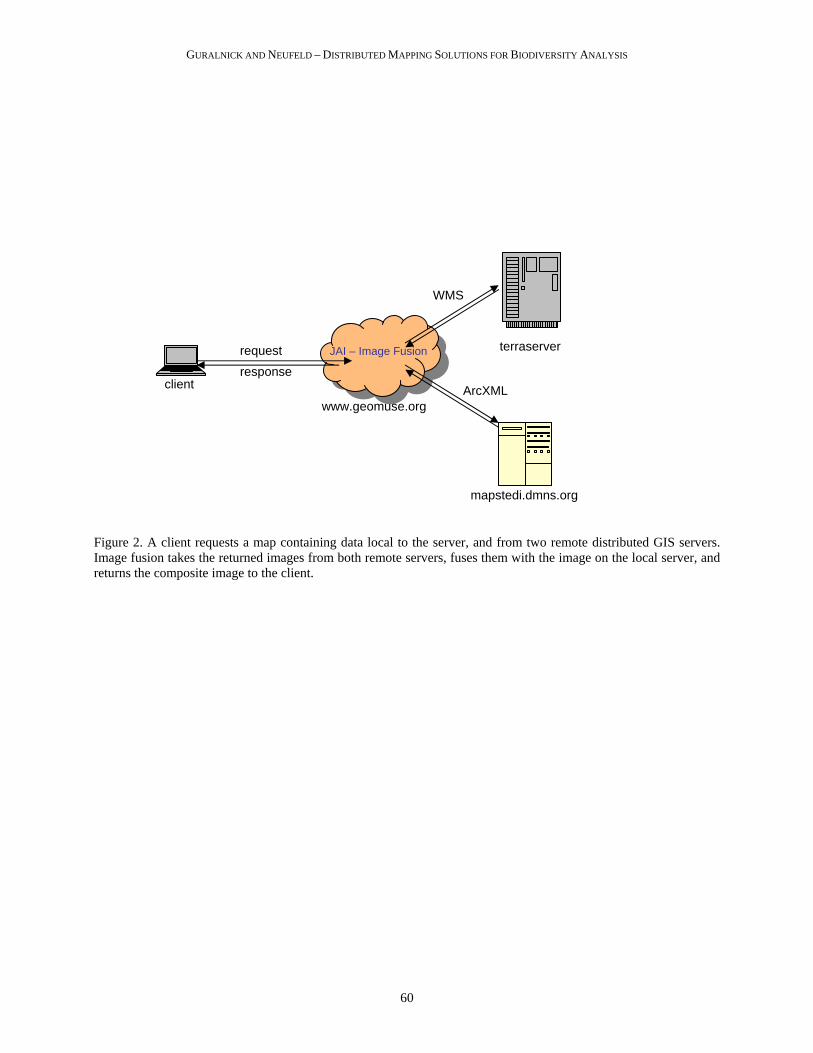
Figure 2. A client requests a map containing data local to the server, and from two remote distributed GIS servers. Image fusion takes the returned images from both remote servers, fuses them with the image on the local server, and returns the composite image to the client.
mapstedi.dmns.org
www.geomuse.org
client
request
WMS
ArcXML
JAI – Image Fusion
response
terraserver
Biodiversity Informatics, 2, 2005, pp. 56-69
61
oftentimes present unique challenges. These challenges include references in locality descriptions to place names which have since been renamed or eliminated from current gazetteers and maps, and changes in the physical geographic extent of referenced place names over time, for example the increasing boundaries of an urban area (Murphey et al. 2004). Perhaps most importantly, existing guidelines also establish a standard means to assign an uncertainty value or maximum error distance associated with geospatial coordinates. Recording uncertainty associated with the georeferencing process is critical if the data is to be effectively utilized in future spatially explicit analyses.
As further evidence of continued collaboration on protocols for georeferencing collections based on specimen occurrence data, a new initiative called BioGeomancer15 is currently in progress. The goal of this multi-institutional international collaborative project is to develop a next-generation web services-based georeferencing tool. The tool uses natural language processing techniques to perform locality text to spatial coordinate conversions for single or multiple records, calculate uncertainties, and provide visualization and automated analysis tools (e.g., outlier detection) for validation. The georeferences and original data will ultimately be returned in a format compliant with the Darwin Core 2 data standard discussed more fully below. How Should Data Access and Transmission Issues be Addressed for Online Mapping Applications?
A key challenge, as collections information continues to be digitized and georeferenced, is to make digital data more widely available by providing online access. A key component to sharing and eventually mapping biodiversity data is development of agreed upon standards (Figure 1 – community data standards) for accessing widely varying database structures, and associated metadata (Bowker, 2000). Progress in the natural history museum database community has led to relatively wide-scale adoption of standards like Darwin Core, and Darwin Core version 2, which has recently been proposed to the Taxonomic Database Working Group16 for adoption in 2005.
15 http://128.32.146.140/bgdev. 16 http://darwincore.calacademy.org.
Darwin Core is a specification of data and concepts to support access to biological collections data that encompasses relatively common concepts across biological databases, such as institutional metadata, and taxonomic, collecting event, and geospatial elements. While its relatively simple structure facilitates use in retrieving and combining data from multiple sources, it is not intended to serve as a data model for managing primary collections databases or specialized disciplinary data within the biodiversity informatics community.
The next challenge is how to transmit the data and information using those agreed-upon standards (Figure 1: shared registration and transmission protocols). The first major attempt at a distributed biodiversity network was the Species Analyst, which employed the searchable concepts found in Darwin Core and utilized the Z39.50 protocol. The original Z39.50 transmission protocol has been supplanted by a new open source application known as Distributed Generic Information Retrieval (DiGIR). DiGIR provides a standardized mechanism by which stewards of natural history collections can make collections information available over the Internet. The DiGIR software has two main components. The first is a provider package that allows an institution to link its data to a federated, XML-based natural history data schema (Darwin Core Version 2). The provider software interprets DiGIR requests in the form of XML documents sent to the provider, using HTTP as the transport protocol. The software then makes a native database query, creates an XML result set document and returns it to the requestor via HTTP. The second software package allows institutions to create a portal or central interface for querying a network of distributed DiGIR data providers. MaNIS and GBIF are two exemplars that have used DiGIR to establish portal access to collections of data providers.
While DiGIR implementations were coming online in North America, the European Union began using the BioCASe to access data from independent heterogeneous collections databases. BioCASe, like DiGIR, is a software application that uses an XML-based protocol and HTTP to search and retrieve distributed datasets. BioCASe differs from DiGIR in that it allows a provider to select a conceptual schema, most commonly the Access to Biological Collections Data (ABCD) schema. Because of these two different protocol

GURALNICK AND NEUFELD – DISTRIBUTED MAPPING SOLUTIONS FOR BIODIVERSITY ANALYSIS
62
Figure 3. MaPSTeDI’s implementation of the MVC2 design pattern. The user sends an XML request to the MaPSTeDI controller. The controller determines which objects are called to process requests from both local and distributed GIS services. GIS services respond with results that are then presented to the browser using JSP.

Biodiversity Informatics, 2, 2005, pp. 56-69
63
implementations, GBIF is sponsoring development of a new unified protocol (“TAPIR”), which when fully implemented will allow sharing distributed datasets across both the DiGIR provider and BioCASe provider software implementations (Doring and Giovanni 2004).
CHALLENGES IN DEVELOPING A GLOBAL ONLINE
BIODIVERSITY MAPPING APPLICATION We have argued that a global online
biodiversity mapping application is a lynchpin, but as-yet unrealized, endeavor in biodiversity informatics that links infrastructure development with research questions. The main goal of the MaPSTeDI project was to develop a proof-of-concept mapping application that could potentially link to other regional projects or itself scale to more global map applications. A secondary goal was to build the application to allow analysis tools to utilize the distributed datasets available in the application. The project ultimately provided us with a set of insights into how global biodiversity mapping applications should be built. We attempt to impart that hard-won knowledge gleaned from MaPSTeDI development to the larger question of how to build effectively a global biodiversity mapping application.
MaPSTeDI is a collaborative research project between the University of Colorado Museum (UCM), Denver Museum of Nature and Science (DMNS), and the Denver Botanic Gardens (DBG). It facilitated linking separate natural history collections data sets into one distributed biodiversity database accessible through an online mapping application. The project, which currently covers a 6-state region (Colorado, Montana, Nebraska, North Dakota, South Dakota, and Wyoming) in the United States, provides users with access to biodiversity data collected over the last 150 yr. To build the toolkit, we completed three main activities: (1) adding geospatial coordinates assigned from informal place information to existing collection databases following georeferencing procedures discussed above and in more detail in Murphey et al. (2004); (2) exporting data into a new spatial database based on the Darwin Core 2 data standard; and (3) linking distributed online databases to online mapping applications along with other distributed spatial reference layers.
The first step in our process (after georeferencing) was to load the data into a geospatial database that could be accessed by our online map server application. The geospatial database used in MaPSTeDI is based on the Darwin Core version 2 data model. A data conversion application was written that loaded the collections data from comma delimited text files, converted UTM coordinates into geographic coordinates (1983 North American datum), and loaded the data into the geospatial database. We used geographic coordinates here because they are well supported in DarwinCore 2, because our study region crossed multiple UTM zones, and because geographic coordinates are more appropriate if our regional focus eventually grows to a more global scale. Lastly, in order to link the spatial databases across institutions, we used geospatial multi-databases or database federations (Abel 1998), similar in concept to DiGIR but explicitly for spatial databases. The main advantage of this approach is the ability to allow institutions to continue to maintain and update their data locally while providing a mechanism to share and distribute the data through our online mapping application.
How to Build an Efficient Web Biodiversity Mapping Given Very Large Underlying Datasets?
We developed the mapping service to provide both image and tabular data, thus allowing users to explore data before downloading potentially large datasets. It is common knowledge within the GIS community (Peters 2005) that transporting spatial data across the network in images, as opposed to vector format, greatly reduces the amount of data transferred across the network. In this way online mapping applications permit end-users to preview smaller datasets from remote distributed servers by retrieving remote images from distributed GIS data providers, rather than requesting the full results in an uncompressed XML format. MaPSTeDI relied on Java’s Advanced Imaging (JAI) libraries to request georeferenced images of partner institutions’ specimen occurrence data and then to fuse seamlessly the combined georeferenced images together before displaying the results in the user’s browser (Figures 2-4). Other online mapping software packages, such as the University of Minnesota’s MapServer, also support access to distributed internet map servers by offering

GURALNICK AND NEUFELD – DISTRIBUTED MAPPING SOLUTIONS FOR BIODIVERSITY ANALYSIS
64
Figure 4. MaPSTeDI interface showing a fused, composite map image for Boulder County, Colorado made up of the following other images: an image created locally for UCM bird collections (orange dots) along with road (dark red) and river (light blue) layers; an image retrieved from a remote ArcIMS server at the DMNS using ArcXML showing all their collections (blue dots); and an image (topographic map) retrieved remotely from TerraServer-USA.com using WMS protocols. Tabular data are shown below the map, and records can be tagged and retrieved using tools above the map.

Biodiversity Informatics, 2, 2005, pp. 56-69
65
cascading map server support using the Open Geospatial Consortium’s (OGC) Web Map Service (WMS) specification.
What image fusion cannot do is to transmit efficiently descriptive attributes of geographic features across the network. To deal with this issue we limited users to previewing attributes in selected record sets to the first 50-300 records, with the option to load the next 50-300 once they had previewed the first set. Once a user decides that the data are of interest, they can all be downloaded in a compressed spatial data format that includes both spatial and tabular data. We believe that this approach represents one of the most efficient ways to support full access to data sets without compromising performance within the online mapping application. Alternative approaches to deal with the limitations of using uncompressed XML have been explored by the OGC and a report on a binary XML encoding specification has been drafted (Bruce 2003). We view transmission of attribute data as an ongoing implementation challenge that could be initially addressed by adding compression filters for provider software packages and decompression filters for portal applications. This approach would allow the community to continue to reap the benefits of using XML as a data exchange format, while significantly improving performance of these systems with minimal application development efforts. How to Build a Biodiversity Mapping Application
that Handles Heterogeneous Data Sources? The decision to use image fusion as the
primary means of transporting spatial data between institutions had the added benefit of allowing access to other distributed geographic datasets returning spatially referenced images. Such datasets are already available from multiple services (e.g., TerraServerUSA17), and include datasets such as the U.S. Geological Survey Digital Raster Graphics (DRGs) and Digital Ortho-photo Quadrangles (DOQs). Both datasets are useful reference layers in biodiversity studies. The main challenge we then faced was how to design the online mapping application to support accessing remote data sources efficiently using different underlying protocols? For example, remote data
17 http://terraservice.net/default.aspx.
from MaPSTeDI partner institution DMNS is passed using ArcXML, while other data sources, such as DRGs and DOQs from Microsoft’s TerraServer, rely on OGC’s WMS protocol.
Given the need to support distributed heterogeneous data sources, we designed the system architecture for MaPSTeDI using the Java Server Pages Model-View-Controller2 (MVC2) design pattern (Seshadri 1999). In this design pattern, a browser makes requests to a controller servlet, and the controller then forwards the request to the appropriate model class containing the required application logic. After the model class processes the request, the results are then rendered by a JSP page and subsequently displayed in the browser (see Figure 2). MaPSTeDI currently provides access to one local GIS service and two distributed GIS service providers. The local map service consists of an ArcIMS image service that pulls UCM and DBG collection data from an ArcSDE database running on top of Microsoft’s SQL Server database. The first distributed GIS service based at DMNS runs a similar software configuration to the UCM and so is accessible using ArcXML, while the second distributed GIS service is hosted by Microsoft’s TerraServer-USA.com and is accessible using OGC’s WMS protocol (Figure 3). In both instances, requests to distributed GIS services through the RemoteHandler classes are made in separate threads. This multi-threaded approach is important for performance reasons so that the application does not have to wait on any one service before sending out additional requests to other distributed GIS services.
In addition to development challenges of bandwidth and heterogeneous data sources, there are other significant issues to be considered when using distributed GIS services. Most importantly, because there is no longer central control of system redundancy and network utilization, it is necessary to implement error handling routines that rely on minimum time-outs in the case where a distributed GIS service goes down or is not able to respond within a specified time. We chose to include distributed services that could respond within a timeout setting of 20 seconds, and ignored those that could not. For our distributed reference layers from TerraServer, we improved application performance by incorporating scale dependencies, such that the DRG and DOQ layers are only

GURALNICK AND NEUFELD – DISTRIBUTED MAPPING SOLUTIONS FOR BIODIVERSITY ANALYSIS
66
accessible when the user selects scales larger than 1:1,500,000.
We believe if online biodiversity mapping applications are to become more widely adopted in the biodiversity informatics community they will likely need to be well integrated with the DiGIR software package. A simple image request mechanism, implemented in a test bed fashion within DiGIR, has been developed. However, full support for the Web Mapping Service18 or Web Feature Service19 specifications has not yet been incorporated (D.A. Vieglais, pers. comm.), although such work is now being undertaken by one of the authors. An alternative approach, called DiGIRMapper, is to integrate the University of Minnesota’s (UMN) Map Server software20 with DiGIR (Hijmans and Deck, pers. comm.). We view these efforts as complimentary in that WMS/WFS-enabled DiGIR providers could serve data to a DiGIRMapper portal given that UMN’s Map Server offers support for distributed WMS/WFS layers.
How to Present Attribute Data Effectively with Billions of Data Points and Thousands of
Repositories? We realize that as DiGIR providers and portals
are linked to online GIS toolkits, the number of potential data providers will increase far beyond the 3 partnering institutions used in MaPSTeDI. As the number of data sources continues to potentially grow, there are issues with scaling up from two data or three remote data sources to potentially tens to thousands of potential data sources. These issues include but are not limited to providing tools for users to select data layers and re-render them in ways that are most meaningful for visualization and analysis. In particular, we anticipate further application development in the community so that users can customize the visibility, ordering, and transparency settings of spatial data layers.
How to Build Analysis Capabilities into Online GIS
Toolkits A major next step with online biodiversity
mapping applications will be to provide more robust tools for analyzing data. The argument has been made (Krishtalka and Humphrey 2000, 18 http://www.opengeospatial.org/docs/01-068r2.pdf. 19 http://cite.occamlab.com/test_engine/wfs_1_0_0/wfs_1_0_0.html. 20 http://mapserver.gis.umn.edu/.
Guralnick and Van Cleve in press) that natural history collections contain data critical to biodiversity conservation decision-making, and that by examining these patterns we may be able to discover underlying causes for biodiversity change. Although providing tools to visualize raw museum collections data location on maps can be useful for heuristic examination of patterns, it is equally important to provide tools for modeling ecological niches or creating summary measures of diversity and to allow tests for differences between these measures across space and time. As more collections and survey data come online, we believe the sampling will be adequate to track species richness and niche change through space and time.
Researchers have pointed out that there are problems with assuming that charismatic, but less diverse groups such as butterflies, birds, or trees represent the overall species richness for a region (Colwell and Coddington 1994). A useful feature of building the analytical functions into an online GIS application is that they will provide results on any unit of biodiversity selected, whether snails or rodents, flowering plants or ferns. Allowing users to select the taxon and geographic area of interest provides the means to examine patterns for less well-studied groups that may have divergent life histories and habitat needs. As well, such tools allow examination of geographical areas that may be of conservation concern but have not been examined or examined using just one higher level taxon (e.g., birds).
Having tools in an online GIS that accesses distributed data sources has some advantages over existing useful desktop packages. One advantage will be that the tools work across platforms and operating systems, allowing more users access to them. Another advantage is that the online GIS application can constantly access updated distributed repositories for specimen occurrence data and spatial data layers. As new distributed collections databases come online, the online GIS will link to them, rather than making the end user collate and update data sets. We believe that continued increases in availability of data and tool development will generally lead to higher quality data to use for analyses, although users will still need to assess the utility and quality of data for their particular applications.

GURALNICK AND NEUFELD – DISTRIBUTED MAPPING SOLUTIONS FOR BIODIVERSITY ANALYSIS
67
We are particularly excited about building analysis tools using distributed application environments like Kepler21. Kepler opens the door for statistical tools to be integrated easily into online mapping applications while allowing the code to be repurposed for other applications. Kepler is an application for managing scientific workflows and in addition has the ability to be executed as a run-time engine. Given Kepler’s ability to access distributed GRID computing technologies, it makes sense to leverage this technology for complex and computationally intensive statistical analyses. A user could submit such tests to the online mapping application that would run the analyses through a Kepler run-time environment and return both statistical and map layer results. Thus, a next-generation online GIS analysis package could combine the ability to generate species diversity raster maps and species accumulation curves, as well as compare species diversity levels between different datasets through hypothesis testing. Finally, Internet and desktop mapping tools can interact in useful ways. Users may query and explore the data online, as well as eventually download spatial data formats like ESRI’s shapefiles or other export formats, and continue analyses on their desktop computers.
We also realize that there is still much work to be done purely on the GIS end towards providing greater analytical capabilities for distributed GIS services. Two examples of common spatial analyses that we have not yet incorporated include performing spatial searches based on other geographic features: for example, finding all of the collection data points within a federal land unit’s polygon, or locating all the collections with a buffer distance of a user selected hydrologic feature. In these situations, a potentially large number of spatial coordinates will need to be sent to distributed GIS services as the query operator. We envision that some control over the size of these coordinate-based query strings could be implemented by storing reference layers on our local server and preprocessing those data sets with appropriate feature generalization techniques. In spite of some of the upcoming challenges and in some cases inherent limitations, we remain excited at the prospect of ongoing advances in distributed
21 http://seek.ecoinformatics.org/Wiki.jsp?page=Kepler.
GIS services and their ability to contribute to knowledge synthesis in biodiversity informatics.
How to Overcome Sociological/Community Impediments to Developing Online GIS for
Biodiversity? Developing a global online distributed
biodiversity mapping application involves community challenges, as well as technological challenges. It is beyond the scope of this paper to discuss multifaceted sociological issues in community development of informatics tools fully. Instead, we focus on tractable problems that are most closely related to biodiversity mapping, and that offer the beginnings of some solutions. As we have discussed, in order to share data among regional or global map applications that may each have different biodiversity analysis requirements, community agreed-upon data concept and transmission standards are essential to facilitate sharing. We have previously discussed standards and transmission mechanisms like DarwinCore2 and DiGIR for natural history collections and GML/WFS/WMS for geographic information. We also believe that all code developed for such applications should be accessible as open source, with the intent of allowing all interested parties to help continue development of new or improved map application features.
Constructing the most effective global biodiversity online GIS tools will also require building collaborations that include developers and the researchers and managers who will use the applications. Such interdisciplinary projects are difficult because many environmental biologists have not kept up with advances in computing, while many computer scientists do not understand the difficult conceptual problems in environmental biology. Ultimately, the online GIS tools developed should be designed using the best available practices in the biodiversity informatics development community, while being usable by the broadest range of environmental biology users. We believe involvement in the biodiversity informatics community via the Taxonomic Database Working Group (TDWG) and GBIF is essential for staying abreast of best practices in development.
The challenge of building tools most useful to the user community is potentially more difficult. One short-term solution is to perform usability assessments at multiple stages during the

GURALNICK AND NEUFELD – DISTRIBUTED MAPPING SOLUTIONS FOR BIODIVERSITY ANALYSIS
68
development process. A longer term but equally important solution is to make sure there are people who are able to effectively translate the software development challenges to the research community and vice-versa. Because such individuals are currently limited in number, we believe it will require environmental biology and computer science cross-training programs to have a body of workers capable of working from both ends towards the middle. Such programs for cross-disciplinary training do not yet exist but will be fundamental for continued growth of biodiversity mapping projects in particular and for biodiversity informatics more generally. Finally, the utility of biodiversity mapping tools will need to be made manifest to the research and management user community through tracking access to the tools, papers and talks using the tools, training workshops, and other mechanisms that show the value of the data and tools and teach users how to leverage the technology maximally for their work.
ACKNOWLEDGMENTS We would like to thank Paul Murphey, and all
the undergraduate workers and graduate assistants whom he and the co-authors oversaw. Together, these individuals helped with the many tasks needed to make the MaPSTeDI project work. Support provided by NSF grant DBI-0110133 for the MaPSTeDI project is gratefully acknowledged. Our understanding of the many issues in georeferencing and online GIS development for biodiversity data has also increased through our participation in NSF and GBIF supported workshops, especially the 2003 Yale georeferencing workshop and a 2003 UCSD DiGIR workshop. Jeremy Mennis, Robert Hijmans and two anonymous reviewers greatly helped improve the quality of previous manuscript versions. We acknowledge continuing support from the Gordon and Betty Moore Foundation for the collaborative research project “Biogeomancer” administered through University of California Berkeley, and from the Global Biodiversity Information Facility for WFS integration into DiGIR portal software.
REFERENCES
Abel, D. 1998. Towards integrated geographical information processing. Int. J. Geogr. Inf. Sys. 12:353-371.
Beaman, R. and B. Conn. 2003. Automated geoparsing and georeferencing of Malesian collection locality data. Telopea 10:43-52.
Bowker, G. 2000. Mapping biodiversity. Int. J. Geogr. Inf. Sys. 14:739-754.
Brisby, F. 2000. The Quiet Revolution: Biodiversity Informatics and the Internet. Science 289: 2309-2312.
Bruce, G. 2003. Binary-XML Encoding Specification, Open GIS Consortium Discussion Paper22.
Colwell, R. K. and J. A. Coddington. 1994. Estimating terrestrial biodiversity through extrapolation. Phil. Trans. Roy. Soc. B 345:101-118.
Crisci, J. V. 2001. The voice of historical biogeography. J. Biogeogr. 28:157-168
Doring, M. and R. Giovanni. 2004. A unified protocol for search and retrieval of distributed data, GBIF23.
Graham, C. H., S. Ferrier, F. Huettman, C. Moritz, and A. T. Peterson. 2004. New developments in museum-based informatics and application in biodiversity analysis. Trends Ecol. Evol. 19:497-503.
Guralnick, R. P. and J. Van Cleve. 2005. Strengths and weaknesses of museum and national survey datasets for predicting regional species richness: Comparative and combined approaches. Div. and Distr. 11:349-359.
Krishtalka, L. and P. S. Humphrey. 2000. Can Natural History Museum Capture the Future? BioScience 50:611-617.
Meier, R. and T. Dikow. 2004. Significance of specimen databases from taxonomic revisions for estimating and mapping the global species diversity of invertebrates and repatriating reliable specimen data. Conserv. Biol. 18:478-488.
Murphey, P.C., R. P. Guralnick, R. Glaubitz, D. Neufeld, and J. Allen Ryan. 2004. Georeferencing of museum Collections: A review of the problems and automated tools, and the methodology developed by the Mountain and Plains Spatial-Temporal Database-informatics initiative (MaPSTeDI). Phyloinformatics 1:1-29.
Peters, D. 2005. System Design Strategies, ESRI Technical Reference Document24.
Petersen, T. P., R. Meier, and M. N. Larsen. 2003. Testing species richness estimation methods using the museum label data on the Danish Asilidae. Biodiv. Conserv. 12:687-701.
Peterson, A. T. 2001. Predicting species' geographic distributions based on ecological niche modeling. Condor 103:599-605.
Ponder, W.F, G. A. Carter, P. Flemons and R. R. Chapman. 2001. Evaluation of museum collection
22 http://www.opengis.org/docs/03-002r8.pdf. 23 http://www.cria.org.br/protocols/newprotocol.pdf. 24 http://www.esri.com/library/whitepapers/pdfs/sysdesig.pdf.

GURALNICK AND NEUFELD – DISTRIBUTED MAPPING SOLUTIONS FOR BIODIVERSITY ANALYSIS
69
data for use in biodiversity assessment. Conserv. Biol. 15:1-11.
Rahbek, C. and G. R. Graves. 2001. Multiscale assessment of patterns of avian species richness. Proc. Nat. Acad. Sci. USA 98:4534-4539
Seshadri, G. 1999. Understanding JavaServer Pages Model 2 architecture25.
Soberón, J.M., J. B. Llorente, and L. Oñate. 2000. The use of specimen-label databases for conservation purposes: an example using Mexican Papilionid and Pierid butterflies. Biodiv. Conserv. 9:1441-1466.
Soberón, J. M. and A. T. Peterson. 2004. Biodiversity informatics: Managing and applying primary biodiversity data. Phil. Trans. Roy. Soc. B 359:689-698.
Stein, B. and J. Wieczorek. 2004. Mammals of the World: MaNIS as an example of data integration in a distributed network environment. Biodiv. Inf. 1:14-22.
Stockwell, D. 1997. Overview of computational biodiversity research.26
Suarez, A.V. and N. D. Tsutsui. 2004. The value of museum collections for research and society. BioScience 54:66-74.
Sugden, A and E. Pennisi. 2000. Diversity digitized. Science 289:2305.
Wieczorek, J., Q. Guo, and R. Hijmans. 2004. The point-radius method for georeferencing locality descriptions and calculating associated uncertainty. Int. J. Geogr. Inf. Sci. 18:745-767.
Wilson, E. O. 2000. A global biodiversity map. Science 289:2279.
25 http://www.javaworld.com/javaworld/jw-12-1999/jw-12-ssj-jspmvc.html. 26 http://biodi.sdsc.edu/Doc/BIS/overview.html.