challenges of quality of learning outcomes for …. teachers and teaching school-level differences...
TRANSCRIPT
0
No. 73
March 2014
Takako Yuki and Yuriko Kameyama
Human Capital Formulation and Gender Equality in Conflict-Affected Islamic States: Case of Basic Education in Yemen
Challenges of Quality of Learning Outcomes for Countries with the Unfinished Agenda of Universal Primary Education and Gender Parity: The Case of Yemen

Use and dissemination of this working paper is encouraged; however, the JICA
Research Institute requests due acknowledgement and a copy of any publication for
which this working paper has provided input. The views expressed in this paper are
those of the author(s) and do not necessarily represent the official positions of either the
JICA Research Institute or JICA.
JICA Research Institute
10-5 Ichigaya Honmura-cho
Shinjuku-ku
Tokyo 162-8433 JAPAN
TEL: +81-3-3269-3374
FAX: +81-3-3269-2054
Copyright ©2014 Japan International Cooperation Agency Research Institute
All rights reserved.

1
Challenges of Quality of Learning Outcomes for Countries with the Unfinished
Agenda of Universal Primary Education and Gender Parity: The Case of Yemen
Takako Yuki* and Yuriko Kameyama†
Abstract This paper sheds light on a potential risk of trade-off between access to primary education and the
quality of education in underserved areas in the case of Yemen, which still faces challenges in access,
equity, and quality in spite of its rapid improvement over the past decade. It will first examine the
level of learning achievement in relation to an improvement of enrollments and gender parity in rural
schools where girls were more disadvantaged in 2004, when Yemen started the national basic
education strategy toward 2015. It will also examine the level of learning achievement in relation to
the other supply-side variables, of which quality and quantity are often affected by expansion of
access. The data used here are the student- and school-level data collected by the JICA Research
Institute at rural schools in Yemen in 2011 and the data from the TIMSS in 2011. The analyses point
to a trade-off between improved access and quality of learning. The results indicated that the
school-level increase of gender parity in enrollment and the total enrollment growth of boys and girls
alike over the past three years are negatively associated with the current students’ math test scores.
The estimation results of trade-offs are valid while controlling for basic students and family
characteristics, such as parental education and occupation. As anticipated from previous education
production function analyses, some policy variables, such as teacher availability and existence of
participatory school management committees, change across schools, and they are important for
explaining the learning differences in the relatively underserved rural areas of Yemen. These findings
underscore the need of revisiting such policy measures in further increasing access while ensuring
the quality standards for disadvantaged areas and avoiding widening of the quality difference within
the country and ensuring learning for all.
Keywords: quality of learning, universal primary education (UPE), gender, class size, community
* Senior Research Fellow, JICA ([email protected]) † Research Assistant, JICA-RI This paper was prepared as part of a research project of the Japan International Cooperation Agency Research Institute (JICA-RI). Hamoud Al-Seyani provided advice and Md. Shamsuzzoha provided research assistance in data management. We are also very grateful for the valuable advice and data received from the Ministry of Education in the Republic of Yemen. Although the authors received various forms of advice and support from JICA members, especially from the Human Development Department Basic Education Group, the views expressed in this draft and any errors are those of the authors and do not represent the official position of JICA or the JICA-RI.

2
1. Introduction
Universal primary education (UPE) is one goal of the global agenda for which many
developing countries have made remarkable progress with the support of international partners
committed to the Millennium Development Goals and Education for All Goals. The net
enrollment ratio in primary education has, on average, increased to 88% in 2011, from 80% in
1999, in low- and middle-income countries.1 The gender parity in primary enrollment has also
increased in these countries to 98% in 2011, from 92% in 1999. Despite the great progress
made, challenges still remain to reach more than 600 million out-of-school children, of which
more than half are girls. Looking by country, there are more than 50 countries in which around
20112 the primary education net enrollment rates are below 90%, and rural areas are often
more underserved than urban areas.
While acknowledging this remaining challenge for access in education, the
international community is increasingly turning its attention to low learning achievement (e.g.,
United Nations 2013). More information is available to alert us to children in developing
countries having a critically low learning achievement. For example, as Table 1 indicates, even
though these countries have increased access in primary education, a high number of students
cannot read a single word in the first line of the oral test called “Early Grade Reading
Assessment (EGRA)” by the end of grade 2.
If countries have almost achieved the UPE, quality objectives can be the first priority
of their education-sector plans and their donors’ assistance. On the other hand, for a country
that is still far from the UPE, how to find the balance between access and quality objectives
under resource constraints for a given period can be an important practical policy question. An
analysis of the recent education sector plans across all countries that have received support
from the Global Partnerships for Education (GPE) found that “the principle, presumably, is to
1 World Bank online data accessed in July 2013.

3
achieve the access goals in education before achieving the quality goals. Few plans
acknowledge that improvements in the quality of education can be expected to have a positive
influence on enrollment (GPE, 2012: 97).” UNESCO (2012: 124-5) says “there is no inevitable
trade-off between quantity and quality of education.” In other words, without appropriate
efforts, a trade-off can happen.
Thus an empirical question is to find whether and to what extent a rapid increase of
enrollment and improvement in equity by gender and between urban-rural areas are related to
low-learning outcomes. The answer can depend on various supply-side and demand-side
factors specific to countries and areas. It should also be important to assess what policy factors
are related to better learning outcomes and how these factors differ within a country.
This paper treats Yemen as a case country that aims to increase access and improve
quality for all. It uses school data and student mathematics test scores from an original survey
we conducted exclusively in underserved rural schools in 2011 as well as a nationwide sample
survey. We aim to examine whether such a trade-off has happened and, if it has, what measures
can mitigate its negative effects.
2. Literature review
2.1. Trade-off or complementary
From past experience, we find that some studies support positive relations between increasing
access and better learning outcomes. UNESCO (2005) states that in the long term, the relation
between increasing access and improving quality of education becomes complementary rather
than being substitutive. The high quality of schools impacts student choices on attending
school (Hanushek 1995).. Schools are supposed to enhance quality to provide an appropriate
learning environment to increase the participation of underserved children, namely, girls
(Stromquist 1997, Kane 2004, and USAID 2008). UNESCO (2012) also shows no inevitable
4
trade-off between quantity and quality of education; increasing enrollment does not necessarily
lead to lower learning achievement.
On the other hand, UNESCO (2005) acknowledges that “low enrollment countries
may experience dynamic trade-offs between expanding coverage and improving quality.”
Quality of education may have been lowered by steep increases in access to basic education in
developing countries such as Mozambique, Uganda, Cambodia, and Togo (e.g., UNESCO
2011, Hungi et al, 2010, and Brossard and Amelewonou 2005).
The notion of a trade-off can stem from the budget constraints that are faced by
developing countries. In a study of secondary education in Africa, Verspoor (2008) addresses
the trade-off as a result of a mathematical relationship of quantity over quality education,
meaning that the number of students shares the financial constraints of other sectors and within
the education sector. It states that “the basic mathematical relationship is clear for a given
budget, the more pupils enrolled, the less it is possible to spend per pupil; conversely, the
higher the level of spending per student, the fewer the number of students who can be enrolled
(p.71).” Brossard and Amelewonou (2005) also show that a great deal of room is available for
such trade-offs between quantity and quality. Yet with the example of Chad, they indicate that a
high amount of spending toward students does not necessarily lead to a quality outcome in
terms of a higher rate of success in the national exam for the diploma of secondary schools.
Their capacity in the effective use of resources could be more essential than the amount of
spending per student.
2.2. Teachers and teaching
School-level differences in recurrent budget amounts can be largely related to the
allocation of teachers and their ability and experience. On the student-to-teacher ratio or class
size, evidence tends to support a negative association with student scores in developing
countries. Many studies have found that a large class for primary school mathematics has
5
greater adverse effects on student achievement than for other subjects (Breton 2014).
Duraisamy et al. (1998) studied the changes in the pass rates of grade 10 students’ statewide
public examination and the pupil-teacher ratios across regions in Tamil Nadu of India from
1977 to 1992 and found that a rapid increase of pupil-teacher ratios are negatively associated
with student pass rates. Yemen is among the seven countries that have increased their
pupil-teacher ratio by more than 5 pupils per teacher in the past decade (UNESCO 2012).
Using TIMSS 2007, Al-Mekhlafy (2009) shows that Yemeni grade 4 students’ scores are on
average higher in smaller classes than in larger classes both in rural and urban schools.
Regarding teachers’ education and training, the results are mixed. According to
Hanushek (1995, 230), about 55% (35 out of 63) of the studies on the effect of teacher
educational levels on students’ learning achievements indicate that significant positive
associations are found between the two in developing countries. About 40% (16 of 46) of the
studies on relationships between teacher experiences and student achievements indicate the
same result. A study of TIMSS 1995-2007 for Colombia found that teachers’ in-service training
wasn’t associated with students’ learning achievements at the grade-8 level (World Bank 2010).
Fehrler et al. (2009) studied the SACMEQ and PASEC learning achievements of grade-6
students in Sub-Saharan Africa and found that teachers’ education level has a weak association
with learning achievement. The GTZ assistance for the pilot program in Yemen supports the
point that in-service training for teachers contributes to improving students’ learning
achievements because their students seemingly perform better than other students in the
TIMSS 2011 grade-4 mathematics test ( General Education Improvement Program 2012).
2.3. Learning resources and environments
As expected in the context of developing countries, the availability of basic education
resources such as textbooks and notebooks varies across schools and students and could affect
students’ learning achievements. Fuller and Clarke (1994) reviewed the 26 empirical studies

6
for primary schools and 13 studies for secondary schools in developing countries and found
that most show the significant effect of textbooks in explaining the student’s learning
achievement. Hungi and Thuku (2010a) is another study supporting this claim for Kenya.
With respect to school facilities, Ogawa et al. (2012) show that such school facilities as
toilets have a positively significant relationship with student learning achievements, using the
data from SACMEQ (Southern and Eastern Africa Consortium for Monitoring Educational
Quality) at the primary education level in Kenya, Malawi, and Uganda. The study of
SACMEQ by Lee and Zuze (2011) also showed such relationships for Botswana, Namibia,
Malawi, and Uganda.
2.4. Community participation, school autonomy and accountability
Community participation is often promoted to increase both education access and quality of
learning. Bruns et al. (2011) reviewed previous studies on school-based management (SBM) in
some Latin American and Asian countries and in one African country, and they point out that
several studies showed SBM leading to a reduction in repetition rates and, to a smaller degree,
dropout rates. On the other hand, the impact of SBM on test scores is mixed, possibly because
of the time lag between intervention and result. Outcomes such as dropout rates and test scores
usually necessitate a longer time to be improved than the participation and attendance rates.
Bruns et al. (2011) also argue that certain conditions, such as the clarity of parents’ roles, and
the combination of other incentives, such as reduced class size, are needed for SBM to have
positive effects on test scores.
For Yemen, the pilot program of participatory school-based management with a school
grant scheme was found effective in increasing the access, especially for girls (e.g., Yuki et al.
2013). The existence of fathers’ and mothers’ councils also seems to work as a deterrent of
teacher absenteeism. Schools with these councils have 5% lower teacher absenteeism rates on

7
average (World Bank 2006, 34). Few studies, however, discuss the effect of the SBM on
student learning outcomes.
2.5. Demand side characteristics
Existing studies suggest strong associations between student achievements and family
characteristics (e.g., Baker et al. 2002). As an example,, the association of students’ learning
achievement and mothers’ schooling is positively significant (Urquiola and Verhoogen 2009).
By contrast, Dincer and Uysal (2010) found that it is the fathers’ education that closely relates
with students’ learning achievement. By either way, the association of parental education with
student learning achievements is positively significant (Dang et al. 2011; Ogawa et al. 2012).
Adult literacy is also discussed as a key determinant to student learning outcomes, especially in
communities where school-based management is implemented (Blimpo and Evans 2011).
The wealth-based gaps in children’s cognitive development grow over time (Paxson
and Schady 2005). Household income is positively associated with student learning
achievements (Muller 1998; Urquiola and Verhoogen 2009). Household assets, including the
availability of some household goods such as televisions and electricity, are used as a proxy of
the household income level in some studies (Dang et al. 2011). These works demonstrate
strong significant associations between household assets and student learning achievements.
Other studies( e.g., Hungi and Thuku 2010b; Woessmann 2011) found significant and positive
associations of students learning achievements with the availability of books at home.
Regarding parental occupation, which may be directly related with household income, the
employment status of either the mother or father is significantly and positively associated with
student scores in Programme for International Student Assessment (PISA) (Dincer and Uysal,
2010).

8
3. Education in Yemen
3.1. Country context: remaining challenges in basic education in Yemen
Access and gender equity in access have been priority goals of the Yemeni government’s basic
education sector plan, named “National Basic Education Development Strategy 2003-2015”
(Ministry of Education 2002). In fact, Yemen has made remarkable progress, improving the net
enrollment rate (NER) in primary education to 76% in 2011, from 56% in 1999, and gender
parity index to 0.84 in 2011, from 0.58 in 1999.2 To increase girls’ participation in school,
several gender-sensitive measures have been taken, including the hiring of female teachers
who are less qualified than the official requirements of university degrees, the construction of
school toilets, the promotion of parental and community awareness and involvement, and the
elimination of participation fees for girls from first to sixth grade (Yuki et al. 2013).
However, much effort is still required to achieve the international target of 100% net
enrollment and the national compulsory basic education policy,3 especially for girls and rural
children. More than one million children are still not in school (Al-Seyani and Matsui 2013).
Yemen’s female enrollment rate is below even that of many other low-income countries. The
primary school net attendance rate for girls in 2006 is estimated at 53% in rural areas and 80%
in urban areas (Ministry of Health and Population and UNICEF 2008, 100).
With the exceptions of some donor-assisted pilot schools, these underserved rural areas
have not systematically received more resources per student or per school to ensure more
quality of learning inputs than in other places. To reduce the cost of schooling for households
and to stimulate the demand for education, the yearly community participation fees for
students have been eliminated for all students in grades 1 to 3 and also for girls in grades 4 to 6
2 World Bank online data accessed in July 2013. 3 Compulsory education is defined as eight to nine years of education in most Arab countries, including Yemen. For Yemen, after basic schools, the system separates students into secondary schools and post-basic vocational training centers. The system then tracks students into universities (degree or diploma courses), community colleges (two years), or postsecondary vocational training centers.

9
(Ministry of Education 2012). Just as fee abolition has often been associated with the school
grants scheme in African countries (Fredriksen 2007), Yemen approved a Cabinet decree on
school operation budgets (school grants) in 2008, though until now it has been neither enacted
nor budgeted by the Ministry of Finance.
For the country as a whole, during the past decade there is no evidence that the amount
of resources devoted to basic education has increased. As Table 2 shows, although Yemen
spends an amount on education comparable to other countries in terms of total public
education, expenditure (5% of GDP in 2010) and expenditure per pupil in primary education
(18% of GDP per capita in 2011), there is a decline in total education expenditures when
compared with the early 2000s (9% of GDP). Given the resource constraints because of the
tuition-free policy and the low share of private primary schools,4 effective public finance
management has been key to improving quality access and learning achievement for all.
However, overall public-sector governance performance is considered weak for Yemen as well
as for other MENA countries (World Bank 2003; World Bank and Republic of Yemen 2010).
As for the quality and equity in learning achievements, results are not promising when
Yemeni students are compared with the national average of other countries or when rural areas
are compared with urban areas within Yemen. For example, among the EGRA-assessed
Yemeni students in 40 schools in three governorates, the proportion of students who were
unable to read a single word (i.e., scoring zero in oral-reading fluency) were found to be 42%
for grade 2 and 27% for grade 3 (Collins and Messaoud-Galusi 2012, 2). Among students who
could read at least one word, their rate of reading words of text per minute is less than one
quarter of the recommended rate for adequate comprehension. The assessment recommended
that the provision of reading materials, parental involvement in schooling, and pre- and
in-service teacher training on basic components of reading be improved.
4 The private share is slightly high at the tertiary level (20.1%), but it was only 4% at the primary level in 2010 (World Bank online data, accessed in December 2012). The private share is known to be much lower for rural areas and urban areas. According to the 2009/10 MOE’s annual education survey data, the private share is about 0.2% in total of basic and secondary schools in rural areas.

10
The Trends in Mathematics and Science Study (TIMSS), a large-scale international
educational assessment, indicates that Yemeni achievement was the lowest among participating
countries in the grade 4 assessment, while the country’s economic level was also lowest among
52 participating countries in 2011 (Mullis et al. 2012). Because the previous TIMSS experience
indicated that literacy was among the factors of lower achievement, Yemen also assessed its
grade 6 students with the grade 4 exam in 2011. As for the results, grade 6 students performed
better than the grade 4 students (Mullis et al. 2012), but their achievement is still lower than
most grade 4 students of other countries (Fig. 1a).
Within Yemen, the schools in small towns or rural areas have a lower average
achievement than in urban schools. A comparison of the Yemeni TIMSS results with low- and
lower middle-income countries’ results of other assessment, such as PASEC and SACMEC,
suggests that the Yemeni score is not high among countries of similar economic level (Fig. 1b).
In the recent Yemeni basic education sector medium-term plan (MTRF 2013-2015),
the quality objective is regarded as important as access and equity in access objectives
(Ministry of Education 2013). To minimize any risk of trade-off between access expansion and
quality, especially for currently underserved areas, it will be important to analyze the country’s
past experience.
3.2. Research questions
For Yemen, this paper explores two questions. The first is whether a rapid increase of gender
parity, often accompanied by total enrollment growth, is related to low quality of learning
outcome for students in their initially underserved areas. We hypothesize that when a school in
an underserved area has been rapidly increasing the gender parity and/or the total enrollments,
students are quite likely to achieve a lower level of learning than students in other schools.
However, these potential trade-offs could be overcome if the school, together with the student’s
family and community, succeeds in ensuring the quality of learning environments and inputs.
11
Such effort might not be easy in the underserved areas of Yemen, given the limited public and
private resources, and thus certain schools might have no choice but to enroll more students
even in conditions that are below par.
Our second research question is concerned with the differences in learning
environments. The paper will explore which factors determine the different degrees of policy
implementation among schools and contribute to making a difference in learning outcome
among students, especially in underserved areas. Yemen’s current sector plan includes
reforming the curriculum and textbook contents and introducing new national standard
assessment systems (exam) to achieve quality objectives. Such centrally initiated policy
reforms, however, may work less for disadvantaged schools, where learning environments tend
to be worse because of lower family welfare and educational levels.
4. Data and model
4.1. Data sources
This paper uses two types of data sets as summarized in Table 3. The first is from the female
student learning-achievement survey that the JICA Research Institute and ERDC conducted in
underserved rural areas of the Dhamar governorate in March-April 2011. In the Dhamar
governorate, the Gender Parity Index (GPI) sharply increased to nearly 0.7 in 2009, from 0.54
in 2004, but the GPI was still low (see Fig. 2). The net enrollment ratio of girl students (55%)
was also low in Yemen (Ministry of Education, 2013: 82). A total of 40 sample schools were
randomly chosen from two groups of public schools. Both were initially underserved girls, but
one group improved the gender parity more rapidly than the other. Utilizing the trends of
school-level data from the MOE’s annual education survey in 2004 and 2007, the initially
underserving schools were defined as those whose GPIs were below the governorate average in
2004, which was the first year of the Yemeni basic education strategy. The rapidity of

12
improvement is defined as the increase rate from 2004 to 2007, also compared with the
governorate average.
For each sample school, a maximum of 40 students of grades 5 and 6 were randomly
selected, using the list of all student names and gender information submitted by school
directors as of January 2011. The students were then tested by the TIMSS 2007-released items
of mathematics for grade 4.5 The survey also asked the students about their family, house
conditions, and perception of learning and gender in addition to questions on the standard
TIMSS questionnaire. Moreover, it asked the school director and teachers (maximum of five
teachers sampled per school) about their backgrounds, school environments, teaching, and
learning. We merged the student-file data with their schools’ data and their mathematics
teacher data.
The 2011 JICA-RI and ERDC dataset was used to analyze both of the two research
questions on trade-off between access and quality of learning and the effect of learning input
on quality of learning. For the second research question, we also used another data set,
covering the nationally represented sample schools. It will allow us to compare underserved
areas with the rest of the country.
The second data set is from the TIMSS 2011. We downloaded the five data sets for
grade 6 students regarding score data, student background, teacher background, teacher-student
link, and school background, and prepared an integrated student-level data set, including their
teacher and school characteristics. For Yemen, the TIMSS 2011 was implemented in April
2011 by ERDC in partnership with the TIMSS and PIRLS International Study Center at Boston
College. The TIMSS sample schools are randomly selected according to an international
5 As past experience suggests a discussion between the Yemeni government and Boston College (leading the TIMSS) about the Arabic competency being one reason that the TIMSS test is far too difficult for grade 4 students in Yemen and the TIMSS 2011 was going to be conducted for both grades. Given that our target was rural areas, where it is more difficult to have the adequate number of sample students for a single grade, we decided to test both grade 5 and grade 6. From the seven released booklets of mathematics of TIMSS 2007, we used booklets 1 and 3, taking into consideration the more relevant questions to Yemeni curricula. Depending on the desk arrangement, a student has examination of booklet 1 and the next student has booklet 3; thus they are unable to copy the answers from each other (as a TIMSS guideline).

13
sampling guideline, which sets a minimum class size and thus excludes small rural schools.
The data set provides information on 146 sample schools.
4.2. Modeling and descriptive statistics
This paper adopts a production-function approach, which is to examine the relationship
between school outcomes and educational inputs (Hanushek 1995).The production function
approach has been used to include pedagogical factors, such as frequency of homework and
teacher qualifications, besides the measurable spending on educational inputs.
More specifically, this paper defines learning outcome as a student’s math test score in
terms of the percentage of correct responses in the JICA ERDC 2011 survey and Yemen’s
average achievement on the TIMSS 2011 mathematics achievement scale (for details of the
TIMSS 2011, please see Mullis et al. 2012). We estimate the student’s test score as a function
of the school characteristics and of the student’s individual and family characteristics. The
TIMSS 2011 data include sampling weights to make statistical analyses representative of the
country’s school population, and thus we use these sampling weights in all our estimation
models with the TIMSS data.
For the school characteristics, we first included the variables regarding changes in
gender parity and access in terms of the number of total enrollment over three years (from
2007/08 to 2010/11) because these changes might have affected the quality of learning
environment throughout their school years. The estimation model also controls for differences
in changes in gender parity before those three years to see whether it has changed rapidly from
a low initial level in 2004/05, in which the country’s basic education strategy started with 2015
as the target year. These variables on the enrollment change are available only for the TIMSS
data set.
Second, based on the findings of existing literature and Yemeni context, we included,
as independent variables, the following three types of measurable school and teacher

14
characteristics: (a) teachers’ availability and characteristics (teachers as a whole and math
teachers), (b) community and parental contribution and participation in school operations, (c)
other factors such as learning materials and local supervision. For the student’s individual and
family characteristics, the model controls characteristics such as gender, parental occupations
and education. Tables 4 and 5 summarize the definitions of these variables prepared by using
the JICA-ERDC 2011 data and the TIMSS 2011, respectively. For the TIMSS data set, we have
a limited set of independent variables because it uses internationally standard questionnaires.
Thus the following explanations are mostly for the JICA-ERDC 2011 data.
Descriptive stat: Regarding changes in gender equity and access, both changes appear
to have a positive relation; that is, the higher the increase of GPI, the higher the total
enrollment growth rate. On the relation with the student test score, the total enrollment growth
is more likely to have a negative effect on test scores than the increase of GPI (Figs. 3a, 3b).
Regarding the current school characteristics, variance in the student-to-teacher ratio
among schools appears to be related to student test scores in the JICA-ERDC 2011 (Fig. 3c).
We prepared a dummy variable of whether the student-to-teacher ratio (STR) is above 35. As
discussed above, the Yemeni data indicate a notable increase in STR in primary education over
the past decade, from 22 in 2000 to 31 in 2010. This increase of STRs is good news for the
efficiency of public resource allocation because the STR is moving toward the indicative target
of 35, set in the early 2000s for the year 2015 by the Fast Track Initiative plan toward universal
primary education (government of Yemen and World Bank 2004). However, a higher STR may
have made it difficult for effective teaching, especially when less-qualified teachers needed to
teach a larger number of students whose learning readiness also varies because of the
increasing participation of disadvantaged children. The TIMSS 2011 does not provide an STR,
only the class size. As Figs 4a and 4b show, the class size shows no clear relation with student
scores for the country as a whole, but it seems to show slightly negative relations in remote
15
rural schools, which are supposedly in similar conditions as the JICA-ERDC 2011 sample
schools.
For the characteristics of teachers, years of teaching experience and educational
backgrounds are considered. For the new hiring of civil servant teachers, the government
currently requires a university degree, with some exceptions, applied to female teachers in
remote rural areas. Yet because some teachers had been hired before the new hiring rule was
introduced, the proportion of students whose math teachers hold university degrees is about
25% in the JICA-ERDC 2011. On teacher training, the government has conducted a series of
refreshers or upgrading in-service training, though professional development training is not a
legal requirement (e.g., World Bank 2007). As a result, math teachers which are 34% of the
students have participated in training in the past five years. On teaching practices, although it is
difficult to construct accurate relative values from self-reporting responses, we attempted to
prepare some variables. One is the frequency of teaching equations for word problems because
most of the math test items are word problems. Another example is how often the student’s
math teacher gives him or her math homework. The frequency of inspector visits to student
classes also appears to differ. Although about 60% of students responded that the inspector
visited more than once in the past year, 16% said that inspectors had never visited their classes.
The TIMSS 2011 data also confirm a similar level of teacher quality and the
anticipated difference between the national average and remote rural schools. For example,
35% of the students’ math teachers have a university degree in all sample schools nationwide,
but only 27% have it in remote rural areas. The in-service training experience in mathematics
pedagogy is also lower in remote schools.
On the community and parental participation in school operations, the 2011
JICA-ERDC data provide country-specific variables. For example, parental associations have
been established separately for fathers’ councils and mothers’ councils. While all sample
schools reported having fathers’ councils, one difference is the timing of establishment: 32% of

16
the schools had established them more than five years before the sample students entered
school, but the rest of the schools had established them relatively recently. The government
promotes mothers’ councils, but they are relatively new and thus will not be included in our
analysis. The government also aims to strengthen school-based management by establishing
participatory school committees and involving them in all aspects of planning, implementation,
and monitoring (Ministry of Education 2013, 39). More than 60% of students are at schools
with school committees that include parents’ representatives, and nearly 50% of schools have
had a workshop on quality of education attended by parents.
On monetary contribution from parents, JICA ERDC 2011 shows that all the sample
schools collect fees for some or all of the following purposes: registration of girls and boys,
textbooks, and school maintenance. Because of shortages of resources provided to schools for
daily operations, parental contributions have played important roles. One study reports that fee
abolition policies have made it difficult for school directors to maintain the quality of learning
(Al-Mansoob 2007). Thus a variable on textbook availability is very much correlated with the
fee variables, and consequently it is not included in the model presented in this paper. Although
the TIMSS 2011 provides no information specific to school committees, fathers’ or mothers’
councils, it asked questions on information sharing with parents and their commitment to
students’ homework.
For family characteristics, the 2011 JICA-ERDC data provide a variable that shows the
difference among students in terms of the availability of household goods that supposedly
indicate the household welfare level. The education and occupation of fathers and mothers are
also included. As expected, the literacy rate is much lower for mothers. Only 24% of mothers
are literate or have ever been enrolled in primary education or above, though 73% of fathers
are literate. The TIMSS 2011 has less information on individual students’ family

17
characteristics.6 The variable that can make a difference is whether students have their own
books (excluding school books) or not, and less than half of the students answered in the
affirmative.7
Our model has some limitations. First, although we attempted to reduce omitted
variable bias by including different variables of education inputs and family backgrounds,
especially for the estimations using the JICA ERDC 2011, the model does not control for the
student’s individual prior ability before studying in the current class or school. As a rough
proxy, the JICA ERDC 2011 data provide information on the student’s repetition history,
whether the student ever repeated. Although the repetition variable was not included in the
final estimation models because of potential endogenous issues, we confirmed that the
inclusion of this variable does not affect the key results discussed below, and the repetition
variable shows a negative relation to the current score.
On selectivity bias, which is also a typical issue in a production function approach, we
insist that the estimations, using the JICA ERDC 2011 or the TIMSS 2011 for remote schools,
have only a small bias. Given that the target students are primary-school children in rural areas,
where few private or alternative schools are available within walking distance, families are, in
practice, not very likely to choose a specific school for their children to enter. There could be
some exceptions, but the bias is expected to be small.
6On students’ mobility aspects, the TIMSS 2011 does not ask about the residency of the students at their earlier ages. The JICA ERDC 2011 asks students in grades 5 and 6 whether he or she was born in their current village. Less than 10% answered that they had not been. Thus we did not include this internal migration issue in our analyses. 7 The TIMSS 2011 asks about household possession of some goods, but most of which, such as computers and Internet connections, are not relevant to Yemen, where very few households have them.
18
5. Estimation results
5.1. Results for underserved rural areas: JICA ERDC 2011 data
Enrollment Increase
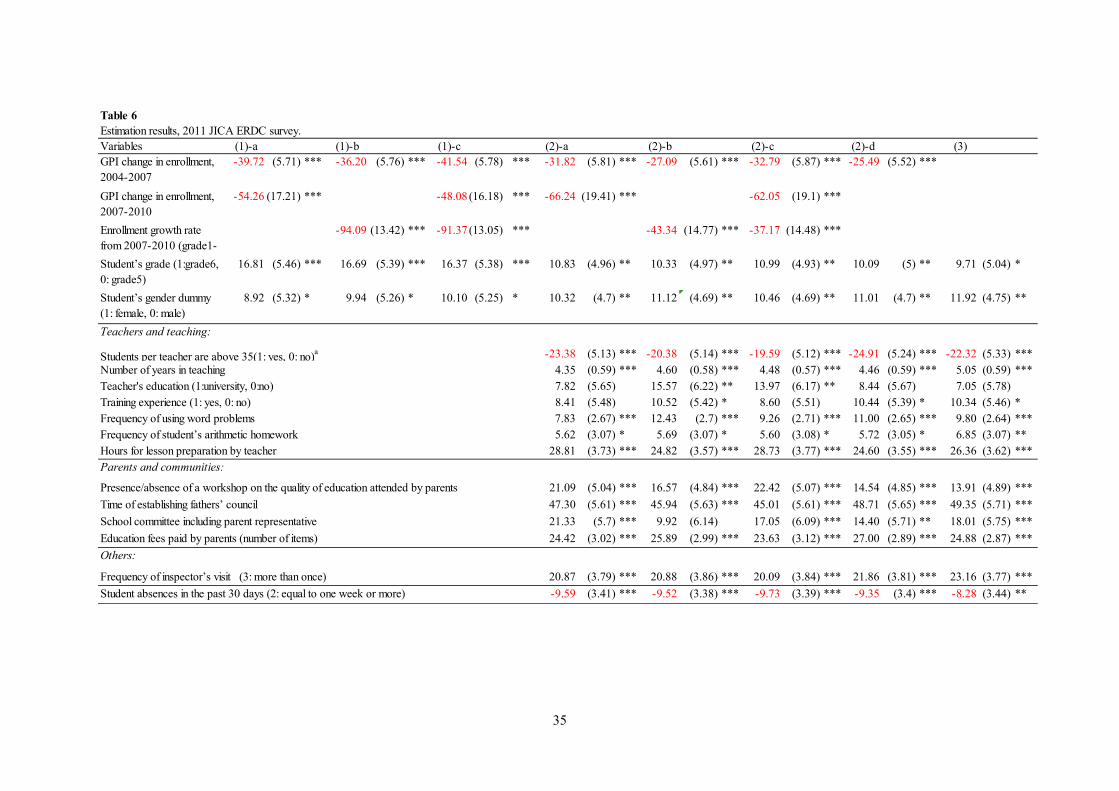
Table 6 indicates the possibility of a trade-off between access and learning outcome for
students in the initially underserved areas. The estimations of the student math score show a
statistically significant and negative coefficient of the variable regarding the GPI increase and
the total enrollment growth from 2007/08 to 2010/11. First we included in the models each of
the two variables separately (columns of 1a, 1b) because they could be potentially correlated.
They were then put together (column 1c) to assess the sensitivity of the estimation results.
Although not presented in the table, the results are the same if only the growth rate of female
enrollment is included, instead of the total growth of enrollment (boys and girls).
Characteristics of Students and Families
These estimation results are after controlling for basic characteristics of students and
their households. As for student characteristics, being a female student tends to show a positive
association with the test score in most specifications of the estimations. This is consistent to
previous evidence in Yemen. Among the possible reasons is that a child’s ability and
preference for studying may affect more strongly the household’s decision, whether to let her
drop out or retain the child up to grade 5 or 6, in regard to girls compared to boys, for whom
households generally consider education more important than for girls. Also, being a grade-6
student is positively related with a higher math score, although the difference is not large.
School Variables
The negative direction of the coefficients on the GPI increase or enrollment growth
remains the same even after controlling for the current school characteristics (columns 2a to
2c). This implies that the past school characteristics, reflected by the changes in equity and
access over the years, are related to students’ learning.

19
Furthermore, some of the current schools’ quality indicators also significantly explain
their performance. In regard to teachers, the number of students per teacher is significantly and
negatively related to students’ test scores. As Table 6 shows (the column from 2a to 3), it
makes a significant difference in the student’s achievement whether the school has more than
35 students per teacher. Existing literature indicates that the effect of small classes varies
among societies and countries; in the underserved areas of Yemen, smaller classes are more
effective for students’ learning achievements.
Not only the quantity, but also the quality of teaching is important. The coefficient on
the variables regarding the years of teaching experience and the frequency of using word
problems for mathematics are significantly positive. The training experience of teachers tends
to be positive. Teaching qualifications, whether teachers hold a university degree, shows no
robust results because it varies among the models. This may be a result of experiences having a
greater effect than the university degree in the rural context. The frequency of inspector visits
to classes is positively associated with the test score. This effect is the same even if the model
controls for the distance-to-district offices. Thus the effect of the inspector’s visit may be
interpreted as an opportunity for guiding and motivating teachers, which results in better
students’ achievements.
Parental and Community Participation
Regarding parental and community participation in learning, some characteristics
appear to be positively related to students’ test scores. A workshop attended by parents in the
previous five years is positively associated with higher scores. The length of the existence of
fathers’ councils also shows a positive relationship, indicating the necessity of long-term
commitment by the parents covering the years in which their children reach grades 5 or 6. The
monetary contribution is also important. As discussed above, although the official tuition fee
was eliminated, other costs of schooling are in practice often paid by families and communities.
The greater the number of items of education fees (e.g., registration and school uniform) paid

20
to a school by parents, the higher the average student’s score. This finding may indicate that
resources at school level, including operational fees, are a crucial component to raise students’
learning achievements. Furthermore, this result may suggest the importance of mobilizing
community resources.
5.2. Results nationwide and for remote rural areas: TIMSS 2011 data
Table 7 presents the OLS estimation results of the 2011 TIMSS Yemeni scores. The first
column shows the estimation results for nationwide sample schools by controlling for school
location. As the school location variables indicate in the table’s bottom rows, in remote rural
areas as opposed to any other location – urban, suburban, medium-size city, or small town –
the students' test scores are significantly low. For these remote rural schools, which often still
have a relatively large number of out-of-school children and are at risk of trade-offs between
access and quality of learning, the estimation results are presented separately in the second
column. Along with with the results of the other areas, all policy variables on learning
environment are significantly related to the students’ scores.
Regarding teachers, the class size is significantly and negatively related to students’
test scores. Teacher characteristics also matter. They are positively related to students’
achievements in terms of years of teaching experience and participation in training in the past
two years. Teachers’ qualifications, whether the teacher has a university degree, also has a
significant association with the student’s test scores in remote rural schools, where only 27% of
students learn from teachers with a university degree.
Regarding parental involvement, the frequency of informing parents about school
accomplishment – more than three times a year, two to three times a year, once a year, or never
– shows a significant difference on test scores. The more opportunities for information sharing
may reinforce the already existing meetings of fathers’ councils, participatory school
committees, and similar that have been shown to be effective in the underserved areas of

21
Yemen in the section above. Having parents involved in student’s homework turn out to be
positively associated with the student test scores.
Although the 2011 TIMSS asks no questions about request or existence of parental
in-kind or monetary contribution to schools, the availability of textbooks, often supported by
parents and communities in Yemen, appears to make a difference in student scores, especially
for remote rural schools. The degree to which instruction is affected by a shortage of textbooks
– a lot, some, slightly, or not at all – is significantly related to the level of student learning
achievements. This shows the importance of communities to improve the daily learning
resources. In fact, the TIMSS 2007, as in the previous TIMSS round, asked school directors
whether schools requested parents to raise funds for the school. Yuki and Kameyama (2013)
analyzed the TIMSS 2007 data for grade 4 students and found that this has a significant and
positive association with the math scores of the students. Although the basic education is
tuition free, given the shortages of school amenities provided by the government, parental
contributions can make a practical difference among schools. More attention needs to be paid
to the relatively poor communities where such contributions are less feasible.
6. Conclusion and policy implications
Despite the remarkable progress in access to schools in many developing countries over the
past decade, many countries still have not achieved the global goal of UPE. Furthermore, low
levels and disparities in learning achievement have been an increasing concern for various
stakeholders. In fact, some warn about the potential trade-offs between access and quality
objectives during the efforts for improving access and parity under public and private resource
constraints. Others wonder if such trade-offs can be avoidable. This paper first examined the
potential risk of trade-offs by addressing the question whether the status of learning
achievement is low for students in the schools that have rapidly increased gender parity in

22
access. It mainly used the data from the JICA-ERDC survey conducted in 2011 in rural schools
in a most underserved governorate of Yemen, which still has a relatively large number of
out-of-school children, especially girls, and still needs to urgently address the access and
equity goals toward universal primary education.
The estimation results of students’ math test scores in the 5th and 6th grades show that
the school-level increase of gender parity in enrollment and the total enrollment growth (of
boys and girls alike) over the past three years is negatively associated to the current students’
test scores. The estimation results of trade-offs are valid while controlling for basic students
and family characteristics such as parental education and occupation, which vary even among
students in underserved areas. The past changes in access and parity indicators may represent
changes in supply- and household-side factors, although we could not fully include the past
trends of these indicators; so this remains an area for further analyses. Still, our findings add
new school-level evidence of trade-offs between the increase of access and the low quality
outcome in underserved disadvantaged regions, though previous literature often compares
between countries, not schools. This underscores the need of revisiting policy measures for
increasing access in disadvantaged areas. The currently out-of-school children must be
enrolled, but should not be disadvantaged by low-quality standards.
We also assessed the relationship between current policy indicators and students’ test
scores, using the 2011 JICA ERDC data for underserved areas and the 2011 TIMSS data for
the entire nation, including the remote rural areas. As anticipated from previous education
production function analyses, which highlight differences in the effects between high-income
and low-income countries, policy variables, such as teacher availability and quality, are
important for explaining the learning differences in the relatively underserved rural areas of
Yemen. Family-side factors are also significant because father education and household
property affect the education of children.

23
A challenge for Yemen, largely common to other countries facing the unfinished
agenda of UPE as well as the problem of the level and the equity in outcome quality, can be
summarized as the following three main points.
First, we found that a larger ratio of students to teacher or class size is significantly and
negatively correlated to the students’ test scores. This adverse effect of class size is the same as
the findings in the analysis by Breton (2014) of the TIMSS 2007 data for Colombia and was
anticipated, since the class size in Yemen is much larger on average and has more variation
than in other participating countries.8 The indicators of teacher quality, such as years of
experience, participation in professional training, and educational qualification, also tend to
show a positive relation with the student’s test scores, and the mean values of these indicators
are lower in underserved or remote rural areas than in other areas.
The Ministry of Education’s projection of financing needs for the ESP (2013-2015)
assumes an increase in the student-to-teacher ratio (STR) in basic education. The STR is
generally the most influential indicator in projecting the amount needed for government
recurrent budgets. Thus it is understandable that the government attempts to set the STR as
neither too high nor too low so that it can demonstrate financial efficiency in the face of all
stakeholders, including foreign donors and development partners. However, this paper’s
findings that the within-country variations in the STR or class size make a large difference in
learning achievements; they underscore the need to assess its effect more carefully and to
regularly monitor what the average norm of STR means in the context of Yemeni basic
education. Yemen should avoid having the more-disadvantaged areas also having worse
learning conditions, such as a lower number of teachers with lower quality. One also needs to
consider that the class size is larger in the lower grades of basic education because of the
presence of subject-specific teachers in the upper grades. This means that lower-grade students
are taught by fewer teachers, although children in relatively underserved areas, where fewer 8 According to the report of the 2007 TIMSS for 4th-grade mathematics, the average class size is 32 for Colombia and 46 for Yemen.
24
parents are literate and fewer books are available at home, need more teacher attention from
the early grades on. The fiscal efficiency should be ensured by enhancing the reduction of the
number of ghost teachers, estimated at nearly 30,000 salaried persons (World Bank 2006) and
absenteeism, rather than reducing the actual number of teachers allocated to schools in need.
Second, several community-participation-related variables also tend to be positively
associated with the students’ test scores. This implies that community-participation policies
implemented by the Yemeni government over the past decade, especially those for access and
equity in access, such as girls’ education, are also important for the quality outcome objective.
As implied from previous literature of SBM, what matters includes the timing and length of
participation, the increased understanding of the role of parents, and the increased
responsibility of participation through the establishment of school committees that prepare the
annual school improvement plan. In Yemeni public basic education, the school committees
have no autonomy on curriculum contents, about which Hanushek et al. (2013) mentions
adverse effects on learning outcomes in developing countries compared with the developed
countries in the secondary level. The Yemeni ESP intends to support school committees,
fathers’ councils, and mothers’ councils. Training “manuals” and facilitation activities should
promote discussions and actions for both equity access and quality goals at each school.
Also, with the finding of the positive effect of parental fee contributions to test scores
or the availability of textbooks, to which communities have often contributed to minimize the
shortage of learning resources, this paper supports the validity of the policy of having school
funds that can be managed by participatory school councils for the school’s daily operations,
especially in underserved areas. This underscores the recommendation made in the Report to
the UN special envoy for global education (Al-Seyani and Matsui 2013). With donors’ support,
Yemen could scale up the existing mechanisms for school grants to reward communities and
schools that aim to improve access for girls and disadvantaged students and to enhance the
quality of learning. As of now, only a limited proportion of basic schools are to receive such

25
school grants, though according to a cabinet decree, the Sector Plan aims to cover all schools
by 2015. Such resources should ideally be provided by domestic funds. However the use of
external funds can be justified to cope with the recent crisis and to better achieve the
international goal of universal primary education without sacrificing the quality of learning.
Providing sufficient grants to schools is a key factor for inclusive development and economic
growth. In fragile countries, school grants can be used not only as operational or recurrent
budgets, but also as investment budgets. Meanwhile, it is important, by comparing experiences
between governorates, to refine the mechanisms that would improve the administrative
efficiency in fund transaction and targeting (e.g., differentiating the grant amounts by school
size and community poverty level), as well as the monitoring of schools and advising them and
communities on school improvement plans. Such mechanisms should also develop the
institutional capacity of communities to participate in school governance and increase their
access to school information, roles, and voices for improving students’ learning opportunities
and outcomes.
Lastly, to ensure school- and community-level accountability for better results, it will
be important that schools and communities receive guidance and supervision. The frequency of
inspector visits to classes is significantly positive on the students’ score in the estimation of the
2011 JICA ERDC survey, although no such variable is available for the TIMSS. The Yemeni
government has conducted a series of school surveys and plans to introduce new national
learning assessments for grades 6 and 9 (Ministry of Education 2013; World Bank 2013). The
questionnaires should be designed to capture the status and variations in the key policy
indicators across schools and classes. It will also be important to enhance the institutional and
individual capacities of and incentives for the stakeholders – government officials, schools,
donors, and other development partners -- to utilize the existing data for monitoring and
planning.

26
Development partners often support their project-specific monitoring databases and/or
base/end line survey data, focusing on their pilot schools and control schools. If such databases
were designed in advance to make the data comparable and merged into the Ministry of
Education’s education management information system (EMIS) (e.g., using the same school
and district IDs), it would help long- term and comprehensive monitoring. It would also
facilitate the short-term utilization of Ministry of Education data and the improvement of data
quality.
Furthermore, this move could also help reduce the cost of monitoring for development
partners because an improved EMIS could be used for project-specific performance
comparison with a non- treatment group. Besides specific projects, donors can also support
theme-specific surveys, such as TIMSS, which could help the capacity of not only of education
researchers, but also of administrators in their monitoring and guidance of schools and teachers
if the results and instruments (e.g., released TIMSS math- test items in Arabic) are
disseminated widely. When the Yemeni government introduces new national assessment
surveys in basic education, it is important to consider not only the survey contents, but also the
way how it can be used for the benefit of the school children and national development.

27
References
Al-Mansoob, M. 2007. Household and school survey on the impact of school fee abolition. In: aper presented at the Third Joint Annual Review of the Implementation of the National Basic Education Development Strategy (Educational Meeting). Sana’a, Yemen. May 7–9.
Al-Mekhlafy, T. A. 2009. Performance of fourth graders of the Republic of Yemen in TIMSS 2007: A secondary analysis. Sana’a, Yemen: Republic of Yemen.
Al-Seyani, H., and E. Matsui. 2013. A report series to the UN special envoy for global education. Accelerating progress to 2015: Yemen. The Good Planet Foundation.
Baker, D. P., B. Goesling, and G. K. Le Tendre. 2002. Socioeconomic status, school quality and national economic development: A cross-national analysis of the “Heyneman-Loxley Effect” on mathematics and science achievement. Comparative Education Review 46(3):291–312.
Blimpo, P. M., and D. K. Evans. 2011. School-based management and educational outcomes: Lessons from a randomized field experiment. Washington, DC: World Bank.
Breton, T. 2014. Evidence that class size matters in 4th grade mathematics: An analysis of TIMSS 2007 data for Colombia. International Journal of Educational Development 34:51–57.
Brossard, M., and K. Amelewonou. 2005. Developing secondary education in Africa: Challenges, constraints and room for manœuvre. In: Bhuwanee, T. (ed.). Reforming secondary education in Africa: Proceedings of a regional seminar. Dakar, Senegal. UNESCO.
Bruns, B., D. Filmer, and H. A. Patrinos. 2011. Making schools work: New evidence on accountability reforms. Washington, DC: World Bank.
Collins, P., and S. Messaoud-Galusi. 2012. EdData II: Student performance on the Early Grade Reading Assessment (EGRA) in Yemen. Triangle Park, NC: RTI International Research.
Dang, H. A., L. Sarr, and N. Asadullah. 2011. School access, resources, and learning outcomes: Evidence from a non-formal school program in Bangladesh. Discussion Paper Series 5659. Bonn, Germany: The Institute for the Study of Labor (IZA).
Dincer, M. A., and G. Uysal. 2010. The determinants of student achievement in Turkey. International Journal of Educational Development 30:592–98.
Duraisamy, P., E. James, J. Lane, and J. P. Tan. 1998. Is there a quantity-quality trade-off as pupil-teacher ratios increase? evidence from Tamil Nadu, India. International Journal of Educational Development 18(5):367–83.
Fehrler, S., K. Michaelowa, and A. Wechtler. 2009. The effectiveness of inputs in primary education: Insights from recent student surveys from Sub-Saharan Africa. Journal of Development Studies 45(9):1545–78.
Fredriksen, B. 2007. School grants: One efficient instrument to address key barriers to attaining education for all. In: Capacity development workshop: Country leadership and implementation for results in the EFA FTI partnership. Cape Town, South Africa. July 16–19.
Fuller, B., and P. Clarke. 1994. Raising school effects while ignoring culture? Local conditions and the influence of classrooms, tools, rules and pedagogy. Review of Educational Research 64(1):119–57.
General Education Improvement Program (GEIP). 2012. General Education Improvement Program Yemen (GEIP). Intervention: FGI Foundation Grade Initiative. In: printout distributed at Republic of Yemen: second basic education development project, Yemen education mission. Amman, Jordan. July 1–10.
Government of Yemen and World Bank. 2004. Republic of Yemen: Education for all by 2015- fast track initiative. Country credible plan. Sana’a, Yemen: Ministry of Education, Government of Yemen.
28
Global Partnership for Education (GPE). 2012. Results for learning report 2012: Fostering evidence based dialogue to monitor access and quality in education. Washington, DC: Global Partnership for Education.
Hanushek, E. A. 1995. Interpreting recent research in schooling in developing countries. The World Bank Research Observer 10(2):227–46.
Hanushek, E. A., S. Link, and L. Woessmann. 2013. Does school autonomy make sense everywhere? Panel estimates from PISA. Journal of Development Economics 104:212–32.
Hungi, N., and F. W. Thuku. 2010a. Differences in pupil achievement in Kenya: Implications for policy and practice. International Journal of Educational Development 30:33–43.
———. 2010b. Variations in reading achievement across 14 Southern African school systems: Which factors matter? International Review of Education 56:63–101.
Hungi, N., D. Makuwa, M. Saito, S. Dolata, F. van Cappelle, L. Paviot, and J. Vellien. 2010. SACMEQ III project results: Pupil achievements levels in reading and mathematics. Southern and Eastern Africa consortium for monitoring educational quality. Working document 1.
Kane, E. 2004. Girls’ education in Africa: What do we know about strategies that work? Working Paper Series. Washington, DC: World Bank.
Lee, V. E., and T. L. Zuze. 2011. School resources and academic performance in Sub-Saharan Africa. Comparative Education Review 55(3):369–97.
Ministry of Education. 2002. Executive plan and investment program for basic education strategy. Sana’a, Yemen: Republic of Yemen.
———. 2012. Updated sectors’ plan “2013–2015”: Medium-range results framework. Sana’a, Yemen: Republic of Yemen.
———. 2013. Yemen education sector plan midterm results framework 2013–2015: A document of Yemen Ministry of Education. Sana’a, Yemen: Republic of Yemen.
Ministry of Health and Population and UNICEF. 2008. Yemen multiple indicator cluster survey 2006, Final report.
Muller, C. 1998. Gender differences in parental involvement and adolescents' mathematics achievement. Sociology of Education 71(4):336–56.
Mullis, I. V. S., M. O. Martin, P. Foy, and A. Arora. 2012. TIMSS 2011: International results in mathematics. TIMSS and PIRLS International Study Center, Boston College.
Ogawa, K., K. Shimada, and M. Nishimura. 2012. Chapter 11: An input and output analysis in primary education in Kenya, Malawi and Uganda: Findings from SACMEQ data. Unpublished manuscript.
Paxson, C., and N. Schady. 2005. Cognitive development among young children in Ecuador: The roles of wealth, health and parenting. World Bank Policy Research Working Paper 3605. Washington, DC: World Bank.
Stromquist, N. P. 1997. Increasing girl’s and women’s participation in basic education. Paris: UNESCO.
UNESCO. 2005. Education for all global monitoring report 2005: The quality imperative. Paris: UNESCO.
———. 2011. Education for all global monitoring report 2011: The hidden crisis: Armed conflict and education. Paris: UNESCO.
———. 2012. Education for all global monitoring report 2012: Youth and skills: Putting education to work. Paris: UNESCO.
United Nations. 2013. A new global partnership: Eradicate poverty and transform economies through sustainable development. The report of the high-level panel of eminent persons on the post-2015 development agenda. New York: United Nations.
USAID. 2008. Education from a gender equality perspective. Washington, DC: USAID. Verspoor, A.M. 2008. At the crossroads: Choices for secondary education in Sub-Saharan
Africa. Washington, DC: World Bank.

29
Woessmann, L. 2011. Cross-country evidence on teacher performance pay. Economics of Education Review 30:404–18.
World Bank and Republic of Yemen. 2010. Education Status Report: Challenges and Opportunities. Washington, DC: World Bank.
World Bank. 2003. Better governance for development in the Middle East and North Africa: enhancing inclusiveness and accountability. Washington, DC: World Bank.
———. 2006. Tracking basic education expenditures in Yemen: Analyses of public resource management and teacher absenteeism. Washington, DC: World Bank.
———. 2007. Global monitoring report 2007: Millennium Development Goals: Confronting the challenges of gender equality and fragile states. Washington, DC: World Bank.
———. 2010. Quality of education in Colombia: Achievement and challenges ahead: Analysis of the results of TIMSS 1995–2007. Washington, DC: World Bank.
———. 2013. Project appraisal document on a proposed grant to the Republic of Yemen for a second basic education development project. Washington, DC: World Bank.
Yuki, T., and Y. Kameyama. 2013. Improving the quality of basic education for the future youth of Yemen post Arab Spring. Global Economy & Development, Global Economy and Development Working Paper 59. Washington, DC: Brookings.
Yuki, T., K. Mizuno, K. Ogawa, and M. Sakai. 2013. Promoting gender parity in basic education: Lessons from a technical cooperation project in Yemen. International Review of Education 59:47–66.

30
Table 1
Not reading (%)b
ca. 2000 ca. 2010
Mali 41.9 62 92
Zambia 70.3 91.4 91
Yemen 56.3 77.6 42
Ethiopia 40.3 81.3 22
Net enrollment ratios (NER) in primary education and the
share of the sampled 2nd
grade students who are unable toread any word in the first line of a narrative, selectedcountries.
NER in primary(%)a
Sources: a
World Bank online data, accessed June 2013.
b
Global Partnership for Education (2012: 140), Early grade reading assessment (EGRA).
Note: Sampled students were assessed at the end of grade 2.
Table 2
Public education expenditure and primary enrollment rates, selected countries, circa 2010.
Indicators Yemen Senegal Ghana Vietnam Lao
Public expenditure on education as % of GDP 5.2 a 5.6 5.5 5.3 a 3.3
Public expenditure per primary school pupil as a % ofGDP per capita.
18.2 b 16.4 11.4 19.4 a n/a
Net enrollment rate. Primary. Total 77.6 75.5 84.0 b 98.0 96.8
Net enrollment rate. Primary. Female 70.0 77.7 84.4 n/a 95.4
Gender parity index for net enrollment rate. Primary 0.83 1.06 1.01 n/a 0.97
GDP per capita (current US$) 1,291 1,034 1,319 1,224 1,158
Source: World Bank online data; UNESCO Institute for Statistics online data, accessed December 2012.a for 2008 and
b for 2011.
Table 3
Overview of data sets used in this paper.
NamesTarget of analyses and sampleselection
Measure of learning outcome(test)
Questionnaires for othervariables
JICA-ERDCa 2011 Grades 5 & 6
b students, -Student general
(March to April) -Math teacher
-School director
(with more questions thanTIMSS 2007questionnaires)
TIMSS 2011 Grade 6b students, -Student general
(April, by ERDC) Random from nationwide -Math teacher
-School director
TIMSS 2007 Math released
items for Grade 4b
TIMSS 2011 Math items for
Grade 4b
a ERDC: Education Research and Development Center, Yemen.
Random from underservedrural schools of oneGovernorate (Dhamar)
b Given the low score of Yemeni grade 4 students in TIMSS 2007; both surveys assessed upper-grade students
using the grade-4 test.

31
Table 4
Description of variables: 2011 JICA ERDC survey.
Variables Description
GPI change in enrollment, 2004-2007GPI change in enrollment between 2004 and 2007 at school level was higher than the governorate average(1: high, 0: other)
GPI change in enrollment, 2007-2010 GPI change in enrollment between 2007and 2010 at school level
Enrollment growth rate from 2007-2010 (grades1-6) Grades 1-6 students' enrollment growth rate between 2007 and 2010 at school level
Student’s grade Is the student in 6th grade? (1: grade 6, 0: grade 5)
Student’s gender dummy Is the student a boy or a girl? (1: female, 0: male)
Availability of 5 goods in student's homeDoes the student have any of these things at his/her home? Availability of 5 goods in student's home(presence of calculator, computer, study desk, dictionary, electricity)
Father's literacy statusWhat is the education of the student's father or male guardian? (1: literate or equal to or more than Basiceducation; 0; illiterate)
Mother's literacy statusWhat is the education of the student's mother or female guardian? (1: literate or equal to or more than Basiceducation; 0: illiterate)
Father's work at agricultureWork of the student's father or male guardian (1:agriculture, 0:different activities [public nonagriculture,private nonagriculture, and others])
Father's work at public or private non-agricultureWork of the student's father or male guardian (1: public or private nonagriculture, 0: different activities[agriculture and others])
Mother's work at agricultureWork of the student's mother or female guardian (1:agriculture, 0:different activities [public nonagriculture,private nonagriculture, and others])
Mother's work at public or private non-agricultureWork of the student's mother or female guardian (1: public or private nonagriculture, 0: different activities[public nonagriculture, private nonagriculture, and others])

32
Teachers and teaching:
Students per teacher are above 35Student-teacher ratio in 2010/11 (1=equal to or more than 35 pupils of grades 1-9 per teacher withpermanent contract: 0 = less than 35 pupils)
Number of years in teaching Teaching experience years
Teacher's education Teachers with unversity degree (1: university, 0: no)
Training experience Training during the last 5 years? (1: yes, 0: no)
Frequency of using word problemsIn teaching mathematics to grades 5 and 6, how often does the teacher teach equations using wordproblems? (1: never, 2: some lessons, 3: half of the lessons, 4: every lesson)
Frequency of student’s arithmetic homeworkHow many times does the student's teacher give him/her mathematics homework? (1: never, 2: some days,3:one time per-day, 4: after each lesson)
Hours for lesson preparation by teacherHours of lesson preparation outside school per week (1: one hour or less, 2: one to two hours, 3: more than 3hours)
Parents and communities:
Presence/absence of a workshop on the quality ofeducation attended by parents
Was there any training or workshop for parents in this school during the past 5 years on participation inimproving school quality? (1: yes, 0: otherwise)
Time of establishing fathers’ councilFathers’ council has been established equal to or more than 5 years ago (1: five or more years ago, 0:otherwise)
School committee including parent representativeDoes your school have a school committee whose members include parents’ representatives and areresponsible to prepare and implement a school improvement plan? (1: yes, 0: no)
Education fees paid by parents (number of items)Do households of students in grade 6 need to pay for the following items? (girls' registration fees, boys'registration fees, examination fees, textbook delivery, school maintenance)
33
Others:
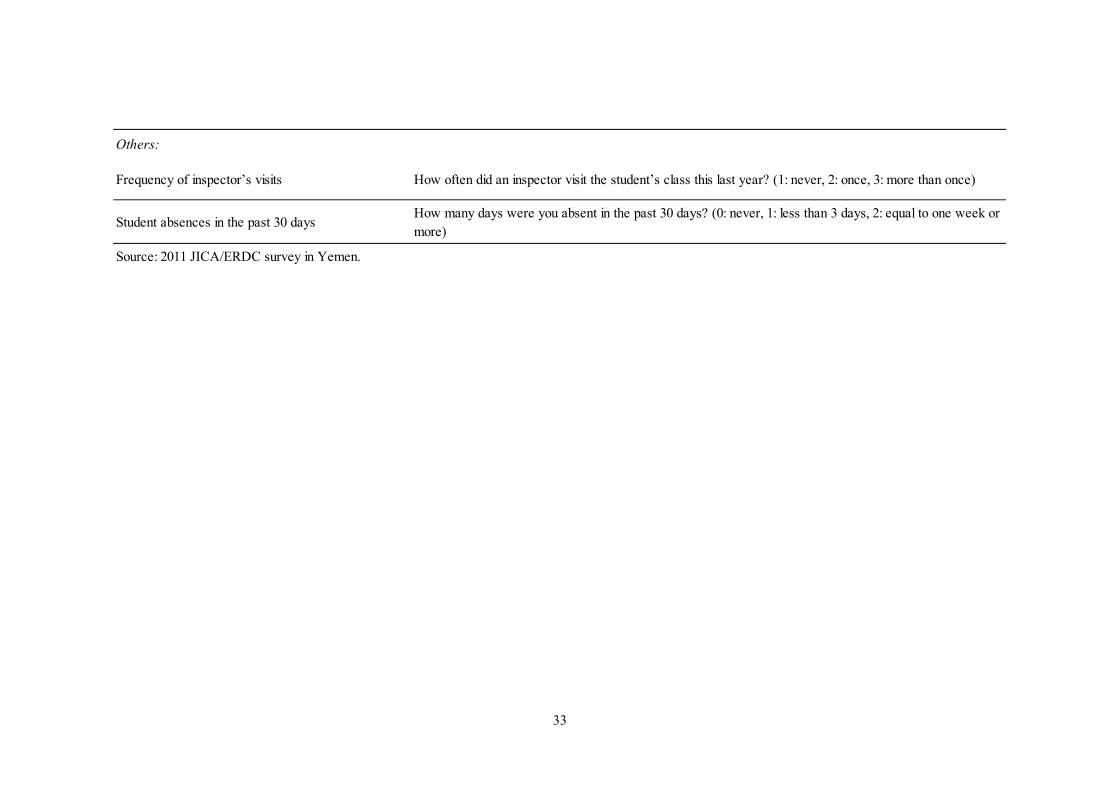
Frequency of inspector’s visits How often did an inspector visit the student’s class this last year? (1: never, 2: once, 3: more than once)
Student absences in the past 30 daysHow many days were you absent in the past 30 days? (0: never, 1: less than 3 days, 2: equal to one week ormore)
Source: 2011 JICA/ERDC survey in Yemen.

34
Table 5
Description of variables: 2011 TIMSS survey.
Variables Description
Teachers and teaching:
Number of students in class How many students are in this class?
Number of years in teaching By the end of this school year, how many years altogether will you have been teaching?
Teacher's training participation in the past 2 years (1: yes,0: no)
In the past two year, have you participated in professional development in mathpedagogy/instruction? (1: yes, 0: no)
Teacher's education level (1: university degree, 0: no) Teacher's education level (1: university degree, 0: no)
Others
Frequency of information provision to parents (4: morethan 3 times a year)
How often does your school inform parents about school accomplishments (e.g..,tournaments)? (4: more than 3 times a year, 3: 2-3 times a year, 2: once a year, 1: never)
Frequency of parental involvement in student's homework(4: everyday)
How often do your parents make sure that you set aside time for your homework? (4: everyday, 3: once or twice a week, 2: once or twice a month, 1: never)
Instruction affected by shortage of textbooksHow much is your school affected by a shortage of instructional materials? (4: not at all, 3: alittle, 2: some, 1: a lot)
Student's gender (1: female, 0: male) Student's gender (1: female, 0: male)
Student's own book at home (1: yes, 0: no) Do you have any books of your very own (not count school books)? (1: yes, 0: no)
School location (1=suburban) School is located in suburban
School location (1=medium size city) School is located in medium size city
School location (1=small town) School is located in small town
School location (1=remote rural area) School is located in remote rural area
Source: TIMSS 2011.
35
Table 6Estimation results, 2011 JICA ERDC survey.Variables (1)-a (1)-b (1)-c (2)-a (2)-b (2)-c (2)-d (3)GPI change in enrollment,2004-2007
-39.72 (5.71) *** -36.20 (5.76) *** -41.54 (5.78) *** -31.82 (5.81) *** -27.09 (5.61) *** -32.79 (5.87) *** -25.49 (5.52) ***
GPI change in enrollment,2007-2010
-54.26 (17.21) *** -48.08 (16.18) *** -66.24 (19.41) *** -62.05 (19.1) ***
Enrollment growth ratefrom 2007-2010 (grade1-
-94.09 (13.42) *** -91.37 (13.05) *** -43.34 (14.77) *** -37.17 (14.48) ***
Student’s grade (1:grade6,0: grade5)
16.81 (5.46) *** 16.69 (5.39) *** 16.37 (5.38) *** 10.83 (4.96) ** 10.33 (4.97) ** 10.99 (4.93) ** 10.09 (5) ** 9.71 (5.04) *
Student’s gender dummy(1: female, 0: male)
8.92 (5.32) * 9.94 (5.26) * 10.10 (5.25) * 10.32 (4.7) ** 11.12 (4.69) ** 10.46 (4.69) ** 11.01 (4.7) ** 11.92 (4.75) **
Teachers and teaching:
Students per teacher are above 35(1: yes, 0: no)a -23.38 (5.13) *** -20.38 (5.14) *** -19.59 (5.12) *** -24.91 (5.24) *** -22.32 (5.33) ***Number of years in teaching 4.35 (0.59) *** 4.60 (0.58) *** 4.48 (0.57) *** 4.46 (0.59) *** 5.05 (0.59) ***Teacher's education (1:university, 0:no) 7.82 (5.65) 15.57 (6.22) ** 13.97 (6.17) ** 8.44 (5.67) 7.05 (5.78)Training experience (1: yes, 0: no) 8.41 (5.48) 10.52 (5.42) * 8.60 (5.51) 10.44 (5.39) * 10.34 (5.46) *Frequency of using word problems 7.83 (2.67) *** 12.43 (2.7) *** 9.26 (2.71) *** 11.00 (2.65) *** 9.80 (2.64) ***Frequency of student’s arithmetic homework 5.62 (3.07) * 5.69 (3.07) * 5.60 (3.08) * 5.72 (3.05) * 6.85 (3.07) **Hours for lesson preparation by teacher 28.81 (3.73) *** 24.82 (3.57) *** 28.73 (3.77) *** 24.60 (3.55) *** 26.36 (3.62) ***Parents and communities:
Presence/absence of a workshop on the quality of education attended by parents 21.09 (5.04) *** 16.57 (4.84) *** 22.42 (5.07) *** 14.54 (4.85) *** 13.91 (4.89) ***
Time of establishing fathers’ council 47.30 (5.61) *** 45.94 (5.63) *** 45.01 (5.61) *** 48.71 (5.65) *** 49.35 (5.71) ***
School committee including parent representative 21.33 (5.7) *** 9.92 (6.14) 17.05 (6.09) *** 14.40 (5.71) ** 18.01 (5.75) ***
Education fees paid by parents (number of items) 24.42 (3.02) *** 25.89 (2.99) *** 23.63 (3.12) *** 27.00 (2.89) *** 24.88 (2.87) ***
Others:
Frequency of inspector’s visit (3: more than once) 20.87 (3.79) *** 20.88 (3.86) *** 20.09 (3.84) *** 21.86 (3.81) *** 23.16 (3.77) ***
Student absences in the past 30 days (2: equal to one week or more) -9.59 (3.41) *** -9.52 (3.38) *** -9.73 (3.39) *** -9.35 (3.4) *** -8.28 (3.44) **
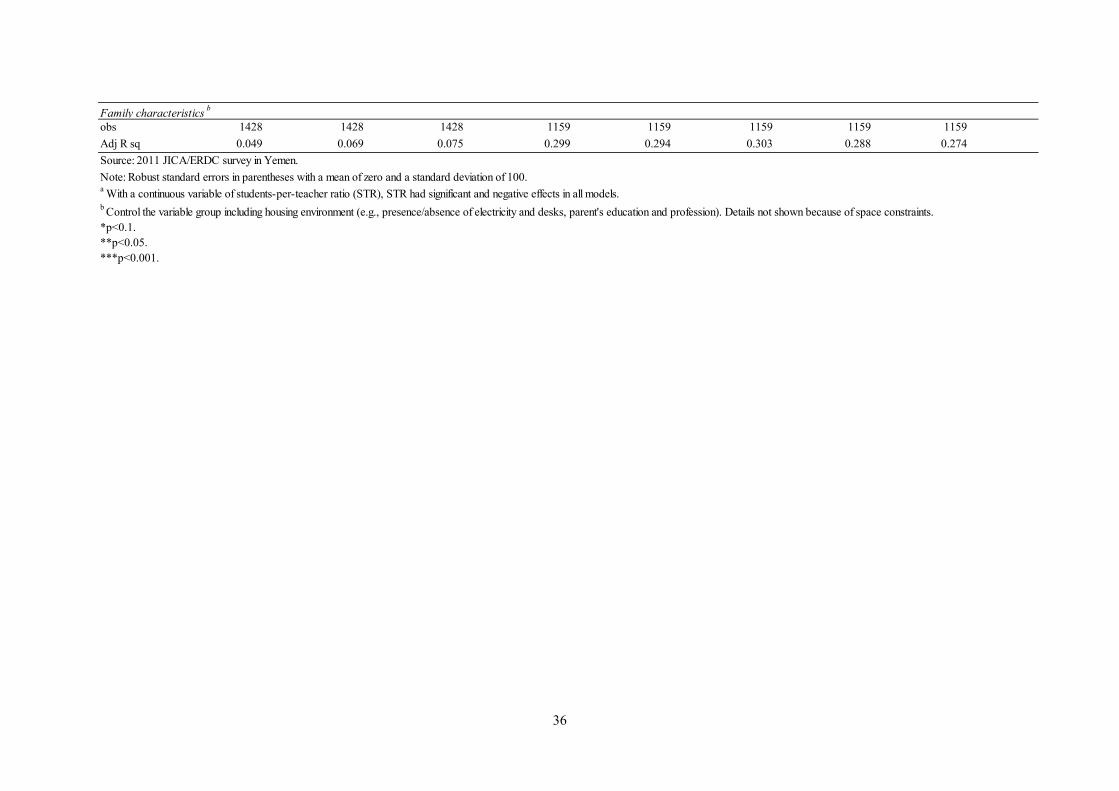
36
Family characteristics b
obs 1428 1428 1428 1159 1159 1159 1159 1159
Adj R sq 0.049 0.069 0.075 0.299 0.294 0.303 0.288 0.274
Source: 2011 JICA/ERDC survey in Yemen.
Note: Robust standard errors in parentheses with a mean of zero and a standard deviation of 100.a With a continuous variable of students-per-teacher ratio (STR), STR had significant and negative effects in all models.b Control the variable group including housing environment (e.g., presence/absence of electricity and desks, parent's education and profession). Details not shown because of space constraints.*p<0.1.**p<0.05.***p<0.001.

37

38
Middle Income
200
300
400
500
600
700
- 5,000 10,000
Gra
de 4
mat
h sc
ore
GDP per capita (current US$) in 2011
Yemen
Yemen(G6)a
Fig.1a. Mathematics achievement in middle-income countries, 2011 TIMSS.Source: TIMSS 2011; GDP per capita (current US$) from World Bank online data, accessed December 2012.a Three countries participated at sixth grade, those are: Botswana, Honduras and Yemen.b Countries classified by 2011 GDP per capita (current US$) .
Fourth Grade Participating Countries Sixth Grade Participating Countries a
Middle-Income Countries b
Fig. 1b. Score in primary education and GDP per capita in low- and lower middle-income countries.Source: Global Partnership for Education, 2012 (original from Altinok, 2010); World Bank online data for GDP, accessed December 2012.
20
25
30
35
40
45
50
55
60
0 500 1000 1500 2000 2500 3000
Scor
es in
prim
ary
educ
atio
n
GDP per capita(current US$) in 2010
Yemen
Note: Scores were calculated from the results of the Latin American Laboratory Assessment of the Quality of Education (LLECE), Programme for Analyzing Education Systems of Confemen's Countries Members (PASEC), the Progress in International Reading Literacy Study (PIRLS),the Southern and Eastern Africa Consortium for MonitoringEducational Quality (SACMEQ), and the Trends in International Mathematics andScience Study (TIMSS) to the U.S. National Assessment of Educational Progress.

39
less than 0.70.70-0.790.80-0.890.90 or more
Fig. 2. Female-to-male student ratio by governorate, grades 1-6, Yemen.Source: Prepared by author using Yemen Annual Education Survey 2009/2010.
Dhamar

40
02
04
06
08
0
-.2 0 .2 .4 .6changGPI16_0710
T_Score_r Fitted values
Fig. 3a. Increase of GPI and student scores, 2011 JICA-ERDC survey.Note: Y: Score, X: Change in GPI (g 1- 6), 2007 to 2010.Source: 2011 JICA/ERDC survey in Yemen.
02
04
06
08
0
-.2 0 .2 .4 .6grwtot16_0710r
T_Score_r Fitted values
Fig. 3b. Total enrollment growth rate and student scores, 2011 JICA-ERDC survey.Note: Y: Score, X: Change in enrollments, 2007 to 2010.Source: 2011 JICA/ERDC survey in Yemen.

41
02
04
06
08
0
0 10 20 30 40 50 60 70 80 90str_pt_10
T_Score_r Fitted values
Fig. 3c. Students-to-teacher ratio and the student scores, 2011 JICA-ERDC survey. Note: Y: Score, X: Students-to-teacher ratio.Source: 2011 JICA/ERDC survey in Yemen.

42
02
004
006
00
0 50 100 150t11_clsize
t11_score Fitted values
Fig. 4a. Class size and student score, 2011 TIMSS, nationwide. Note: Y: Score, X: Class size.Source: 2011 JICA/ERDC survey in Yemen.
02
004
006
00
0 20 40 60 80t11_clsize
t11_score Fitted values
Fig. 4b. Class size and students scores, 2011 TIMSS, remote rural areas. Note: Y: Score, X: Class size.Source: 2011 JICA/ERDC survey in Yemen.

43
Abstract (in Japanese)
要約
本論文では、初等教育へのアクセスと教育の質のトレードオフという潜在的問題を取り
上げている。過去10年間に著しい進展を見せたものの、依然として教育へのアクセス、
衡平性、質の課題を抱えるイエメンを事例国とし、とりわけ教育機会が不足している村
落部に焦点を当てた実証研究である。分析には、JICA 研究所がイエメン教育省の研究所
と2011年に同国で収集した生徒及び学校レベルのデータ、また2011年の国際数
学・理科教育調査(TIMSS)からのデータを用いた。まず、学校におけるアクセスの変化
を就学生数の増加及びジェンダー格差指数の改善で計測し、学習成果との関係について
分析した。アクセスの拡張と学習の質について、トレードオフの関係があると示唆され
る結果となった。すなわち、生徒及び保護者の教育レベルや職業など家計の特性を制御
した上で、過去3年間ジェンダー格差指数がより改善した学校、就学生数がより増加し
た学校では、他の学校と比較し、現在の生徒の算数テストの結果が低くなる傾向が示さ
れた。次に、教育サービスの質を示唆する他の変数と学習成果との関係について分析し
た。教員配置やコミュニテイ参加に係る学校の特性等が、学習成果と有意な関係にある
ことが分かった。本研究結果は、教育の機会が不足している地域に対しても教育の質の
スタンダードの確保しながら、質における国内差の拡大を避け、更にすべての子供の学
習のためにアクセスを拡張していく施策を再考する必要性を示唆している。