chandra observations of rx 51914.4+2456: spin-up of a
TRANSCRIPT

CHANDRA Observations of RX 51914.4+2456: Spin-up of a White Dwarf?
Tod E. Strohmayer
Laboratory for High Energy Astrophysics, NASA 's Goddard Space Flight Center, Greenbelt, MD 20771; [email protected]
ABSTRACT
RX 51914.4+2456 is a candidate double-degenerate binary with a putative 1.756 mHz orbital frequency. In a previous timing study using archival ROSAT and ASCA data we reported evidence for an increase of the putative orbital frequency at a rate consistent with expectations for gravitational radiation from the system. Here we report the results of new Chandra timing observations which confirm the previous indications of spin-up of the X-ray frequency, and provide much tighter constraints on the frequency derivative, u. We obtained with Chandra a total of 75 ksec of exposure in two epochs separated in time by 10.3 months. The total time span of the archival ROSAT, ASCA and new Chandra data is now 10.2 years. This more than doubles the interval spanned by the ROSAT and ASCA data alone, providing much greater sensitivity to a frequency derivative. With the addition of the Chandra data an increasing frequency is unavoidable, and the mean i/ is 5.9f0.9 x 10-l' Hz s-'. Interestingly, power spectra of the longest Chandra pointing show evidence for a sideband structure to the 1.756 mHz frequency. The fundamental and first harmonic show evidence for upper sidebands with a frequency separation of E 0.5 mHz from their parent peaks. Additionally, the first and second harmonics show evidence for lower sidebands with approximately half the frequency separation of the upper sidebands. Similar sideband structure is a common feature of Intermediate Polars (Ips)-although it is usually observed in the optical-and suggests the presence of a longer period in the system, perhaps the previously unseen orbital period. If this is correct the sideband structure indicates an orbital period close to 1 hr, and the observed u likely represents the accretion-induced spin-up of a white dwarf. We discuss the implications of these findings for the nature of RX J1914.4+2456.
Subject headings: Binaries: general - Stars: individual (Rx J1914.4+2456) - Stars: white dwarfs - cataclysmic variables - X-rays: stars - X-rays: binaries
1

- 2 - .
1. Introduction
Ultra-compact binary systems could provide a promising means to observe directly the influence of gravitational radiation on orbital evolution. Moreover, such systems would be ideal sources for detection with spaced based gravitational radiation observatories (such as the planned NASA/ESA LISA mission), opening up the possibility for detailed studies of compact interacting binaries.
In recent years a pair of candidate ultra-compact systems; RX J1914.4+2456 (hereafter 51914) and RX 50806+1527 (hereafter 50806) have been proposed. These objects were first discovered by ROSAT (Motch et al. 1996; Israel et al. 1999; Beuermann et al. 1999), and initially were suggested to be members of a “soft” class of Intermediate Polars (IPS), with the X-ray periods of 569 and 321 s, respectively, representing the putative spin periods of the accreting white dwarfs. Since their discovery extensive follow-up observations have identified the optical counterparts (Ramsay et al. 2000; Israel et al. 2002; Ramsay, Hakala & Cropper 2002). Their soft X-ray spectra, the shape of the X-ray modulation, the phasing of the X-ray and optical modulations, the lack of additional longer periods, and the lack of strong optical emission lines have all called into question their IP credentials (for a discussion see Cropper et al. 2003). However, Norton, Haswell & Wynn (2003) have argued that an IP interpretation is still plausible if the systems are stream-fed, pole-switching accretors (ie. no accretion disk), and are viewed from a nearly face-on geometry.
I t was Cropper et al. (1998) who first suggested that 51914 might be a double-degenerate compact binary. They proposed a synchronized, magnetic accretor (polar-like) model with accretion powering the X-ray flux. A non-magnetic variant was subsequently proposed by Marsh & Steeghs (2002). In this Algol-like model, the accretion stream impacts directly onto a non-magnetic primary, and the spins are not necessarily synchronized with the orbit. An interesting alternative not requiring accretion was proposed by Wu et al. (2002). They suggested a unipolar inductor model, analogous to the Jupiter - Io system (Clarke et al. 1996). If these systems are indeed compact, and thus the observed X-ray period is the orbital period, then an important discriminating factor is the magnitude and sign of the orbital evolution. If the systems are accreting stably from degenerate donors, the expected evolution is for the orbit frequency to decrease. In a previous study we (Strohmayer 2002) used archival ROSAT and ASCA data to explore the evolution of the 1.756 mHz X-ray frequency of 51914 over an M 5 yr time period, and found evidence for a positive frequency derivative, u, with a magnitude consistent with simple expectations for gravitational radiation induced decay of a circular orbit. Since a measurement of the frequency evolution places severe constraints on possible models, it is crucial to confirm the initial indications of orbital decay and place tighter constraints on i/. In this paper we present the results of new Chandru observations
- 3 -
which confirm an increase in the X-ray frequency and allow us to place much tighter limits on V . In $2 we describe the Chandra observations and the data extraction and analysis. In $3 we discuss our phase coherent timing study, and we show that the inclusion of the Chandra data conclusively indicates a positive i/ = 5.9 f 0.9 x Hz s-’. We then discuss the flux variability of the source and present evidence for a sideband structure to the 1.756 mHz modulation and its harmonics. Orbital sidebands are a common feature of IPS (see for example, Warner 1986; Warner 1995; Kuulkers et al. 2003 and references therein), and suggest that the 1.756 mHz frequency of 51914 may not be an orbital modulation. If the sideband structure reflects orbital motion, then the implied period is x 1 hr. In $4 we discuss the implications of our findings for the nature of 51914. We conclude in $5 with a brief summary and goals for future observations.
2. Data Extraction
We obtained a total of M 75 ksec of exposure on J1914 with Chandra in February, November and December 2003. A summary of these observations is given in Table 1. We observed with ACIS-S in Continuous Clocking (CC) mode in order to mitigate the effects of pile-up. To maximize the soft photon response the aimpoint was on the backside illuminated (S3) chip. Preliminary spectral analysis shows that virtually all the source photons have energies less than 1 keV. For the purposes of our work reported here we used only < 1 keV photons. Details of the Chandra spectroscopy will be presented in a future paper.
To prepare the data for a precise timing analysis we first corrected the detector read out times to arrival times following the CXC analysis thread on timing with CC mode data. We then corrected the arrival times to the solar system barycenter using the CIAO tool azbary. We used the same source coordinates employed for analysis of the ROSAT and ASCA data (see Strohmayer 2002). The CC mode produces a one-dimensional “image” of the portion of the sky exposed to the detectors. A realization of this image for the February, 2003 observations is shown in Figure 1. J1914 is the strong peak in the “image.” We extracted only events from within the source peak for our timing study. Figure 2 shows a portion of the lightcurve produced from the source extracted events, and demonstrates that Chandra easily detects individual pulses from the source. We carried out this procedure on all the data and obtained a total of 23,731 good events for our timing analysis.

-4- ,
3. Results
3.1. Coherent Timing Analysis
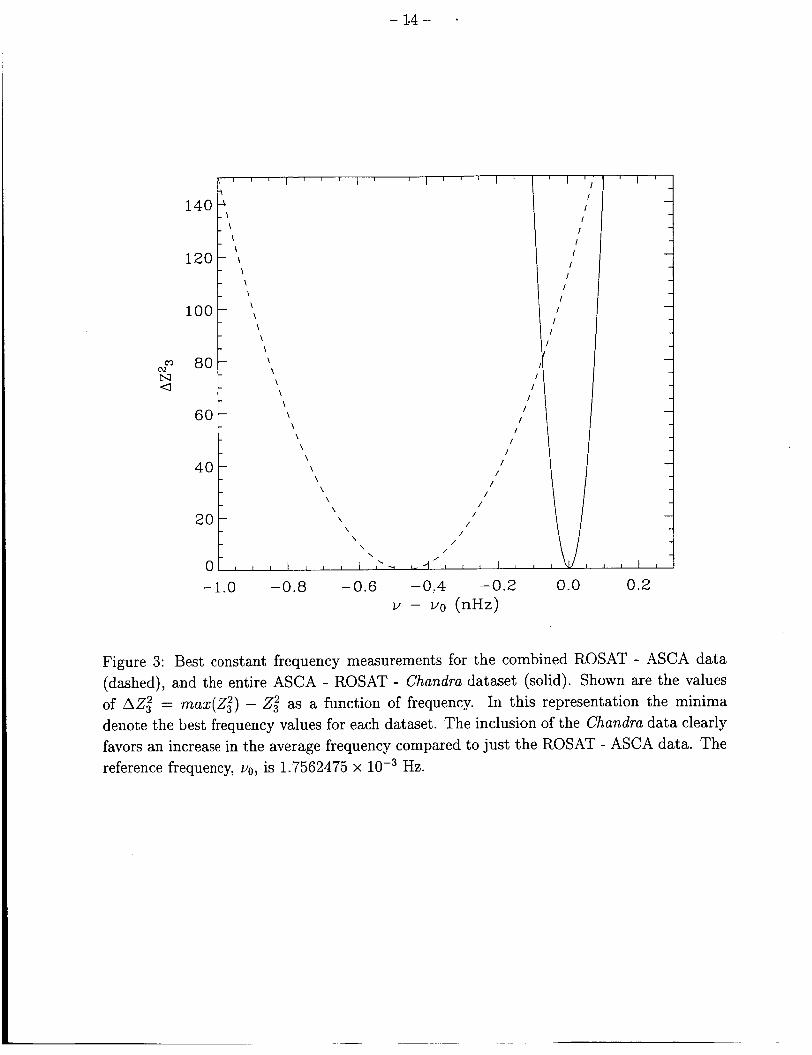
We performed our coherent timing studies using the 2; statistic. Since the method is described in our earlier paper we do not repeat the details here (see Strohmayer 2002). As a first step we calculated two 2; power spectra. We first used just the earlier ROSAT and ASCA data, and then we included the new Chandra data. The results are shown in Figure 3. We show the difference, AZ;, between the peak value of 2; and the values at other frequencies. The minima denote the best frequencies for the ROSAT + ASCA data (dashed), and the ROSAT + ASCA + Chandra data (solid). The reference frequency in this plot is vo = 1.7562475 x Hz. Figure 3 demonstrates in a straightforward way that the data favor an increase in the frequency in the time between the mean epoch of the ROSAT and ASCA data and that of the entire dataset (including the new Chandra data). A simple estimate of the mean frequency derivative can be obtained by simply dividing the measured frequency increase by the time interval between the mean epoch of the two datasets. This gives a value < i, >= 0.46 x lo-’ Hz/2.82 yr = 5.2 x Hz s-l, which is consistent with the limits on i, deduced from our earlier study as well as the more detailed analysis described below.
From our earlier study of the ROSAT and ASCA data we found only one other remotely plausible solution. This had an unphysically large and negative i, Hz s-’, and was less favored in that it had a Ax2 = 11.5 from the best solution. The new Chandra data definitively rules out this candidate solution simply because the frequency measured at the Chandra epoch is inconsistent with the ROSAT + ASCA frequency and the large i, for this solution.
-1 x
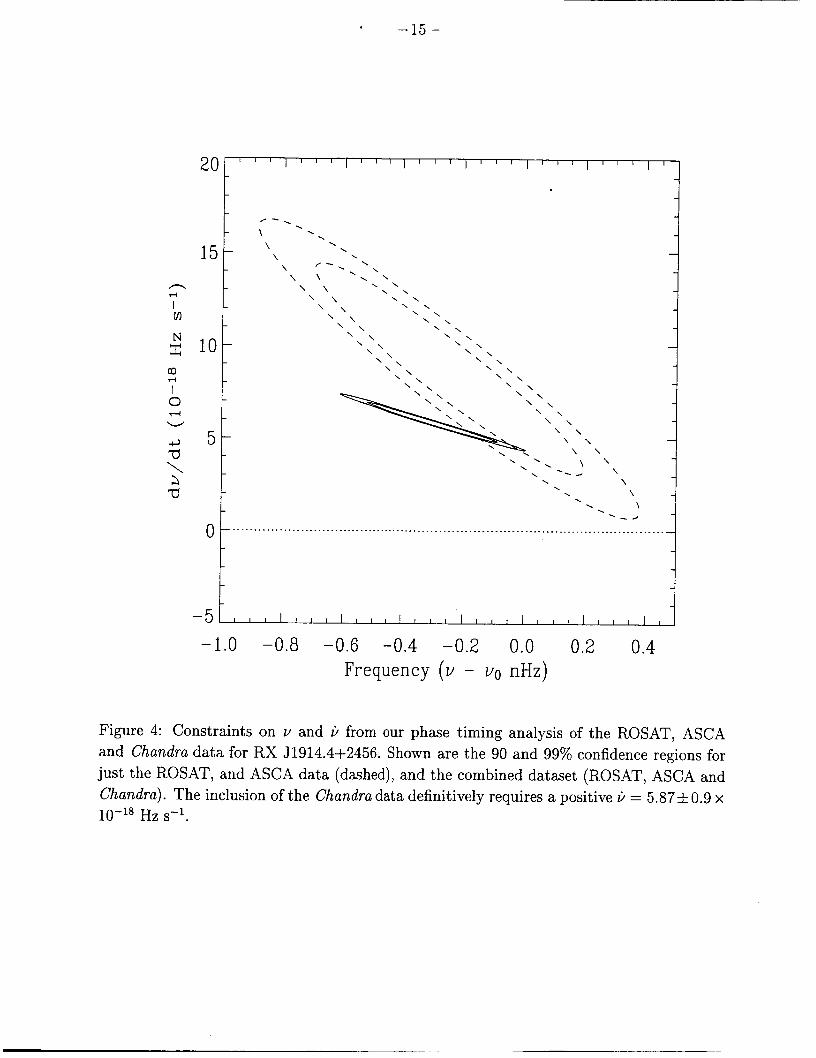
We next performed a coherent, phase connected timing analysis to jointly constrain vo and i,. As in our previous study we carried out a grid search by calculating x2 at each vo, i, pair (see Strohmayer 2002 for details). The results are summarized in Figures 4, 5 and 6. Figure 4 shows two pairs of Ax2 confidence contours. The large dashed contours represent the constraints derived only from the ROSAT and ASCA data, and the solid contours represent the best solution obtained with the inclusion of the new Chandra data. The analysis definitively favors a positive i, = 5.9 x Hz s-’. Although the presence of a long term spin up trend in the data is now indisputable, the minimum x2 value of 290 (with 92 degrees of freedom) for our best fit is formally high. This high value is indicative of some additional “timing noise” in the system. Because of this we first scaled the x2 values by the ratio 290/92 before plotting the confidence contours.
Figure 5 shows two representations of the phase measurements. The phase residuals

.- 5 -
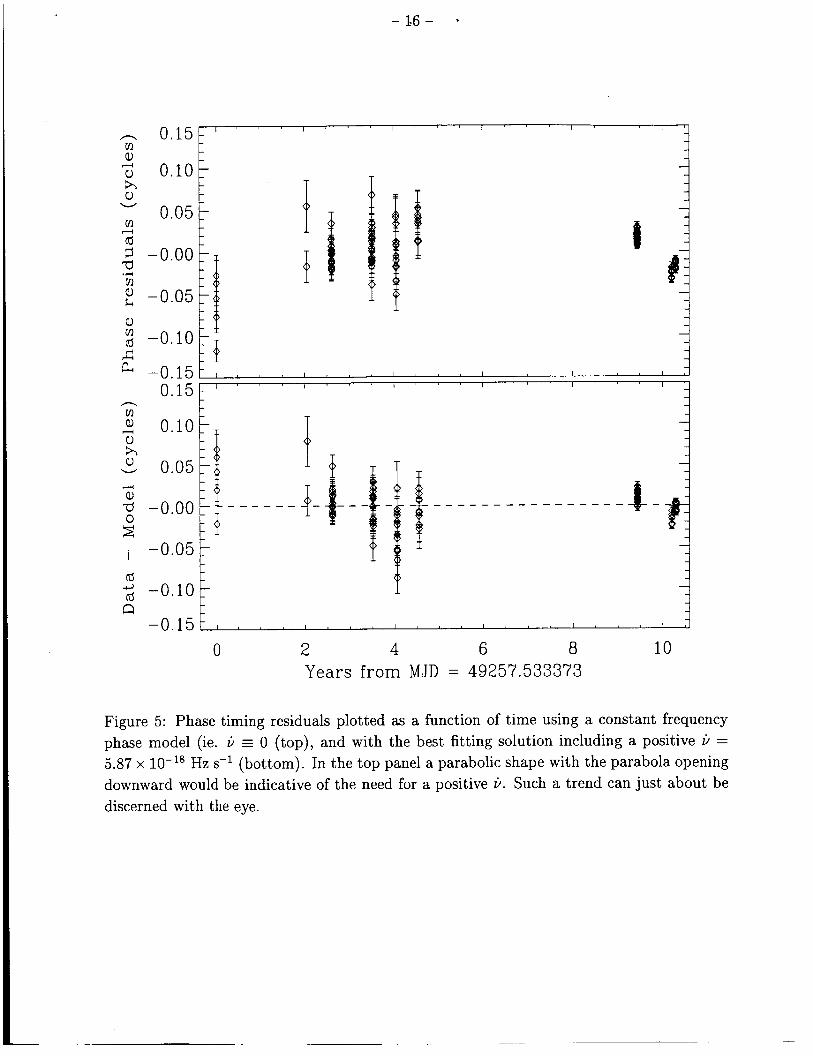
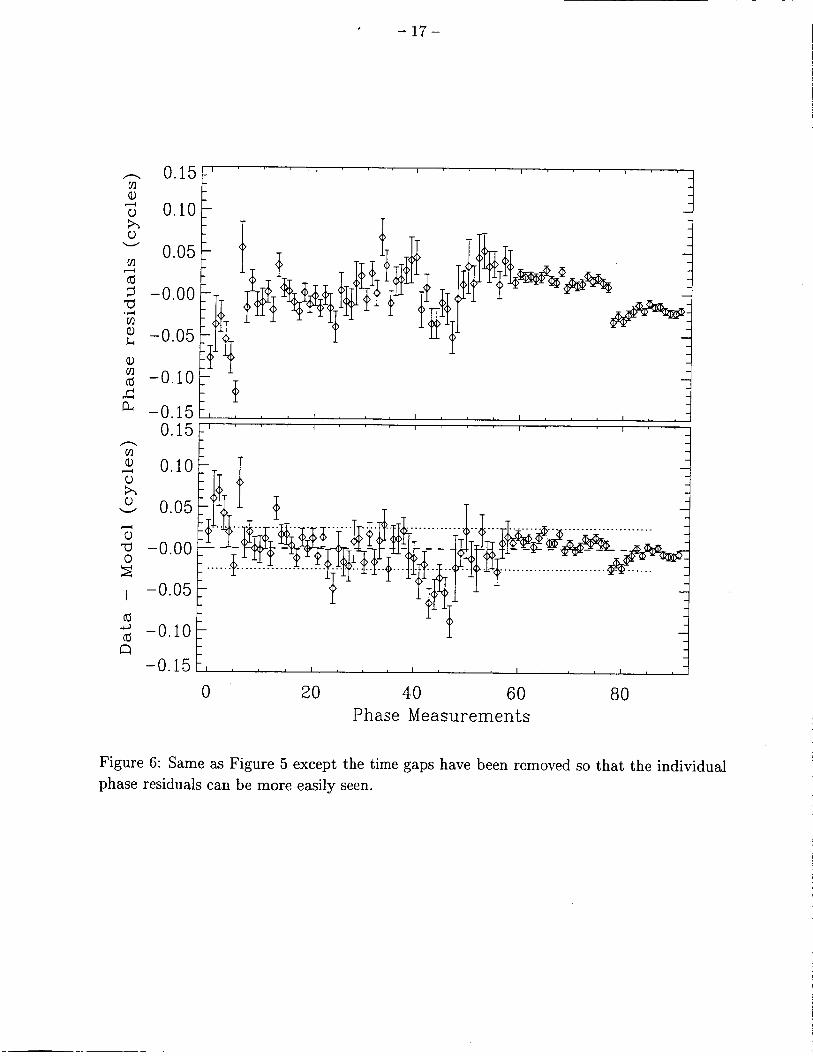
obtained with i/ = 0 and our best value for uo are shown in the top panel. In this represen- tation a positive i, (spin-up) will show up as a quadratic trend with the parabola opening downward. One can just about pick out such a trend with the eye. The phase residuals when including the best non-zero value of i, are shown in the bottom panel. Figure 6 is essentially identical to Figure 5 except the time gaps have been removed so that all the individual residuals can be more easily seen.
The presence of timing noise could in principle result from fluctuations in the spin up torque, or perhaps from modest changes in the profile of the pulsed emission. By monitoring the character of such fluctuations it might be possible to further constrain models for the spin up torque.
3.2. Flux Variability
An important constraint on models for J1914 is the present lack of any detectable periodicities with timescales longer than the 1.756 mHz X-ray modulation. If the system were in fact an IP, then one might expect that the longer, unseen orbital period might eventually be detected by sensitive observations. The Chundru data are sensitive enough to explore variability on a pulse by pulse basis. We did this by computing a lightcurve using our best fit period as the time bin size. The resulting lightcurve is shown in Figure 7. The data show evidence for both long term variations in the flux as well as pulse to pulse variations. For example, the flux during our last pointing was a factor of 3 higher than in the initial pointing. The longest pointing (2nd panel from the left) shows evidence for 30 - 50% variations in the flux within a few pulse periods.
Our 35.4 ksec pointing at J1914 is the longest contiguous observation of the source to date. This, combined with the higher signal to noise ratio in the Chundru data, allows for more sensitive searches for a putative IP orbital period. To search for periods longward of the 1.756 mHz frequency we computed a Fourier power spectrum of the 35 ksec pointing. The low frequency region of this power spectrum is shown in Figure 8. The three peaks which go off scale are the fundamental and first two harmonics of the 1.756 mHz frequency. There are a few peaks shortward in frequency of the fundamental, but none appear to be very significant. However, the fundamental and harmonic peaks show evidence for having a sideband structure. The most significant peaks are the upper sidebands to the fundamental and first harmonic peaks at 1.756 mHz and 3.512 mHz. These sidebands are separated in frequency from their parent peaks by about 0.48 mHz, and have Leahy normalized powers of 74.8 and 52.5. There also appear to be weaker lower sidebands accompanying the first and second harmonic peaks at 3.512 mHz and 5.28 mHz respectively. These lower sidebands are

separated in frequency by about 0.275 mHz from their respective harmonic peaks. The upper sidebands of the fundamental and first harmonic have a frequency separation consistent with approximately twice the frequency separation of the lower sidebands of the first and second harmonics.
The power spectrum shown in Figure 8 is normalized such that the distribution of noise powers for a purely random signal would be the x2 function with 2 degrees of freedom. As a guide to the eye a horizontal dotted line is drawn at a power level of 40. If the noise power distribution truly follows the expected x2 distribution then the single trial chance probability for a noise power of 40 is about 2 x lo-’, and the sideband peaks above this level would all be considered significant. A broad band red noise component could modify the distribution of noise powers away from the expected x2 distribution, but averaging the power spectrum in frequency space does not show any strong evidence for such a component. A second concern could be “leakage” of power from the strong fundamental and harmonic peaks. We applied a “Parzen window” to the lightcurve and then computed the power spectrum. Such windowing reduces the spectral leakage. The windowed power spectrum still showed the sideband peaks, although with marginally smaller peak powers. We conclude that leakage of spectral power cannot explain the appearance of the sidebands. We note that the upper sidebands to the fundamental and first harmonic have amplitudes which are down by factors of 7.9 and 6.7, respectively, from those of their parent peaks. The lower amplitudes of these features suggests to us that some caution in their interpretation is warranted. Moreover, we do not see the sideband structure at the same significance in any of the shorter pointings. Based on these considerations we think the sidebands are real, however, we think it is crucial that they be confirmed with additional observations.
Although there is no significant power spectral feature with a period longward of the 569 s period, the evidence of sideband structure appears to be an indication of a longer period in the system, most likely the orbital period, in analogy with sidebands seen in IPS (Warner 1986). The smallest sideband offset frequency corresponds to a timescale of about 1 hour. This would be among the shortest known IP orbital periods (see Ritter & Kolb 2003).
4. Implications for the Nature of J1914
Our Chandra data definitively show that the 1.756 mHz X-ray modulation of 51914 is increasing at a mean rate of M 6 x Hz s-’. This rate is consistent with what would be expected if the X-ray modulation is the orbital period of an ultracompact system and it’s orbit were decaying via emission of gravitational radiation (see Strohmayer 2002). However, the Chundra data also show indications of a sideband structure and thus a longer period in
the system. Although the sidebands are weak compared to the 1.756 mHz modulation and in our opinion need to be confirmed with more sensitive observations, they appear to cast significant doubt on the ultracompact scenario for J1914.
If the sideband structure is an indication of an G 1 hr orbital period for 51914, then we may indeed be seeing the spin-up of an accreting white dwarf in a low-inclination IP system, as suggested by Norton, Haswell & Wynn (2002). In this scenario the white dwarf accretion is stream-fed and switches from pole to pole and back again on the synodic period. An accretion disk would form if the magnetospheric radius is less than the circularization radius for the accretion stream. In order not to form a disk and for J1914 to be stream-fed the orbital period must satisfy Porb < 2.37 hr (Norton et al. 2002). This limit is consistent with a putative orbital period of 1 hr suggested by the sideband structure. If this scenario is correct, then the secular spin up is due to accretion onto the white dwarf, and other aspects of the observations, for example, the long term flux variability and the phase timing noise, can be more easily understood in terms of variations in the mass accretion rate. This identification would also preclude the need to invoke more “exotic” models, such as the Wu et al. (2002) electric star scenario.
However, some intriguing questions remain, for example, the soft X-ray spectrum, the absence (or at least weakness) of optical emission lines, and the infrared photometry have all been used to argue against an IP identification (see Cropper et al. 2003 for a discussion). Norton et al. (2003) have argued that the relatively high mass accretion rates, of order 10-’MO yr-’, required for accretion to power the observed X-ray flux, as well as the nature of stream-fed accretion may mitigate most of these perceived difficulties. For example, a highly optically thick stream may mask the emission lines, and if the accretion is “buried” in the white dwarf surface layers, then it may manifest itself with predominantly soft blackbody emission.
Since 50806 appears to be a “sister” source to 51914 in most regards, the suggestion of a longer period in 51914 at least indirectly suggests that 50806 may also have a weak orbital signature which has not yet been detected. If such a feature were found it would tend to support the suggestion by Norton et al. (2003) that the observed He11 Pickering lines from J0806 (Israel et al. 2002) are contaminated by Balmer lines of Hydrogen from a putative main sequence companion. Such blending has been observed in the spectrum of XTE 52123-058 (Hynes et al. 2001), for example.

- 8 - 8
5. Summary
Our new Chandra data confirm that the 1.756 mHz X-ray frequency of RX 51914 is increasing at a rate of = 6 x lod1* Hz s-’. Although this rate is consistent with that expected from gravitational radiation losses in a detached ultracompact binary, the discovery of a sideband structure to the 1.756 mHz frequency casts doubt on the ultra-compact scenario for 51914. The observed spin up, flux variability and timing noise can then be readily understood in the context of accretion onto a white dwarf.
The sidebands we have found are weak, and not apparently detectable in all but the longest Chandra pointing at J1914. Because of this it is extremely important that more sensitive observations be carried out t o confirm the sideband signatures. Since the strength of such power spectral features are proportional to the X-ray counting rate, XMM/Newton observations of the source would be particularly sensitive. Moreover, continued phase co- herent timing with Chandra can further quantify the nature of the torque fluctuations and provide additional evidence for magnetically controlled accretion.
We thank Richard Mushotzky, Zaven Arzoumanian, Jean Swank and Craig Markwardt for many helpful comments and discussions. This work made use of data obtained from the High Energy Astrophysics Science Archive Research Center (HEAS ARC) at Goddard Space Flight Center.
References
759
Beuermann, K., Thomas, H. -C., Reinsch, K., Schwope, A. D., Trumper, J. & Voges, W. 1999, A&A, 347,47.
Clarke, J. T. et al. 1996, Science, 274, 404
Cropper, M., Ramsay, G., Wu, K. & Hakala, P. 2003, ASP Conference Series to be published in Proc. Cape Town Workshop on magnetic CVs, held Dec 2002, (astro-ph/0302240).
Cropper, M. et al. 1998, MNRAS, 293, L57
Hynes, R. I. et al. 2001, MNRAS, 324, 180.
Israel, G. L. et al. 1999, A&A, 349, L1.
Israel, G. L. et al. 2002, A&A, 386, L13.
Kuulkers, E., Norton, A., Schwope, A. & Warner, B. 2003, in “Compact Stellar X-ray Sources,” ed. M. van der Klis & W. H. G. Lewin, (Cambridge Univ. Press: Cambridge,
UK) .
Marsh, T. R. & Steeghs, D. 2002, MNRAS, 331, L7
Motch, C. et al. 1996, A&A, 307, 459
Norton, A. J., Haswell, C. A. & Wynn, G. A. 2002, MNRAS, submitted, (astro-ph/0206013)
Ramsay, G., Cropper, M., Wu, K., Mason, K. O., & Hakala, P. 2000, MNRAS, 311, 75
Ramsay, G., et al. 2002, MNRAS in press, (astro-ph/0202281)
Ramsay, G. Hakala, P. & Cropper, M. 2002, MNRAS, 332, L7.
Ritter, H. & Kolb, U. 2003,, A&A, 404, 301.
Strohmayer, T. E., 2002, ApJ, 581, 577.
Warner, B. 1995, Cataclysmic Variable Stars, Cambridge Univ. Press, Cambridge UK.
Warner, B. 1986, MNRAS, 219, 347.
Wu, K., Cropper, M., Ramsay, G. & Sekiguchi, K. 2002, MNRAS, 331, 221
- 1 0 - +
Figure Captions
Fig. 1.- Chundru 1-d image of RX 51914.4+2456 from ACIS-S Continuous Clocking mode. The sharp peak contains photons from 51914. The inset panel shows an expanded view of the peak.
Fig. 2.- A lightcurve of a portion of the Chundru ACIS-S data from RX 51914.4+2456. The binsize is 16 s, and nine individuals pulses are shown.
Fig. 3.- Best constant frequency measurements for the combined ROSAT - ASCA data (dashed), and the entire ASCA - ROSAT - Chundru dataset (solid). Shown are the values of AZ; = maz(2~) - 2: as a function of frequency. In this representation the minima denote the best frequency values for each dataset. The inclusion of the Chandra data clearly favors an increase in the average frequency compared to just the ROSAT - ASCA data. The reference frequency, vo, is 1.7562475 x Hz.
Fig. 4.- Constraints on v and i/ from our phase timing analysis of the ROSAT, ASCA and Chundru data for RX 51914.4+2456. Shown are the 90 and 99% confidence regions for just the ROSAT, and ASCA data (dashed), and the combined dataset (ROSAT, ASCA and Chundru). The inclusion of the Chandru data definitively requires a positive i, = 5.86 f 0 . 9 x
Hz s-'.
Fig. 5.- Phase timing residuals plotted as a function of time using a constant frequency phase model (ie. li = 0 (top), and with the best fitting solution including a positive i/ = 5.9 x Hz s-l (bottom). In the top panel a parabolic shape with the parabola opening downward would be indicative of the need for a positive u. Such a trend can just about be discerned with the eye.
Fig. 6.- Same as Figure 5 except the time gaps have been removed so that the individual phase residuals can be more easily seen.
Fig. 7.- Flux variability of 51914 seen with Chandru at four different epochs. The time binsize was set equal to the 1.756 mHz frequency, so that each point represents the mean X-ray countrate per cycle. There is evidence for large, long term flux modulations as well as variations from cycle to cycle.
Fig. 8.- Low frequency power spectrum of our longest Chundru pointing. The power spectrum is normalized such that a pure Poisson noise process would have a mean of 2 and be distributed as x2 with two degrees of freedom. The three peaks that go off-scale are the fundamental, first and second harmonic of the 1.756 mHz modulation. Upper sidebands to the fundamental and first harmonic, and lower sidebands to the first and second harmonics
- a 1 1 -
can be seen. The horizontal dotted line indicates the power level with a single trial chance probability of M 2 x lo-’.

- 1 2 - '
2320 2330 2340 2350 2360
0 1000 2000 3000 4000 Linear Position (pixels)
Figure 1: Chundru 1-d image of RX J1914.4+2456 from ACIS-S Continuous Clocking mode. The sharp peak contains photons from J1914. The inset panel shows an expanded view of the peak.

-. 13 -
0.0 1000 2000
1, 3000 4000 5000
Time (s)
Figure 2: A lightcurve of a portion of the Chundru ACIS-S data from RX 51914.4+2456. The binsize is 16 s, and nine individuals pulses are shown.
- 1.4 - .
CY N N a
-1.0 -0.8 -0.6 -014 -0.2 0.0 0.2 v - vo (nHz)
Figure 3: Best constant frequency measurements for the combined ROSAT - ASCA data (dashed), and the entire ASCA - ROSAT - Chandra dataset (solid). Shown are the values of AZ; = m u z ( 2 ~ ) - 2; as a function of frequency. In this representation the minima denote the best frequency values for each dataset. The inclusion of the Chandru data clearly favors an increase in the average frequency compared to just the ROSAT - ASCA data. The reference frequency, vo, is 1.7562475 x Hz.
15 I L
4 - I I " C
d 51- ' t A d t
t
. . y - .
\
\ \ \ \ \ \
\ \ ,
\ \
\ \ \ \ \ \ \ \ \ \ .
\ ' ' \ 1 - 4 , , .
\ \ \ \
\
\ . . . . 0 t- ...................................................................................................... 4
t 4
-1.0 -0.8 -0.6 -0.4 -0.2 0.0 0.2 0.4 Frequency (v - vo nHz)
Figure 4: Constraints on v and i, from our phase timing analysis of the ROSAT, ASCA and Chandra data for RX J1914.4+2456. Shown are the 90 and 99% confidence regions for just the ROSAT, and ASCA data (dashed), and the combined dataset (ROSAT, ASCA and Chandra). The inclusion of the Chandra data definitively requires a positive i, = 5.87& 0.9 x
Hz s-l.
n VI a, 0 h 0
rn (d 3 d VI a, k
d
W
d
.A
0.05
-0.00 1 7
& VI a, -0.10 -0-051/ -0.15
0.15
2 0.10
2 0.05
- VI
0 h
d
a,
0 -0.00
t: I -0.05 (d
d -0.10 n
-0.15
i
1 _ - _ _ _ _ _ _ _ - _ _ _ _ _ -
0 2 4 6 8 l o Years from MJD = 49257.533373
Figure 5: Phase timing residuals plotted as a function of time using a constant frequency phase model (ie. i, E 0 (top), and with the best fitting solution including a positive i/ = 5.87 x lo-'' Hz s-l (bottom). In the top panel a parabolic shape with the parabola opening downward would be indicative of the need for a positive i,. Such a trend can just about be discerned with the eye.
-17-
n 0.15 VI Q)
‘I; 0.10 h 0
0.05 VI cd 3 -0.00 d
k -0.05
W
4
.A I/)
Q)
; -0.10 Az a -0.15
0.15
2 0.10
2 0.05
-0.00
I -0.05
n VI
0 h
d
Q)
.............______.... 2i cd cd -0.10 d
-0.15 -
t I 1 I I
0 20 40 60 80
- I
-
Phase Measurements
Figure 6: Same as Figure 5 except the time gaps have been removed so that the individual phase residuals can be more easily seen.

I ".7 I
0.5 I I
0.3
0.2
0.000 0.075
I I I I
I
I
0.9 1.0 1.1 1.2 279.50 279.57 279.65311.62 311.92 312.02 Time (days)
Figure 7: Flux variability of 51914 seen with Chundru at four different epochs. The time binsize was set equal to the 1.756 mHz frequency, so that each point represents the mean X-ray countrate per cycle. There is evidence for large, long term flux modulations as well as variations from cycle to cycle.

, -- 19 -
I40 1 1'7'1111171111
40 ._ _ _ _ . . _ _ . . _ _ _ _ _ . ___. 1 r d 20
0
... ..... ..................
0.000 0.001 0.002 0.003 0.004 0.005 0.006 .
Frequency (Hz)
Figure 8: Low frequency power spectrum of our longest Chundru pointing. The power spectrum is normalized such that a pure Poisson noise process would have a mean of 2 and be distributed as x2 with two degrees of freedom. The three peaks that go off-scale are the fundamental, first and second harmonic of the 1.756 mHz modulation. Upper sidebands to the fundamental and first harmonic, and lower sidebands to the first and second harmonics can be seen. The horizontal dotted line indicates the power level with a single trial chance probability of FZ 2 x lo-'.

- 2 0 - ’
Table I: Chundru Observations of RX 51914.4+2456
OBSID Instrument Start UTC Stop UTC Exposure (ks) 300095 ACIS-S (CC-mode) Feb 18, 2003:11:16:30 Feb 18, 2003:15:23:39 13.4 300095 ACIS-S (CC-mode) Feb 19, 2003:07:49:17 Feb 19, 2003:17:58:49 35.4 300096 ACIS-S (CC-mode) Nov 11, 2003:19:33:05 Nov 11, 2003:23:06:22 11.2 300111 ACIS-S (CC-mode) Dec 27, 2003:02:36:24 Dec 27, 2003:07:30:14 15.4