change-plane analysis for subgroup detection and sample
TRANSCRIPT

Change-Plane Analysis for Subgroup Detection andSample Size Calculation
Rui Song
Department of StatisticsNorth Carolina State University
September 14, 2017
Rui Song Change-Plane Analysis for Subgroup Detection 1 / 32

Overview
Precision Medicine:
A new medical paradigm for treatment that is tailored to an individual’sgenes, environment and lifestyle.
Due to patient’s heterogeneity, treatment effects may not be evenlydistributed in the target population. A treatment may be effective only fora specific subpopulation.
Subgroup Detection
Rui Song Change-Plane Analysis for Subgroup Detection 2 / 32

Example: ACTG175 Data
AIDS Clinical Trials Group Study 175 (ACTG175)
I HIV-infected patients with CD4 counts 200 ∼ 500/mm3
I Randomized to four treatment groups:I zidovudine alone (ZDV)I zidovudine plus didanosine (ZDV+ddI)I zidovudine plus zalcitabine (ZDV+zal)I didanosine alone (ddI)
I 12 baseline clinical covariates, such as age (years), weight (kg),Karnofsky score (scale of 0-100), CD4 count (cells/mm3) at baseline
I Primary endpoints of interest: (i) CD4 count at 20± 5 weekspost-baseline; (ii) the first time that a patient had a decline in theirCD4 cell count of at least 50%, or an event indicating progression toAIDS, or death.
Rui Song Change-Plane Analysis for Subgroup Detection 3 / 32
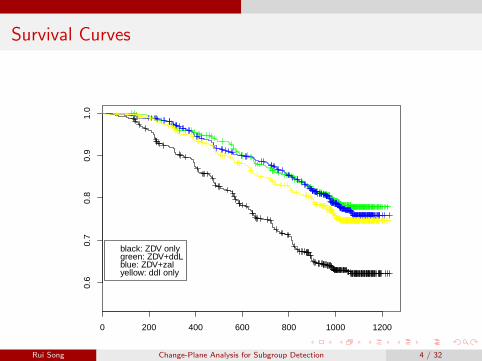
Survival Curves
0 200 400 600 800 1000 1200
0.6
0.7
0.8
0.9
1.0
black: ZDV onlygreen: ZDV+ddLblue: ZDV+zalyellow: ddI only
Rui Song Change-Plane Analysis for Subgroup Detection 4 / 32

Problems
I Does a subgroup with an enhanced treatment effect exist? (Test)
I How to identify the subgroup if it exists? (Identification)
I How to extend this methodology to censored data?
Rui Song Change-Plane Analysis for Subgroup Detection 5 / 32

Previous Works
Identification:
I Selection impact curve (Song and Pepe, 2004)
I “Virtual Twins” method (Foster et al., 2011)
I Parametric scoring systems (Cai et al., 2011; Zhao et al., 2013)
Test:
I Logistic-normal mixture model (Shen and He, 2015)
I LRT based on logistic-cox regression for survival data(Wu et al., 2016)
Rui Song Change-Plane Analysis for Subgroup Detection 6 / 32
Goal of the proposed method
I Improved flexibility with an unspecified baseline effect model.
I Doubly robust score-type test for detecting the subgroup and proposea sample size calculation.
I Using change plane analysis to define the subgroup of patients withan enhanced treatment effect.
Rui Song Change-Plane Analysis for Subgroup Detection 7 / 32

Model
Notations:
I Y : response
I A: treatment, 0 or 1
I X : (p + 1)-dimensional vector of covariates
I Z = (XT ,A,Y )T
We assume:
I Subgroup of interest can be identified by a change-plane θTX .
I Individuals within the subgroup have a constant treatment effect τ .
A semiparametric change-plane model:
Yi = µ(Xi ) + τAi1(θTXi ≥ 0) + εi .
I Subgroup of interest: {i : θTXi ≥ 0, i = 1, ..., n}.I ‖θ‖ = 1 without loss of generality,.
Rui Song Change-Plane Analysis for Subgroup Detection 8 / 32

Does a subgroup exist?
I Hypothesis testing on the existence of subgroup:
H0 : τ = 0 versus H1 : τ 6= 0.
I Non-regular test problem: θ is not identifiable under H0.
Rui Song Change-Plane Analysis for Subgroup Detection 9 / 32

Does a subgroup exist?
I Supremum of squared score test statistic:
T = supθ∈Θ
{∑n
i=1 ψ1(Zi ; θ)}2
nVS(θ).
I Θ = {θ ∈ Rp+1 : ‖θ‖ = 1}.
I If H0 is rejected: θ = arg supθ∈Θ{∑n
i=1 ψ1(Zi ;θ)}2
nVS (θ).
Rui Song Change-Plane Analysis for Subgroup Detection 10 / 32

Doubly-Robust Estimation for τ
When θ is known, an estimating equation for τ :
n∑i=1
ψ1(Zi , τ ;θ) =n∑
i=1
1(θTXi ≥ 0) [Ai − π(Xi ,γ)][Yi − h(Xi ,β)− τAi1
(θTXi ≥ 0
)]= 0.
I π(X , γ): propensity score model of treatment P(A = 1|X );
I h(X , β): baseline model for µ(X ).
I The proposed test is valid when the model for either the baselinemean or propensity score function is correctly specified.
Rui Song Change-Plane Analysis for Subgroup Detection 11 / 32

Limiting Distribution Under the Null
Under H0, the test statistic Td→ supθ∈Θ G 2(θ).
I {G (θ) : θ ∈ Θ} is a mean zero Gaussian process with the covariancefunction
Σ(θ1, θ2) = E{ψ1∗(Z ; θ1)ψ1∗(Z ; θ2)}/√
Eψ21∗(Z ; θ1)Eψ2
1∗(Z ; θ2).
Rui Song Change-Plane Analysis for Subgroup Detection 12 / 32

Limiting Distribution Under Local Alternatives
Under H1n : τ = n−1/2δ, the test statistic Td→ supθ∈Θ G 2
δ (θ).
I Gδ(θ) : θ ∈ Θ is a Gaussian process with the mean function
µ(θ) = δE[{1(θT0 X ≥ 0, θTX ≥ 0)π0(X ){1− π(X , γ0)}
}]/√Eψ2
1∗(Z ; θ)
and the covariance function Σ(θ1, θ2).
Rui Song Change-Plane Analysis for Subgroup Detection 13 / 32

Critical Value of the Proposed Test
Resampling method:
I It is infeasible to get the supremum of squared score test statisticsover a unit ball of p + 1-dimension.
I generate n i.i.d. random variables ξi ∼ N(0, 1), independent of data ZI calculate the perturbed test statistic
T ′ = supθ∈Θ
{∑n
i=1 ξi ψ1∗(Zi ; θ)}2
nVS(θ)
I use the empirical distribution based on {T ′(1), ...,T′(M)} to
approximate the distribution of T
Rui Song Change-Plane Analysis for Subgroup Detection 14 / 32

Simulations
Y = µ(X ) + τA1(θTX ≥ 0) + ε.
I X = (X1,X2)T , X1 ∼ Bernoulli(0.5), X2 ∼ Unif(−1, 1), and X1 ⊥ X2.I Baseline models µ(X ):
- B-Model I: µ(X ) = 1 + X1 + X2;- B-Model II: µ(X ) = 1 + 0.5X1 + X 2
2 ;- B-Model III: µ(X ) = 1 + sin(X1 + πX2).
I Propensity score models π(X ):
- P-Model I: π(X ) = 0.5;
- P-Model II: π(X ) =exp(0.5X1 + 0.5X2)
1 + exp(0.5X1 + 0.5X2).
Rui Song Change-Plane Analysis for Subgroup Detection 15 / 32

Type I Errors
Table: Type I errors of the proposed test based on resampling. (Correspondingstandard errors for type I errors with size 0.05 and 0.1 are 0.003 and 0.004.)
P- B-Model I B-Model II B-Model III
n Model size 0.05 size 0.1 size 0.05 size 0.1 size 0.05 size 0.1
100I 0.052 0.104 0.054 0.107 0.050 0.099II 0.050 0.105 0.052 0.110 0.051 0.106
500I 0.052 0.100 0.045 0.102 0.047 0.092II 0.055 0.105 0.051 0.106 0.054 0.101
1000I 0.050 0.101 0.049 0.100 0.053 0.108II 0.051 0.105 0.044 0.102 0.053 0.108
Rui Song Change-Plane Analysis for Subgroup Detection 16 / 32

Powers
Table: Power (%) of the proposed test at 0.05 and 0.1 levels.
P- B-Model I B-Model II B-Model III
n Model τ size 0.05 size 0.1 size 0.05 size 0.1 size 0.05 size 0.1
500 I 0.1 21.2 (1.3) 31.1 (1.5) 17.5 (1.2) 27.5 (1.4) 9.9 (0.9) 16.1 (1.2)0.25 90.3 (0.9) 95.1 (0.7) 81.3 (1.2) 88.4 (1.0) 45.9 (1.6) 57.7 (1.6)
0.5 100 (0) 100 (0) 100 (0) 100 (0) 97.5 (0.5) 99.1 (0.3)
II 0.1 18.8 (1.2) 29.5 (1.4) 21.4 (1.3) 30.8 (1.5) 11.1 (1.0) 18.6 (1.2)0.25 84.6 (1.1) 90.2 (0.9) 76.6 (1.3) 83.3 (1.2) 42.9 (1.6) 58.2 (1.6)
0.5 100 (0) 100 (0) 99.9 (0.1) 100 (0) 97.1 (0.5) 98.8 (0.3)
Rui Song Change-Plane Analysis for Subgroup Detection 17 / 32

Misclassification Rates of Estimated Subgroups
Table: Misclassification rate (%) of identified subgroup based on estimatedchange-plane parameter θ.
P-Model I P-Model II
n τ B-Model I B-Model II B-Model III B-Model I B-Model II B-Model III
500 0.1 26.3 (1.4) 28.3 (1.4) 33.3 (1.5) 26.2 (1.4) 30.6 (1.5) 33.1 (1.5)0.25 11.8 (1.0) 12.7 (1.1) 22.1 (1.3) 12.2 (1.0) 14.6 (1.1) 22.9 (1.3)0.5 4.8 (0.7) 4.7 (0.7) 12.4 (1.0) 4.8 (0.7) 5.2 (0.7) 12.3 (1.0)
1000 0.1 20.9 (1.3) 23.0 (1.3) 30.0 (1.5) 22.9 (1.3) 25.9 (1.4) 32.2 (1.5)0.25 7.6 (0.8) 8.5 (0.9) 17.4 (1.2) 8.1 (0.9) 9.4 (0.9) 18.0 (1.2)0.5 2.6 (0.5) 3.0 (0.2) 9.1 (0.9) 3.0 (0.5) 3.3 (0.5) 9.3 (0.9)
Rui Song Change-Plane Analysis for Subgroup Detection 18 / 32

Comparison with EM Test in Shen and He (2015)
Table: Type I error and power (%) of the EM test and proposed test for B-ModelI at 0.05 and 0.1 levels.
EM Test Proposed Test
n τ size 0.05 size 0.1 size 0.05 size 0.1
500 0 4.6 (0.7) 9.4 (0.9) 5.2 (0.3) 10.0 (0.4)0.1 6.9 (0.8) 12.6 (1.0) 21.2 (1.3) 31.1 (1.5)0.5 89.6 (0.9) 93.3 (0.8) 100 (0) 100 (0)
1000 0 5.4 (0.7) 10.4 (1.0) 5.0 (0.3) 10.1 (0.4)0.1 10.4 (1.0) 18.6 (1.2) 41.3 (1.6) 52.5 (1.6)0.5 99.8 (0.1) 100 (0) 100 (0) 100 (0)
Rui Song Change-Plane Analysis for Subgroup Detection 19 / 32

Comparison with Subgroup Estimation in Zhao et al.(2013)
Table: Misclassification rates (%) of the identified subgroups using Zhao et al.(2013)’s and our method.
Zhao et al. (2013) Proposed Method
n τ B-Model I B-Model II B-Model III B-Model I B-Model II B-Model III
500 0.1 36.3 (0.6) 39.4 (0.6) 42.6 (0.6) 26.3 (1.4) 28.3 (1.4) 33.3 (1.5)0.5 13.5 (0.3) 13.5 (0.3) 17.6 (0.4) 4.8 (0.7) 4.7 (0.7) 12.4 (1.0)
1000 0.1 32.2 (0.5) 34.8 (0.6) 37.0 (0.5) 20.9 (1.3) 23.0 (1.3) 30.0 (1.5)0.5 10.9 (0.2) 11.2 (0.2) 13.3 (0.3) 2.5 (0.5) 3.0 (0.2) 9.1 (0.9)
Rui Song Change-Plane Analysis for Subgroup Detection 20 / 32
Sample Size Calculation
I To achieve power 1− β at some clinically important effect τ0 for atest at level α, we need
PHa(T > qα) = 1− β.
I Solve the above equation based on asymptotic distributions of T :
1. compute the mean function µ(θ) and the covariance function Σ(θ1,θ2)of Gaussian process via numerical integration;
2. for any given δ(=√nτ), compute the probability
P(supθ∈Θ G 2δ (θ) > qα) via Monte Carlo simulations;
3. find δ0 satisfying P(supθ∈Θ G 2δ0
(θ) > qα) = 1− β via a grid search.
I Required sample size is n = (δ0/τ0)2.
Rui Song Change-Plane Analysis for Subgroup Detection 21 / 32

Numerical examples
α = 0.05, 1− β = 0.9, X ∼ Unif[−1, 1], subgroup of interest X ≥ θ0.
Table: Sample size calculation for model with one covariate only.
µ(X ) 1 + X 1 − X 2 1 + sin(πX )
τ θ0 n Power n Power n Power
0.10 2992 91.3 4054 90.0 5440 91.10.5 6034 91.8 8972 94.3 10924 90.6-0.5 2042 90.8 2726 90.2 3514 91.7
0.250 480 91.4 650 88.9 872 88.50.5 966 91.8 1436 94.2 1748 89.7-0.5 328 90.8 436 89.1 564 88.7
0.50 120 87.2 164 85.6 218 85.40.5 242 88.4 360 92.7 438 88.5-0.5 82 87.6 110 85.3 142 89.0
Rui Song Change-Plane Analysis for Subgroup Detection 22 / 32

For Censored Data
Data and Notation
I T , survival time of interest;
I C , censoring time;
I A ∈ A, treatment received by patient, where A is the set of availabletreatment methods. e.g., A = {0, 1};
I Z ∈ Z ⊂ Rp, p-vector baseline covariates;
I observed data {(Ui ,∆i ,Zi ,Ai ), i = 1, . . . ,N}, where Ui = min(Ti ,Ci )and ∆i = I (Ti ≤ Ci );
I assumption: Ti ⊥⊥ Ci |Ai ,Zi .
Rui Song Change-Plane Analysis for Subgroup Detection 23 / 32

Proportional hazards model
λ(t|Zi ,Ai ) = λ(t)eφ(Zi )+ηAi I (γ′Zi≥0)
I λ(t) : unspecified baseline hazard function.
I φ(Zi ) : unspecified baseline covariate effect.
I Ai I (γ′Zi ≥ 0) : subgroup with an enhanced treatment effect,
‖γ‖ = 1.I If I (γ
′Zi ≥ 0), enhanced treatment effect η.
⇒ Our interest is testing H0 : η = 0 vs Ha : η 6= 0.
Challenges: Under H0, γ are not identifiable, unspecified φ(·).
Solution: Derive a robust testing against misspecification of φ(·).
Rui Song Change-Plane Analysis for Subgroup Detection 24 / 32

Application to AIDS Data (I)
AIDS Clinical Trials Group protocol 175:
I Two treatments: ZDV+ddI (trt 1) and ZDV+zal (trt 0)
I Response: CD4 counts (cell/mm3) at 20 weeks after randomization
I Covariates: age (years) and homosexual activity (0=no, 1=yes)
Rui Song Change-Plane Analysis for Subgroup Detection 25 / 32

Application to AIDS Data (I)
Results of the proposed method:
I Subgroup detection test: p-value<0.001
I Estimated subgroup parameter θ = (−0.576, 0.037,−0.816)T
I Identified subgroup: age > 37.6 if homo = 1; age > 15.6 ifhomo = 0.
I Estimated subgroup treatment effect: τ = 41.6
Rui Song Change-Plane Analysis for Subgroup Detection 26 / 32

Application to AIDS Data (I)
Sample size calculation:
I size α = 0.05, power 1− β = 0.9
I standard deviation of ε: σ = 145.9
I change-plane parameter: θ0 = (−0.576, 0.037,−0.816)T
I age ∼ N(35.33, 8.75), homo ∼ Bernoulli(0.66)
Table: Required sample sizes for detecting a subgroup with an enhancedtreatment effect τ based on the AIDS study data.
treatment effect τ sample size n
40 239260 106480 598
100 384
Rui Song Change-Plane Analysis for Subgroup Detection 27 / 32

Application to AIDS Data (II)
I Consider two covariates: age and homosexual activity (0=no, 1=yes);
I ZDV alone (A = 0) and other therapies (A = 1), π(Zi ) = 0.75;
I Among n=2139, about 75% censoring;
I 1000 resamplings used to obtain the p-value.
Rui Song Change-Plane Analysis for Subgroup Detection 28 / 32

Application to AIDS Data (II)
I Validity for independent censoring
Est z p
age -0.007 -2.50 0.012homo -0.246 -4.62 0.001
Treatment -0.049 -0.81 0.419
I Test
Wn = 13.019 with p-value=0.019
I Subgroup Estimation
I (−0.142 + 0.047age − 0.989homo > 0), η = −0.61
I Estimated subgroup size : 2095 (1576 (A=1) and 519 (A=0))I homo=1, age>25; homo=0, age>4
Rui Song Change-Plane Analysis for Subgroup Detection 29 / 32

Survival Curves for the estimated subgroup
Rui Song Change-Plane Analysis for Subgroup Detection 30 / 32

Application to AIDS Data (II)
I Generate a data set with age and homo following a normal and abinomial distribution;
I a linear baseline effect model;
I censoring rate 75%;
I 1000 resamplings to obtain the critical values.
Table: Sample size for the treatment effect at α = 0.05, 1− β = 0.9
η n
-0.2 7225-0.4 2094-0.6 1003
Rui Song Change-Plane Analysis for Subgroup Detection 31 / 32

Acknowledgement
I Support: NSF-DMS 1555244; NIH NCI grant PO1CA142538;
I Collaborators: Ailin Fan, Suhyun Kang and Wenbin Lu.
I References:1. Ailin Fan, Rui Song and Wenbin Lu (2017) “Change-PlaneAnalysis for Subgroup Detection and Sample Size Calculation”,Journal of the American Statistical Association, 112(518), 769–778.
2. Suhyun Kang, Wenbin Lu and Rui Song (2017+) “SubgroupDetection and Sample Size Calculation with Proportional HazardsRegression for Survival Data”, Statistics in Medicine, To appear.
Thank you!
Rui Song Change-Plane Analysis for Subgroup Detection 32 / 32

References
References I
Cai, T., Tian, L., Wong, P. H., and Wei, L. (2011). Analysis of randomized comparativeclinical trial data for personalized treatment selections. Biostatistics, 12(2):270–282.
Foster, J. C., Taylor, J. M., and Ruberg, S. J. (2011). Subgroup identification fromrandomized clinical trial data. Statistics in medicine, 30(24):2867–2880.
Shen, J. and He, X. (2015). Inference for subgroup analysis with a structuredlogistic-normal mixture model. Journal of the American Statistical Association,110(509):303–312.
Song, X. and Pepe, M. S. (2004). Evaluating markers for selecting a patient’streatment. Biometrics, 60(4):874–883.
Zhao, L., Tian, L., Cai, T., Claggett, B., and Wei, L.-J. (2013). Effectively selecting atarget population for a future comparative study. Journal of the American StatisticalAssociation, 108(502):527–539.
Rui Song Change-Plane Analysis for Subgroup Detection 32 / 32