changes in energy use - homepage | ministry of business ... · pdf filepg 2 > changes in...
TRANSCRIPT

Pg 1 > Changes in Energy Use | New Zealand 1990–2011
Changes in Energy UseNew Zealand 1990–2011
Key Messages 1990–2011
> Energy intensities fell in most business sectors.
> Mining sector energy intensity increased 52% – more than any other sector.
> The non-metallic minerals sector reduced energy intensity by 40% – more than any other sector.
> Growth in economic activity put upward pressure on energy consumption while structural shifts towards less intensive sectors reduced some of this pressure.
> Energy intensities reduced with higher consumer awareness, electricity replacing other fuels and improved appliances.
> Overall energy consumption grew by 16% while population grew by 27%.
> Falling household occupancy levels and larger dwelling sizes have added to residential energy consumption.
> Rail is the least energy-intensive mode of freight transport.
> Energy intensities fell in both road and rail freight due to fuller loads and improved technologies. Sea freight intensity increased.
> Total freight transport fuel consumption increased with economic activity and a shift to road from shipping.
> Improvements in air transport load factors and other efficiencies resulted in a reduction in overall passenger transport energy intensity.
> Total passenger transport energy consumption increased with demand for transport, particularly road transport, which dominates the sector.
> Mode shifts had a minimal effect on passenger energy consumption.
Introduction
The efficient use of energy is one of the four priorities of the New Zealand Energy Strategy 2011–2021. Specific targets relating to economy-wide and business energy intensity and light vehicle energy efficiency are contained in the New Zealand Energy Efficiency and Conservation Strategy.
This report presents an analysis of energy efficiency trends in the residential, transport and business sectors between 1990 and 2011. A technique known as the Logarithmic Mean Divisia Index (LMDI) is used to isolate the effect of energy efficiency from the range of economic, demographic and technical drivers that affect overall energy consumption.
A common measure of activity between the components of each sector is required to carry out LMDI. Consequently, national energy consumption is separated into the business, residential and transport groups, as each has a different measure of activity.
LMDI allocates changes (∆) in energy consumption amongst four effects: ∆Energy = ∆Activity + ∆Structure + ∆Fuel Switching + ∆Efficiency
• Activity: the level of production or size of a sector will directly influence energy consumption. Gross Domestic Product (GDP) is used to measure activity in the primary industries, manufacturing and commercial sectors, population in the residential sector, and passengers and tonnes of freight moved in transport.
• Structure: shifts in relative levels of activity between industries or transport modes (mode switching) of different energy intensity will change overall energy consumption.
• Fuel Switching: some fuels can provide the same level of service more efficiently than others. Electricity is used as the benchmark for high energy quality because of its highly efficient utilisation in many applications.
• Efficiency: is calculated by factoring out the other effects. Improved efficiency indicates reduced energy intensity for that sector. Energy intensity is calculated as energy used per unit of activity.
Residential TransportBusiness1
Want a closer look?For detailed data, visit www.med.govt.nz
1 Defined as primary industries, manufacturing, commercial and public services but not including chemical manufacturing.
ISSN 2253-5489 (Print) ISSN 2253-5497 (Online)

Pg 2 > Changes in Energy Use | New Zealand 1990–2011
This section analyses changes in stationary energy use by business and public services from 1990 to 2011. Together, this grouping contributed around 90% of New Zealand’s GDP in 2011. This grouping can be broken down into three broad sectors: primary industries, manufacturing and construction, and commercial.
In the following discussion, primary industries include agriculture, forestry and fishing. The manufacturing and construction sector includes food processing, wood product manufacturing, basic metals, construction, mining, non-metallic minerals, textiles and machinery, but excludes chemical manufacturing.2 The commercial sector covers trade, hospitality, communication services, financial services and public services.
2 The chemical manufacturing sector is excluded because its energy consumption is highly correlated to production within the sector, and its energy-intensive nature overshadows the trends in the other parts of the business sector.
The energy consumption drivers considered in this analysis include: activity, structure, fuel switching and efficiency.
The commercial sector dominates New Zealand’s economy, contributing 62% to the national GDP in 2011. However, the commercial sector only requires 9% of total energy consumption. Commercial sector GDP has also grown the fastest out of the sectors considered, at an average rate of 3% per annum since 1990. More recently, commercial sector GDP growth has been flat as a result of the global financial crisis. Growth in agricultural GDP since 1990 was 2% per annum and growth in industry was 1% per annum. Most sectors fell into negative growth from 2008, with the exception of food processing. Energy consumption has followed similar patterns but at lower rates of growth than GDP, indicating a general improvement in energy intensity over the combined sectors.
Table 1: Energy Intensity (PJ per Billion $)
Business
Agriculture, Forestry and
Fishing
Food Processing
Wood, Pulp, Paper and
Printing
Basic Metals
Building and Construction
MiningNon-metallic
MineralsTextiles Machinery Unallocated Commercial
Business Weighted Average
1990 3.8 5.9 14.3 17.7 1.1 2.3 12.5 2.5 0.9 9.1 0.9 2.9
2000 3.8 4.9 18.3 13.6 0.9 3.2 10.6 2.3 0.8 9.0 0.8 2.7
2011 3.4 6.1 19.0 16.3 0.9 3.5 7.5 2.7 0.9 7.5 0.6 2.3
∆1990/2000 1% -17% 28% -23% -15% 39% -15% -8% -16% -1% -12% -6%
∆2000/2011 -10% 24% 4% 20% 4% 9% -30% 15% 14% -17% -15% -15%
∆1990/2011 -9% 3% 33% -8% -12% 52% -40% 6% -4% -18% -25% -21%
Figure 1: Business Energy Consumption by Industry
Agriculture, Forestry and Fishing
Wood, Paper and Printing
Ener
gy C
onsu
mpt
ion
(Gro
ss P
J)
0
1990
1992
1994
1996
1998
2000
2002
2004
2006
2008
2010
1991
1993
1995
1997
1999
2001
2003
2005
2007
2009
2011
100
50
150
200
250
300
Non-Metallic Mineral Product Manufacturing
Commercial
Basic Metals
Food Processing
Building and Construction
Other Industry
Mining
Pg 3 > Changes in Energy Use | New Zealand 1990–2011
For detailed data, visit: www.med.govt.nz
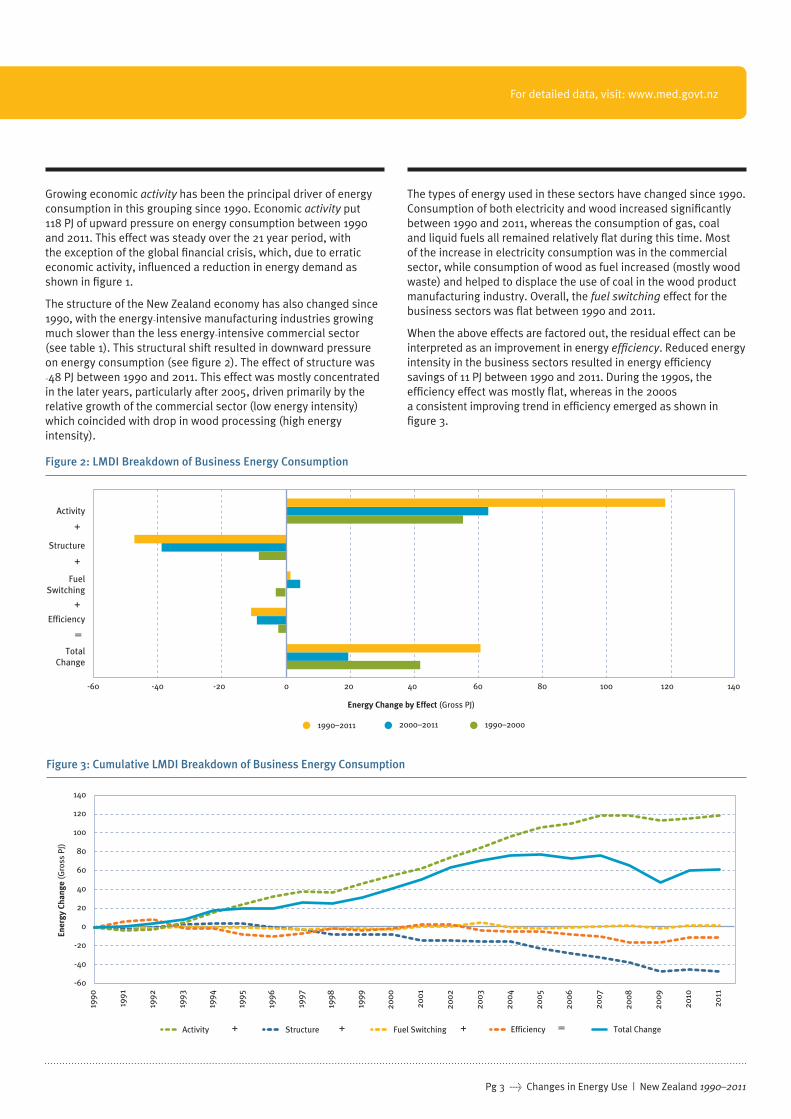
Figure 3: Cumulative LMDI Breakdown of Business Energy Consumption
Energy Change by Effect (Gross PJ)
1990–2011 2000–2011 1990–2000
-60 -40 -20 20 40 60 80 100 120 1400
Activity
Structure
Efficiency
FuelSwitching
TotalChange
Structure Fuel SwitchingActivity
Ener
gy C
hang
e (G
ross
PJ)
-60
1990
1992
1994
1996
1998
2000
2002
2004
2006
2008
2011
2010
1991
1993
1995
1997
1999
2001
2003
2005
2007
2009
-40
-20
20
40
60
80
100
120
140
0
Total ChangeEfficiency
Figure 2: LMDI Breakdown of Business Energy Consumption
Growing economic activity has been the principal driver of energy consumption in this grouping since 1990. Economic activity put 118 PJ of upward pressure on energy consumption between 1990 and 2011. This effect was steady over the 21 year period, with the exception of the global financial crisis, which, due to erratic economic activity, influenced a reduction in energy demand as shown in figure 1.
The structure of the New Zealand economy has also changed since 1990, with the energy-intensive manufacturing industries growing much slower than the less energy-intensive commercial sector (see table 1). This structural shift resulted in downward pressure on energy consumption (see figure 2). The effect of structure was -48 PJ between 1990 and 2011. This effect was mostly concentrated in the later years, particularly after 2005, driven primarily by the relative growth of the commercial sector (low energy intensity) which coincided with drop in wood processing (high energy intensity).
The types of energy used in these sectors have changed since 1990. Consumption of both electricity and wood increased significantly between 1990 and 2011, whereas the consumption of gas, coal and liquid fuels all remained relatively flat during this time. Most of the increase in electricity consumption was in the commercial sector, while consumption of wood as fuel increased (mostly wood waste) and helped to displace the use of coal in the wood product manufacturing industry. Overall, the fuel switching effect for the business sectors was flat between 1990 and 2011.
When the above effects are factored out, the residual effect can be interpreted as an improvement in energy efficiency. Reduced energy intensity in the business sectors resulted in energy efficiency savings of 11 PJ between 1990 and 2011. During the 1990s, the efficiency effect was mostly flat, whereas in the 2000s a consistent improving trend in efficiency emerged as shown in figure 3.
+
+
+
=
+ =+ +

Pg 4 > Changes in Energy Use | New Zealand 1990–2011
Residential
Stationary energy use by the residential sector was 64 PJ in 2011 or 12% of national energy use. Since 1990, residential energy demand has grown by 9 PJ at about 1% per annum, but this has slowed slightly over the last decade as shown in figure 4. Electricity is the dominant fuel for households, with wood, and natural gas being the other main contributors.
Activity in the residential sector is measured in terms of population growth. Figures 6 and 7 show that population growth is the primary driver of energy demand growth in the residential sector. Other factors contributing to growth in residential energy demand over the past two decades include decreasing dwelling density (people per house) and increasing dwelling size (avearge floor area). Countering this upward pressure is downward pressure on energy demand through fuel switching and household energy efficiency improvements. The effect of population growth on the energy consumption of households is estimated to be nearly 15 PJ from 1990 to 2011. New Zealand’s population has been growing at 1.2%
Figure 5: Changes in Dwelling Habits
Figure 4: Change in Population and Residential Consumer Energy Demand
per annum since 1990.
The number and size of dwellings also has a measurable effect on residential energy consumption. The number of dwellings in New Zealand has grown by 1.7% per annum since 1990 and the combined floor area of dwellings has grown by 2.4% per annum over the same period. The estimated effects of growth in dwelling density and growth in dwelling size on residential energy consumption between 1990 and 2011 are 6.0 PJ and 8.8 PJ respectively. The effect of dwelling density was concentrated between 1990 and 2000, with the size of this effect being more than double that of the period 2000–2011. This is a result of the housing boom that occurred during the mid-to-late 1990s. In contrast, the effect of dwelling size was concentrated more in the second period than in the period 1990–2000, indicating more energy is used due to people living in more spacious homes. Changes in dwelling habits are summarised in figure 5.
Percentage Change in Reseidential Consumer Energy DemandPercentage Change in Population
Chan
ge (%
)
-5
1990
1992
1994
1996
1998
2000
2002
2004
2006
2008
2010
1991
1993
1995
1997
1999
2001
2003
2005
2007
2009
2011
5
0
10
20
25
30
15
Percentage Change
1990–1991 2000–2001
Change inDwelling
Density
Change inDwelling
Size
-10% -5% 0% 5% 10% 15% 20%
1990–20001990–2011 2000–2011 1990–2000
Residential

Pg 5 > Changes in Energy Use | New Zealand 1990–2011
Figure 6: LMDI Breakdown of Residential Energy Consumption
Figure 7: Cumulative LMDI Breakdown of Residential Energy Consumption
-20 -15 -10 5 10 2015-5 0
Energy Change by Effect (Gross PJ)
1990–2011 2000–2011 1990–2000
FuelSwitching
TotalChange
Efficiency
DwellingDensity
DwellingSize
Population
Dwelling Density Dwelling SizePopulation EfficiencyFuel Switching
Ener
gy C
hang
e (G
ross
PJ)
-20
1990
1992
1994
1996
1998
2000
2002
2004
2006
2008
1991
1993
1995
1997
1999
2001
2003
2005
2007
2009
2011
2010
-10
-15
-5
5
10
15
20
0
Total Change
The share of residential energy demand satisfied by electricity has grown since 1990 as a result of growth in the number and variety of electric appliances over this time (e.g. heat pumps replacing coal or wood fires for space heating). In contrast, the share of residential energy consumption satisfied by coal, natural gas and renewables (i.e. wood) has declined over this time. The use of coal and wood for space heating has declined steadily since 1990 because many local government bodies in New Zealand passed regulations restricting the use of appliances using these fuels. The New Zealand Government (through EECA) subsidises the installation of low (particulate) emission heating appliances such as heat pumps and pellet burners to replace coal and wood fires. The share of natural gas in residential energy consumption rose between 1990 and 2000, but fell again between 2000 and 2011. Wholesale gas prices and distribution fee increases pushed up residential gas prices after 2000. The price increases account for
the drop in natural gas’s share of residential energy consumption during the period 2000–2011. Since 1990, fuel switching reduced energy consumption by an estimated 3.2 PJ.
When the above effects are factored out, the residual effect can be interpreted as energy efficiency improvements. The size of this effect on residential energy consumption was a reduction of 17 PJ between 1990 and 2011. This improved energy efficiency can be attributed to a combination of factors including changing household behaviours, the improved quality of new building stock and insulation retrofits, the higher energy efficiency of appliances and heaters, and conservation due to increasing energy prices. The rate of efficiency improvements were fairly evenly split between the first and second decades of this period. These effects are summarised in figures 6 and 7.
For detailed data, visit: www.med.govt.nz
+
+
+
=
+
+ + =+ +

Pg 6 > Changes in Energy Use | New Zealand 1990–2011
Transport3 accounted for 32% of New Zealand’s total energy consumption in 2011 and has grown at about twice the rate of total energy consumption. Virtually all transport is fuelled by oil products, making demand for transport sensitive to oil prices in addition to other drivers such as economic activity and household incomes. Transport is assessed in two parts (freight and passenger) because each has a different measure of activity.
Freight TransportFreight includes road, rail and coastal shipping (sea freight). Freight energy consumption has increased by 14 PJ since 1990. Increased freight activity alone would have increased fuel consumption by 18.4 PJ, primarily through growth in road transport. Freight activity is measured in freight tonne-kilometres.4 In addition, mode switching to road added a further 3.4 PJ of upward pressure on energy consumption (see figure 9) because of its high energy intensity compared to that of sea and rail (see figure 8). Counteracting these increases was a 7.3 PJ energy saving due to an overall improvement in energy efficiency in the sector. This improvement has been made in rail and road transport through a mix of factors which include changes in load factors, fuel efficiency5 and maintenance. Rail freight became 43% less energy-intensive per tonne-km travelled. The improvement in rail freight energy efficiency has been more pronounced due to improved operational efficiencies, but its contribution to overall improved energy efficiency has been smaller than that of road transport because of rail’s energy mode share.
Between 1990 and 2011, road freight increased its mode share from 54% to 67% while coastal shipping decreased from 27% to 16%. Rail has retained a relatively flat share over the period, decreasing from 18% to 16%.
Between 1990 and 2008 road freight energy efficiency improved by 1% per annum and rail by 3% per annum, whereas sea freight energy efficiency decreased by 1% per annum, reflecting its loss of total mode share. A sharp decrease in energy efficiency in 2009, due to a temporary over-capacity in the sector after the fall in economic activity that year, saw these efficiencies fluctuate but then recover in 2010 and 2011. Volatile transport demand has amplified fluctuations in freight transport energy efficiency over the last three years due to the impact of the global financial crisis as shown in figure 10.
3 Excluding light commercial vehicles.
4 1 tonne-kilometre is the activity of 1 tonne travelling 1 kilometre.
5 Ministry of Transport data indicates that the average fuel consumption of larger (›1600cc) new diesel vehicles is trending downward.
Figure 8: Energy Intensity of Freight Modes
Figure 10: Cumulative LMDI Breakdown of Freight Transport Energy Consumption
0 0.5 2.52.01.0 1.5
PJ per Billion Tonne-km
1990 2000 2011
Road Freight
CoastalShipping
Rail Freight
Activity Mode SwitchingEfficiency
Ener
gy C
hang
e (G
ross
PJ)
-10
1990
1992
1994
1996
1998
2000
2002
2004
2006
2008
2011
2010
-5
5
10
15
20
0
Total Freight
-10 -5 1510 200 5
Energy Change by Effect (Gross PJ)
Activity
ModeSwitching
Efficiency
TotalChange
1990–2011 2000–2011 1990–2000
For detailed data, visit: www.med.govt.nzTransport
Figure 9: LMDI Breakdown of Freight Transport Energy Consumption
+
+
=

Pg 7 > Changes in Energy Use | New Zealand 1990–2011
Figure 12: LMDI Breakdown of Passenger Transport Energy Consumption
Figure 13: Cumulative LMDI Breakdown of Passenger Transport Energy Consumption
-10 0 4030 5010 20
Energy Change by Effect (Gross PJ)
1990–2011 2000–2011 1990–2000
Activity
ModeSwitching
Efficiency
TotalChange
Ener
gy C
hang
e (G
ross
PJ)
-10
1990
1992
1994
1996
1998
2000
2002
2004
2006
2008
2011
2010
0
20
30
45
50
10
Activity Mode SwitchingEfficiency Total Passenger
Passenger TransportThe passenger sub-sector is comprised of cars (light passenger vehicles), buses, passenger rail and domestic air. Energy consumption in passenger transport has increased by 39 PJ since 1990. This is primarily driven by levels of activity (see figure 12), especially cars, which are less energy-efficient than other modes. Passenger activity is measured in terms of passenger-kilometres.6 Based on activity levels alone, this increase would have been 45 PJ; however, energy efficiency improvements offset this by 7 PJ. Mode switching has made little difference to energy consumption. The primary mode switch was from cars to domestic air, which resulted in insignificant changes in total energy consumption, as the energy intensity of domestic air was improving at a rate that almost equalled that of cars (see figure 11).
Passenger transport activity grew at 2.9% per annum between 1990 and 2004. This declined subsequently to a growth rate below 1% per annum due to increased oil prices and the slowing of national economic activity as shown in figure 13. The fall in transport activity in 2009 was not as pronounced as it was in the freight sub-sector, falling by less than 0.5%.
Car activity fell from a growth rate of 1.7% per annum between 1990 and 2004 to less than 0.1% per annum from 2004. These vehicles are mostly privately owned cars and the activity trend parallels the recent stagnation of light fleet travel and decline in vehicle ownership per head reported by the Ministry of Transport7. Car mode share has declined from 89% in 1990 to 83% in 2011. The principal beneficiary of this decline has been air, which doubled its mode share to over 9% during the same period.
Domestic air and passenger rail have recorded significant improvements in energy efficiency, having fallen in 2011 to about half the maximum actual intensity (PJ/passenger-km) recorded since 1990. Most of these improvements have occurred since 2000 and can be attributed to improved passenger load factors, aircraft and rolling stock efficiency, and operational improvements. Bus energy intensity increased 17% between 2000 and 2011 which contributed to a reduction in energy efficiency. This may be due to a combination of factors including lower load factors and operational issues such as increased traffic congestion. These energy intensities are summarised in figure 11. The potential exists to significantly decrease energy consumption by shifting mode share from cars to buses and rail due to their relatively low energy intensities.
6 1 passenger-kilometre is the activity of 1 passenger travelling 1 kilometre.
7 The New Zealand Vehicle Fleet, March 2012, Ministry of Transport.
Figure 11: Energy Intensity of Passenger Modes
0.0 1.0 5.04.02.0 3.0
PJ per Billion Tonne-km
Cars
DomesticAir
Buses
PassengerRail
1990 2000 2011
For detailed data, visit: www.med.govt.nzTransport
Passenger-km
+
+
=

Pg 8 > Changes in Energy Use | New Zealand 1990–2011
General• This analysis is done on consumer energy.
• All years are reported as December year end. Where December year data were not available, March or June year data were used to estimate December years, assuming that all quarters are equal.
• The thermodynamic quality of fuels is based on research by Dr Jonathan Lermit.
• Energy data are standardised in petajoules (PJ) using gross calorific values.
• Blended biofuels are counted as liquid fuels rather than renewables.
Business• Current price GDP is used as a proxy for activity data in the
business model. This is to enable comparison between the production of different sectors. We assume no price effect. GDP is mapped to the sectors as defined in the New Zealand Energy Data File.
• The chemical manufacturing sector is excluded from the business model because it is not considered to be compatible with the economic activity data. It would be more appropriate to explain energy changes in this sector using actual tonnes of production at the company level. However, this information is commercially sensitive.
Transport• Light commercial vehicles, air freight and passenger ferries
were excluded from the model due to insufficient data. There is no fuel switching effect in the transport model due to this lack of data.
For detailed data, visit: www.med.govt.nzAssumptions
For detailed data, visit: www.med.govt.nzAcknowledgements
• Modes within the transport model are treated as sectors. Therefore, the structural effect is referred to as the mode effect.
• Passenger and freight transport are treated separately because they require different activity measures.
• Cars are light passenger vehicles less than 3.5 tonnes tare. Trucks are heavy commercial vehicles over 3.5 tonnes tare used for freight purposes.
• The Ministry of Transport’s Household Travel Survey has been used to support the data.
Residential• Floor area data are calculated from Statistics New Zealand
data. The floor area of all dwellings in year T is the sum of the floor area of all dwellings in year T-1 and the floor area of new dwellings in year T. The first iteration uses 1974 data and we assume all dwellings pre-1974 have a floor area equal to the average new dwelling in 1974. Any difference in dwelling area pre-1974 is considered to be negligible. Demolitions of and renovations to existing dwellings are excluded due to lack of data.
• Number of occupied dwellings is taken from Statistics New Zealand. Some data are estimated.
• Population data are taken from Statistics New Zealand. The population in 1990 is estimated.
• There is no structural effect in the residential model.
• Weather and temperature patterns are excluded on the basis that there is no apparent long-term relationship with residential energy use.
COPYRIGHT | The Ministry of Business, Innovation and Employment gives no warranty on accuracy, completeness or usefulness of any information in this publication. The Ministry shall not be held liable for any claims whatsoever arising from the use of this paper. The Ministry must be acknowledged when any information from this publication is used, reproduced or quoted.
AUTHORSHIP | This publication was jointly prepared by the Energy Information and Modelling Group of the Ministry of Business, Innovation and Employment and the Energy Efficiency and Conservation Authority. The principal author was Thomas Elliot with contribution from John Duncan and Bryan Field.
The LMDI technique was applied to New Zealand’s energy consumption by Dr Jonathan Lermit. A detailed methodology is available online at: www.med.govt.nz/sectors-industries/energy/energy-modelling/publications/changes-in-energy-use.
The authors are grateful to the individuals, companies and organisations who provided information and assisted with the work reported here.