changes in h-reflex recruitment after trans-spinal direct
TRANSCRIPT
Delft University of Technology
Changes in H-reflex recruitment after trans-spinal direct current stimulation with multipleelectrode configurations
Kuck, Alexander; Stegeman, Dick F.; van der Kooij, Herman; Van Asseldonk, Edwin H.F.
DOI10.3389/fnins.2018.00151Publication date2018Document VersionFinal published versionPublished inFrontiers in Neuroscience
Citation (APA)Kuck, A., Stegeman, D. F., van der Kooij, H., & Van Asseldonk, E. H. F. (2018). Changes in H-reflexrecruitment after trans-spinal direct current stimulation with multiple electrode configurations. Frontiers inNeuroscience, 12, [151]. https://doi.org/10.3389/fnins.2018.00151
Important noteTo cite this publication, please use the final published version (if applicable).Please check the document version above.
CopyrightOther than for strictly personal use, it is not permitted to download, forward or distribute the text or part of it, without the consentof the author(s) and/or copyright holder(s), unless the work is under an open content license such as Creative Commons.
Takedown policyPlease contact us and provide details if you believe this document breaches copyrights.We will remove access to the work immediately and investigate your claim.
This work is downloaded from Delft University of Technology.For technical reasons the number of authors shown on this cover page is limited to a maximum of 10.
ORIGINAL RESEARCHpublished: 28 March 2018
doi: 10.3389/fnins.2018.00151
Frontiers in Neuroscience | www.frontiersin.org 1 March 2018 | Volume 12 | Article 151
Edited by:
Alberto Priori,
Università degli Studi di Milano, Italy
Reviewed by:
Simon Giszter,
Drexel University, United States
Xiaoli Li,
Beijing Normal University, China
*Correspondence:
Edwin H. F. van Asseldonk
Specialty section:
This article was submitted to
Neural Technology,
a section of the journal
Frontiers in Neuroscience
Received: 15 July 2017
Accepted: 26 February 2018
Published: 28 March 2018
Citation:
Kuck A, Stegeman DF, van der Kooij H
and van Asseldonk EHF (2018)
Changes in H-Reflex Recruitment
After Trans-Spinal Direct Current
Stimulation With Multiple Electrode
Configurations.
Front. Neurosci. 12:151.
doi: 10.3389/fnins.2018.00151
Changes in H-Reflex RecruitmentAfter Trans-Spinal Direct CurrentStimulation With Multiple ElectrodeConfigurations
Alexander Kuck 1,2, Dick F. Stegeman 3, Herman van der Kooij 1,4 and
Edwin H. F. van Asseldonk 1*
1 Laboratory of Biomechanical Engineering, Department of Engineering Technology, University of Twente, Enschede,
Netherlands, 2Neuronal Rhythms in Movement Unit, Okinawa Institute of Science and Technology Graduate University,
Onna-son, Japan, 3Department of Neurology/Clinical Neurophysiology, Radboud University Medical Center, Donders
Institute for Brain, Cognition and Behavior, Nijmegen, Netherlands, 4Department of Biomechanical Engineering, Faculty of
Mechanical, Maritime and Materials Engineering, Delft University of Technology, Delft, Netherlands
Trans-spinal direct current stimulation (tsDCS) is an electro-modulatory tool with
possible application in the rehabilitation of spinal cord injury. TsDCS generates a small
electric field, aiming to induce lasting, functional neuromodulation in the targeted
neuronal networks. Earlier studies have shown significant modulatory effects after
application of lumbar tsDCS. However, for clinical application, a better understanding
of application specific factors is required. Our goal was to investigate the effect of
different electrode configurations using lumbar spinal tsDCS on spinal excitability. We
applied tsDCS (2.5mA, 15min) in 10 healthy subjects with three different electrode
configurations: (1) Anode and cathode placed over vertebra T11, and the posterior left
shoulder respectively (LSC-S) (one polarity), and (2) Both electrodes placed in equal
distance (ED) (7 cm) above and below vertebra T11, investigated for two polarities
(ED-Anodal/Cathodal). The soleus H-Reflex is measured before, during and after
tsDCS in either electrode configuration or a sham condition. To account for genetic
predispositions in response to direct current stimulation, subject BDNF genotype was
assessed. Stimulation in configuration ED-Cathodal induced an amplitude reduction
of the H-reflex, 30min after tsDCS with respect to baseline, whereas none of the
other configurations led to significant post intervention effects. BDNF genotype did
not correlate with post intervention effects. Furthermore, we failed to replicate effects
shown by a previous study, which highlights the need for a better understanding
of methodological and subject specific influences on tsDCS outcome. The H-reflex
depression after tsDCS (Config. ED-Cathodal) provides new insights and may foster our
understanding of the working mechanism of tsDCS.
Keywords: tsDCS, H-reflex, neuromodulation, spinal cord, neurorehabilitation
INTRODUCTION
The targeted application of electrotherapy to the rehabilitation of nervous system disordershas been a lasting vision in rehabilitation research. In recent years, trans-spinal direct currentstimulation (tsDCS), a variant of transcranial Direct Current Stimulation (tDCS), has received anincreasing scientific interest as a proposed novel electrotherapeutic protocol. Aiming to modulate
Kuck et al. tsDCS - Configuration Specific Changes in H-Reflex
pathways in the Spinal Cord, tsDCS imposes a small electricfield (EF) to the spinal neural circuitry. The ultimate goal is theability to facilitate spinal plasticity and promote rehabilitationafter neural injury of the spinal cord, via a meaningful andtargeted application of tsDCS, in combination with establishedrehabilitation techniques.
Earlier research on the neural effects of DC stimulation, whichoriginates mainly from studies on direct current stimulationof the cortex, has revealed a collection of multiple neuralworking mechanisms (Bikson et al., 2013; Miranda, 2013; Ruffiniet al., 2013) depending on electric field magnitude and direction(Salvador et al., 2010; Dmochowski et al., 2011; Rampersadet al., 2014), the underlying neuroanatomy and its alignmentwith the imposed EF (Tranchina and Nicholson, 1986; Radmanet al., 2009; Arlotti et al., 2012; Kabakov et al., 2012) as wellas the ongoing neural activity (Reato et al., 2010; Ranieri et al.,2012; Bikson et al., 2013; Lapenta et al., 2013) and geneticpredispositions (Bikson et al., 2013; Lamy and Boakye, 2013;Chhabra et al., 2015).
Consequently, previous studies which have applied tsDC-stimulation on the lumbar spinal cord, also revealed a complexpicture of its effects on the spinal motor circuitry (for athorough overview, see: Cogiamanian et al., 2012). It hasbeen shown, that anodal tsDCS can lead to a significantincrease (Hubli et al., 2013), or more specifically, a left shiftof the H-reflex recruitment curve (Lamy et al., 2012), whereascathodal stimulation had no significant effect. Also, cathodaland anodal tsDCS, were able to up- and downregulate corticallyevoked motor evoked potentials (MEPs) at lumbar spinal levelrespectively (Bocci et al., 2015). Furthermore, it was shownthat lumbar tsDCS has a significant modulatory effect on spinalreflex presynaptic inhibition (Yamaguchi et al., 2013) and post-activation depression (Winkler et al., 2010). As for tDCS, alsoin tsDCS genetic factors have been implicated to have an effecton the outcome of DC stimulation protocols (Chhabra et al.,2015). In particular, a polymorphism (Val66Met) of Brain-derived Neurotropic Factor (BDNF), has been of particularinterest. Thereby, Lamy and Boakye showed that the H-reflexrecruitment curve modulation after tsDCS significantly differsin carriers and non-carriers of the BDNF Met allele (Lamy andBoakye, 2013).
For a successful application of tsDCS in a clinical setting,a better understanding of its application specific effects isneeded. This includes knowledge about proper electrodeplacement, the resulting electric field at the target region andits effects on the targeted neural circuitry. Based on studiessimulating the electric field generated by transcutaneous DCstimulation, the EF-vector for a pair of surface electrodesis expected to be largest and tangential to the skin—surfaceabout half-way between electrodes. Below the electrodes theEF vector will be comparably lower and perpendicular tothe skin-surface (Kuck et al., 2017). Given that the neuraleffect of DC stimulation is dependent on EF strength anddirection, the modulatory outcomes are expected to vary acrosstsDCS protocols employing different electrode configurations.However, since all previous studies utilized a similar electrodeconfiguration (passive electrode on the shoulder, active electrode
above the lumbar spinal cord), current knowledge does notallow conclusions about electrode placement specific effects oftsDCS.
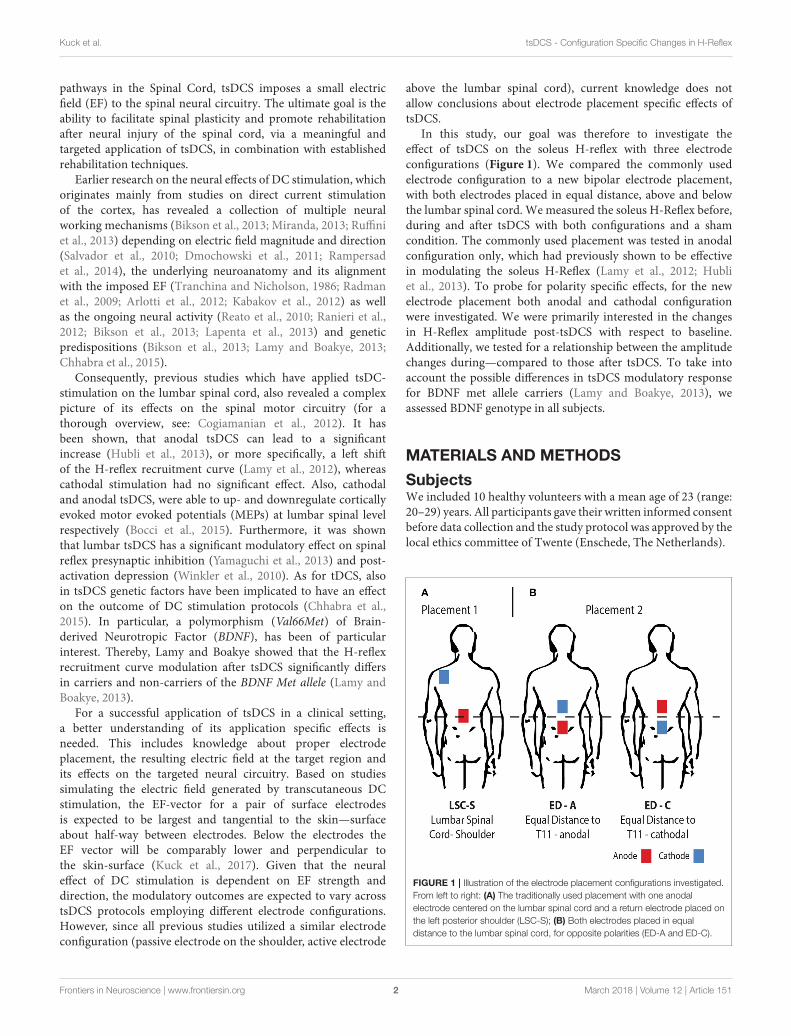
In this study, our goal was therefore to investigate theeffect of tsDCS on the soleus H-reflex with three electrodeconfigurations (Figure 1). We compared the commonly usedelectrode configuration to a new bipolar electrode placement,with both electrodes placed in equal distance, above and belowthe lumbar spinal cord. We measured the soleus H-Reflex before,during and after tsDCS with both configurations and a shamcondition. The commonly used placement was tested in anodalconfiguration only, which had previously shown to be effectivein modulating the soleus H-Reflex (Lamy et al., 2012; Hubliet al., 2013). To probe for polarity specific effects, for the newelectrode placement both anodal and cathodal configurationwere investigated. We were primarily interested in the changesin H-Reflex amplitude post-tsDCS with respect to baseline.Additionally, we tested for a relationship between the amplitudechanges during—compared to those after tsDCS. To take intoaccount the possible differences in tsDCS modulatory responsefor BDNF met allele carriers (Lamy and Boakye, 2013), weassessed BDNF genotype in all subjects.
MATERIALS AND METHODS
SubjectsWe included 10 healthy volunteers with a mean age of 23 (range:20–29) years. All participants gave their written informed consentbefore data collection and the study protocol was approved by thelocal ethics committee of Twente (Enschede, The Netherlands).
FIGURE 1 | Illustration of the electrode placement configurations investigated.
From left to right: (A) The traditionally used placement with one anodal
electrode centered on the lumbar spinal cord and a return electrode placed on
the left posterior shoulder (LSC-S); (B) Both electrodes placed in equal
distance to the lumbar spinal cord, for opposite polarities (ED-A and ED-C).
Frontiers in Neuroscience | www.frontiersin.org 2 March 2018 | Volume 12 | Article 151

Kuck et al. tsDCS - Configuration Specific Changes in H-Reflex
tsDCSAs announced, tsDCS was applied in two different electrodeplacement configurations (Figure 1). The amplitude was 2.5mAand the duration 15min using a NeuroConn DC-StimulatorPLUS (neuroCare Group GmbH, Munich, Germany). Theelectrode configurations chosen were: LSC-S: Lumbar SpinalCord (T11)-left posterior Shoulder (Figure 1A) and ED: EqualDistance 7 cm above and below T11 (Lumbar Spinal Cord)(Figure 1B). LSC-S was applied in anodal configuration only,whereas for configuration ED the effect of both polarities wasinvestigated. We refer to the polarity of the lower electrodefor configuration naming for all configurations (e.g., ED-A andED-C). Vertebra T11 was determined via manual palpation ofthe spinal processes, staring at vertebra C7 and counting untilvertebra T11 was reached. This process was repeated three times,with the final position estimate determined by taking the meanof the three initial estimates. Sham stimulation, included in theutilized stimulation device, was achieved by applying a 110 µApulse with a pulse-width of 3ms and an interval of 550ms for aduration of 15min.
H-Reflex MeasurementTo determine the changes induced to the H-reflex by tsDCSin one of the three configurations, we chose to characterizethe H-reflex recruitment curve at four characteristic points(Figure 2): H-Reflex threshold (Hthresh), 50% of H-reflexmaximum (Hmax50%), the point at which the ascending partof the recruitment curve begins to settle (Hsettle) as well asthe maximum H-wave (Hmax). These points were chosen fortheir ability: (1) to reflect the anticipated changes of the H-reflex recruitment curve (left/right shift, based on Lamy et al.,2012), or overall amplitude modulation, as well as (2) tosufficiently approximate the ascending part of the recruitmentcurve. The points were determined from a detailed H-reflexrecruitment curve, recorded at the start of each experiment.The recruitment curve was sampled at stimulation intervals I(see: Experimental Protocol). Thereby, Mmax, Hmax, and Hthresh
were determined manually, with Hmax defined as the peakvalue of the average H-wave recruitment curve and Mmax theamplitude immediately after peak settling amplitude of the M-wave recruitment curve. Hthresh was defined as the first visibleH-Wave, in response to a stimulus. Hsettle and Hmax50% weredetermined via fitting of a sigmoid function f (s) to the recordedrecruitment curve: f (s) = Hmax/(1 + e−m(s−Smax50%)). Thereby,m is the function slope at f (Smax50%), Smax50% the stimulusneeded to evoke 50% of Hmax, Hmax the maximum value ofthe recruitment curve and Smax the corresponding stimulationamplitude. Hmax50% and Hsettle are then defined as f (Smax50%)and f (Ssettle) respectively, given f ′′(Ssettle) = min(f ′′(s)). Foreach point, the closest multiple of I was chosen as a stimulationamplitude.
EMGBipolar, EMG was recorded using a TMSi Porti amplifier (TMSi,Oldenzaal, NL) from the belly of the right lateral soleus musclewith electrode centers placed ∼3 cm apart, 4 cm below the
Stimulus Strength [mA]
H
Sthresh
Sm
ax50%
Ssettle
Sm
ax
Htresh
Hmax50%
Hsettle
Hmax
SM
,max
Mmax
M
Re
spo
nse
Am
pli
tud
e [
mV
]
FIGURE 2 | Overview of the distinct points measured within the H- and M-
Wave recruitment curves: H-Reflex threshold (Hthresh), 50% of H-reflex
maximum (Hmax50%), the point at which the ascending part of the recruitment
curve begins to settle (Hsettle), the maximum H wave (Hmax ) as well as the
maximum M-wave (Mmax ).
initiation of the gastrocnemius tendon. The sampling frequencywas set to 2048 samples/s.
Nerve StimulationH-Reflex responses were evoked using electrical stimulationof the tibial nerve (Micromed Matrix Light, Micromed S.p.A.,Mogliano Veneto, Italy). Adhesive active-cathodal (1.5× 1.5 cm)and return -anodal (5 × 5 cm) electrodes were placed overthe tibial nerve in the popliteal fossa and above the patellarespectively. The stimulation consisted of a biphasic pulse witha pulse width of 0.5ms and stimulation amplitudes ranging from0 to 80mA.
BDNF GenotypingSaliva samples were collected (Oragene Dx, DNA Genotek Inc.,Ottawa, Canada) from each subject. Subsequently all sampleswere analyzed to detect the BDNFVal66Met polymorphism usingTaqman (rs6265). Additionally, BDNF concentration and samplepurity (260/280) were detected.
Experimental ProtocolThe experiment was set up in a randomized double-blindplacebo controlled design, whereby both experimenter andsubject were blinded with respect to the intervention type(real or sham). Interventions consisted of the three stimulationconfigurations and one sham stimulation. For each intervention,an individual experiment was performed in a randomized orderwith experiments planned with an interval of at least 7 days. Theconfiguration by which sham was performed was randomizedacross subjects.
Subjects were instructed to avoid drinking coffee or consumeother stimulants on the day of the experiment. Preparatory steps
Frontiers in Neuroscience | www.frontiersin.org 3 March 2018 | Volume 12 | Article 151

Kuck et al. tsDCS - Configuration Specific Changes in H-Reflex
before attachment of EMG and tibial nerve stimulation electrodesincluded skin disinfection with alcohol, shaving and exfoliatingof the desired skin section. With the subject lying on a medicalbench in a prone position, EMG electrodes and nerve stimulationcounter electrode in place, a handheld stimulation probe wasused to determine the optimal position to stimulate the tibialnerve. Indicators for an appropriate stimulation position were aclear EMG response and visible contraction of the soleus, whileexcluding the contraction of other muscles such as the tibialisanterior, to avoid stimulation of the peroneal nerve. Additionally,an approximate H-reflex threshold was determined during thisprocedure, used for the determination of the needed stimulationincrement for recruitment curve sampling.
After placement of the active stimulation amplitude, thesubject was comfortably seated in an inclined medical chair, headand arms supported (Ankle angle: ∼110◦, Knee angle: ∼150◦,Hip angle: ∼120◦, similar to Lamy et al., 2012). Thereafter, theprotocol was executed as shown in Figure 3, for which the subjectwas instructed to remain entirely still and to avoid movement ormuscle tension throughout the course of the experiment.
As a first step, an entire recruitment curve was measuredat small intervals, later used to determine the stimulationamplitude of four relevant H-wave points (Figure 2). Starting ata stimulation amplitude at which no response was visible, theamplitude was increased gradually in predetermined intervalsI, while measuring six times at each increment. I was setaccording to the previously approximated threshold amplitude.For thresholds below 10mA, increments were set to threshold/10,otherwise an interval of 1mA was used. The recruitment curvewas sampled until reaching its declining portion afterHmax, afterwhich the amplitude was increased at larger increments, untilafter the maximumM-wave was reached.
After completion of the initial curve mapping process, thestimulation amplitudes for Hthresh, Hmax50%, Hsettle, Hmax, and
FIGURE 3 | Overview of experimental protocol. At Pre-Baseline an initial
recruitment curve mapping took place to determine characteristic points within
the H- and M- Wave recruitment curves (see Figure 2). After an additional
baseline measurement, the tsDCS intervention was started with an amplitude
of 2.5mA and a duration of 15min. During tsDCS, the H-reflex is probed after
2min (S1) and 9min (S2), measuring only Hsettle, Hmax , and Mmax . Post
tsDCS measurements follow immediately (t0) and 30min (t30) after the
intervention.
Mmax were identified within the recorded recruitment curve (see:H-reflexmeasurement:). These stimulation amplitudes were thenheld constant throughout the experiment.
After an additional baseline measurement, the tsDCSintervention was started. Post measurements were performedimmediately after (t0) and 30min following the intervention(t30). To assess the acute stimulation effects, additionalmeasurements, 2 min (S1) and 9min (S2) in the course ofthe intervention, were conducted. To reduce interference witheffects of tsDCS, only Hmax50%, Hsettle, andMmax were measuredat S1 and S2. The protocol was repeated for each electrodeconfiguration and a sham condition.
Data AnalysisData processing was performed with a custom Matlab script(Matlab v.2015a, MathWorks Inc., Natick, USA). EMG signalswere high pass filtered at 5Hz after which H- and M- wave peak-to-peak amplitudes were determined automatically. Thereafter,all amplitudes were normalized with their corresponding Mmax.Extreme outliers, such as null responses, were removedmanually.
We expressed each obtained data point by its difference tobaseline. This difference is normalized by the value of Hmax atbaseline and therefore expressed as a fraction of initial, overallH-reflex amplitude allowing comparison between sessions.
As an additional outcome-measure, we calculated the areabelow the sampled characteristic points, which gives anindication about the curve as a whole. Again, the area wasexpressed as its difference to the area calculated for its respectivebaseline. The resulting area difference was normalized by theoverall area at baseline.
Because the H-reflex during stimulation was only measuredat two sample points (Hmax50% and Hsettle), we also calculatedthe area difference to baseline restricted to the interval betweenHmax50% and Hsettle. This was done in order to comparemeasurements during, to those before and after tsDCS.
StatisticsStatistical analysis was performed using IBM SPSS Statisticsv.23 (IBM Corporation, New York, USA). For each stimulationcondition a Friedman’s one-way ANOVA was used to test forsignificant effects in time and for each time interval for significanteffects of stimulation configuration. This was performed onchanges in curve area and data point amplitudes at Hmax andHmax50%. The significance level was set to p = 0.05. Post-hocpairwise comparison was performed using Dunn’s–test (Dunn,1964) with an adjusted p-value of 0.0083. Effect size r wascalculated via r = Z√
2Nwith N being the number (10) of
subjects (Pallant, 2013). Furthermore, we calculate the mean(mabs) and interquartile range (IQRabs) of the absolute differencefrom baseline for conditions found to be significant by post-hoccomparison.
To differentiate between a recruitment curve threshold shiftand overall amplitude shift, we use Friedman repeated measuresANOVA to compare within measurement values for Hmax50%
and Hmax for post-hoc measurements significant with respect tobaseline. We thereby assume that a change in recruitment curvethreshold, which is visible in a left or right shift of the recruitment
Frontiers in Neuroscience | www.frontiersin.org 4 March 2018 | Volume 12 | Article 151
Kuck et al. tsDCS - Configuration Specific Changes in H-Reflex
curve, will result in a significantly larger amplitude changemeasured at Smax50% compared to those at Smax. Consequently,an overall amplitude decrease will result in no significantdifference between the changes at Hmax50% and Hmax.
Furthermore, correlation analysis is used to rule out thatchanges in H wave could be attributed to a change in Mmax.In order to investigate differences between genotype groups,a Kruskal-Wallis test is performed for each measurement inwhich a significant difference was found, with the genotype asbetween group factor. For conditions across which a significantdifference was found, we assess two-tailed Pearson and Spearmancorrelations by using the area between the correspondingmeasurement and baseline in a range from Hmax50% to Hsettle.
RESULTS
Subject SafetyThroughout the course of the study, all subjects underwent theexperiments without adverse effects, neither during or after theapplied tsDCS, nor during the tibial nerve stimulation.
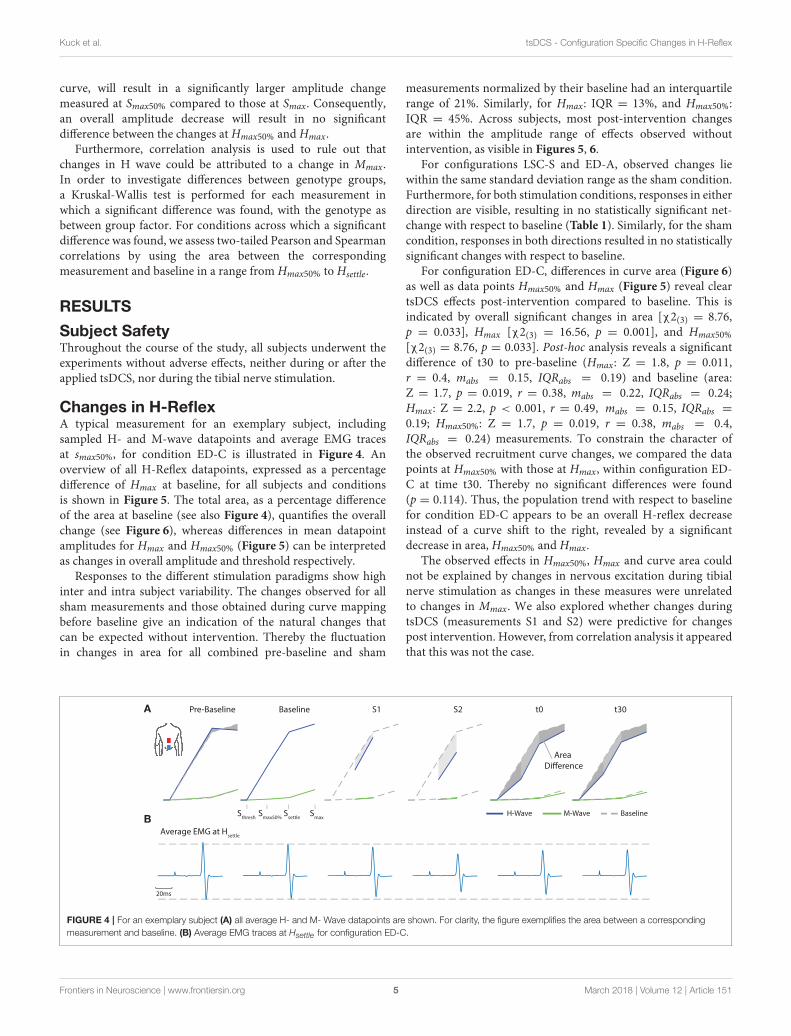
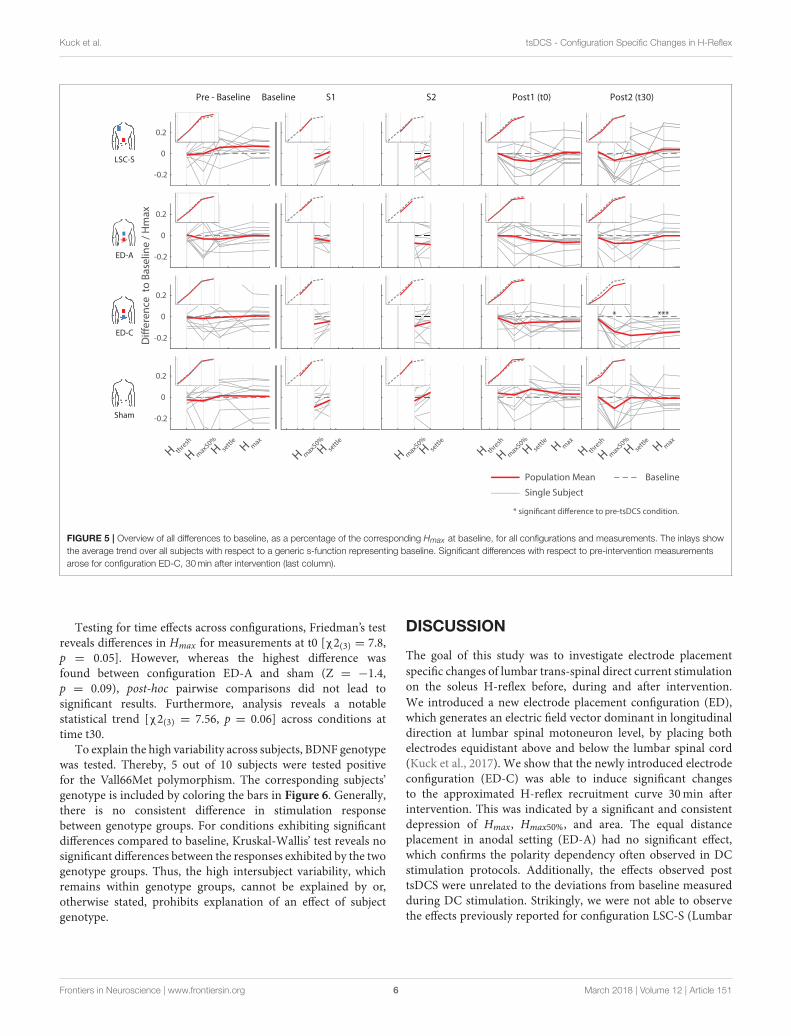
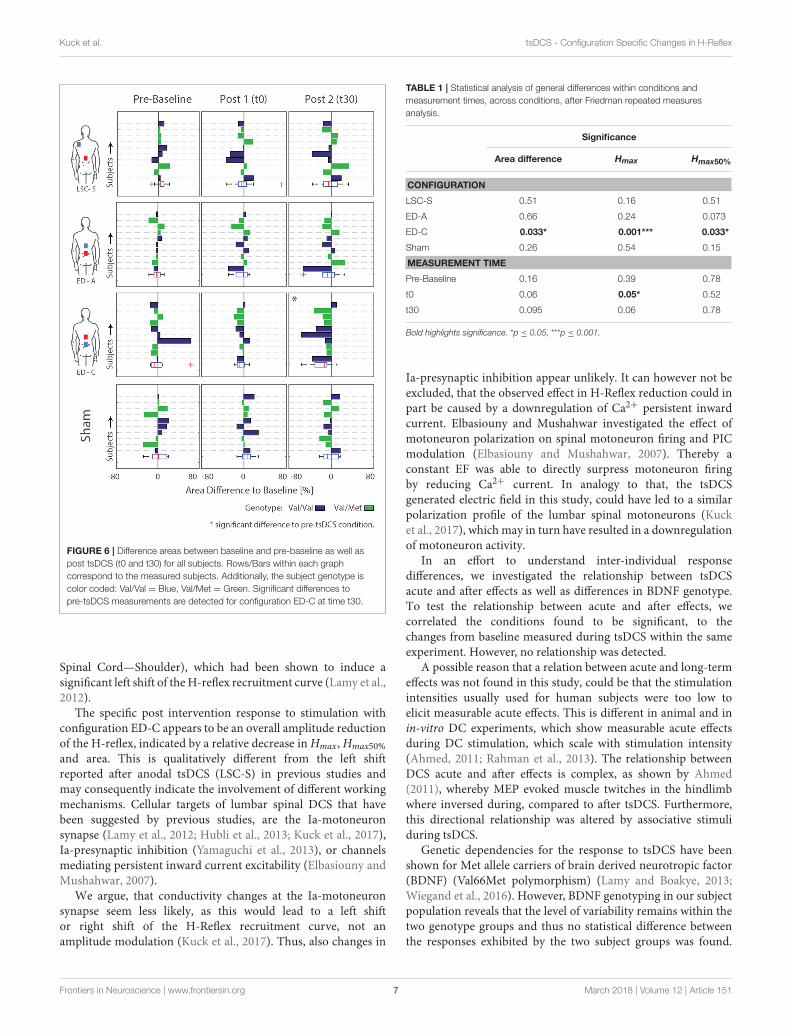
Changes in H-ReflexA typical measurement for an exemplary subject, includingsampled H- and M-wave datapoints and average EMG tracesat smax50%, for condition ED-C is illustrated in Figure 4. Anoverview of all H-Reflex datapoints, expressed as a percentagedifference of Hmax at baseline, for all subjects and conditionsis shown in Figure 5. The total area, as a percentage differenceof the area at baseline (see also Figure 4), quantifies the overallchange (see Figure 6), whereas differences in mean datapointamplitudes for Hmax and Hmax50% (Figure 5) can be interpretedas changes in overall amplitude and threshold respectively.
Responses to the different stimulation paradigms show highinter and intra subject variability. The changes observed for allsham measurements and those obtained during curve mappingbefore baseline give an indication of the natural changes thatcan be expected without intervention. Thereby the fluctuationin changes in area for all combined pre-baseline and sham
measurements normalized by their baseline had an interquartilerange of 21%. Similarly, for Hmax: IQR = 13%, and Hmax50%:IQR = 45%. Across subjects, most post-intervention changesare within the amplitude range of effects observed withoutintervention, as visible in Figures 5, 6.
For configurations LSC-S and ED-A, observed changes liewithin the same standard deviation range as the sham condition.Furthermore, for both stimulation conditions, responses in eitherdirection are visible, resulting in no statistically significant net-change with respect to baseline (Table 1). Similarly, for the shamcondition, responses in both directions resulted in no statisticallysignificant changes with respect to baseline.
For configuration ED-C, differences in curve area (Figure 6)as well as data points Hmax50% and Hmax (Figure 5) reveal cleartsDCS effects post-intervention compared to baseline. This isindicated by overall significant changes in area [χ2(3) = 8.76,p = 0.033], Hmax [χ2(3) = 16.56, p = 0.001], and Hmax50%
[χ2(3) = 8.76, p = 0.033]. Post-hoc analysis reveals a significantdifference of t30 to pre-baseline (Hmax: Z = 1.8, p = 0.011,r = 0.4, mabs = 0.15, IQRabs = 0.19) and baseline (area:Z = 1.7, p = 0.019, r = 0.38, mabs = 0.22, IQRabs = 0.24;Hmax: Z = 2.2, p < 0.001, r = 0.49, mabs = 0.15, IQRabs =0.19; Hmax50%: Z = 1.7, p = 0.019, r = 0.38, mabs = 0.4,IQRabs = 0.24) measurements. To constrain the character ofthe observed recruitment curve changes, we compared the datapoints at Hmax50% with those at Hmax, within configuration ED-C at time t30. Thereby no significant differences were found(p = 0.114). Thus, the population trend with respect to baselinefor condition ED-C appears to be an overall H-reflex decreaseinstead of a curve shift to the right, revealed by a significantdecrease in area, Hmax50% and Hmax.
The observed effects in Hmax50%, Hmax and curve area couldnot be explained by changes in nervous excitation during tibialnerve stimulation as changes in these measures were unrelatedto changes in Mmax. We also explored whether changes duringtsDCS (measurements S1 and S2) were predictive for changespost intervention. However, from correlation analysis it appearedthat this was not the case.
Pre-Baseline
Average EMG at Hsettle
Sthresh
Smax50%
Ssettle
Smax
M-Wave BaselineH-Wave
A
B
Baseline S1 S2 t0
Area
Di!erence
t30
20ms
FIGURE 4 | For an exemplary subject (A) all average H- and M- Wave datapoints are shown. For clarity, the figure exemplifies the area between a corresponding
measurement and baseline. (B) Average EMG traces at Hsettle for configuration ED-C.
Frontiers in Neuroscience | www.frontiersin.org 5 March 2018 | Volume 12 | Article 151
Kuck et al. tsDCS - Configuration Specific Changes in H-Reflex
-0.2
0
0.2
Pre - Baseline Baseline S1
LSC-S
ED-A
ED-C
Sham
S2 Post1 (t0) Post2 (t30)
Di!
ere
nce
to
Ba
seli
ne
/ H
ma
x
-0.2
0
0.2
-0.2
0
0.2
H max50%
H sett
le
H max50%
H sett
le
H max50%
H sett
le
H max
H max50%
H sett
le
H max
Baseline
H max50%
H sett
le
H thre
sh
H thre
sh
H thre
sh
H max
-0.2
0
0.2
Population Mean
Single Subject
* signi"cant di!erence to pre-tsDCS condition.
****
FIGURE 5 | Overview of all differences to baseline, as a percentage of the corresponding Hmax at baseline, for all configurations and measurements. The inlays show
the average trend over all subjects with respect to a generic s-function representing baseline. Significant differences with respect to pre-intervention measurements
arose for configuration ED-C, 30min after intervention (last column).
Testing for time effects across configurations, Friedman’s testreveals differences in Hmax for measurements at t0 [χ2(3) = 7.8,p = 0.05]. However, whereas the highest difference wasfound between configuration ED-A and sham (Z = −1.4,p = 0.09), post-hoc pairwise comparisons did not lead tosignificant results. Furthermore, analysis reveals a notablestatistical trend [χ2(3) = 7.56, p = 0.06] across conditions attime t30.
To explain the high variability across subjects, BDNF genotypewas tested. Thereby, 5 out of 10 subjects were tested positivefor the Vall66Met polymorphism. The corresponding subjects’genotype is included by coloring the bars in Figure 6. Generally,there is no consistent difference in stimulation responsebetween genotype groups. For conditions exhibiting significantdifferences compared to baseline, Kruskal-Wallis’ test reveals nosignificant differences between the responses exhibited by the twogenotype groups. Thus, the high intersubject variability, whichremains within genotype groups, cannot be explained by or,otherwise stated, prohibits explanation of an effect of subjectgenotype.
DISCUSSION
The goal of this study was to investigate electrode placementspecific changes of lumbar trans-spinal direct current stimulationon the soleus H-reflex before, during and after intervention.We introduced a new electrode placement configuration (ED),which generates an electric field vector dominant in longitudinaldirection at lumbar spinal motoneuron level, by placing bothelectrodes equidistant above and below the lumbar spinal cord(Kuck et al., 2017). We show that the newly introduced electrodeconfiguration (ED-C) was able to induce significant changesto the approximated H-reflex recruitment curve 30min afterintervention. This was indicated by a significant and consistentdepression of Hmax, Hmax50%, and area. The equal distanceplacement in anodal setting (ED-A) had no significant effect,which confirms the polarity dependency often observed in DCstimulation protocols. Additionally, the effects observed posttsDCS were unrelated to the deviations from baseline measuredduring DC stimulation. Strikingly, we were not able to observethe effects previously reported for configuration LSC-S (Lumbar
Frontiers in Neuroscience | www.frontiersin.org 6 March 2018 | Volume 12 | Article 151
Kuck et al. tsDCS - Configuration Specific Changes in H-Reflex
FIGURE 6 | Difference areas between baseline and pre-baseline as well as
post tsDCS (t0 and t30) for all subjects. Rows/Bars within each graph
correspond to the measured subjects. Additionally, the subject genotype is
color coded: Val/Val = Blue, Val/Met = Green. Significant differences to
pre-tsDCS measurements are detected for configuration ED-C at time t30.
Spinal Cord—Shoulder), which had been shown to induce asignificant left shift of theH-reflex recruitment curve (Lamy et al.,2012).
The specific post intervention response to stimulation withconfiguration ED-C appears to be an overall amplitude reductionof the H-reflex, indicated by a relative decrease inHmax,Hmax50%
and area. This is qualitatively different from the left shiftreported after anodal tsDCS (LSC-S) in previous studies andmay consequently indicate the involvement of different workingmechanisms. Cellular targets of lumbar spinal DCS that havebeen suggested by previous studies, are the Ia-motoneuronsynapse (Lamy et al., 2012; Hubli et al., 2013; Kuck et al., 2017),Ia-presynaptic inhibition (Yamaguchi et al., 2013), or channelsmediating persistent inward current excitability (Elbasiouny andMushahwar, 2007).
We argue, that conductivity changes at the Ia-motoneuronsynapse seem less likely, as this would lead to a left shiftor right shift of the H-Reflex recruitment curve, not anamplitude modulation (Kuck et al., 2017). Thus, also changes in
TABLE 1 | Statistical analysis of general differences within conditions and
measurement times, across conditions, after Friedman repeated measures
analysis.
Significance
Area difference Hmax Hmax50%
CONFIGURATION
LSC-S 0.51 0.16 0.51
ED-A 0.66 0.24 0.073
ED-C 0.033* 0.001*** 0.033*
Sham 0.26 0.54 0.15
MEASUREMENT TIME
Pre-Baseline 0.16 0.39 0.78
t0 0.06 0.05* 0.52
t30 0.095 0.06 0.78
Bold highlights significance. *p ≤ 0.05, ***p ≤ 0.001.
Ia-presynaptic inhibition appear unlikely. It can however not beexcluded, that the observed effect in H-Reflex reduction could inpart be caused by a downregulation of Ca2+ persistent inwardcurrent. Elbasiouny and Mushahwar investigated the effect ofmotoneuron polarization on spinal motoneuron firing and PICmodulation (Elbasiouny and Mushahwar, 2007). Thereby aconstant EF was able to directly surpress motoneuron firingby reducing Ca2+ current. In analogy to that, the tsDCSgenerated electric field in this study, could have led to a similarpolarization profile of the lumbar spinal motoneurons (Kucket al., 2017), whichmay in turn have resulted in a downregulationof motoneuron activity.
In an effort to understand inter-individual responsedifferences, we investigated the relationship between tsDCSacute and after effects as well as differences in BDNF genotype.To test the relationship between acute and after effects, wecorrelated the conditions found to be significant, to thechanges from baseline measured during tsDCS within the sameexperiment. However, no relationship was detected.
A possible reason that a relation between acute and long-termeffects was not found in this study, could be that the stimulationintensities usually used for human subjects were too low toelicit measurable acute effects. This is different in animal and inin-vitro DC experiments, which show measurable acute effectsduring DC stimulation, which scale with stimulation intensity(Ahmed, 2011; Rahman et al., 2013). The relationship betweenDCS acute and after effects is complex, as shown by Ahmed(2011), whereby MEP evoked muscle twitches in the hindlimbwhere inversed during, compared to after tsDCS. Furthermore,this directional relationship was altered by associative stimuliduring tsDCS.
Genetic dependencies for the response to tsDCS have beenshown for Met allele carriers of brain derived neurotropic factor(BDNF) (Val66Met polymorphism) (Lamy and Boakye, 2013;Wiegand et al., 2016). However, BDNF genotyping in our subjectpopulation reveals that the level of variability remains within thetwo genotype groups and thus no statistical difference betweenthe responses exhibited by the two subject groups was found.
Frontiers in Neuroscience | www.frontiersin.org 7 March 2018 | Volume 12 | Article 151

Kuck et al. tsDCS - Configuration Specific Changes in H-Reflex
This does however not rule out the influence of other geneticdependencies (Wiegand et al., 2016).
We did not observe a consistent recruitment curve left shiftafter tsDCS with configuration LSC-S, as reported previously(Lamy et al., 2012). Based on Lamy et al. we had expecteda substantial increase of Hmax50% with respect to baseline(for configuration LSC-S at time T30). However, with a meandifference from baseline for Hmax50% of−6.3% (95% CI [−20.81,8.26%]), the population response observed here is substantiallydifferent from that. However, this is in line with observationsby Hubli et al. who showed no significant modulatory effectsafter anodal tsDCS tested in healthy individuals (Hubli et al.,2013). We therefore assume that the absence of a modulatoryeffect after tsDCS in configuration LSC-S, must be attributed toexperimental and/or subject-specific factors.
The two main methodological differences between theprotocol used here and the one of Lamy et al. are the amount ofmeasurements taken during tsDCS as well as sample size. For theformer, Lamy et al. sampled two complete H-reflex recruitmentcurves during tsDCS at a stimulus frequency of 0.33Hz, and ameasurement time of 3–4min for each curve. In contrast to that,we intentionally reduced the number of measurements duringtsDCS, to prevent interactions with the artificially induced neuralactivity and therefore influence intervention outcome. With eachmeasurement lasting ∼1–2min (thus overall 2–4min duringtsDCS), the amount of induced neural activity was substantiallylower as compared to the protocol performed by Lamy et al.(6–8min during tsDCS). Along this line, Hubli and colleaguesdid not measure during tsDCS and stimulation was appliedduring rest, thus reducing neural activity during DC stimulationto a resting level (Hubli et al., 2013). Since the outcome of DCstimulation is thought to be neural activity dependent (Biksonet al., 2013), the agreement of our results with those reported byHubli et al. (2013) and the discrepancies with those observed byLamy et al. may be explained via the differences in induced neuralactivity during tsDCS.
With regards to sample size, we included a smaller numberof subjects (N = 10) compared to Lamy et al. (N = 17), whichmay suggest limited statistical power to show an otherwisesignificant effect. However, based on the mentioned population
mean forHmax50%, 30min after tsDCS with configuration LSC-S,the responses obtained here are substantially different from thosereported by Lamy et al. Furthermore, our results agree with thoseof Hubli et al. who had included the same number of subjects(N = 17) as Lamy et al. Out of these reasons, it is unlikely thatsample size is able to account for the mentioned differences inintervention outcome.
CONCLUSION
The presented results are a further step toward forming a basicunderstanding of tsDCS andmay potentially contribute to amoretargeted application in the future. In the light of the knowledgeobtained by others, the overall reduction of the H-reflex afterstimulation with configuration ED-C indicates that by changingEF direction with respect to the target structure the networkresponse can be changed. This implies that different cellulartargets may be dominant depending on EF orientation, whichis in line with current state of the art knowledge. Against ourexpectations, we were not able to observe the same recruitment-curve left shift for configuration LSC-S as previously reportedby others, which could be accounted for by methodologicalor subject specific differences as discussed. In addition to thedepression effects discussed earlier, this highlights the complexityof the underlying mechanisms, which have to be understoodbefore tsDCS can find its way into clinical application.
AUTHOR CONTRIBUTIONS
AK, DS, HvdK, and EvA took part in initial planning. AK carriedout the experiments and data analysis. AK, DS, HvdK, and EvAcontributed to the interpretation of the results. AK took the leadin writing the manuscript. All authors provided critical feedbackand helped shape the research, analysis, and manuscript.
FUNDING
This research was supported by ZonMw (Grant Nr. 10-10400-98-008) as part of the NeuroControl—Assessment and Stimulation(NeurAS) consortium.
REFERENCES
Ahmed, Z. (2011). Trans-spinal direct current stimulation modulates motorcortex-induced muscle contraction in mice. J. Appl. Physiol. 110, 1414–1424.doi: 10.1152/japplphysiol.01390.2010
Arlotti, M., Rahman, A., Minhas, P., and Bikson, M. (2012). Axonterminal polarization induced by weak uniform DC electric fields: amodeling study. Conf. Proc. IEEE Eng. Med. Biol. Soc. 2012, 4575–4578.doi: 10.1109/EMBC.2012.6346985
Bikson,M., and Rahman, A. (2013). Origins of specificity during tDCS: anatomical,activity-selective, and input-bias mechanisms. Front. Hum. Neurosci. 7:688.doi: 10.3389/fnhum.2013.00688
Bocci, T., Marceglia, S., Vergari, M., Cognetto, V., Cogiamanian, F., Sartucci,F., et al. (2015). Transcutaneous Spinal Direct Current Stimulation (tsDCS)modulates human corticospinal system excitability. J. Neurophysiol. 114, 440-446. doi: 10.1152/jn.00490.2014
Chhabra, H., Shivakumar, V., Agarwal, S. M., Bose, A., Venugopal, D., Rajasekaran,A., et al. (2015). Transcranial direct current stimulation and neuroplasticitygenes: implications for psychiatric disorders. Acta Neuropsychiatr. 28, 1–10.doi: 10.1017/neu.2015.20
Cogiamanian, F., Ardolino, G., Vergari, M., Ferrucci, R., Ciocca, M., Scelzo, E.,et al. (2012). Transcutaneous spinal direct current stimulation. Front. Psychiatry3:63. doi: 10.3389/fpsyt.2012.00063
Dmochowski, J. P., Datta, A., Bikson, M., Su, Y., and Parra, L. C. (2011). Optimizedmulti-electrode stimulation increases focality and intensity at target. J. NeuralEng. 8:46011. doi: 10.1088/1741-2560/8/4/046011
Dunn, O. J. (1964). Multiple comparisons using rank sums. Technometrics 6,241–252. doi: 10.1080/00401706.1964.10490181
Elbasiouny, S. M., and Mushahwar, V. K. (2007). Suppressing the excitabilityof spinal motoneurons by extracellularly applied electrical fields:insights from computer simulations. J. Appl. Physiol. 103, 1824–1836.doi: 10.1152/japplphysiol.00362.2007
Frontiers in Neuroscience | www.frontiersin.org 8 March 2018 | Volume 12 | Article 151
Kuck et al. tsDCS - Configuration Specific Changes in H-Reflex
Hubli, M., Dietz, V., Schrafl-Altermatt, M., and Bolliger, M. (2013).Modulation of spinal neuronal excitability by spinal direct currents andlocomotion after spinal cord injury. Clin. Neurophysiol. 124, 1187–1195.doi: 10.1016/j.clinph.2012.11.021
Kabakov, A. Y., Muller, P. A., Pascual-Leone, A., Jensen, F. E., and Rotenberg, A.(2012). Contribution of axonal orientation to pathway-dependent modulationof excitatory transmission by direct current stimulation in isolated rathippocampus. J. Neurophysiol. 107, 1881–1889. doi: 10.1152/jn.00715.2011
Kuck, A., Stegeman, D. F., and van Asseldonk, E. (2017). Modeling trans-spinaldirect current stimulation for the modulation of the lumbar spinal motorpathways. J. Neural Eng. 14:56014. doi: 10.1088/1741-2552/aa7960
Lamy, J.-C., and Boakye, M. (2013). BDNF Val66Met polymorphism alters spinalDC stimulation-induced plasticity in humans. J. Neurophysiol. 110, 109–116.doi: 10.1152/jn.00116.2013
Lamy, J.-C., Ho, C., Badel, A., Arrigo, R. T., and Boakye, M. (2012). Modulationof soleus H reflex by spinal DC stimulation in humans. J. Neurophysiol. 108,906–914. doi: 10.1152/jn.10898.2011
Lapenta, O. M., Minati, L., Fregni, F., and Boggio, P. S. (2013). Je pense donc je fais:transcranial direct current stimulation modulates brain oscillations associatedwith motor imagery and movement observation. Front. Hum. Neurosci. 7:256.doi: 10.3389/fnhum.2013.00256
Miranda, P. C. (2013). “Chapter 29 - Physics of effects of transcranial brainstimulation,” in Brain Stimulation Handbook of Clinical Neurology, eds A. M.Lozano and M. Hallett (New York, NY: Elsevier), 353–366.
Pallant, J. (2013). SPSS Survival Manual: a Step by Step Guide to Data Analysis
Using SPSS. Berkshire.Radman, T., Ramos, R. L., Brumberg, J. C., and Bikson, M. (2009). Role
of cortical cell type and morphology in subthreshold and suprathresholduniform electric field stimulation in vitro. Brain Stimul. 2, 215.e3–228.e3.doi: 10.1016/j.brs.2009.03.007
Rahman, A., Reato, D., Arlotti, M., Gasca, F., Datta, A., Parra, L. C., et al.(2013). Cellular effects of acute direct current stimulation: somatic and synapticterminal effects. J. Physiol. 591, 2563–2578. doi: 10.1113/jphysiol.2012.247171
Rampersad, S. M., Janssen, A. M., Lucka, F., Aydin, Ü., Lanfer, B., Lew, S.,et al. (2014). Simulating transcranial direct current stimulation with a detailedanisotropic human head model. IEEE Trans. Neural Syst. Rehabil. Eng. 22,441–452. doi: 10.1109/TNSRE.2014.2308997
Ranieri, F., Podda, M. V., Riccardi, E., Frisullo, G., Dileone, M., Profice,P., et al. (2012). Modulation of LTP at rat hippocampal CA3-CA1
synapses by direct current stimulation. J. Neurophysiol. 107, 1868–1880.doi: 10.1152/jn.00319.2011
Reato, D., Rahman, A., Bikson, M., and Parra, L. C. (2010). Low-Intensity electricalstimulation affects network dynamics by modulating population rate and spiketiming. J. Neurosci. 30, 15067–15079. doi: 10.1523/JNEUROSCI.2059-10.2010
Ruffini, G., Wendling, F., Merlet, I., Molaee-ardekani, B., Mekonnen, A.,Salvador, R., et al. (2013). Transcranial Current Brain Stimulation (tCS):models and technologies. IEEE Trans. Neural Syst. Rehabil. Eng. 21, 333–345.doi: 10.1109/TNSRE.2012.2200046
Salvador, R., Mekonnen, A., Ruffini, G., and Miranda, P. C. (2010). Modelingthe electric field induced in a high resolution realistic head model duringtranscranial current stimulation. Conf. Proc. IEEE Eng. Med. Biol. Soc. 2010,2073–2076. doi: 10.1109/IEMBS.2010.5626315
Tranchina, D., and Nicholson, C. (1986). A model for the polarization ofneurons by extrinsically applied electric fields. Biophys. J. 50, 1139–1156.doi: 10.1016/S0006-3495(86)83558-5
Wiegand, A., Nieratschker, V., and Plewnia, C. (2016). Genetic modulationof transcranial direct current stimulation effects on cognition. Front. Hum.
Neurosci. 10:651. doi: 10.3389/fnhum.2016.00651Winkler, T., Hering, P., and Straube, A. (2010). Spinal DC stimulation in humans
modulates post-activation depression of the H-reflex depending on currentpolarity. Clin. Neurophysiol. 121, 957–961. doi: 10.1016/j.clinph.2010.01.014
Yamaguchi, T., Fujimoto, S., Otaka, Y., and Tanaka, S. (2013). “Effects oftranscutaneous spinal DC stimulation on plasticity of the spinal circuits andcorticospinal tracts in humans,” in 6th international IEEE/EMBS Conference on
Neural Engineering, 2013 (San Diego, CA), 275–278.
Conflict of Interest Statement: The authors declare that the research wasconducted in the absence of any commercial or financial relationships that couldbe construed as a potential conflict of interest.
Copyright © 2018 Kuck, Stegeman, van der Kooij and van Asseldonk.
This is an open-access article distributed under the terms of the Creative
Commons Attribution License (CC BY). The use, distribution or reproduction
in other forums is permitted, provided the original author(s) and the
copyright owner are credited and that the original publication in this
journal is cited, in accordance with accepted academic practice. No use,
distribution or reproduction is permitted which does not comply with these
terms.
Frontiers in Neuroscience | www.frontiersin.org 9 March 2018 | Volume 12 | Article 151