changes in land use/land cover patterns in indonesia's
TRANSCRIPT
Changes in Land Use/Land Cover Patterns in Indonesia's Border and their Relationto Population and Poverty
1* 2 3 4Fransiscus Xaferius ,Herwirawan , Cecep Kusmana , Endang Suhendang Widiatmaka
1Graduate School of Bogor Agricultural University, Campus IPB Dramaga, Bogor, Indonesia 166802Department of Silviculture, Faculty of Forestry, Bogor Agricultural University, Academic Ring Road,
Campus IPB Dramaga, PO Box 168, Bogor, Indonesia 166803Department of Forest Management, Faculty of Forestry, Bogor Agricultural University, Academic Ring Road,
Campus IPB Dramaga, PO Box 168, Bogor, Indonesia 166804 Road, Department of Soil Science and Land Resources, Meranti Bogor Agricultural University,
C ra ampus IPB D maga, Bogor, Indonesia 16680
Received March 20, 2017/Accepted August 30, 2017
Abstract
This study analyzes the pattern and change of land use and land cover (LULC) during 2000−2015 and its relation to population and poverty in the semi-arid region of Indonesia in Timor Island, on the country border to Republic Dominica Timor Leste (RDTL). The analyzes employ visual interpretation on the GIS software to classify 14 classes of LULC using Landsat imagery. The transition matrix of LULC change during the 15 years period indicates a substantial deforestation in which 1,309 ha or 13% of the forest in year 2000 has been disappeared. In detail, about 2 ha (7%) of primary mangrove forest has been converted into mixed farming and 1,307 ha (19%) of secondary forest has become shrub. Within the non-forest classification, 1,288 ha (17%) of shrub in 2000 has turned into savannah, and 15 ha (10%) of shrub swamp has turned into bare land, while at the same time human settlement has expanded by 118% from the settlement area in year 2000. Spatial pattern of LULC changes in the study area for 15 years are dispersed, and tend to remained in the middle area that dominated by mix agriculture. The forest cover is weakly associated with level of poverty and rural population in the study area. However, the two latter variables were not significantly associated with deforestation.
Keywords:border area, Timor Island, savannah, forest cover, deforestation
*Correspondence author, email: [email protected]
IntroductionPublic policy on land use/land cover (LULC) changes
and the welfare of the population in a country's border areas have been acknowledged as strategic to maintaining wider social, economic and political stability of the country. Indonesia shares land borders with four countries, i.e. Malaysia, Brunei, Papua Niugini, and Timor Leste. Poverty rate in the border area is rather high, for example the average poverty rate in the Indonesia's villages bordering with RDTL in 2010 is about 71.6% (SMERU 2017). This high poverty burden begs for new development strategy to reduce the economic and political vulnerability of the people residing in the country's border area (Guo & Lee 2000). One of the contributing sectors in this border area is forestry sector. However, empirical study on LULC and its interrelation with population pressure and poverty rate in Indonesia's border area are rather limited, let alone one with pro-poor forestry development perspective.
Information on pattern and change of land use are crucial for the understanding of human activities in an area at a specific time period. Changes of LULC reflect dynamics of
human activity that can be triggered by various human and non-human factors (Kissinger et al. 2012; Kummer & Turner 2009). LULC changes follow a certain pattern according to the ways of the fulfillment of human needs for clothing, food and shelter that has lasted a long time and continuously (Williams 2000). Human being mostly depended on land which used as a settlement, agriculture land, road, infrastructure, and others. The most LULC changed by man made process because of increasing population, technology and development of civilization, and some are used by natural process (Turner II 2009). The pattern of changes that clustering, dispersed or random are describe human activity for spesific periodic time to fullfill their needs especially for economic purpose. Evolutionary development processes in rural area will change the pattern of LULC, normally to become suburban and urban area. The development can have influence on the way in which people pattern their social lives (Bryant 2000; Acharya & Bennet 2001; Halder 2013).
Pattern of LULC defined as a regular repetition or
Jurnal Manajemen Hutan Tropika Vol. 23, (2): 90-101, August 2017
EISSN: 2089-2063
DOI: 10.7226/jtfm.23.2.90
Scientific Article
ISSN: 2087-0469

arrangement of lines, shapes, or colors on image or photograph of the terrestrial surface of the earth. Spatial pattern interpretation are determined as clustering, dispersed, or random, with qualitative of quantitative approach (Klipper et al. 2011). The spatial pattern can used for identified the natural process and human activity on land. The pattern can give description about rural area that has characteristic dominated by agriculture, forest land, recreational space and small settlement, or urban area that dominated by built in area, infrastructure, and dense settlement. The behavior of individuals in a neighborhood, we are going to have to know something about both the built and social environments, and that different combinations of each will produce unique patterns of social behavior (Weeks 2005). et al. The satellite remote sensing data with their repetitive nature have proved to be quite useful in mapping pattern and change with LULCtimes et al (Yangchan . 2014).
Previous research indicate that in Indonesia the cause of sland use change is primarily socio-economic conditions (Sunderlin Resosudarmo 1996)& , broader spatial scale of agriculture of rubber and oil palm in Jambi (Klasen . et al2015) In South West Sulawesi there are two factor that .causes deforestation: one is accessibility, and second is social factor there are population density and biophysic, i.e. elevation and slope (Setiawan 2015).et al. Globally, the main causes including poverty (Swinton & Quiroz 2003), low knowledge on agriculture cultivation technology (Nye &Greenland 1960; Rasul Thapa 2003), and urban expansion &(Xiao et al. 2005).
The of this study is to determine pattern and objective the changes of LULC and its relation to population ship with theand poverty rate in Indonesia's Timor Island within the border areas. One of the border areas lies in North-Central Timor istrict.D
Methods
Study area The study area covers 58 villages in the district of North Central Timor, Indonesia where poverty rate is high. The district comprises of 24 sub districts and below the sub-districts there are 174 villages (Central Bureau of Statistics 2014). Only 58 villages are positioned in the border area. These 58 villages cover a forest area of 112,303 ha, of which 40,580 ha is devoted as protected forest, 69,322 ha as production forest, and 2,301 ha as conservation forest (MoEF 2014). The district inhabitants are approximately 229,803 people in 2015. The inhabitants' main occupations are in agriculture, forestry, and estate crop activities that are associated with poor working poor category (Yovi &Yamada 2015). Agriculture and forest sector are rather limited, this is despite the region has land resources suitable for taro and legumes cultivation, animal husbandry, plant estate, and forestry (Taena et al. 2010). The socioeconomic conditions of the study are qualified using several dimensions. Among others, these are education, occupation, health, poverty, and population. These dimensions are detailed into several indicators, i.e. population size, composition of household by sector of economy, poverty rate, percentage of agriculture workers, and high school participation. Whenever available, we compare the level of achievement of villages in the border versus the non-border. Descriptions of these indicators are
presented in graphical form or tabulation. Mainly we use statistics from the latest population census, agriculture census, and poverty map.
LULC interpretation and change The analysis of LULC change was conducted using landsat image data of 2000 and 2015 to compare the extent of forest cover and other cover, so that the changes can be estimated. Deforestation and forest degradation can detected using landsat imagery (Nugroho et al. 2011; Sulistiyono et al. 2015). Landsat image data were downloaded and interpreted and the maps for year 2000 and year 2015 were overlaid. Analysis was done using software ArcGIS 10.1 and other software. The , ERDAS imagine, interpretation of the image is done by visual classification or guided interpretation supported by the local knowledge of the interpreter. The visual interpretation of sattelite images include the meaning of the image content but also goes beyond what can be seen on the image in order to recognise spatial and lanscape patterns. This process can be roughly divided into two process:1 The recognition of objects such as street, fields, rivers, etc
The quality of recognition depends on the expertise in image interpretation and visual perception.
2 A true interpretation can be ascertained through conclusions (from previously recognized objects) of situation, recovery, etc. Subject specific knowledge and expertise are crucial (Rahman 2004). et al.
The interpretation considers the size, hue, color, texture, and pattern of the objects that visually visible in the image (Lillesand 2014). The size includes length, width, area, et al.so that between objects can be distinguished and made restrictions. The shows the dark distinction of an object hueinfluenced by moisture levels, for example due to puddles or vegetation conditions. The color is strongly influenced by different reflectance from each that provide both objectnatural and pseudo colors. The texture is a combination of hue size and distances that are distinguished to be smooth, , ,rough, and uniform. Stages of the process of interpretation of landsat imagery are presented in .Figure 1 The image coverage in 2000 and 2015 to identify the extent of the 23 forest and non forest subclasses (MoEF 2015). In general, LULC is divided into two categories, namely forest versus non forest categories. The forest category consists of 7 classes, and the non-forest category consists of 14 classes. The subclasses under forest category are: dryland primary forest (PF), dryland secondary forest (SF), primary swamp forest (PSF), secondary swamp forest (SSF), primary mangrove forest (PMF), secondary mangrove forest (SMF), and plantations forest (P). Meanwhile, subclasses under non forest category are shrub (S), settlement (St), bare land (B), savannah (Sv), water body (W), shrub swamp (SS), dryland agriculture (A), mixed dryland agriculture (MA), rice field (RF), pond (Po), crop (C), airport (Ap), transmigration (Tr), mining (M), swamp (Sw), and cloud (c). The size of the area of each class is derived from digital calculation using GIS application. Thereafter, to estimate the changes in land use we overlay the map of Landsat imagery interpretation map for year 2000. The for year 2015 on the changes that occur are presented in a matrix of LULC change, which provide information of indicative patterns of LULC changes. We compute the absolute change, the
Scientific Article
ISSN: 2087-0469
Jurnal Manajemen Hutan Tropika Vol. 23, (2): 90-101, August 2017
EISSN: 2089-2063
DOI: 10.7226/jtfm.23.2.90
91

relative change to LULC in 2000, and the speed of change (ha year ).-1
The absolute change for each class of LULC is obtained through the following formula as shown in Equation [1]:
note: = the change in LULC class i between the years DKi,th2000−2015 (ha), = the i LULC classes in 2015 Ki,2015
th(ha), = the i LULC classes in 2000 (ha), 1,2,3, Ki,2000...,23
Meanwhile the relative change is calculated with against the LULC class in 2000 with the Equation [2]:
note: the percentage change in LULC class I (%)rK =i
The speed of LULC change per year is calculated using Equation [3]:
note: the speed of LULC change per year for LULC nK = iclass i (% per year)
The relationship between deforestation and forest area with poverty and population Analysis of the relationship is perform using Spearman rank correlation. The correlation coefficient was computed using the formula as shown in Equation [4] (Spearman 1904):
note : Sd = the sum of the differences of rank for all the villages, n = the total number of villages, R = the required correlation.
The correlation coefficient estimated for (i) deforestation and population, (ii) deforestation and poverty rate, (iii) forest
cover and population, (iv) forest cover and poverty rate. We need to perform a significance test to decide whether based upon this sample there is any or no evidence to suggest that linear correlation is present in the population. To do this we test the null hypothesis, H , that there is no monotonic 0
correlation against the alternative hypothesis, H , that there is 1
monotonic correlation; our data will indicate which of these opposing hypotheses is most likely to be true. Let be the ρs
Spearman's population correlation coefficient then we can thus express this test as:
H : = 0 H : ≠ 0 ρ ρ0 s 1 s
i.e. the null hypothesis of no monotonic correlation present in population against the alternative that there is monotonic correlation present in population. the p-value for this test Ifis smaller than 10% we can say that we have evidence to accept 1. H .
Results and DiscussionGeographical and climate situation Geographically the district of North Central Timor is located between 9º 02' 48"S−9º 37' 36"S and between 124º 04' 02"E 124º 46' 00"E. The administrative boundaries in the south with the territory of South Central Timor District, the north with the Ambenu (RDTL) and Sawu Sea, the west with the districts of Kupang and South Central Timor, and the east border with the districts of Belu and Malaka (Figure 2). In general, according to Central Bureau Statistic 2014, the North Central Timor District is located between 0−500 m asl. The dominance of land at an altitude of 101−500 m asl is about 149,944 ha (56%), followed by a height of 501−1,000 m asl 88,909 ha (33%). In the relatively dominant lands it is generally used as a mixed agricultural area, as the main livelihood of the community. As presented in Figure 3, in areas with altitudes greater than 1000 m asl, there is generally a healthy primary forest cover. There are the dry season lasts for nine months of the year generally from June to September, while the rainy season lasts for 3 months from December to March. But in 2016 there has been a significant change of season period where the rainfall time is longer than in previous years.
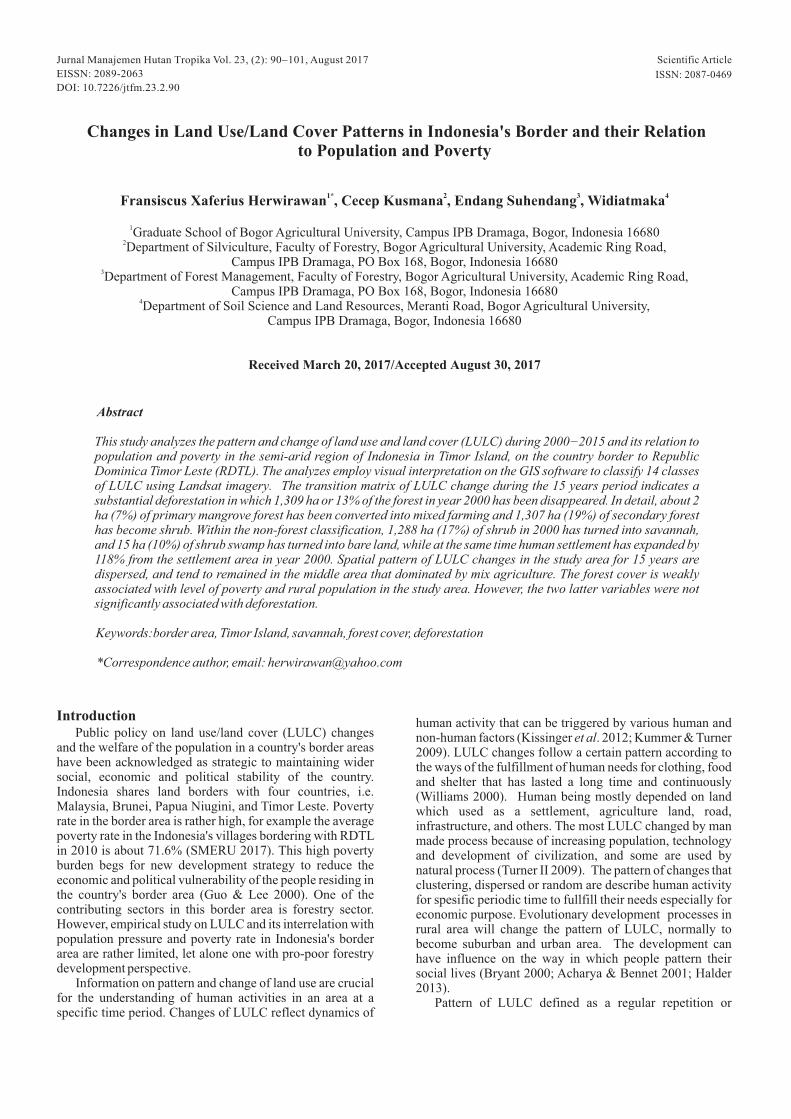
Governance, demography and economics of north central timor district The district is divided into 24 subdistricts and 174 villages (Figure 4). The population in 2015 is estimated at 246,685 people with population growth rate in the period of 2000−2010 at 1.72 percent per annum (CBS 2016). Meanwhile the number of heads of households in 2015 as many as 52,535 families. Population share by sex is almost equal, as many as 114,024 men and as many as 115,779 women. According to 2013 Agricultural Census, there are 38,078 forestry farm households. A total of 34,201 households cultivate forest crops, 23,870 households collect forest product, while a total of 223 households catch wildlife (CBS 2016). In addition to the benefits derived from forests, several reports on the occurrence of land fires and drought in 2011. There are five reports of land fires, and two incidents occurred in the border area in Nako Village in Biboki Fetleu Sub-District and Oenino Village in Central Bikomi Sub-
[1]
Landsat TM image
Interpretation base on: size, hue, color, texture, pattern, and
resolution
Groundcheck
Temporary Interpretation Map
Supporting data: Topography Map, Land use Map, etc.
Correction Temporary interpretation map and
groundcheck
Final land cover map
Field survey data
Land cover classification
Figure 1 Flowchart of landsat interpretation procedure.
rK =i K i,2000
DKi x 100
nK =i 15
rKi
R = 1 – 3Sd2n – 1
Scientific Article
ISSN: 2087-0469
Jurnal Manajemen Hutan Tropika Vol. 23, (2): 90-101, August 2017
EISSN: 2089-2063
DOI: 10.7226/jtfm.23.2.90
92

District. Drought disaster also occurred in 10 border villages in 2011. Timber forest product production in 2015 of about 906,121 m consists of blocks, dolgen, and boards that are 3
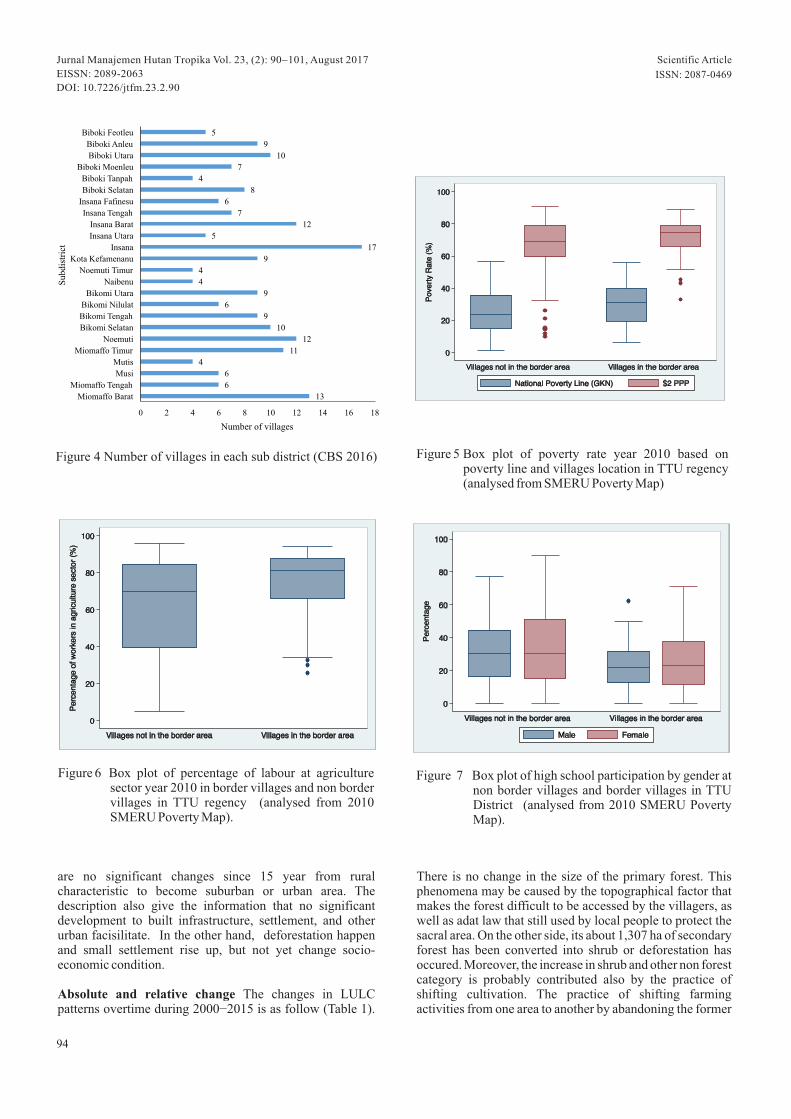
generally dominated by teak and partly mixed wood. Almost all of its products are dolgen and round wood. This illustrates that there is no wood processing, but the timber is shipped out of the district as industrial raw materials elsewhere such as Kota Kupang. In the statistical data there is no record of the existence of timber industry in the North Central Timor District. Poverty and under education are among two important challenges in developing the regency. Poverty rate is still high both on Indonesia and international standards, and endogenous to the poverty, low formal educational attainment low, and school enrollment are prevanlent. Comparing the data between cluster of village in the border areas versus non-border areas, it is found that the inhabitants of villages in border areas are on average poorer than non-border villages, as shown in Figure 5. This assestion is robust to different poverty lines. As seen in Figure 5, both using the poverty line according to the national poverty line (GKN) and poverty line according to World Bank 2010 (in which people earning less than $ 2 are categorized as poor), the inhabitants in the border villages are of than their worsecounterparts in the non-bordering villages. Villages in the border region on average have a higher percentage of workers in the agricultural sector than non-border villages. This suggests that the agricultural sector is quite dominant in the border areas, and indicates that border areas still have rural features. More than 80% of villagers in the border region work in agriculture, and about 70% of non-border villagers work in the agricultural sector (Figure 6). So it can be said that the agricultural sector is quite dominant in TTU Regency as the main livelihoods, both in border villages and non-border areas. There are several villages in the border area indicated to be outliers or out of normal distribution data. On dimension of education, people living in border villages have a lower net enrollment rate (APM) at lower secondary levels when compared to people living in non-
border villages. The average net enrollment rate in the border villages is about 20%, while in non-border villages it is around 30% (Figure 7). The number of people enrolled in high school level in non-border villages is higher than the border villages. By gender, women are more likely than men to attend high school levels in villages in border and non-border areas. There is data outside the normal distribution of border villages for male sex. It follows that youth participation to attend high school level is better in non-border villages. Indicates that villages in border areas are still lagging behind in education, and a more well-planned policy is needed to boost educational attainment in border areas.
The image interpretation for year 2000 and 2015 Based on analysis of interpretation of Landsat imagery, we find 14 out of 23 LULC classes. The classes of LULC in North Central Timor are simpler than the general classes for wider Indonesia. As of 2000, the LULC is dominated by mixed dryland ( ) area of 44,054 ha or 59.7% of the agriculture MAtotal land area, followed by shrub, and savannah (Figure 1). The forest area covers 2,984 ha primary forest, 6,789 ha second ry forest, 30 ha primary mangrove forest, and 199 ha aplantation forest. The non forest area covers 7,542 ha shrub, 7,361 ha savannah, 2,333 ha bare land, 1,538 mixed dryland agriculture, 153 ha settlement, 149 ha swamp, 55 ha water body, and 48 ha pond. Meanwhile in year 2015 is still dominated by mixed dryland , then followed by savannah and shrub agriculture ,(Figure )8 . If we compare the pattern of LULC in 2000 and 2015, there were any dominance changes like in secondary forest, shrub, bare land, savannah, shrub swamp, and mixed agriculture. Especially in savannah, its increase very significantly and the total area is much more than shrub area in 2015. This phenomena describe that human activities have strong impact in the border area, and causes land deforestation and degradation. The pattern of LULC in year 2000 dominated by traditional agriculture practices, and in year 2015 still dominated by traditional agriculture practice. The changes of the pattern are dispersed. It's show that there
Figure 2 Location of study area. Figure 3 Land share based on altitude (CBS 2016).
Scientific Article
ISSN: 2087-0469
0−25m3%
26−100m
4%
101−500m56%
501−1000m33%
>1000m4%
Jurnal Manajemen Hutan Tropika Vol. 23, (2): 90-101, August 2017
EISSN: 2089-2063
DOI: 10.7226/jtfm.23.2.90
93
are no significant changes since 15 year from rural characteristic to become suburban or urban area. The description also give the information that no significant development to built infrastructure, settlement, and other urban facisilitate. In the other hand, deforestation happen and small settlement rise up, but not yet change socio-economic condition.
Absolute and relative change The changes in LULC patterns overtime during 2000−2015 is as follow (Table 1).
There is no change in the size of the primary forest. This phenomena may be caused by the topographical factor that makes the forest difficult to be accessed by the villagers, as well as adat law that still used by local people to protect the sacral area. On the other side, its about 1,307 ha of secondary forest has been converted into shrub or deforestation has occured . Moreover, the increase in shrub and other non forest category is probably contributed also by the practice of shifting cultivation. The practice of shifting farming activities from one area to another by abandoning the former
Figure 4 Number of villages in each sub district (CBS 2016) Figure 5 Box plot of poverty rate year 2010 based on poverty line and villages location in TTU regency (analysed from SMERU Poverty Map)
Figure 6 Box plot of percentage of labour at agriculture sector year 2010 in border villages and non border villages in TTU regency (analysed from 2010 SMERU Poverty Map).
Figure 7 Box plot of high school participation by gender at non border villages and border villages in TTU District (analysed from 2010 SMERU Poverty Map).
Scientific Article
ISSN: 2087-0469
13
6
6
4
11
12
10
9
6
9
4
4
9
17
5
12
7
6
8
4
7
10
9
5
0 2 4 6 8 10 12 14 16 18
Miomaffo Barat
Miomaffo Tengah
Musi
Mutis
Miomaffo Timur
Noemuti
Bikomi Selatan
Bikomi Tengah
Bikomi Nilulat
Bikomi Utara
Naibenu
Noemuti Timur
Kota Kefamenanu
Insana
Insana Utara
Insana Barat
Insana Tengah
Insana Fafinesu
Biboki Selatan
Biboki Tanpah
Biboki Moenleu
Biboki Utara
Biboki Anleu
Biboki Feotleu
Number of villages
Subdis
tric
tJurnal Manajemen Hutan Tropika Vol. 23, (2): 90-101, August 2017
EISSN: 2089-2063
DOI: 10.7226/jtfm.23.2.90
94

and burning the latter has resulted in land degradation and unproductive farming (Coomes 1999). Consequently, et al.these give rise to more deforestation. Unfortunately, there is no successful reforestation effort in the such that the total forest decreases. region area With the increasing size of savannah, shrub, and , h bare land t istrends of change a high risk of elimination of forest indicateto become savannah . in the future Changes that occurred over the past 15 years include dryland secondary forest turned into of 1,307 ha, and shrubchange of land from to savanna area of 1 288 ha. shrub ,Meanwhile the savanna cover turned into a settlement area of 91 ha and dry land agriculture area of 120 ha. The land cover of the turns into land of 15 ha. The cover of mixed shrub bareagriculture was transformed into a area of 90 h settlement aand became dry land of one ha. L agriculture ULC change generally uses forests that are converted into non-tends to forests. Shell cover increased by 1,307 h or 19.3% of shrub acover in 2000 with an increase of about 87 ha year , -1
indicating that unproductive land is grow higher and is the dominant land cover after mixed and savanna.agriculture The area undergoing land cover change is located in Naibenu, North Insana, and West Miomaffo Sub-District that have potential to be developed as a growth center. In general it can be said that the current economic activity that is quite active in the border area is in this area, but needs to be well planned in order to happen the balance of development and not damage the environment. The trend of environmental destruction can be seen with the increasing size of savannas and shrubs that change from secondary dryland forest. The formation of savannahs/grasslands was significantly increased, covering 3,526 ha or 47.9% of savanna cover in 2000 which came from the cover of land area of 1,288 ha and open land of 2,238 ha (Figure 9).
Relative LULC changes In the matrix of changes relative to conditions of LULC in 2000 (Figure 1 ), it is understood that 0some types of LULC are not reduced i.e. primary forest types, plantations, mixed farming, dryland farming, settlements, rice fields, ponds and water bodies. The significantly LULC ,reduced is open land to savanna (96%), leaving 4% of the 2000 condition. Savannah in 2000 is reduced by 3% to 2% dry land agriculture and 1% settlement, but on the other hand savannah increased considerably from bare land 96% of the amount of bare land, and as much as 17% of the shrubs, resulting in total savanna increased by 45% from savanna conditions in 2000. Swamps were reduced by 10% and changed to become bare land. Secondary forests were reduced by 19% from 2000 and turned into shrub. Primary mangrove forests are reduced by 7% which turns into mixed agriculture. Reduction of forests should be a serious concern because there is very little forest cover that is about 13% of the total area of the TTU land border (Figure 1 ).1
Speed of LULC changes Based on the analysis result, it was found that the average speed change of forest cover or deforestation from primary mangrove forest to mixed agriculture was 0.43% per year from the initial primary mangrove forest area in 2000. The rate of change of
-1secondary forest to become shrub was 1.28% year . In non-forest category, the rate of change of mixed agriculture to dry
-1 -1land agriculture (0.0001% year ) and savanna (0.1% year ), settlement increased of 0.013% annually rate from mixed
-1agriculture and 0.082% year from savanna. The speed of -1 -1savanna change from shrubs is 1.14% year and 6.39% year
comes from bare land. The swamp was transformed into bare -1land with an average speed of 0.65% year , it also indicates
decreasing of existing swamp as a reservoir of water into bare land. The was seen as the fastest growing rate of settlement7.9% year (Figure 2). Bare land is also a relatively rapidly -1 1changing LULC of 6.35% year , followed by savanna at 3% -1
year . There are 5 classes of LULC that have not changed -1
since 2000 until 2015 (Table ).3
The directions of changes LULC There are 7 classes of LULC classes that have changed into another , and the other 7 classes have not changed into other classes. In the category of forests transformed into non-forest categories occurs in primary mangrove forests and secondary dryland forests. Primary mangrove forests convert to mixed farming, and secondary dryland forests convert into . The direction shrubof change that tends toward the negative is very worrying given the very small forest area, and indicates the occurrence of deforestation (Figure 1 ).3
Aggregate changes in forest cover to non-forest On aggregate forest versus non forest level, 2000−2015 during there is a decrease in the ratio of forest to non forest. The ratio is 16% in year 2000 but has decreased to 13% in year 2015, a decrease by 3% point in 15 years. In detail, the total forest cover in 2015 is 8,703 ha which comprises of primary forest (PF), secondary forest (SF), primary mangrove forest (PMF), and plantation forest (P). Meanwhile, the non forest covers an
Figure 8 Changes in LULC in the border area years
2000−2015.
Scientific Article
ISSN: 2087-0469
Jurnal Manajemen Hutan Tropika Vol. 23, (2): 90-101, August 2017
EISSN: 2089-2063
DOI: 10.7226/jtfm.23.2.90
95

Table 1 Matrix Changes in LULC year 2000−2015
Figure 9 Results of the interpretation of LULC in the border area and its composition in year 2000 and 2015.
Figure 10 Absolute change of LULC in the border area of
TTU Regency for 15 Years.Figure 11 The relative LULC change in the border area of
TTU District for 15 Years.
Scientific Article
ISSN: 2087-0469
-150
-100
-50
0
50
100
150
PF PMF SF P MA S SS A St Sv RF Po B C
Rel
ativ
e ch
ange
s (
%)
LULC classes
-3000
-2000
-1000
0
1000
2000
3000
4000
PF PMF SF P MA S SS A St Sv RF Po B C
Ab
solu
te c
han
ge (
ha)
LULC change
PF; 2.994
PMF ; 30
SF; 6.789
P; 199
MA ; 44.054
S; 7.542
SS; 149
A; 1.538 St; 153 Sv; 7.361
RF; 597 Po; 48
B; 2.333 W; 55
Year 2000
PF; 2.994
PMF ; 28
SF; 5.482
P; 199
MA ; 43.965
S; 7.561
SS; 134
A; 1.658 St; 334 Sv; 10.676
RF; 597
Po; 48
B; 110 W; 55 Year 2015
Total 2015
Jurnal Manajemen Hutan Tropika Vol. 23, (2): 90-101, August 2017
EISSN: 2089-2063
DOI: 10.7226/jtfm.23.2.90
96

area of 65,137 ha in year 2015, from 63 828 ha in year 2000, (Table ). One of the negative land changes is the shifting 4cultivation pattern, which tends to be practiced hand in hand with land neglect and land burning which in turn contribute to land degradation and land becomes unproductive for cultivation (Coomes 2000).
The relationship between deforestation and forest area with poverty and population Deforestation can be caused by human activities that disturb the forest (Geist Lambin &2002). The disturbing human activities can be reflected in the increase in population that rise the demand for more cultivation area for food and settlements. Especially in region where poverty rate is high and people practicing shifting cultivation without reforestation effort, the pressure to expand cultivation is higher, leading to more area deforestation. In this section we look into the association between population and poverty on one hand with forest cover and deforestation on the other hand. Countries in the world refer to the definition of forests that describe the administrative area, land cover, and type of
land use with consideration of existing conditions in the country (Lund 2011). Indonesia actually defines forests that illustrate these three points, namely:1 Describes administratively with forest area.2 Describes land cover with forest cover class of primary,
secondary, plantation and mangrove forest and swamp forest.
3 Describes land use in the presence of protected areas on spatial plans for river borders, coastal borders, springs, conservation forests, and protected forests.
Local communities are the closest stakeholders and most often in contact with forests. They will feel the immediate impact of forest conditions and depend on forest resources. Local communities as the primary need to be involved in forest management to ensure the rights of social equity in the benefit and distribution of benefits from forests as an effort to alleviate poverty and conservation of species diversity (Silori 2007; Vodouhe . 2010).et al. et al The role of the community as actors in the field is very important to understand their needs, so that the policy made is not contradictory to local values (Mardhiah . 2016), so et al
Table 2 Relative value of changes in LULC (% by 2000)
Table 3 Changes in Land Use Absolute and Relative Year 2000−2015
LULC Classes
Year 2000 (ha)
Year 2015 (ha)
Absolut Change (ha)
Relative
Change (%)
Relative Change per Year (%)
PF
2,994
2,994
0
0.00
0.00
PMF
30
28
-2
-6.53
-0.44
SF
6,789
5,482
-1307
-19.25
-1.28
P
199
199
0
0.00
0.00
MA
44,054
43,965
-89
-0.20
-0.01
S
7,542
7,561
19
0.25
0.02
SS
149
134
-15
-9.78
-0.65
A
1,538
1,658
121
7.85
0.52
St
153
334
181
118.54
7.90
Sv
7,361
10,676
3315
45.04
3.00 RF
597
597
0
0.00
0.00
Po
48
48
0
0.00
0.00
B 2,333 110 -2223 -95.30 -6.35
C 55 55 0 0.00 0.00
Total
73,841
73,841
Scientific Article
ISSN: 2087-0469
Jurnal Manajemen Hutan Tropika Vol. 23, (2): 90-101, August 2017
EISSN: 2089-2063
DOI: 10.7226/jtfm.23.2.90
97

it can be applied well through community empowerment (Garjita . 2014). Top down-made development policies et alare often difficult to implement because they are not accepted by the public. Involvement of community participation in forest management determines their future to be better, important in relation to the surrounding forest management (Agarwal 2001). Using data from 58 villages in North the border area of Central Timor , we estimate the Spearman correlation Districtbetween poverty in 2010 and forest cover in 2015. The scatter plots of the data is presented in Figure 14. The causes of LULC change vary, among others are economic factors for the needs of cultivated land, population growth, land fires, and drought (Kissinger 2012). The et al.Spearman correlation between poverty rate in 2010 and deforestation during 2000−2015 is 0.1739 (p_value = 0.1917) or it can be said that the two variables are not associated significantly (H received), while the Spearman 0
correlation between population in 2010 and deforestation during 2000−2015 is 0.1226 (p_value = 0.3593), so said there is no significant relationship between variables (H 0
received). There are possitive correlation present in population, but not statistically significant (H rejected). The 1
Spearman correlation between poverty in 2010 and forest cover in 2015 is 0.3237 (p_value = 0.00232). Likewise, the correlation between population in 2010 and forest cover in 2015 is 0.3232 (p_value = 0.0133). There is monotonic correlation present in population, but the correlation is weakly positive although statistically significant (H 1
accepted). This phenomena maybe caused by the nature of the massive poverty in the study area. In this high poverty
context in the border area of North Central Timor, poverty and population go hand in hand with forest cover. The poor flock more into area where forest cover in higher but has not benefitted economically from the deforestation to the point that they are being alleviated from poverty. Spatial pattern of LULC changes in the study area for 15 years are disperseddispersed, and tend to remained in the middle area that dominated by mix agriculture. Generally, the spatial patterns of land use are dispersed and has characteristic as rural area, but rural land use and resources are degraded that indicated by deforestation and more savannah. Poverty rate in study area still high also and social welfare not significant risen. This condition indicate that there was no economic benefit that people gain from the degradation of land use and resource. This result is contrary to other studies. For example, in the case in Peru (Swinton Quiroz 2003) and Uganda &(Treves et al. 2011), the poor communities move to the forests and meet their basic needs via shifting cultivation activity (Cairns Garrity 1999; Coomes et al. 1999 & ;Fearnside 2000; Jarosz 2004). Clearly, there is a need to introduce a new way of managing forest and people such that both forestation and poverty alleviation can go hand in hand, for example through 'community forestry' system, or other scheme that can benefit the poor local people in the area. Indeed, in other regions in Indonesia, forest management with local people can as the epicenter of forestation efforts become a strategic tool for poverty alleviation (Yuniandra 2007). Alternative solutions to deforestation problems in border areas include reforestation of forested areas. Reforestation
Figure 12 Relative Change of LULC in the border area over
15 years.
Figure 13 Internal drive changes between LULC classes year
2000−2015.
Table 4 Ratio of LULC categories of forest and non-forest
Category Area (ha)
Year 2000 Year 2015
Forest
8 ,703
Non Forest
65 ,137
Ratio
0 .13
10,01263,828
0.16
Scientific Article
ISSN: 2087-0469
-8
-6
-4
-2
0
2
4
6
8
10
PF PMF SF P MA S SS A St Sv RF Po B C
Rel
ativ
e ch
ange
per
yea
r (%
/tah
un)
LULC classes
Jurnal Manajemen Hutan Tropika Vol. 23, (2): 90-101, August 2017
EISSN: 2089-2063
DOI: 10.7226/jtfm.23.2.90
98

can be done through , and community plantation replantingdevelopment. Secondary forests actually have the ability to improve themselves that are affected by the age of forest stands, sufficient annual rainfall and dependent on current human activity disorders (Read & Lawrence 2003). It needs to be empowered to farmers to do cultivation techniques that are environmentally friendly, so that production can also increase. Optim and intensification of farming alitationtechniques according to local wisdom can be studied further (Cairns Garrity 1999).& Arranging spatial patterns and controlling population growth in border areas is necessary, because higher probability deforestation happen in the forest which near by settlement, case in West Sumatera (Mulyanto & Jaya 2004). Population growth has resulted in the need for increased settlement and resulting in land use/land use change (Xiao et al. 2006). Consequently, the need for clothing, food and employment boards also increased. Increasing the extent of the settlements illustrates the need for land for residence due to the increasing number of inhabitants (Jarosz 2004). In Lombok Island deforestation caused by policy maker, local people, timber industries, logging contractors, illegal loggers, agricultural crops investors, tobacco industries, collusive officer-businessmen ( Nurrohmat . 2011).et al The government can regulate the development of settlements in spatial planning in the RTRW, so that the areas devoted to the development of settlements are not productive areas for agriculture or which still have forest cover. The government needs to regulate and control the population growth. The prediction of population growth trends using
linear regression can be done, whereas to get a picture of transition changes the population can use the Markov transition matrix (Lopez 2001)et al. .
Conclusion Changes in land use during 2000−2015 in the North Central Timor has led to deforestation with the decrease of secondary forest by 1.28% year and primary mangrove -1
forest by 0.44% per year. In aggregate, there is a decrease in forest to non-forest ratio from 16% in 2000 to 13% in 2015. Forest cover in 2015 is positive associated with weakly population and poverty rate in village level in 2010, but there is no colleration of the two latter variables to deforestation during 2000−2015. Spatial pattern of LULC changes in the study area for 15 years are disperseddispersed, and tend to remained in the middle area that dominated by mix agriculture. This phenomena esindicat that the local poor flock near the forest but has not benefitted economically from the forest to the point that they are being alleviated from poverty co-. This beg a new way of managing forestation and poverty alleviation, among others viacollaboration forest management.
Suggestions Implementation to control the changes of LULC and to prevent deforestation with engage local community in the forest management like community forestry in the poor region will be help the people around the forest to boost their income which eventually eradicate poverty and simultanously restore the quality of environment. .
Figure 14 Distribution forest cover and deforestation on poverty and population.
Scientific Article
ISSN: 2087-0469
Jurnal Manajemen Hutan Tropika Vol. 23, (2): 90-101, August 2017
EISSN: 2089-2063
DOI: 10.7226/jtfm.23.2.90
99
ReferencesAcharya G, Bennet LL. 1999 Valuing Open Space and Land-
Use Patterns in Urban Watersheds. Journal of Real Estate Finance and Economics, 22:2/3, 221±237, 2001. Kluwer Academic Publishers. Manufactured in The Netherlands.
Bryant C. 2000. The impact of urbanization on rural land use. The role of food, agriculture, forestry and fisheries in human nutrition, Vol III.
Cairns M, Garrity DP. 1999. Improving shifting cultivation in Southeast Asia by building on indigenous fallow management strategies. ICRAFBogor: .
Central Bureau of Statistics. 2014 North Central Timor in . Figures 2014 North Central Timor . . Bureau StatisticsPublication Number: 53056.1401.
Central Bureau of Statistics. 201 North Central Timor in 6. Figures 201 North Central Timor .6. Bureau Statistics Publication Number: 53056.1601.
Coomes OT, Grimard F, Burt GJ. 1999. Tropical forests and shifting cultivation: secondary forest fallow dynamics among traditional farmers of the Peruvian Amazon. Ecological Economics : https://doi.org/10. 32 109–124.1016/S0921-8009(99)00066-X.
Fearnside PM. 2000. Global Warming and Tropical Land-Use Change: Greenhouse Gas Emissions from Biomass Burning, Decomposition nd Soils In Forest Conversion, aShifting Cultivation And Secondary Vegetation. Manaus: National Institute for Research in the Amazon (INPA).
Gardjita IP, Susilowati I, Soeprobowati TR . 2014. Empowerment strategy of farming forest people Ngudi Makmur in around Merapi National Park. EKOSAINSJournal 6(1):47−61.
Geist HJ, Lambin EF. 2002. Proximate Causes and Underlying Driving Forces of Tropical Deforestation. BioScience 52(2):143–150. https://doi.org/10.1641/0006-3568(2002)052[0143:PCAUDF]2.0.CO;2
Guo R, Lee C. 2000. Sustainable development of cross-border regions: A methodology study. Chinese Geographical Science 10(4):343−347. https://doi.org/10. 1007/s11769-000-0049-y.
Halder JC. 2013. Land use/land cover and change detection mapping in Binpur II Block, Paschim Medinipur District, West Bengal: A remote sensing and gis perspective. IOSR Journal of Humanities and Social Science 8(5):2279−0837. https://doi.org/10.9790/0837-0852031.
Jarosz L. 2004. Defining and Explaining Tropical Deforestation: Shifting Cultivation and Population Growth in Colonial Madagascar (1896−1940). Economic Geography 69(4):366−379. https://doi.org/10.2307/ 143595.
Kissinger, G., M. Herold, V. De Sy. 2012. Drivers of
Deforestation and Forest Degradation: A Synthesis Report for REDD+ Policymakers. Canada: Lexeme Consulting, Vancouver.
Klasen S, Meyer KM, Dislich C, Euler M, Faust H, Gatto M, Hettig E, Melati DN, Jaya INS, Otten F, Cruzado CP, Steinebach S, Tarigan S, Wiegand K. 2016. Econoic and ecological trade-off of agricultural specialization at different spatial scales. Ecological Economics 122:111−112. https://doi.org/10.1016/j.ecolecon.2016. 01.001.
Klippel A, Hardisty F, Li R. 2011. Interpreting Spatial Patterns: An Inquiry into Formal and Cognitive Aspects of Tobler's First Law of Geography. Pennsylvania: The Pennsylvania State University.
Kummer DM, Turner BL. 2009. The Human Causes of Deforestation in Southeast Asia. BioScience 44(5):323−328. https://doi.org/10.2307/1312382.
Lillesand TM, Kiefer RW. Chipman J. 2014. Remote Sensing and Image Interpretation. New York: John Wiley and Son.
Lopez E, Bocco G, Mendoza M, Duhau E. 2001. Predicting land-cover and land-use change in the urban fringe A case in Morelia city, Mexico. Landscape and Urban Planning 55:271–285. https://doi.org/10.1016/S0169-2046(01) 00160-8.
Lund HG. 2011. Definitions of forest, deforestation, afforestation, and reforestation. http://home.comcast.net/ ~gyde/index.html. [14 November 2011]
Mardhiah A, Supriatno, Djufri. 2016. Forest management based on local wisdom and development of village forest in Mukim Lutueng Mane Subdistrict District Pidie Aceh Province. Biotik Journal 4(2):128-135.
[MoEF] Ministry of Environment and Forestry. 2015. Guidelines for Monitoring of Land Cover. Forestry Regulation P.1/VII-IPSDH /2015. The Government of the Republic of Indonesia.
[MoEF] Ministry of Environment and Forestry. 2014. Decree No. SK. 3911/PKTL/KUH/2014 on Forest Zone Map of Nusa Tenggara province. Jakarta: The Government of the Republic of Indonesia.
Mulyanto L, Jaya INS. 2004. Spatial analysis on forest degradation and deforestation: A case study in Duta Maju Timber, West Sumatera. Jurnal Manajemen Hutan Tropika X(1):29−42.
Nugroho S, Jaya INS, Saleh MB, Wijanarto AB. 2011. Assessment of forest degradation detection method using satellite image of landsat in dry land forest of Halimun Salak National Park. Jurnal Teknosains 1(1):1−69.
Nurrohmat DR, Masijaya MY, Jaya INS, Darusman D,
Scientific Article
ISSN: 2087-0469
Jurnal Manajemen Hutan Tropika Vol. 23, (2): 90-101, August 2017
EISSN: 2089-2063
DOI: 10.7226/jtfm.23.2.90
100

Juniarti U, Abdulah L. 2011. The Deforestation and forest degradation in Lombok Island, Indonesia: causes and consequences. KIPCCF Report. Bogor Agricultural University.
Nye PH, Greenland DJ. 1960. The Soil under Shifting Cultivation. Commonwealth Agricultural Bureaux, Central Sales, Farnham Royal, Bucks, England.
Rahman MM, Csaplovics E, Koch B, Kohl M. 2004. Interpretation of tropical vegetation using landsat etm+ imagery. Bangladesh Space Research and Remote Sensing Organization (SPARRSO). [15 September 2017]
Rasul G, Thapa GB. 2003. Shifting cultivation in the mountains of South and Southeast Asia: Regional pattern and factor influencing the change. Land Degradation and Development. Research Gate Journal 14:495−508.
Read L, Lawrence D. 2003. Recovery of biomass following shifting cultivation in dry tropical forests of The Yucatan. Ecological Applications 13(1):85–97. https://doi.org/10. 1890/1051-0761(2003)013[0085:ROBFSC]2.0.CO;2.
Setiawan H, Jaya INS, Puspaningsih N. 2015. Deforestation spatial model in North Konawe and Konawe Districts South East Sulawesi Province. Media Konservasi 20(2):166−176.
Silori CS. 2006. Perception of local people towards conservation of forest resources in Nanda Devi Biosphere Reserve, north-western Himalaya, India. Biodiversity Conservation 16:211–222. https://doi.org/10.1007/ s10531-006-9116-8.
SMERU. 2017. Indonesia Poverty and Livelihood Map. Jakarta: The SMERU Research Institute. [3 January 2017].
Spearman C. 1904. The Proof and Measurement of Association between Two Things. The American Journal of Psychology 15(1):72−101. https://doi.org/10.2307/ 1412159.
Sulistiyono N, Jaya INS, Prasetyo LB, Tiryana T. 2013. Detection of deforestation using low resolution satellite images in the Islands of Sumatra 2000−2012. International Journal of Sciences: Basic and Applied Research 24(1):350−366.
Sunderlin WD, Resosudarmo IAP. 1996. Rate and Causes of Deforestation in Indonesia: Towards A Resolution of TheAmbiguities. Bogor: CIFOR. https://doi.org/10.17528/ cifor/000056.
Swinton SM, Quiroz R. 2003. Is poverty to blame for soil, pasture and forest degradation in Peru's Altiplano? World Development 2003. Published by Elsevier Ltd. https://doi.org/10.1016/j.worlddev.2003.06.004.
Taena W, Rustiadi E, Hariyoga H. 2010. Development of boundary area of Timor Tengah Utara Regency and Oekusi enclave district as agropolitan region. Forum Pascasarjana 33(1):35−53.
Treves LN, Garcia JA, Chapman CA. 2011. Lessons about parks and poverty from a decade of forest loss and economic growth around Kibale National Park, Uganda. Proceedings of the National Academy of Sciences 108(34):13919–13924. https://doi.org/10.1073/pnas. 1013332108.
Turner II, Meyer WB, Skole DL. 2009. Global Land-Use/Land-Cover Change: Towards an Integrated Study. Ambio 23(1):91−95.
Vodouhe FG, Coulibaly O, Adegbidi A Sinsin B. 2010. Community perception of biodiversity conservation within protected areas in Benin. Forest Policy and Economics 12:505−512. https://doi.org/10.1016/j.forpol. 2010.06.008.
Weeks JR, Larson DP, Fugate DL. 2005. Patterns of Urban Land Use as Assessed by Satellite Imagery: An Application to Cairo, Egypt. National Research Council. 2005. Population, Land Use, and Environment: Research Directions. Washington, DC: The National Academies Press.
Williams M. 2000. Dark ages and dark areas: global deforestation in the deep past. Journal of Historical Geography 26(1):28–46. https://doi.org/10.1006/jhge. 1999.0189.
Xiao J, Shen Y, Ge J, Tateishi R, Tang C, Liang Y, Huang Z. 2006. Evaluating urban expansion and landuse change in Shijiazhuang, China, by using GIS and Remote Sensing. Lanscape and Urban Planning 75:69−80. https://doi.org/ 10.1016/j.landurbplan.2004.12.005.
Yangchan J, Jain AK, Tiwari AK. 2014. Spatial changing pattern in land use/land cover using GIS: a case study of Sukhna choe watershed. India International Journal of Scientific & Engineering Research 5(10):1395−1400.
Yuniandra F, Kusmana C, Nurrochmat DR. 2007. Policy formulation of collaborative forest managament in the mount Ciremai national park. Jurnal Manajemen Hutan Tropika 13(3):146−154.
Scientific Article
ISSN: 2087-0469
Jurnal Manajemen Hutan Tropika Vol. 23, (2): 90-101, August 2017
EISSN: 2089-2063
DOI: 10.7226/jtfm.23.2.90
101